Special Report GFR Decline as an End Point for Clinical Trials in CKD: A Scientific Workshop Sponsored by the National Kidney Foundation and the US Food and Drug Administration Andrew S. Levey, MD, 1 Lesley A. Inker, MD, MS, 1 Kunihiro Matsushita, MD, PhD, 2 Tom Greene, PhD, 3 Kerry Willis, PhD, 4 Edmund Lewis, MD, 5 Dick de Zeeuw, MD, PhD, 6 Alfred K. Cheung, MD, 7 and Josef Coresh, MD, PhD 2 The US Food and Drug Administration currently accepts halving of glomerular filtration rate (GFR), assessed as doubling of serum creatinine level, as a surrogate end point for the development of kidney failure in clinical trials of kidney disease progression. A doubling of serum creatinine level generally is a late event in chronic kidney disease (CKD); thus, there is great interest in considering alternative end points for clinical trials to shorten their duration, reduce sample size, and extend their conduct to patients with earlier stages of CKD. However, the relationship between lesser declines in GFR and the subsequent development of kidney failure has not been well characterized. The National Kidney Foundation and Food and Drug Administration spon- sored a scientific workshop to critically examine available data to determine whether alternative GFR-based end points have sufficiently strong relationships with important clinical outcomes of CKD to be used in clin- ical trials. Based on a series of meta-analyses of cohorts and clinical trials and simulations of trial designs and analytic methods, the workshop concluded that a confirmed decline in estimated GFR of 30% over 2 to 3 years may be an acceptable surrogate end point in some circumstances, but the pattern of treatment effects on GFR must be examined, specifically acute effects on estimated GFR. An estimated GFR decline of 40% may be more broadly acceptable than a 30% decline across a wider range of baseline GFRs and patterns of treatment effects on GFR. However, there are other circumstances in which these end points could lead to a reduction in statistical power or erroneous conclusions regarding benefits or harms of interventions. We encourage careful consideration of these alternative end points in the design of future clinical trials. Am J Kidney Dis. 64(6):821-835. ª 2014 by the National Kidney Foundation, Inc. INDEX WORDS: Kidney end point; renal end point; kidney disease outcome; surrogate end point; biomarker; chronic kidney disease (CKD); estimated glomerular filtration rate (eGFR) decline; eGFR trajectory; renal function; serum creatinine; kidney disease progression; end-stage renal disease (ESRD). C hronic kidney disease (CKD) is a significant public health problem in the United States and around the world, but the progression of CKD often is slow and there are few specific symptoms until the stage of kidney failure has been reached. How does one practically develop drugs when the beneficial effects of treatment of direct interest to patients are not expected to manifest for many years? In some settings, a change in a biomarker level is considered a reliable predictor of later clinical outcomes. In the setting of CKD, a sufficiently large change in glomerular filtration rate (GFR) has been considered such a surrogate end point. Accordingly, the US Food and Drug Administration (FDA) accepts halving of GFR, assessed as doubling of serum creati- nine level, as an end point for clinical trials of kidney disease progression because it represents a marked loss of kidney function and is expected to be highly predic- tive of the development of kidney failure. However, a doubling of serum creatinine level also is a late event in CKD, requiring long durations of follow-up and large sample sizes in clinical trials. Thus, there is great interest in alternative GFR-based end points to shorten the duration of clinical trials, reduce sample sizes, and extend their conduct to patients with earlier stages of CKD. However, there is uncertainty about the associations of lesser declines in GFR with the subse- quent development of kidney failure. On December 2 to 3, 2012, the National Kidney Foundation (NKF) and FDA cosponsored a scientific From the 1 Division of Nephrology, Tufts Medical Center, Boston, MA; 2 Johns Hopkins Bloomberg School of Public Health, Baltimore, MD; 3 Division of Epidemiology, University of Utah, Salt Lake City, UT; 4 National Kidney Foundation, New York, NY; 5 Rush University Medical Center, Chicago, IL; 6 Department of Clinical Pharmacy & Pharmacology, University of Groningen, University Medical Center Groningen, Groningen, the Netherlands; and 7 Division of Nephrology & Hypertension, Uni- versity of Utah, Salt Lake City, UT. Received May 23, 2014. Accepted in revised form July 29, 2014. Originally published online October 15, 2014. Because an author of this article is an editor for AJKD, the peer- review and decision-making processes were handled entirely by an Associate Editor (Mark M. Mitsnefes, MD) who served as Acting Editor-in-Chief. Details of the journal’s procedures for potential editor conflicts are given in the Information for Authors & Editorial Policies. Address correspondence to Andrew S. Levey, MD, William B. Schwartz Division of Nephrology, Tufts Medical Center Box 391, 800 Washington St, Boston, MA 02129. E-mail: alevey@ tuftsmedicalcenter.org Ó 2014 by the National Kidney Foundation, Inc. 0272-6386/$36.00 http://dx.doi.org/10.1053/j.ajkd.2014.07.030 Special Section: GFR Decline as an End Point for Clinical Trials in CKD Am J Kidney Dis. 2014;64(6):821-835 821
Transcript
Special Section: GFR Decline as an End Point for Clinical Trials in CKD
Special Report
Am J Kidne
GFR Decline as an End Point for Clinical Trials in CKD:A Scientific Workshop Sponsored by the National KidneyFoundation and the US Food and Drug Administration
Andrew S. Levey, MD,1 Lesley A. Inker, MD, MS,1 Kunihiro Matsushita, MD, PhD,2
Tom Greene, PhD,3 Kerry Willis, PhD,4 Edmund Lewis, MD,5
Dick de Zeeuw, MD, PhD,6 Alfred K. Cheung, MD,7 and Josef Coresh, MD, PhD2
The US Food and Drug Administration currently accepts halving of glomerular filtration rate (GFR),
assessed as doubling of serum creatinine level, as a surrogate end point for the development of kidney failure
in clinical trials of kidney disease progression. A doubling of serum creatinine level generally is a late event in
chronic kidney disease (CKD); thus, there is great interest in considering alternative end points for clinical trials
to shorten their duration, reduce sample size, and extend their conduct to patients with earlier stages of CKD.
However, the relationship between lesser declines in GFR and the subsequent development of kidney failure
has not been well characterized. The National Kidney Foundation and Food and Drug Administration spon-
sored a scientific workshop to critically examine available data to determine whether alternative GFR-based
end points have sufficiently strong relationships with important clinical outcomes of CKD to be used in clin-
ical trials. Based on a series of meta-analyses of cohorts and clinical trials and simulations of trial designs and
analytic methods, the workshop concluded that a confirmed decline in estimated GFR of 30% over 2 to 3 years
may be an acceptable surrogate end point in some circumstances, but the pattern of treatment effects on GFR
must be examined, specifically acute effects on estimated GFR. An estimated GFR decline of 40% may be
more broadly acceptable than a 30% decline across a wider range of baseline GFRs and patterns of treatment
effects on GFR. However, there are other circumstances in which these end points could lead to a reduction in
statistical power or erroneous conclusions regarding benefits or harms of interventions. We encourage careful
consideration of these alternative end points in the design of future clinical trials.
Am J Kidney Dis. 64(6):821-835. ª 2014 by the National Kidney Foundation, Inc.
INDEX WORDS: Kidney end point; renal end point; kidney disease outcome; surrogate end point; biomarker;
From the 1Division of Nephrology, Tufts Medical Center,Boston, MA; 2Johns Hopkins Bloomberg School of Public Health,Baltimore, MD; 3Division of Epidemiology, University of Utah,Salt Lake City, UT; 4National Kidney Foundation, New York, NY;5Rush University Medical Center, Chicago, IL; 6Department ofClinical Pharmacy & Pharmacology, University of Groningen,University Medical Center Groningen, Groningen, theNetherlands; and 7Division of Nephrology & Hypertension, Uni-versity of Utah, Salt Lake City, UT.Received May 23, 2014. Accepted in revised form July 29, 2014.
Originally published online October 15, 2014.Because an author of this article is an editor for AJKD, the peer-
review and decision-making processes were handled entirely by anAssociate Editor (Mark M. Mitsnefes, MD) who served as ActingEditor-in-Chief. Details of the journal’s procedures for potential editorconflicts are given in the Information for Authors & Editorial Policies.Address correspondence to Andrew S. Levey, MD, William B.
Schwartz Division of Nephrology, Tufts Medical Center Box 391,800 Washington St, Boston, MA 02129. E-mail: [email protected]� 2014 by the National Kidney Foundation, Inc.0272-6386/$36.00http://dx.doi.org/10.1053/j.ajkd.2014.07.030
Chronic kidney disease (CKD) is a significantpublic health problem in the United States and
around the world, but the progression of CKD often isslow and there are few specific symptoms until the stageof kidney failure has been reached. How does onepractically develop drugs when the beneficial effects oftreatment of direct interest to patients are not expected tomanifest for many years? In some settings, a change in abiomarker level is considered a reliable predictor of laterclinical outcomes. In the setting of CKD, a sufficientlylarge change in glomerularfiltration rate (GFR) has beenconsidered such a surrogate end point. Accordingly, theUS Food and Drug Administration (FDA) acceptshalving of GFR, assessed as doubling of serum creati-nine level, as an end point for clinical trials of kidneydisease progression because it represents a marked lossof kidney function and is expected to be highly predic-tive of the development of kidney failure. However, adoubling of serum creatinine level also is a late event inCKD, requiring long durations of follow-up and largesample sizes in clinical trials. Thus, there is great interestin alternative GFR-based end points to shorten theduration of clinical trials, reduce sample sizes, andextend their conduct to patients with earlier stagesof CKD. However, there is uncertainty about the
y Dis. 2014;64(6):821-835
associations of lesser declines in GFR with the subse-quent development of kidney failure.On December 2 to 3, 2012, the National Kidney
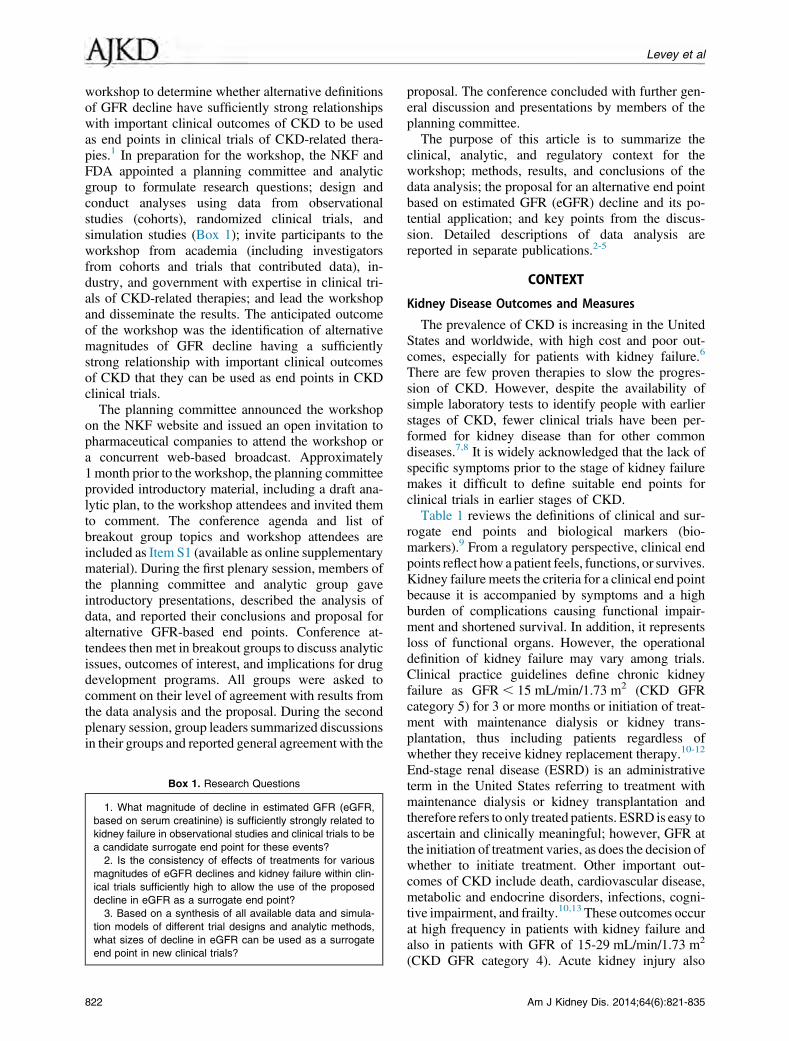
workshop to determine whether alternative definitionsof GFR decline have sufficiently strong relationshipswith important clinical outcomes of CKD to be usedas end points in clinical trials of CKD-related thera-pies.1 In preparation for the workshop, the NKF andFDA appointed a planning committee and analyticgroup to formulate research questions; design andconduct analyses using data from observationalstudies (cohorts), randomized clinical trials, andsimulation studies (Box 1); invite participants to theworkshop from academia (including investigatorsfrom cohorts and trials that contributed data), in-dustry, and government with expertise in clinical tri-als of CKD-related therapies; and lead the workshopand disseminate the results. The anticipated outcomeof the workshop was the identification of alternativemagnitudes of GFR decline having a sufficientlystrong relationship with important clinical outcomesof CKD that they can be used as end points in CKDclinical trials.The planning committee announced the workshop
on the NKF website and issued an open invitation topharmaceutical companies to attend the workshop ora concurrent web-based broadcast. Approximately1month prior to the workshop, the planning committeeprovided introductory material, including a draft ana-lytic plan, to the workshop attendees and invited themto comment. The conference agenda and list ofbreakout group topics and workshop attendees areincluded as Item S1 (available as online supplementarymaterial). During the first plenary session, members ofthe planning committee and analytic group gaveintroductory presentations, described the analysis ofdata, and reported their conclusions and proposal foralternative GFR-based end points. Conference at-tendees then met in breakout groups to discuss analyticissues, outcomes of interest, and implications for drugdevelopment programs. All groups were asked tocomment on their level of agreement with results fromthe data analysis and the proposal. During the secondplenary session, group leaders summarized discussionsin their groups and reported general agreement with the
Box 1. Research Questions
1. What magnitude of decline in estimated GFR (eGFR,
based on serum creatinine) is sufficiently strongly related to
kidney failure in observational studies and clinical trials to be
a candidate surrogate end point for these events?
2. Is the consistency of effects of treatments for various
magnitudes of eGFR declines and kidney failure within clin-
ical trials sufficiently high to allow the use of the proposed
decline in eGFR as a surrogate end point?
3. Based on a synthesis of all available data and simula-
tion models of different trial designs and analytic methods,
what sizes of decline in eGFR can be used as a surrogate
end point in new clinical trials?
822
proposal. The conference concluded with further gen-eral discussion and presentations by members of theplanning committee.The purpose of this article is to summarize the
clinical, analytic, and regulatory context for theworkshop; methods, results, and conclusions of thedata analysis; the proposal for an alternative end pointbased on estimated GFR (eGFR) decline and its po-tential application; and key points from the discus-sion. Detailed descriptions of data analysis arereported in separate publications.2-5
CONTEXT
Kidney Disease Outcomes and Measures
The prevalence of CKD is increasing in the UnitedStates and worldwide, with high cost and poor out-comes, especially for patients with kidney failure.6
There are few proven therapies to slow the progres-sion of CKD. However, despite the availability ofsimple laboratory tests to identify people with earlierstages of CKD, fewer clinical trials have been per-formed for kidney disease than for other commondiseases.7,8 It is widely acknowledged that the lack ofspecific symptoms prior to the stage of kidney failuremakes it difficult to define suitable end points forclinical trials in earlier stages of CKD.Table 1 reviews the definitions of clinical and sur-
rogate end points and biological markers (bio-markers).9 From a regulatory perspective, clinical endpoints reflect how a patient feels, functions, or survives.Kidney failure meets the criteria for a clinical end pointbecause it is accompanied by symptoms and a highburden of complications causing functional impair-ment and shortened survival. In addition, it representsloss of functional organs. However, the operationaldefinition of kidney failure may vary among trials.Clinical practice guidelines define chronic kidneyfailure as GFR , 15 mL/min/1.73 m2 (CKD GFRcategory 5) for 3 or more months or initiation of treat-ment with maintenance dialysis or kidney trans-plantation, thus including patients regardless ofwhether they receive kidney replacement therapy.10-12
End-stage renal disease (ESRD) is an administrativeterm in the United States referring to treatment withmaintenance dialysis or kidney transplantation andtherefore refers to only treated patients. ESRD is easy toascertain and clinically meaningful; however, GFR atthe initiation of treatment varies, as does the decision ofwhether to initiate treatment. Other important out-comes of CKD include death, cardiovascular disease,metabolic and endocrine disorders, infections, cogni-tive impairment, and frailty.10,13 These outcomes occurat high frequency in patients with kidney failure andalso in patients with GFR of 15-29 mL/min/1.73 m2
(CKD GFR category 4). Acute kidney injury also
Am J Kidney Dis. 2014;64(6):821-835
Table 1. Definitions and Applications to Clinical Trials in CKD
Definitiona Application to CKD
Clinical end point A characteristic or variable that reflects how a
patient feels, functions, or survives
Kidney failure (defined as GFR , 15 mL/min/1.73 m2)
or ESRD (defined as treatment with maintenance
dialysis or kidney transplantation)
Surrogate end point A biomarker that is intended to substitute for a
clinical end point. A surrogate end point is
expected to predict clinical benefit (or harm or
lack of benefit or harm) based on epidemiologic,
therapeutic, pathophysiologic, or other scientific
evidence
Established surrogate end point: doubling of serum
glomerular filtration rate; ESRD, end-stage renal disease.aAccording to the Biomarkers Definitions Working Group.9
GFR Decline in Clinical Trials
occurs commonly in CKD and is associated with highmorbidity and mortality.14,15
A recent international clinical practice guidelinerecommends staging the severity of kidney diseaseaccording to level of GFR and albuminuria.10 GFRdecline and albuminuria do not meet the definition ofa clinical end point, but nonetheless are importantmeasures of kidney disease. The workshop describedhere focused on GFR decline as an end point inclinical trials of CKD. The data supporting albumin-uria as a surrogate end point were reviewed at a priorNKF-FDA conference.16-18
GFR Decline in CKD
By definition, GFR decline is on the pathway tokidney failure. Numerous studies show that the rela-tionship of low eGFR with the subsequent develop-ment of kidney failure is very strong, graded,independent, and consistent across populations irre-spective of age, sex, race, presence or absence ofhypertension and diabetes, level of albuminuria, andcause of kidney disease.19-27
Glomerular filtration is the first step in the forma-tion of urine by the nephron. It is the physiologicprocess of ultrafiltration of plasma across theglomerular capillary wall, and in principle, the levelof GFR is the number of nephrons multiplied by themean single-nephron GFR. Single-nephron GFR re-flects dynamic and structural characteristics within theglomerulus and can vary according to physiologic andclinical conditions, including variation in dietaryprotein, use of antihypertensive agents, and surfeit ordeficit of extracellular fluid. In animals with certainexperimentally induced kidney diseases, single-nephronGFR in the remaining nephrons often is elevated dueto glomerular hyperfiltration and hypertrophy, and as
Am J Kidney Dis. 2014;64(6):821-835
kidney disease progresses, the decline in GFR over timerepresents the irreversible loss of nephrons. Neithersingle-nephron GFR nor nephron number can bemeasured in vivo in humans. Instead, level of GFR isaccepted as the best overall index of the level of kidneyfunction. The time until kidney failure depends on thecurrent level of GFR and the subsequent rate of GFRdecline. Thus, the rate of decline in GFR over longintervals is accepted as a measure of kidney diseaseprogression.
Effects of Interventions on GFR
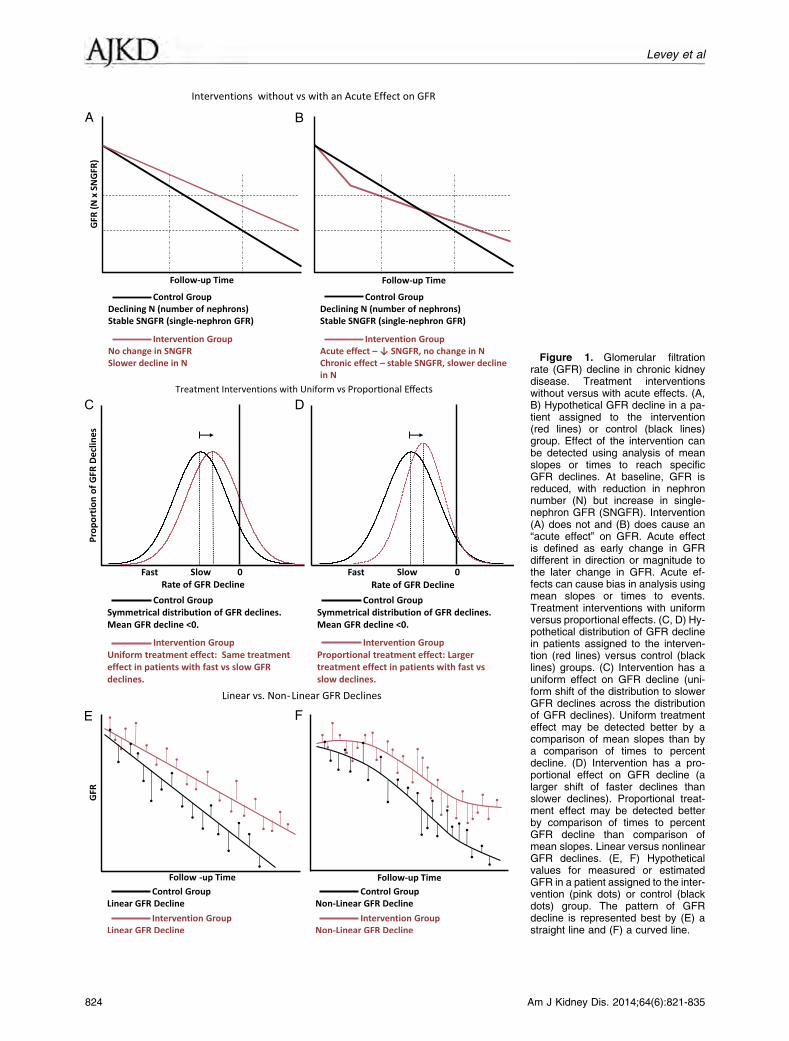
The goal of therapy is to slow the irreversible lossof functional nephrons, thereby preserving GFR leveland delaying the onset of kidney failure (Fig 1A).However, the pattern of GFR decline in response tointerventions has important implications for thedesign of clinical trials.First, interventions may lead to an acute effect on
GFR, defined as an early change in GFR different indirection or magnitude to the later change in GFR. Forexample, a low-protein diet, a low blood pressure goal,angiotensin-converting enzyme inhibitor use, andangiotensin receptor blocker use cause early reversiblechanges in single-nephron GFR opposite in direction totheir hypothesized beneficial effect of slowing the irre-versible loss of nephrons; thus, an early faster decline inGFR is followed by a later slower decline (Fig 1B).28,29
In this setting, the change in GFR in the treatment armmaynot be indicative of the irreversible loss of nephrons.Overall, acute effects onGFR complicate the design andinterpretation of GFR decline as an end point in clinicaltrials because it is difficult to determine whether earlychanges in GFR reflect the acute effects of drugs or theunderlying disease process and whether these earlychanges are reversible or irreversible.
823
Figure 1. Glomerular filtrationrate (GFR) decline in chronic kidneydisease. Treatment interventionswithout versus with acute effects. (A,B) Hypothetical GFR decline in a pa-tient assigned to the intervention(red lines) or control (black lines)group. Effect of the intervention canbe detected using analysis of meanslopes or times to reach specificGFR declines. At baseline, GFR isreduced, with reduction in nephronnumber (N) but increase in single-nephron GFR (SNGFR). Intervention(A) does not and (B) does cause an“acute effect” on GFR. Acute effectis defined as early change in GFRdifferent in direction or magnitude tothe later change in GFR. Acute ef-fects can cause bias in analysis usingmean slopes or times to events.Treatment interventions with uniformversus proportional effects. (C, D) Hy-pothetical distribution of GFR declinein patients assigned to the interven-tion (red lines) versus control (blacklines) groups. (C) Intervention has auniform effect on GFR decline (uni-form shift of the distribution to slowerGFR declines across the distributionof GFR declines). Uniform treatmenteffect may be detected better by acomparison of mean slopes than bya comparison of times to percentdecline. (D) Intervention has a pro-portional effect on GFR decline (alarger shift of faster declines thanslower declines). Proportional treat-ment effect may be detected betterby comparison of times to percentGFR decline than comparison ofmean slopes. Linear versus nonlinearGFR declines. (E, F) Hypotheticalvalues for measured or estimatedGFR in a patient assigned to the inter-vention (pink dots) or control (blackdots) group. The pattern of GFRdecline is represented best by (E) astraight line and (F) a curved line.
824 Am J Kidney Dis. 2014;64(6):821-835
Levey et al
Table 2. Alternative Surrogate End Points for Time-to-Event
Analyses
Initial
eGFR
Final eGFR
57% eGFR
Decline
40% eGFR
Decline
30% eGFR
Decline
20% eGFR
Decline
67.5 29.0 40.5 47.3 54.0
42.5 18.3 25.5 29.8 34.0
27.5 11.8 16.5 19.3 22.0
Note: Using the CKD-EPI 2009 creatinine equation, a 57%
decline in eGFR corresponds to a doubling of serum creatinine
level from a baseline of $0.9 mg/dL in men or $0.7 mg/dL in
women.37 Using the CKD-EPI 2012 cystatin C equation, a 57%
decline in eGFR corresponds to a 1.9-fold increase in serum
cystatin C level from a baseline of $0.8 mg/L in men and
women.38 A 40%, 30%, and 20% decline in eGFR corresponds
to a 1.5-fold, 1.3-fold, and 1.2-fold increase in serum creatinine
Second, the hypothesized beneficial effect of theintervention may be uniform or proportional to therate of GFR decline in the absence of treatment. Auniform treatment effect is characterized by a uniformimprovement across the distribution of GFR declines(Fig 1C), whereas a proportional treatment effect ischaracterized by a larger absolute improvement inparticipants with faster GFR declines (Fig 1D). Thepattern of treatment effect has implications for theanalysis of the comparison of treatment groups in aclinical trial. For example, a uniform treatment effectmay be detected better by a comparison of meanslopes, whereas a proportional treatment effect maybe detected better by a comparison of times elapsed toa percent GFR decline.30 Proportional treatment ef-fects have been noted in other fields in medicine,31,32
and analysis of past trials for this workshop suggeststhat a number of interventions lead to a mixture ofuniform and proportional treatment effects.5
Measurement and Estimation of GFR and GFR Decline
GFR cannot be measured directly; instead, it ismeasured indirectly as the clearance of exogenousfiltration markers (referred to as measured GFR[mGFR]) or estimated from the serum level ofendogenous filtration markers, such as creatinine orcystatin C (referred to as eGFR).33 GFR estimatingequations use the serum level of an endogenousfiltration marker and demographic and clinical vari-ables to estimate the level of mGFR. Demographicand clinical variables serve as measures for non-GFRdeterminants of the serum level; for example, age,sex, and race are related to creatinine generation bymuscle and diet. GFR estimating equations have beenderived in cross-sectional studies; in this setting, theuse of multiple data elements provides more accurateGFR estimates than using the serum level of thefiltration marker alone. In longitudinal studies,changes in the serum level of the filtration markeralone may be as accurate as changes in eGFR if thereare no changes in demographic and clinical variables.In both cross-sectional and longitudinal studies, use ofeGFR rather than serum level of the filtration markeralone enables inferences about the level of GFR andits change on the GFR scale. GFR estimating equa-tions now are widely used in clinical practice andclinical trials.Decline in mGFR or eGFR can be expressed as a
continuous or categorical variable, and randomizedgroups can be compared by computing the mean ratesof decline or times to event. It can be difficult toassess the rate of decline in GFR because of impre-cision in the measures and the possibility of nonlin-earity in GFR decline (Fig 1E and F).34,35 For anumber of reasons, many past trials have comparedthe time to reach a specified degree of GFR decline
Am J Kidney Dis. 2014;64(6):821-835
rather than the mean GFR declines (slopes) betweenrandomized groups.In general, the pattern of decline in eGFR after an
intervention is expected to mirror the pattern ofdecline in mGFR; however, interventions can affectthe non-GFR determinants of the endogenous filtra-tion markers used to estimate GFR, as well as thelevel of GFR. For example, dietary protein restrictionreduces creatinine generation, leading to an increasein eGFR but a reduction in mGFR.36 In principle,acute effects, proportional effects, and nonlinear ef-fects of interventions on eGFR could be due to theireffects on non-GFR determinants of endogenousfiltration markers in addition to their effects onmGFR.Historically, a doubling of serum creatinine level
has been used as an end point in clinical trials ofkidney disease progression. Using the CKD-EPI(CKD Epidemiology Collaboration) 2009 creatinineequation, a doubling of serum creatinine levelapproximately corresponds to a 57% decline in eGFRbased on serum creatinine level.37 Using the CKD-EPI 2012 cystatin C equation, a 57% decline ineGFR based on cystatin C level approximately cor-responds to a 1.9-fold increase in serum cystatin Clevel.38 Table 2 shows examples of baseline and finaleGFRs for a 57% eGFR decline and lesser percenteGFR declines.
Evaluation of Candidate Surrogate End Points
Before a biological marker is accepted as a surrogateend point, its validity and utility as a surrogate endpoint should be demonstrated. Candidate surrogate endpoints that do not meet these criteria may lead to
825
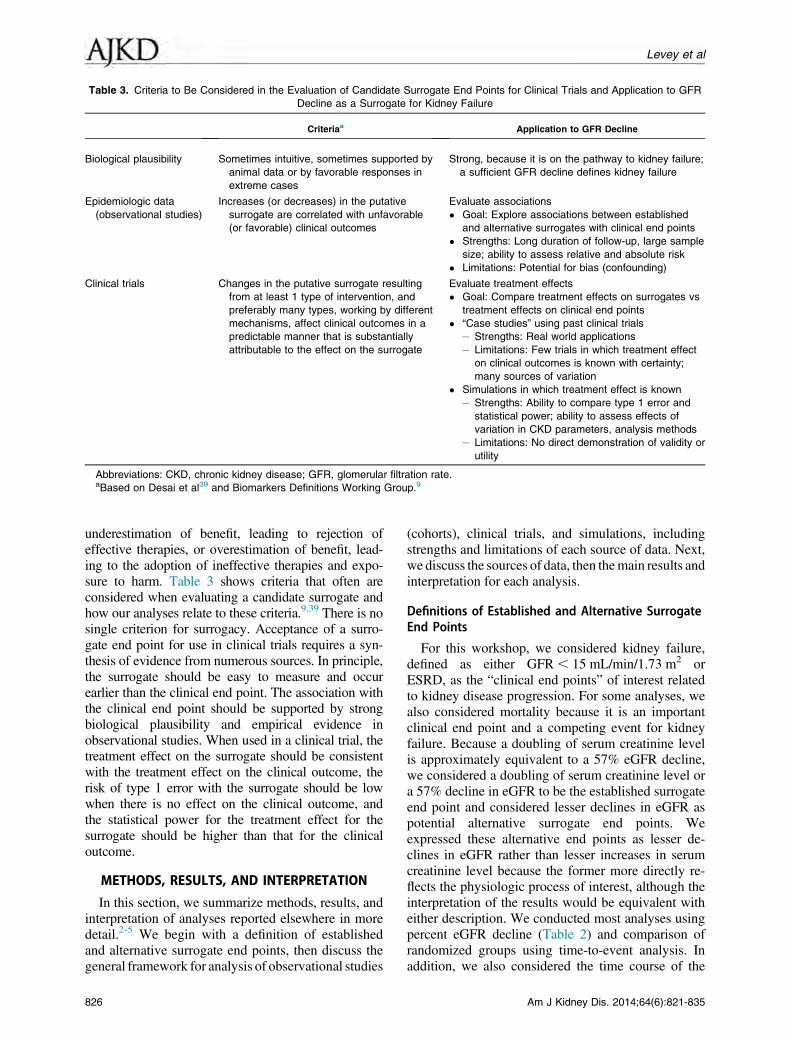
Table 3. Criteria to Be Considered in the Evaluation of Candidate Surrogate End Points for Clinical Trials and Application to GFR
Decline as a Surrogate for Kidney Failure
Criteriaa Application to GFR Decline
Biological plausibility Sometimes intuitive, sometimes supported by
animal data or by favorable responses in
extreme cases
Strong, because it is on the pathway to kidney failure;
a sufficient GFR decline defines kidney failure
Epidemiologic data
(observational studies)
Increases (or decreases) in the putative
surrogate are correlated with unfavorable
(or favorable) clinical outcomes
Evaluate associations
� Goal: Explore associations between established
and alternative surrogates with clinical end points
� Strengths: Long duration of follow-up, large sample
size; ability to assess relative and absolute risk
� Limitations: Potential for bias (confounding)
Clinical trials Changes in the putative surrogate resulting
from at least 1 type of intervention, and
preferably many types, working by different
mechanisms, affect clinical outcomes in a
predictable manner that is substantially
attributable to the effect on the surrogate
Evaluate treatment effects
� Goal: Compare treatment effects on surrogates vs
treatment effects on clinical end points
� “Case studies” using past clinical trials
– Strengths: Real world applications
– Limitations: Few trials in which treatment effect
on clinical outcomes is known with certainty;
many sources of variation
� Simulations in which treatment effect is known
– Strengths: Ability to compare type 1 error and
statistical power; ability to assess effects of
variation in CKD parameters, analysis methods
– Limitations: No direct demonstration of validity or
utility
Abbreviations: CKD, chronic kidney disease; GFR, glomerular filtration rate.aBased on Desai et al39 and Biomarkers Definitions Working Group.9
Levey et al
underestimation of benefit, leading to rejection ofeffective therapies, or overestimation of benefit, lead-ing to the adoption of ineffective therapies and expo-sure to harm. Table 3 shows criteria that often areconsidered when evaluating a candidate surrogate andhow our analyses relate to these criteria.9,39 There is nosingle criterion for surrogacy. Acceptance of a surro-gate end point for use in clinical trials requires a syn-thesis of evidence from numerous sources. In principle,the surrogate should be easy to measure and occurearlier than the clinical end point. The association withthe clinical end point should be supported by strongbiological plausibility and empirical evidence inobservational studies. When used in a clinical trial, thetreatment effect on the surrogate should be consistentwith the treatment effect on the clinical outcome, therisk of type 1 error with the surrogate should be lowwhen there is no effect on the clinical outcome, andthe statistical power for the treatment effect for thesurrogate should be higher than that for the clinicaloutcome.
METHODS, RESULTS, AND INTERPRETATION
In this section, we summarize methods, results, andinterpretation of analyses reported elsewhere in moredetail.2-5 We begin with a definition of establishedand alternative surrogate end points, then discuss thegeneral framework for analysis of observational studies
826
(cohorts), clinical trials, and simulations, includingstrengths and limitations of each source of data. Next,we discuss the sources of data, then themain results andinterpretation for each analysis.
Definitions of Established and Alternative SurrogateEnd Points
For this workshop, we considered kidney failure,defined as either GFR , 15 mL/min/1.73 m2 orESRD, as the “clinical end points” of interest relatedto kidney disease progression. For some analyses, wealso considered mortality because it is an importantclinical end point and a competing event for kidneyfailure. Because a doubling of serum creatinine levelis approximately equivalent to a 57% eGFR decline,we considered a doubling of serum creatinine level ora 57% decline in eGFR to be the established surrogateend point and considered lesser declines in eGFR aspotential alternative surrogate end points. Weexpressed these alternative end points as lesser de-clines in eGFR rather than lesser increases in serumcreatinine level because the former more directly re-flects the physiologic process of interest, although theinterpretation of the results would be equivalent witheither description. We conducted most analyses usingpercent eGFR decline (Table 2) and comparison ofrandomized groups using time-to-event analysis. Inaddition, we also considered the time course of the
Am J Kidney Dis. 2014;64(6):821-835
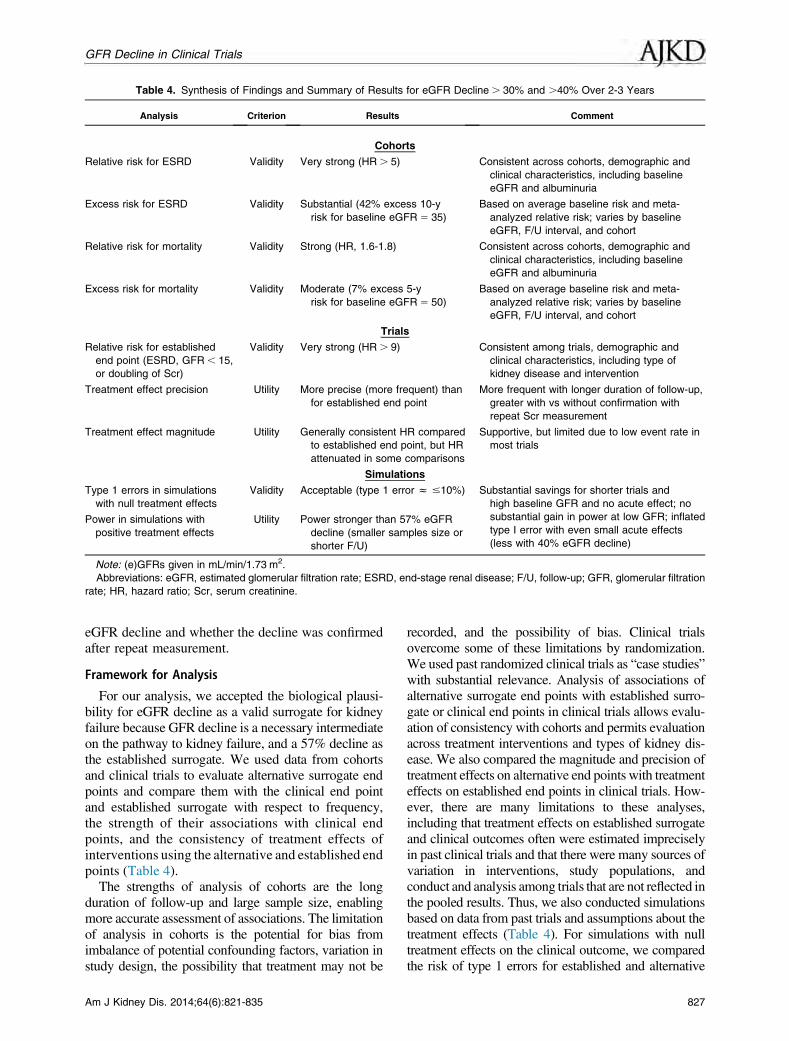
Table 4. Synthesis of Findings and Summary of Results for eGFR Decline. 30% and .40% Over 2-3 Years
Analysis Criterion Results Comment
Cohorts
Relative risk for ESRD Validity Very strong (HR. 5) Consistent across cohorts, demographic and
clinical characteristics, including baseline
eGFR and albuminuria
Excess risk for ESRD Validity Substantial (42% excess 10-y
risk for baseline eGFR5 35)
Based on average baseline risk and meta-
analyzed relative risk; varies by baseline
eGFR, F/U interval, and cohort
Relative risk for mortality Validity Strong (HR, 1.6-1.8) Consistent across cohorts, demographic and
clinical characteristics, including baseline
eGFR and albuminuria
Excess risk for mortality Validity Moderate (7% excess 5-y
risk for baseline eGFR5 50)
Based on average baseline risk and meta-
analyzed relative risk; varies by baseline
eGFR, F/U interval, and cohort
Trials
Relative risk for established
end point (ESRD, GFR , 15,
or doubling of Scr)
Validity Very strong (HR. 9) Consistent among trials, demographic and
clinical characteristics, including type of
kidney disease and intervention
Treatment effect precision Utility More precise (more frequent) than
for established end point
More frequent with longer duration of follow-up,
greater with vs without confirmation with
repeat Scr measurement
Treatment effect magnitude Utility Generally consistent HR compared
to established end point, but HR
attenuated in some comparisons
Supportive, but limited due to low event rate in
most trials
Simulations
Type 1 errors in simulations
with null treatment effects
Validity Acceptable (type 1 error z #10%) Substantial savings for shorter trials and
eGFR decline and whether the decline was confirmedafter repeat measurement.
Framework for Analysis
For our analysis, we accepted the biological plausi-bility for eGFR decline as a valid surrogate for kidneyfailure because GFR decline is a necessary intermediateon the pathway to kidney failure, and a 57% decline asthe established surrogate. We used data from cohortsand clinical trials to evaluate alternative surrogate endpoints and compare them with the clinical end pointand established surrogate with respect to frequency,the strength of their associations with clinical endpoints, and the consistency of treatment effects ofinterventions using the alternative and established endpoints (Table 4).The strengths of analysis of cohorts are the long
duration of follow-up and large sample size, enablingmore accurate assessment of associations. The limitationof analysis in cohorts is the potential for bias fromimbalance of potential confounding factors, variation instudy design, the possibility that treatment may not be
Am J Kidney Dis. 2014;64(6):821-835
recorded, and the possibility of bias. Clinical trialsovercome some of these limitations by randomization.We used past randomized clinical trials as “case studies”with substantial relevance. Analysis of associations ofalternative surrogate end points with established surro-gate or clinical end points in clinical trials allows evalu-ation of consistency with cohorts and permits evaluationacross treatment interventions and types of kidney dis-ease. We also compared the magnitude and precision oftreatment effects on alternative end points with treatmenteffects on established end points in clinical trials. How-ever, there are many limitations to these analyses,including that treatment effects on established surrogateand clinical outcomes often were estimated impreciselyin past clinical trials and that there were many sources ofvariation in interventions, study populations, andconduct and analysis among trials that are not reflected inthe pooled results. Thus, we also conducted simulationsbased on data from past trials and assumptions about thetreatment effects (Table 4). For simulations with nulltreatment effects on the clinical outcome, we comparedthe risk of type 1 errors for established and alternative
827
Table 5. Summary of Study Populations and Outcomes
surrogate end points (false-positive results lead to erro-neous conclusions for benefit and false-negative resultslead to erroneous conclusions for harm). For simulationswith beneficial treatment effects on the clinical outcome,we compared the magnitude of treatment effects andstatistical power for established and alternative surrogateend points. Although simulations cannot substitute fordirect demonstration of validity and utility, they areespecially useful to show the effects of variation in in-terventions, population characteristics, and analysismethods on these comparisons and can help explainobservations in past clinical trials.Overall, we synthesized the findings based on the
potential validity and utility of lesser versus 57%eGFR declines or doubling of serum creatinine level(Table 4). For validity of alternative surrogates, weconsidered biological plausibility, strength of associ-ations with the clinical end point in cohorts and trials,and preservation of the low risk of type 1 error insimulations. For utility of alternative surrogates, weconsidered ease of measurement, increase in fre-quency of end point events in cohorts and trials, in-crease in precision and preservation of the magnitudeof the treatment effect in clinical trials, and increase instatistical power in simulations.
Sources of Data
Table 5 shows the number of studies, participants,and outcomes for analysis of cohorts and clinicaltrials and number of parameter configurations forsimulations.
828
Data from cohorts were collected previously by theCKD Prognosis Consortium (CKD-PC). Briefly, theCKD-PC consists of cohorts from the general popu-lation, populations with high cardiovascular risk, orpopulations with CKD, with data for serum creatinineand albuminuria and 50 or more events of outcomesof interest (either mortality or kidney outcome).19-22,40 General population cohorts were derived froma systematic review of the literature conducted in2009. Cohorts with high cardiovascular risk and CKDwere identified based on consortium members’knowledge of published and unpublished data. Gen-eral population and high-risk cohorts were required tohave at least 1,000 participants. For these analyses,we included cohorts with a repeat measure of serumcreatinine during an interval of 0.5 to 3.5 years todetermine change in eGFR during a “baseline period”of 1 to 3 years and with data for clinical eventsfollowing this baseline period. Confirmation ofchanges in serum creatinine level during the baselineperiod was not required. For analyses of ESRD as anoutcome, we included 22 cohorts that were composedof 4 general population cohorts, 5 cohorts with highcardiovascular risk, and 13 cohorts predominantlycontaining people with CKD. For analysis of mor-tality as an outcome, we included 35 cohorts thatwere composed of 15 general population cohorts, 7high-risk cohorts, and 13 CKD cohorts. We per-formed analyses within each cohort and meta-analyses across cohorts. Each meta-analysis wasrestricted to cohorts with at least 10 ESRD events or
Am J Kidney Dis. 2014;64(6):821-835
Figure 2. Results in cohorts:adjusted hazard ratio (HR) of end-stagerenal disease (ESRD), prevalence, andapproximate percent population attribut-able risk (PAR) for percent change inestimated glomerular filtration rate(eGFR) during a 2-year baseline periodfor (A) baseline eGFR , 60 and(B) $60 mL/min/1.73 m2. Adjusted HRof ESRD associated with percent changein eGFR during a 2-year baseline periodin eGFR, 60 and $60 mL/min/1.73 m2
and a histogram of percent change ineGFR and approximate percent PARproportion of ESRD. Values trimmed atless than 270% change in eGFR(0.22% and 0.055% of the populationwith eGFR, 60 and $60 mL/min/1.73 m2, respectively) and .40%change in eGFR (5.9% and 0.51% ofthe population with eGFR, 60and $60 mL/min/1.73 m2, respectively).Reproduced with permission from Cor-esh et al2 with permission of the Amer-ican Medical Association.
GFR Decline in Clinical Trials
deaths and participants 18 years or older. Althoughthe high-risk and CKD cohorts were not derived froma systematic search of the literature, prior studies haveshown similar relationships between exposures andoutcomes in these cohorts as in the general populationcohorts.Data from clinical trials were collected previously by
the CKD-EPI.17,41 Briefly, systematic reviews of theliterature were performed for kidney disease random-ized controlled trials for evaluation of proteinuria as asurrogate end point in CKD in 2007 and for immuno-globulin A nephropathy in 2012. All trials had data forserum creatinine and proteinuria and at least oneoutcomeof interest (either doubling of serumcreatinineor ESRD). A total of 37 trials of 5 intervention typeswere included (renin-angiotensin system [RAS]blockade vs control, RAS blockade vs calcium channelblocker, intensive vs usual blood pressure control, low-protein vs usual-protein diet, and immunosuppressivevs other therapy). Causes of CKD were categorized asdiabetes, hypertension, lupus nephritis, membranousnephropathy, and unspecified or other. For trials thatevaluated more than one intervention, we included aseparate group for each independent treatment com-parison, such that some participants were includedmore than once. Overall, we had 43 analytical com-parisons; we performed analyses within each trial andmeta-analyses across comparisons. Although thedatabase does not include all recent trials, we thought itcontained a sufficient number of representative largeand small trials for this purpose.For simulations, a total of 20 input parameters were
modeled, including rates and distributions of eGFRdeclines, magnitudes of acute effects, patterns oflong-term treatment effect, types of study design,
Am J Kidney Dis. 2014;64(6):821-835
rates of mortality and missing data, and relationshipof eGFR to initiation of maintenance dialysis therapyor kidney transplantation. Data analysis for determi-nation of input parameters was performed for 14 trialsfrom the CKD-EPI data set (above) with at least 1year of eGFR follow-up in at least 100 participants.We considered a total of 3,060 parameter configura-tions: 1,404 parameter configurations to evaluate type1 error (assuming a null treatment effect on the clin-ical outcome) and 1,656 parameter configurations toevaluate power (assuming a beneficial treatment ef-fect on the clinical outcome). For each parameterconfiguration, we simulated 800 independent datasets, with each data set consisting of 1,000 patients,with 500 assigned to the treatment group and 500assigned to the control group. For each simulated dataset, we considered 11 outcomes, including ESRDalone and composite end points including varyingpercent eGFR declines, with or without confirmation.For each simulated data set, we applied Cox propor-tional hazards regression to estimate the treatmenteffect corresponding to each outcome while censoringmortality. We estimated the standard errors of the Coxregression coefficients both empirically, based on thevariation in the estimated coefficients across the 800simulations, and as the root mean square of themodel-based standard errors.
Results of Analysis in Cohorts and Interpretation
The main results are the comparison of the number(prevalence) of end points for lesser versus 57% eGFRdeclines during a 1-, 2-, or 3-year baseline period andthe strength of their association (hazard ratios [HRs])with subsequent outcomes (Table 4). We anticipated areciprocal relationship between the prevalence of
829
Figure 3. Results in clinical trials:ratios of established to alterativeconfirmed end points by intervention.Relationship between estimated treat-ment effects on the clinical outcome(end-stage renal disease [ESRD],glomerular filtration rate [GFR],15 mL/min/1.73 m2, or doubling ofserum creatinine level) on the verticalaxis to estimated treatment effects onthe alternative end points (on the hori-zontal axis) aggregated for the 5 inter-ventions. Treatment effects areexpressed as hazard ratios (HRs). Diag-onal line is the line of identity. Horizontaland vertical lines around each circle indi-cate the Bayesian credible intervals forthe treatment effect on the establishedand alternative end points. The colorsindicate intervention type: brown, renin-angiotensin system blockade versuscontrol (A); yellow, renin-angiotensinsystem blockade versus calcium chan-nel blocker (B); green, intensive bloodpressure control (C); blue, low-proteindiet (D); and pink, immunosuppressivetherapies (E). Estimated GFR (eGFR)decline of (top left) 40% in the overallstudy duration, (top right) 30% in theoverall study duration, (bottom left)30% at 24 months, and (bottom right)30% at 24 months. Reproduced fromInker et al3 with permission of the Na-tional Kidney Foundation.
Levey et al
eGFR declines during the baseline period and the HRsof subsequent outcomes; therefore, we used apopulation-attributable risk (PAR) method to combineboth metrics. Figure 2 shows the adjusted HR forESRD (top panel), prevalence during the baselineperiod (middle panel), and PAR (lower panel) forpercent decline in eGFR during the preceding 2-yearbaseline period in separate meta-analyses of partici-pants with first baseline eGFRs, 60 and .60 mL/min/1.73 m2 (left and right panels, respectively). In thelower-eGFR group, a 57% eGFR decline in 2 yearswas associated with a very high HR (31.4), but a cu-mulative prevalence of this outcome of only 0.7% ofparticipants in this interval. By contrast, a 30% declinewas associated with a lower although still high HR(5.3) and occurred in 10 times as many people (cu-mulative prevalence of 6.5%). The 57% eGFR declineaccounted for 11% of ESRD events (cumulative PAR),whereas a 30% eGFR decline accounted for 44% ofESRD events. Similar results were obtained in thehigher-eGFR group and for 1- and 3-year baselineperiods in both the lower- and higher-eGFR groups.Results were qualitatively consistent across studies,although heterogeneity was statistically significant.Metaregression showed no significant variation by age,diabetes status, baseline eGFR, or albuminuria. Abso-lute risk showed a similar pattern, but was influenced
830
strongly by baseline eGFR and duration of follow-upand varied more among studies than variation in HRs(Table 4). Based on these analyses, we concluded thata 30% decline over 1, 2, or 3 years is associated suf-ficiently strongly and consistently with ESRD to sup-port its use as a surrogate end point. Analyses usingmortality as the end point showed a similar pattern, butwith lower HRs, lower PAR, and lower absolute riskthan for ESRD (Table 4).
Results of Analysis in Clinical Trials and Interpretation
The main results are the comparisons of the numberof end points for lesser eGFR declines versus theestablished end point during the full duration offollow-up and during shorter intervals of 12, 18, and24 months and the treatment effects (HRs for inter-vention vs control) using these end points (Table 4).Because there were fewer ESRD end points in theclinical trials than in the cohorts, we used a compositeoutcome of ESRD, GFR , 15 mL/min/1.73 m2, ordoubling of serum creatinine level as the establishedend point for these analyses.In principle, the significance of the treatment effect
in a clinical trial reflects the magnitude of the HR andthe precision with which the treatment effect is esti-mated. Precision is related to the number of end points.For lesser eGFR declines versus the established end
Am J Kidney Dis. 2014;64(6):821-835
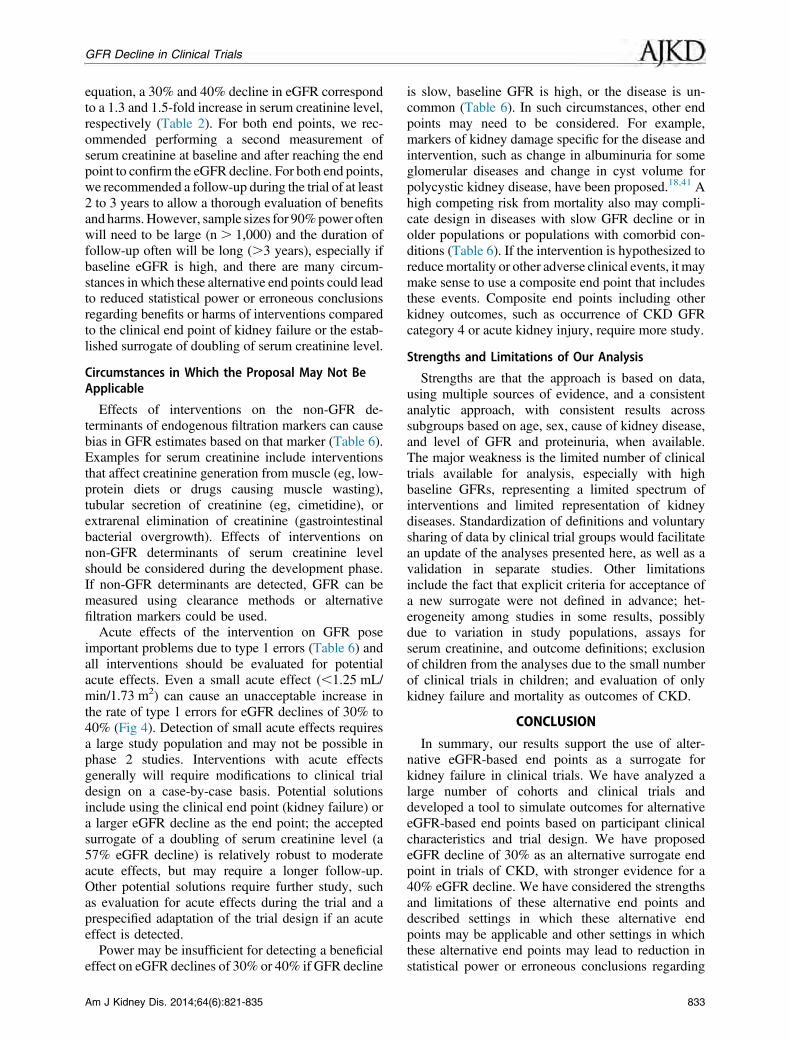
Figure 4. Results in simulations:summary of performance of alternativetime-to-event end points for trials with2- to 3-year durations of follow-up. As-sumptions: glomerular filtration rate(GFR) based on estimated GFR fromserum creatinine level, treatment effectis mixed proportional/uniform; acute ef-fect attenuates to 0 at end-stage renaldisease; follow-up duration 3 years forhigh GFR and 2 years for medium andlow GFR. Key: acceptable type 1 errorz #10%; improved power5.15%smaller samples size for lesser versus57% GFR decline in same trial duration.Baseline GFR (mL/min/1.73 m2): high,67.5; medium, 42.5; low 27.5. Acuteeffect (mL/min/1.73 m2): moderate-to-large .61.25; small, .0 to 60.5-1.25;none,z 0 (note: moderate-to-large pos-itive acute effects are extrapolated fromresults from simulations).
Acute effects
Baseline GFRhigh (Stage 2)
Baseline GFRmedium (Stage 3)
Baseline GFRlow (Stage 4)
40% decline
30%decline
40%decline
30%decline
40%decline
30%decline
Moderate-to-large nega ve
Small nega ve
None
Small posi ve
Moderate-to-large posi ve
Key
Type 1 error not acceptable
(false posi ve for benefit)
Type 1 error not acceptable
(false posi ve for harm)
Type 1 error acceptable but power
not improved
Type 1 error acceptable and
power improved
GFR Decline in Clinical Trials
point, we would anticipate a larger number of endpoints, which would lead to improved precision. If theHR for the treatment effect were maintained for lessereGFR declines versus the established end point, wewould expect that improved precision would translateinto a more significant result. However, attenuation ofthe HR would lead to less significant results whileaugmentation of the HR would lead to an even moresignificant result.As expected, for any follow-up interval during the
clinical trial, more participants reached a lesser eGFRdecline than the established end point, and more par-ticipants reached an end point during longer thanshorter follow-up intervals. Figure 3 shows the pooledratios of HRs for eGFR declines of 40% and 30%versus the established end point for each interventionduring the full duration of follow-up during the trialsand during a 24-month follow-up interval. In general,the pooled ratios of the HRs were near 1.0, indicatingsome support for the consistency of treatment effectson lesser eGFR declines versus the established endpoint. However, due to the small number ofhigh-powered trials (trials with a large number ofestablished end points), Bayesian credible intervals(analogous to confidence intervals) often were wide,particularly in trials with participants with high base-line eGFRs, precluding definitive conclusions. For 4 ofthe 5 interventions (RAS blockade vs control, RASblockade vs calcium channel blocker, intensive vsusual blood pressure control, and immunosuppressivevs other therapy), point estimates for the pooled ratiosfor the 30% eGFR decline versus the established endpoint during the same or shorter follow-up intervalswere greater than 1.0, indicating an attenuation of thetreatment effect for the 30% eGFR decline (HR closer
Am J Kidney Dis. 2014;64(6):821-835
to 1). Possible causes of attenuation of treatment ef-fects for the lesser eGFR declines for these in-terventions include: (1) acute effects of the interventionor the control in the direction opposite to the chroniceffect, (2) proportional effects of the interventionscausing larger absolute differences between treatmentgroups for larger GFR declines, or (3) random error ineGFR obscuring effects of interventions on smallereGFR declines. However, for one intervention (thelow- vs usual-protein diet), the point estimate for thepooled ratio for the 30% versus 57% eGFR declinewas less than 1.0, indicating augmentation of thetreatment effect for the lesser eGFR declines (HRfarther from 1). The cause of augmentation of thetreatment effect for lesser eGFR declines for thisintervention is an acute effect of the low-protein diet oncreatinine generation, leading to an increase in eGFRand thus a larger effect on eGFR than on mGFR. Pointestimates for ratios of HRs for 40% eGFR declineversus the established end point generally were closerto 1.0, indicating greater consistency. Use of the non-confirmed end points for lesser eGFR declines resultedin a 10% to 50% increase in the number of events overthat of the confirmed end points, but resulted in greaterattenuation of the HRs.In addition, the association of percent eGFR decline
during a 1-year baseline period with risk of subsequentoutcomes was examined using a similar analysis as forthe cohorts (above). Adjusted HRs for a 30% and 40%eGFR with the established end point were 9.6 (7.3to 12.6) and 20.3 (14.1 to 29.2), respectively. Meta-regression showed no significant variation by interven-tion or cause of CKD (Table 4).Altogether, these results provide some support for
the use of lesser eGFR declines as a surrogate end
831
Table 6. Circumstances in Which the Proposed Alternative Surrogates May Not Be Applicable and Potential Solutions and
Unanswered Questions
Circumstances Potential Solutions and Unanswered Questions
Effects of the interventions on non-GFR
determinants of serum creatinine
� Measure GFR
� Measure other filtration markers (cystatin C, others)
Acute effects of the intervention on GFR � Rely on the clinical end point (kidney failure) or require larger eGFR decline
as a surrogate; both will require longer follow-up
� Modifications to trial design on a case-by-case basis
Insufficient power, requiring long follow-up
intervals or large sample sizes
� Slow GFR decline
� High GFR (early stages of kidney disease)
� Uncommon diseases
� Consider non-GFR kidney disease end points, such as markers of kidney
damage, specific for disease and intervention
High competing risk
� Slower GFR decline
� Older population
� Comorbid conditions
� Consider composite end points including other kidney outcomes, such as
point, with stronger support for the 40% than 30%decline. Results suggest that the decision to use a lessereGFR decline as an end point depends on knowledgeof the effect of the treatment on the pattern of eGFRdecline and on the non-GFR determinants of theendogenous filtration marker used to estimate GFR.
Results of Simulations and Interpretation
The main results are the comparisons of type 1 errorrelative to the clinical outcome and power for simu-lated trials using lesser versus 57% eGFR declines asthe end point across parameter configurations(Table 4). Because there is a consistent increase in endpoint events in simulations using lesser versus 57%eGFR declines, variation in the HR is the key deter-minant in whether type 1 error is preserved and poweris improved for lesser versus 57% eGFR declines. Forsimulations in which the interventions had no effect onthe clinical outcome (simulated HR of 1), a positiveacute effect (an increase in eGFR) can lead to a type 1error in favor of treatment (HR , 1) and falseconclusion of benefit, whereas a negative acute effect(a decline in eGFR) can lead to a type 1 error againsttreatment (HR . 1) and a false conclusion of harm.Some increase in type 1 error of a surrogate relative tothe clinical outcome beyond the targeted 5% is un-avoidable, reflecting the inherent uncertainty in the useof surrogate end points, but excessive increases signifypoor validity. For simplicity, we label a type 1 error ofthe surrogate as “acceptable” if it remains ,10%,recognizing that this will vary depending on contextand may differ between false conclusions of treatmentbenefit and of treatment harm. The type 1 error rate washigher with larger versus smaller acute effects. Thetype 1 error rate remained ,10% for a wide range ofacute effects for the 57% eGFR decline, but it washigher for moderate to large acute effects (.1.25 mL/
832
min/1.73 m2) for a 40% eGFR decline and for smallacute effects (,1.25 mL/min/1.73 m2) for a 30%eGFR decline. For simulations in which the in-terventions had a beneficial effect on the clinicaloutcome (HR , 1), preservation of HR and improve-ment in power were better for lesser versus 57% eGFRdeclines for smaller versus larger acute effects, forhigher versus lower baseline eGFRs, and for shorterversus longer trials. Figure 4 shows a synthesis of re-sults regarding type 1 error and power for short trialsusing 30% and 40% versus 57% eGFR declines, ac-cording to the magnitude of acute effects and baselineeGFR. Type 1 error rate is acceptable and power isimproved for both the 30% and 40% eGFR declines inthe absence of acute effects (green shading). However,even small acute effects, either in the opposite direc-tion to the hypothesized beneficial effect of the inter-vention (yellow shading) or in the same direction (redshading), can lead to erroneous conclusions of benefitor harm. The 40% eGFR decline is acceptable across awider range of acute effects than the 30% eGFRdecline and in many simulations provides almost asmuch improvement in statistical power as the 30%eGFR decline.
RECOMMENDATIONS
The Proposal
Based on these results, the planning committee andanalytic group proposed and the workshop participantsagreed that under some circumstances, a GFR declineof 30% could be a valid and useful surrogate end pointfor progression to kidney failure in clinical trials ofCKD (Table 4). Evidence was stronger for a GFRdecline of 40% as the end point, which represents amore cautious approach and is likely to be more widelyapplicable (Fig 4). Using the CKD-EPI 2009 creatinine
Am J Kidney Dis. 2014;64(6):821-835
GFR Decline in Clinical Trials
equation, a 30% and 40% decline in eGFR correspondto a 1.3 and 1.5-fold increase in serum creatinine level,respectively (Table 2). For both end points, we rec-ommended performing a second measurement ofserum creatinine at baseline and after reaching the endpoint to confirm the eGFR decline. For both end points,we recommended a follow-up during the trial of at least2 to 3 years to allow a thorough evaluation of benefitsand harms.However, sample sizes for 90%power oftenwill need to be large (n . 1,000) and the duration offollow-up often will be long (.3 years), especially ifbaseline eGFR is high, and there are many circum-stances in which these alternative end points could leadto reduced statistical power or erroneous conclusionsregarding benefits or harms of interventions comparedto the clinical end point of kidney failure or the estab-lished surrogate of doubling of serum creatinine level.
Circumstances in Which the Proposal May Not BeApplicable
Effects of interventions on the non-GFR de-terminants of endogenous filtration markers can causebias in GFR estimates based on that marker (Table 6).Examples for serum creatinine include interventionsthat affect creatinine generation from muscle (eg, low-protein diets or drugs causing muscle wasting),tubular secretion of creatinine (eg, cimetidine), orextrarenal elimination of creatinine (gastrointestinalbacterial overgrowth). Effects of interventions onnon-GFR determinants of serum creatinine levelshould be considered during the development phase.If non-GFR determinants are detected, GFR can bemeasured using clearance methods or alternativefiltration markers could be used.Acute effects of the intervention on GFR pose
important problems due to type 1 errors (Table 6) andall interventions should be evaluated for potentialacute effects. Even a small acute effect (,1.25 mL/min/1.73 m2) can cause an unacceptable increase inthe rate of type 1 errors for eGFR declines of 30% to40% (Fig 4). Detection of small acute effects requiresa large study population and may not be possible inphase 2 studies. Interventions with acute effectsgenerally will require modifications to clinical trialdesign on a case-by-case basis. Potential solutionsinclude using the clinical end point (kidney failure) ora larger eGFR decline as the end point; the acceptedsurrogate of a doubling of serum creatinine level (a57% eGFR decline) is relatively robust to moderateacute effects, but may require a longer follow-up.Other potential solutions require further study, suchas evaluation for acute effects during the trial and aprespecified adaptation of the trial design if an acuteeffect is detected.Power may be insufficient for detecting a beneficial
effect on eGFR declines of 30% or 40% if GFR decline
Am J Kidney Dis. 2014;64(6):821-835
is slow, baseline GFR is high, or the disease is un-common (Table 6). In such circumstances, other endpoints may need to be considered. For example,markers of kidney damage specific for the disease andintervention, such as change in albuminuria for someglomerular diseases and change in cyst volume forpolycystic kidney disease, have been proposed.18,41 Ahigh competing risk from mortality also may compli-cate design in diseases with slow GFR decline or inolder populations or populations with comorbid con-ditions (Table 6). If the intervention is hypothesized toreducemortality or other adverse clinical events, it maymake sense to use a composite end point that includesthese events. Composite end points including otherkidney outcomes, such as occurrence of CKD GFRcategory 4 or acute kidney injury, require more study.
Strengths and Limitations of Our Analysis
Strengths are that the approach is based on data,using multiple sources of evidence, and a consistentanalytic approach, with consistent results acrosssubgroups based on age, sex, cause of kidney disease,and level of GFR and proteinuria, when available.The major weakness is the limited number of clinicaltrials available for analysis, especially with highbaseline GFRs, representing a limited spectrum ofinterventions and limited representation of kidneydiseases. Standardization of definitions and voluntarysharing of data by clinical trial groups would facilitatean update of the analyses presented here, as well as avalidation in separate studies. Other limitationsinclude the fact that explicit criteria for acceptance ofa new surrogate were not defined in advance; het-erogeneity among studies in some results, possiblydue to variation in study populations, assays forserum creatinine, and outcome definitions; exclusionof children from the analyses due to the small numberof clinical trials in children; and evaluation of onlykidney failure and mortality as outcomes of CKD.
CONCLUSION
In summary, our results support the use of alter-native eGFR-based end points as a surrogate forkidney failure in clinical trials. We have analyzed alarge number of cohorts and clinical trials anddeveloped a tool to simulate outcomes for alternativeeGFR-based end points based on participant clinicalcharacteristics and trial design. We have proposedeGFR decline of 30% as an alternative surrogate endpoint in trials of CKD, with stronger evidence for a40% eGFR decline. We have considered the strengthsand limitations of these alternative end points anddescribed settings in which these alternative endpoints may be applicable and other settings in whichthese alternative end points may lead to reduction instatistical power or erroneous conclusions regarding
833
Levey et al
benefits or harms of interventions. We encouragecareful consideration of these alternative end points inthe design of future clinical trials.
ACKNOWLEDGEMENTSThe workshop planning committee comprised Andrew S.
Levey, MD (chair), Aliza M. Thompson, MD (FDA; co-chair),Josef Coresh, MD, PhD, Kerry Willis, PhD (NKF), NormanStockbridge, MD, PhD (FDA), Edmund Lewis, MD, Dick deZeeuw, MD, PhD, and Alfred K. Cheung, MD. The analyticalgroup was chaired by Josef Coresh, MD, PhD, and comprised theobservational studies subgroup (Kunihiro Matsushita, MD, PhD[lead], Josef Coresh, MD, PhD, Mark Woodward, PhD, MorganGrams, MD, MS, Yingying Sang, MS, and Shoshana Ballew,PhD), the randomized trials subgroup (Lesley A. Inker, MD, MS[lead], Christopher H. Schmid, PhD, Andrew S. Levey, MD,Hocine Tighiouart, MS, Hasi Mondal, MPH, Tonya Logvinenko,PhD, Farzad Noubary, PhD, Cassandra Becker, BS, Neal Shah,MD, Hiddo Lambers-Heerspink, PharmD, PhD, and Tom Greene,PhD), and the clinical trial simulations subgroup (Tom Greene,PhD [lead], Chia-Chen Teng, MS, Jian Ying, PhD, Andrew Redd,PhD, Mark Woodward, PhD, Lesley A. Inker, MD, MS, JosefCoresh, MD, PhD, and Andrew S. Levey, MD). John Lawrence,PhD, served as FDA representative. Breakout group discussionleaders comprised Glenn Chertow, MD, MPH (Stanford), Kai-Uwe Eckardt, MD (University of Erlangen-Nürnberg), MichaelFlessner, MD, PhD (National Institute of Diabetes and Digestiveand Kidney Diseases), Susan Furth, MD, PhD (Children’s Hos-pital of Philadelphia), Ron Gansevoort, MD, PhD (UniversityHospital Groningen), Brenda Hemmelgarn, MD, PhD (CalgaryFoothills Medical Center), Tazeen Jafar, MD, MPH (Aga KhanUniversity), Bert Kasiske, MD (Hennepin County Medical Cen-ter), Adeera Levin, MD (St. Paul’s Hospital/UBC), Julia Lewis,MD (Vanderbilt University), Vlado Perkovic, MD, PhD (TheGeorge Institute), Ron Perrone, MD (Tufts Medical Center),Michael Shlipak, MD, MPH (San Francisco Veterans AffairsMedical Center), Ravi Thadhani, MD, MPH (MassachusettsGeneral Hospital & Harvard University), Marcello Tonelli, MD(University of Alberta), and Christoph Wanner, MD (UniversityHospital of Würzburg).The participating CKD-PC cohort investigators/collaborators
are listed in Item S2. The participating CKD-EPI clinical trials/collaborators are listed in Item S3.We thank Tom Manley for assisting in the facilitation of the
workshop and Aghogho Okparavero, MD, MPH, for assisting inpreparation of the manuscript.Elements of this article were presented in abstract form at the
meeting of the American Society of Nephrology, November 5-10,2013, in Atlanta, GA.Support: The workshop was supported and facilitated by the
NKF. NKF gratefully acknowledges Abbott, Amgen, Chemo-Centryx, Lilly, Mitsubishi Tanabe Pharma, Novartis, Pfizer, Reata,Sanofi, and Takeda, which provided grants to the NKF to supportthe workshop and the related publications.Financial Disclosure: Dr Cheung reports receiving consulting
fees fromBaxter andAmgen, speaking fees fromMerck, and royaltiesfrom contributions to Up-to-Date. Dr Coresh reports receiving aresearch grant from Amgen during the past 3 years. Dr de Zeeuwreports receiving funds to his institution from consultant agreementswith Astra Zeneca, Amgen, Abbott, MSD, BMS, Novartis, VITAE,Takeda, Hemocuem, J&J, REATA, Abbott, Astellas, Abbvie, andChemocentryx. Dr Greene reports receiving research grants fromPharmalinkAB, Jansen Pharmaceuticals, KeryxBiopharmaceuticals,and Genkyotex SA. Dr Inker reports receiving research grants fromPharmalinkAB andGilead Sciences and a consulting agreement with
834
Otsuka. Dr Levey reports funding to Tufts Medical Center forresearch and contracts with the National Institutes of Health, NKF,Amgen, Pharmalink AB, and Gilead Sciences. Dr Matsushita reportsreceiving an honorarium from Mitsubishi Tanabe Pharm. Drs Lewisand Willis report that they have no relevant financial interests.
SUPPLEMENTARY MATERIAL
Item S1: Conference agenda, list of breakout group topics, andworkshop attendees.Item S2: List of participating CKD Prognosis Consortium in-
vestigators/collaborators.Item S3: List of participating CKD-EPI clinical trials/
collaborators.Note: The supplementary material accompanying this article
(http://dx.doi.org/10.1053/j.ajkd.2014.07.030) is available at www.ajkd.org
REFERENCES1. National Kidney Foundation. GFR decline as an endpoint in
clinical trials for CKD. 2012. http://www.kidney.org/professionals/research/research_info.cfm. Accessed November 26, 2013.
2. Coresh J, Turin TC, Matsushita K, et al. Decline in estimatedglomerular filtration rate and subsequent risk of end-stage renaldisease and mortality. JAMA. 2014;311(24):2518-2531.
3. Inker LA, Lambers Heerspink HJ, Mondal H, et al. GFRdecline as an alternative end point to kidney failure in clinicaltrials: a meta-analysis of treatment effects from 37 randomizedtrials. Am J Kidney Dis. 2014;64(6):848-859.
4. Lambers Heerspink HJ, Tighiouart H, Sang Y, et al. GFRdecline and subsequent risk of established kidney outcomes: ameta-analysis of 37 randomized controlled trials. Am J Kidney Dis.2014;64(6):860-866.
5. Greene T, Teng C-C, Inker LA, et al. Utility and validity ofestimated GFR–based surrogate time-to-event end points in CKD:a simulation study. Am J Kidney Dis. 2014;64(6):867-879.
6. Collins AJ, Foley RN, Herzog C, et al. US Renal Data System2012 annual data report. Am J Kidney Dis. 2013;61(1)(suppl 1):e1-e480.
7. Strippoli GF, Craig JC, Schena FP. The number, quality, andcoverage of randomized controlled trials in nephrology. J Am SocNephrol. 2004;15(2):411-419.
8. Palmer SC, Sciancalepore M, Strippoli GF. Trial qualityin nephrology: how are we measuring up? Am J Kidney Dis.2011;58(3):335-337.
9. Biomarkers Definitions Working Group. Biomarkers andsurrogate endpoints: preferred definitions and conceptual frame-work. Clin Pharmacol Ther. 2001;69(3):89-95.
10. Kidney Disease: Improving Global Outcomes (KDIGO).KDIGO 2012 clinical practice guideline for the evaluation andmanagement of chronic kidney disease. Kidney Int Suppl.2013;3(1):1-150.
11. Hemmelgarn BR, James MT, Manns BJ, et al. Rates oftreated and untreated kidney failure in older vs younger adults.JAMA. 2012;307(23):2507-2515.
12. Thomas MC, Cooper ME, Shahinfar S, Brenner BM.Dialysis delayed is death prevented: a clinical perspective on theRENAAL Study. Kidney Int. 2003;63(4):1577-1579.
13. Uhlig K, Levey AS. Developing guidelines for chronickidney disease: we should include all of the outcomes. Ann InternMed. 2012;156(8):599-601.
14. Bedford M, Farmer C, Levin A, Ali T, Stevens P. Acutekidney injury and CKD: chicken or egg? Am J Kidney Dis.2012;59(4):485-491.
16. Levey AS, Cattran D, Friedman A, et al. Proteinuria as asurrogate outcome in CKD: report of a scientific workshopsponsored by the National Kidney Foundation and the US Foodand Drug Administration. Am J Kidney Dis. 2009;54(2):205-226.
17. Stoycheff N, Pandya K, Okparavero A, et al. Early changein proteinuria as a surrogate outcome in kidney disease progression:a systematic review of previous analyses and creation of a patient-level pooled dataset. Nephrol Dial Transplant. 2011;26(3):848-857.
18. Inker LA, Levey AS, Pandya K, Stoycheff N, Okparavero A,Greene T. Early change in proteinuria as a surrogate end point forkidney disease progression: an individual patient meta-analysis. Am JKidney Dis. 2014;64(1):74-85.
19. Matsushita K, van der Velde M, Astor BC, et al. Asso-ciation of estimated glomerular filtration rate and albuminuriawith all-cause and cardiovascular mortality in general populationcohorts: a collaborative meta-analysis. Lancet. 2010;375(9731):2073-2081.
20. van der Velde M, Matsushita K, Coresh J, et al. Lowerestimated glomerular filtration rate and higher albuminuria areassociated with all-cause and cardiovascular mortality. A collab-orative meta-analysis of high-risk population cohorts. Kidney Int.2011;79(12):1341-1352.
21. Gansevoort RT, Matsushita K, van der Velde M, et al.Lower estimated GFR and higher albuminuria are associated withadverse kidney outcomes. A collaborative meta-analysis of generaland high-risk population cohorts. Kidney Int. 2011;80(1):93-104.
22. Astor BC, Matsushita K, Gansevoort RT, et al. Lowerestimated glomerular filtration rate and higher albuminuria areassociated with mortality and end-stage renal disease. A collabo-rative meta-analysis of kidney disease population cohorts. KidneyInt. 2011;79(12):1331-1340.
23. Mahmoodi BK, Matsushita K, Woodward M, et al. Asso-ciations of kidney disease measures with mortality and end-stagerenal disease in individuals with and without hypertension: ameta-analysis. Lancet. 2012;380(9854):1649-1661.
24. Fox CS, Matsushita K, Woodward M, et al. Associations ofkidney disease measures with mortality and end-stage renal dis-ease in individuals with and without diabetes: a meta-analysis.Lancet. 2012;380(9854):1662-1673.
25. Hallan SI, Matsushita K, Sang Y, et al. Age and associationof kidney measures with mortality and end-stage renal disease.JAMA. 2012;308(22):2349-2360.
26. Nitsch D, Grams M, Sang Y, et al. Associations ofestimated glomerular filtration rate and albuminuria with mortalityand renal failure by sex: a meta-analysis. BMJ. 2013;346:f324.
27. Wen CP, Matsushita K, Coresh J, et al. Relative risks ofchronic kidney disease for mortality and end-stage renal diseaseacross races are similar. Kidney Int. 2014;86:819-827.
Am J Kidney Dis. 2014;64(6):821-835
28. Modification of Diet in Renal Disease Study Group;Levey AS, Beck GJ, Bosch JP, et al. Short-term effects of proteinintake, blood pressure, and antihypertensive therapy on glomerularfiltration rate in the Modification of Diet in Renal Disease Study.J Am Soc Nephrol. 1996;7(10):2097-2109.
29. Agodoa LY, Appel L, Bakris GL, et al. Effect of ramipril vsamlodipine on renal outcomes in hypertensive nephrosclerosis: arandomized controlled trial. JAMA. 2001;285(21):2719-2728.
30. Gassman JJ, Greene T, Wright JT Jr, et al. Design and statis-tical aspects of the African American Study of Kidney Disease andHypertension (AASK). J Am Soc Nephrol. 2003;14(7)(suppl 2):S154-S165.
31. Schmid CH, Lau J, McIntosh MW, Cappelleri JC. Anempirical study of the effect of the control rate as a predictor oftreatment efficacy in meta-analysis of clinical trials. Stat Med.1998;17(17):1923-1942.
32. Kent DM, Hayward RA. Limitations of applying summaryresults of clinical trials to individual patients: the need for riskstratification. JAMA. 2007;298(10):1209-1212.
33. Levey AS, Inker LA, Coresh J. GFR estimation:from physiology to public health. Am J Kidney Dis. 2014;63(5):820-834.
34. Li L, Astor BC, Lewis J, et al. Longitudinal progressiontrajectory of GFR among patients with CKD. Am J Kidney Dis.2012;59(4):504-512.
35. Heerspink HJ, Liang L, Smink P, Greene T, Parving HH,De Zeeuw D. Longitudinal eGFR trajectories in patients with type2 diabetes and nephropathy [ASN abstract FR-PO155]. J Am SocNephrol. 2012;23:404A.
36. Modification of Diet in Renal Disease Study Group;Levey AS, Bosch JP, Coggins CH, et al. Effects of diet andantihypertensive therapy on creatinine clearance and serumcreatinine concentration in the Modification of Diet in RenalDisease Study. J Am Soc Nephrol. 1996;7(4):556-566.
37. Levey AS, Stevens LA, Schmid CH, et al. A new equation toestimate glomerular filtration rate. Ann Intern Med. 2009;150(9):604-612.
38. Inker LA, Schmid CH, Tighiouart H, et al. Estimatingglomerular filtration rate from serum creatinine and cystatin C.N Engl J Med. 2012;367(1):20-29.
39. Desai M, Stockbridge N, Temple R. Blood pressure as anexample of a biomarker that functions as a surrogate. AAPS J.2006;8(1):E146-E152.
40. Matsushita K, Mahmoodi BK, Woodward M, et al. Com-parison of risk prediction using the CKD-EPI equation and theMDRD Study equation for estimated glomerular filtration rate.JAMA. 2012;307(18):1941-1951.
41. Chapman AB, Bost JE, Torres VE, et al. Kidney volumeand functional outcomes in autosomal dominant polycystic kidneydisease. Clin J Am Soc Nephrol. 2012;7(3):479-486.