58
GHANA ECOBANK DCA GUARANTEE EVALUATION

GHANA ECOBANK DCA GUARANTEE
EVALUATION

GHANA ECOBANK DCA GUARANTEE
EVALUATION
MARCH 25, 2008
This publication was produced for review by the United States Agency for International Development. It was
prepared by SEGURA/IP3 Partners LLC under SEGIR Global Business, Trade and Investment II – IQC Indefinite
Quantity Contract, Number EEM-I-00-07-00001-00 Task Order # 04, Development Credit Authority Evaluation.
DISCLAIMER The views expressed in this publication do not necessarily reflect the views of the United States Agency for
International Development or the United States Government.
On the Cover: Street vendors in Accra, Ghana. Photo by SEGURA IP3 Partners LLC.

Ghana EcoBank DCA Guarantee Evaluation ii
TABLE OF CONTENTS
TABLE OF FIGURES ................................................................................................................................. iii
TABLE OF TABLES ................................................................................................................................... iii
ACKNOWLEDGEMENTS ......................................................................................................................... iv
ACRONYMS ................................................................................................................................................ v
I. EXECUTIVE SUMMARY ......................................................................................................................... 1 EVALUATION OBJECTIVES ........................................................................................................................ 2 EVALUATION METHODOLOGY ............................................................................................................... 2 KEY FINDINGS AND CONCLUSIONS ....................................................................................................... 2
II. INTRODUCTION ................................................................................................................................... 5
III. THE DEVELOPMENT PROBLEM AND USAID’S RESPONSE ........................................................ 9 PROBLEM STATEMENT .............................................................................................................................. 9 USAID’S INTERVENTION IN RESPONSE .................................................................................................... 9
IV. PURPOSE OF THE EVALUATION ................................................................................................... 11
V. METHODOLOGY AND INDICATORS ............................................................................................. 12 DATA LIMITATIONS ................................................................................................................................ 13
VI. EXOGENOUS INFLUENCES ON GUARANTEE PERFORMANCE .............................................. 14
VII. FINDINGS AND CONCLUSIONS ................................................................................................... 15 OUTPUT LEVEL FINDINGS AND CONCLUSIONS ................................................................................... 15
FINDINGS AND CONCLUSIONS FOR QUESTION 1 ........................................................................... 15 FINDINGS AND CONCLUSIONS FOR QUESTION 2 ........................................................................... 17 FINDINGS AND CONCLUSIONS FOR QUESTION 3 ........................................................................... 17
OUTCOME LEVEL FINDINGS AND CONCLUSIONS ............................................................................... 21 FINDINGS AND CONCLUSIONS FOR QUESTION 4 ........................................................................... 21 FINDINGS AND CONCLUSIONS FOR QUESTION 5 ........................................................................... 24
IMPACT LEVEL FINDINGS AND CONCLUSIONS .................................................................................... 25 FINDINGS AND CONCLUSIONS FOR QUESTION 6 ........................................................................... 25 FINDINGS AND CONCLUSIONS FOR QUESTION 7 ........................................................................... 28
VIII. SUMMARY OF CONCLUSIONS ..................................................................................................... 29 OUTPUT CONCLUSIONS ....................................................................................................................... 29 OUTCOME CONCLUSIONS .................................................................................................................... 29 IMPACT CONCLUSIONS ......................................................................................................................... 29
BIBLIOGRAPHY ....................................................................................................................................... 30
ANNEXES .................................................................................................................................................. 31 Annex A - Evaluation Framework and Interview Guides ............................................................................... 31
GHANA ECOBANK DCA EVALUATION FRAMEWORK ...................................................................... 32 EcoBank Interview Guide....................................................................................................................... 37 Banking Associations Interview Guide .................................................................................................... 40 Donors Interview Guide ........................................................................................................................ 42 Industry Associations Interview Guide .................................................................................................... 43 TA Providers Interview Guide ............................................................................................................... 44 USAID/Ghana Interview Guide .............................................................................................................. 45 MFI Interview Guide .............................................................................................................................. 48 Bank of Ghana (Central Bank) Interview Guide ....................................................................................... 50
Annex B – Contact List.............................................................................................................................. 51

Ghana EcoBank DCA Guarantee Evaluation iii
TABLE OF FIGURES
FIGURE 1: LENDING TO PRIVATE SECTOR AS PERCENT OF GDP .................................................................................. 1
FIGURE 2: GROWTH IN ECOBANK LENDING, 2002-2008 ................................................................................................... 3
FIGURE 3: BANK LENDING RATES 2000-2007 ........................................................................................................................... 7
FIGURE 4: GROWTH IN ECOBANK'S LOAN PORTFOLIO BY VOLUME, 2002-2008 ................................................ 22
FIGURE 5: GROWTH IN ECOBANK'S LOAN PORTFOLIO BY VALUE, 2002-2008 ..................................................... 22
FIGURE 6: DEPOSIT MONEY BANKS CREDIT TO PRIVATE SECTOR AS PERCENT OF REAL GDP .................... 26
FIGURE 7: GROWTH IN CREDIT FROM MICROFINANCE INSTITUTIONS, 2001-2006 ........................................... 27
TABLE OF TABLES
TABLE 1: CHARACTERISTICS OF DCA LOAN GUARANTEES IN GHANA .................................................................... 1
TABLE 2: SUMMARY OF DCA GUARANTEES .......................................................................................................................... 10
TABLE 3: SUMMARY OF LOAN GUARANTEES IN GHANA ............................................................................................... 11
TABLE 4: ECOBANK EXPERIENCE WITH BORROWERS/INDUSTRIES RECEIVING GUARANTEED LOANS ... 16
TABLE 5: DISTRIBUTION OF ECOBANK'S SME LOANS BY SIZE ...................................................................................... 18
TABLE 6: ANTICIPATED VERSUS ACTUAL LOAN CHARACTERISTICS ........................................................................ 19
TABLE 7: LOAN SUMMARY BY INDUSTRY ............................................................................................................................... 20
TABLE 8: CHANGE IN ECOBANK'S LENDING BEHAVIOR SINCE THE GUARANTEES ........................................... 23

Ghana EcoBank DCA Guarantee Evaluation iv
ACKNOWLEDGEMENTS
Many people contributed to the evaluation. Perhaps most important are the many people who generously shared
their time and knowledge with the evaluation team. In this regard, Joana Mensah, Paul Acquah, Gordon Nyamekye-
Pratt, and Abdulai Abdul-Rahman of EcoBank deserve particular thanks for the many hours they spent helping the
evaluation team understand EcoBank’s use of the guarantees and the general lending environment in Ghana. The
team also thanks EcoBank in general for its outstanding cooperation in providing data and resources to support the
evaluation. The evaluation team also interviewed many other people in the course of the evaluation and wishes to
thank them as well for sharing their time and knowledge.
The USAID/Ghana Mission Director, Robert Hellyer, and Brian Dusza, the Director of the Economic Growth
Office also deserve thanks for their support and contribution to the evaluation.
Finally, a sincere thank you to Noshie Iddisah for her invaluable assistance in Ghana.

Ghana EcoBank DCA Guarantee Evaluation v
ACRONYMS
AGI Association of Ghana Industries
BoG Bank of Ghana
CMS Credit Management System
DCA Development Credit Authority
DMB Deposit Money Bank
EGAT/DC Bureau of Economic Growth Agriculture and Trade/Office of Development Credit
GHAMFIN Ghana Microfinance Institutions Network
GDP Gross Domestic Product
GoG Government of Ghana
IFC International Finance Corporation
IMF International Monetary Fund
MCC Millennium Challenge Corporation
MFI Microfinance institution
MPC Monetary Policy Committee
MSED Micro and Small Enterprise Development Program
MSME Micro-, small-, and medium-sized enterprises
NGO Non-Governmental Organization
NTE Non-traditional exports
SME Small- and medium-sized enterprise
TA Technical Assistance
TIPCEE Trade and Investment Program for a Competitive Export Economy
USAID United States Agency for International Development
WB World Bank

I. EXECUTIVE SUMMARY
Macroeconomic conditions in Ghana in the early 2000s severely constrained private sector access to credit
(International Monetary Fund 2003). High levels of government borrowing pushed interest rates up and crowded
the private sector out of financial markets. With government bills paying real interest of 16.8 percent, banks had
little incentive to take on riskier private sector debt. High interest rates and exchange rate volatility also created
financial uncertainty that made both borrowers and lenders hesitant to take on the risks associated with loans,
particularly medium to long-term loans.
Limited access to credit and its high cost significantly constrained the growth of Ghanaian enterprises. These
constraints hit micro-, small-, and medium-enterprises (MSMEs) particularly hard because of a number of factors
that made it difficult for banks to assess the
risk associated with loans to MSMEs. This
situation was of particular concern to
USAID/Ghana because its current
Economic Growth strategy relied on
growth in the MSME sector.
The International Monetary Fund
(International Monetary Fund 2003) credits
monetary policy and financial sector
reforms since 2001 for substantially
increased banks’ lending to the private
sector (Figure 1). Several studies and
reports, however, found that access to
credit, high interest rates, and prohibitive
collateral requirements, remain significant
constraints to the growth of many MSMEs (Association of Ghana Industries 2007; (Mensah 2004). Access to the
medium to long-term financing necessary for capital investments is particularly tight (Mensah 2004).
In response to this environment USAID/Ghana implemented two Development Credit Authority (DCA) loan
guarantees with EcoBank, a prominent retail bank in Ghana. Under the guarantees USAID/Ghana agreed to cover
50 percent of EcoBank’s losses of principle on guaranteed loans up to a specified ceiling on total loan value. The
guarantees reduce the bank’s risk and thereby encourage it to make loans to specific sectors that support
USAID/Ghana’s development objectives. USAID/Ghana structured the two DCA guarantees to support its
Economic Growth strategy and specified MSMEs, microfinance institutions (MFIs), and NGOs with activities in
manufacturing, agriculture, agricultural processing, salt mining/production, fisheries, tourism, wood products,
textiles and garments, and other potential growth industry sectors as qualified recipients of guaranteed loans. The
guarantees’ Action Packages also emphasized a particular desire to improve access to larger, medium to long-term
loans for these sectors. Table 1 summarizes key characteristics of the two guarantees.
TABLE 1: CHARACTERISTICS OF DCA LOAN GUARANTEES IN GHANA
Starting year
Ending year
Guarantee ceiling ($)
Number of loans
Aggregate amount ($)
Utilization rate
Median loan Size ($)
Average tenor
(months)
2003 2008 $3,000,000 6 $2,208,830 73.63% $359,395 40
2005 2012 $7,000,000 4 $4,446,664 63.52% $1,203,503 27
Source: USAID Credit Management System (CMS) and EcoBank.
0%
5%
10%
15%
20%
25%
30%
2000 2001 2002 2003 2004 2005 2006 2007 2008
Pe
rce
nt
of
rea
l G
DP
Banks
MFIs
Total
Source: Bank of Ghana & Ghana Microfinance Institutions Network (GHAMFIN)
FIGURE 1: LENDING TO PRIVATE SECTOR AS PERCENT OF GDP

Ghana EcoBank DCA Guarantee Evaluation 2
EVALUATION OBJECTIVES
USAID’s Economic Growth Agriculture and Trade Bureau’s Office of Development Credit (EGAT/DC), which
manages the DCA guarantees, commissioned this evaluation of USAID/Ghana’s DCA guarantees. This evaluation
assesses the performance of the DCA guarantees relative to their objectives as defined in the Action Packages.
Action Packages are internal USAID memos that describe the rational for the guarantees and their objectives. In
this case USAID/Ghana developed the Action Packages and
described the guarantees’ objectives as increasing access to
credit, and particularly medium to long-term credit, for firms in
key growth-oriented sectors. Three broad avenues of
questioning – output, outcome, and impact (see box below) –
guided the evaluation. The evaluation framework and interview
guides in Annex A contain the actual evaluation questions.
The scope of the evaluation covers only EcoBank’s behavior and
potential demonstration effects in the broader banking sector. It
does not examine EGAT/DC’s management of the guarantees
nor does it attempt to assess the impacts of the loans on
borrowers or on USAID/Ghana’s strategic objectives. At
EGAT/DC’s request, the evaluation presents only findings and conclusions. It does not extend to making
recommendations or to drawing out lessons learned.
EVALUATION METHODOLOGY
A three-person team conducted the evaluation in February and March of 2009. The team met initially in
Washington, D.C. to refine evaluation objectives and procedures, develop an evaluation framework, and to
interview EGAT/DC personnel. Field work commenced in Accra, Ghana on February 16, 2009 and concluded on
February 27. During that time the team reviewed documents, conducted structured interviews with stakeholders,
and collected secondary quantitative data.
KEY FINDINGS AND CONCLUSIONS
At the output level, the DCA guarantees complemented EcoBank’s ongoing strategy to transition from a
wholesale bank to a fully fledged retail bank with a correspondingly greater focus on the SME sector. The bank
used the guarantees to gain experience with new borrowers and industries and, in compliance with USAID/Ghana
objectives, to provide larger and longer-term loans associated with financing capital expenditures. Guaranteed
loans were much larger, and consequently far fewer in number, than initially anticipated by USAID/Ghana but still
fell within the size and tenor parameters established in the guarantee agreements.
Specific findings in support of these conclusions include:
EcoBank used the guarantees to test new borrowers. Of the nine unique borrowers (there were ten loans but
two were to the same borrower) under the DCA guarantees, six (66 percent) were new clients.
The bank also used the guarantees to gain experience with new sectors/industries. Three of the eight
sectors/industries represented by loan recipients were sectors/industries in which EcoBank had no previous
lending experience.
EcoBank also focused its use of the guarantees on larger loans with longer tenors necessary for capital
investments – a particular objective of the DCA agreements. Guaranteed loans were significantly larger and
had longer tenors than EcoBank’s typical SME loan. All of the guaranteed loans fell within the top eight percent
(by size) of loans in the bank’s SME portfolio and 60 percent fell within the top two percent. The guaranteed
Evaluation Questions
Output level – Did EcoBank’s use the guarantees
conform to guarantee objectives and specifications as
described in the Guarantee Agreements?
Outcome level – Did EcoBank’s experience with the
guarantees improve access to credit for borrowers in
the target sectors outside of the DCA coverage?
Impact level – Did the guarantees have a
demonstration effect that resulted in other banks
improving access to credit for borrowers in the target
sectors?

Ghana EcoBank DCA Guarantee Evaluation 3
loans had an average tenor of 35 months compared to an average 12 month tenor for the bank’s overall SME
portfolio.
All nine of the unique borrowers under the DCA guarantees received medium to long-term loans, eight to
finance capital expenditures and one, an MFI, for on-lending to micro-enterprises. None had received medium
to long-term loans prior to the guarantee.
In spite of the relatively large loan sizes, loan recipients likely fall within target sectors, i.e., they appear to be
largely medium-sized enterprises and MFIs. The World Bank’s International Finance Corporation (IFC) uses
loan sizes of $10,000 to $100,000 as a proxy for small enterprises and loans between $100,000 and $1 million
as a proxy for medium enterprises (IFC undated).
At the outcome level EcoBank has substantially increased lending to SMEs and MFIs since it began utilizing the
DCA guarantees. EcoBank officials admitted, however, that the growth in SME lending largely reflects the bank’s
ongoing strategy to increase retail lending rather than being attributable to the guarantees. Experience with the
guarantees prompted EcoBank to increase lending to some new industries and to extend some long-term loans for
capital expenditures outside of the guarantee coverage. However, these increases were small relative to the bank’s
overall SME portfolio.
Key findings in support of these conclusions
include:
EcoBank has substantially increased its lending
to SMEs. Figure 2 illustrates the growth in
EcoBank’s lending between 2002 (pre-DCA
guarantee) and 2008. The bank increased the
number of loans in its SME portfolio by 380
percent (from 194 to 932) and the value of
the portfolio by 500 percent (from $11.9
million to $72.0 million). The number of loans
in the bank’s entire loan portfolio grew faster
(1944 percent from 461 to 9,422 loans) than
its SME portfolio but the value of overall
portfolio grew more slowly (353 percent
from $93.2 million to $422.0 million) than the
SME portfolio.
EcoBank used the guarantees to develop new clients and markets. The bank has continued to lend outside of
the guarantees to seven of the eight industries/sectors represented by recipients of guaranteed loans. It has
also extended loan tenors for borrowers in these industries as it focuses on financing capital expenditures.
The DCA guarantees contributed to changes in EcoBank’s lending behavior. EcoBank personnel stated that
the bank’s experience with the DCA guarantees was crucial to the bank increasing the number of larger, long-
term loans for capital expenditures in recent years. EcoBank has increased lending to MFIs outside of the
guarantees and is now extending medium to long-term credit to MFIs.
The DCA guarantees prompted EcoBank to expand lending into new sectors/industries. Bank personnel said
that the ability to test new industries/sectors within the guarantee was critical to the bank’s lending in these
industries/sectors outside of the guarantee coverage but said that the guarantees made, at most, a minor
contribution to the growth in EcoBank’s SME portfolio. Guaranteed loans accounted for only one percent of
the number and nine percent of the value of all SME loans in 2008.
0
1,000
2,000
3,000
4,000
5,000
6,000
7,000
8,000
9,000
10,000
$0
$50
$100
$150
$200
$250
$300
$350
$400
$450
2002 2003 2004 2005 2006 2007 2008
Nu
mb
er
of
loa
ns
Po
rtfo
lio
va
lue
(m
illi
on
s $
)
Entire portfolio value SME portfolio value
Entire portfolio numbers SME portfolio numbers
FIGURE 2: GROWTH IN ECOBANK LENDING, 2002-2008

Ghana EcoBank DCA Guarantee Evaluation 4
At the impact level, lending to MSMEs (a proxy for the target sectors of the guarantee) has increased
substantially in Ghana since 2002 (pre-guarantee). Anecdotal evidence suggests that loan guarantees may be
responsible for some of this increase. However, given the small number of industries/sectors represented by
EcoBank’s guaranteed loans, the effect of the DCA guarantees is likely modest. Factors external to the guarantees
are likely responsible for most of the observed increase in lending to MSMEs.
Key findings in support of the conclusion of increased financial sector lending to MSMEs include:
Bank lending to the private sector (as a percentage of real GDP to control for inflation and overall growth in
the economy) increased from 14.0 percent to 28.8 percent (a 106 percent increase) between 2000 and 2008.
Lending to the commerce and finance sector, a sector dominated by SMEs according to a banking official and a
government SME specialist, grew substantially more than most other sectors increasing by 300 percent from
1.2 percent to 4.8 percent.
At least three Ghanaian universal banks have established relationships with MFIs to gain access to savings
mobilization and lending in the micro-enterprise sector.
Microfinance institutions (lenders to micro-enterprises) increased lending from 0.3 percent to 1.8 percent of
real GDP between 2002 and 2006, a 500 percent increase.
The Bank of Ghana’s SME Survey in 2005 found that “the share of SMEs in total exposure of banks has
increased from 0.95 percent of GDP in 2001 to 1.54 percent of GDP by 2004.”
Two of the three banks that responded to a survey of five banks with SME departments reported increases in
SME lending of 257 and 450 percent between 2002 and 2008.
Qualitative findings on the potential for EcoBank’s DCA guarantees to influence broader MSME lending include:
Three individuals prominent in the banking and development sectors said they had witnessed banks observing
and learning from other banks’ experience when deciding to enter new industries or sectors.
The three banks that responded to the evaluation team’s survey of five banks that competed with EcoBank in
the SME market said that other banks’ experience in new industries and with different loan sizes and tenors
were either “somewhat” or “very” important in determining the banks’ lending strategy.
Two recipients of guaranteed loans have received long-term financing from other banks since receiving the
guaranteed loans.

Ghana EcoBank DCA Guarantee Evaluation 5
II. INTRODUCTION
The International Monetary Fund (International Monetary Fund 2003) described macro-economic conditions in
Ghana in 2000 that significantly constrained private sector access to credit. High levels of government debt (117
percent of GDP in 2000, a quarter of which was incurred in 19991) crowded the private sector out of financial
markets. With government treasuries paying nominal interest rates of 42.0 percent (16.8 percent real), banks had
little incentive to take on riskier private sector debt. High rates of inflation (25.2 percent in 2000) and exchange
rate volatility increased financial uncertainty and discouraged both borrowers and lenders from taking on the risks
associated with loans, particularly medium to long-term loans. Weak competition in the banking industry
exacerbated the problem as banks faced little competitive pressure to seek new markets or improve access to
credit.
In addition to macro-economic conditions that discouraged lending, banks viewed business lending, and particularly
lending to MSMEs to be particularly risky.2 Many businesses lacked the accounting and management capacity to
demonstrate their ability to service a loan, land tenure issues limited businesses’ ability to raise the collateral banks
required to allay perceived risk, the legal and court systems made it difficult for banks to seize collateral when
borrowers defaulted, and the absence of credit bureaus made it difficult for banks to assess borrowers’ credit
history. To add to the risk, the International Monetary Fund (International Monetary Fund 2003) concluded that,
because they have focused largely on government debt, banks may have limited expertise in evaluating risks
associated with private sector lending.
Conditions have improved significantly since 2000. Government policy and financial sector reforms focused on
increasing liquidity in the financial sector and strengthening the regulatory underpinnings of the banking system.
Key policies and reforms include:
Reduced government borrowing lowered Treasury bill interest rates, reduced government demands on
the credit system, and created space for private sector lending.
Eliminating the secondary reserve requirement3 freed up capital for lending to the private sector. The
International Monetary Fund’s (IMF) 2003 Financial Sector Assessment (International Monetary Fund
2003) concluded that, “the secondary reserve requirements … are beginning to bind for some of the
larger banks that would like to engage in more lending to the private sector.” The Bank of Ghana reduced
the secondary reserve requirement from 35 percent to 15 percent in July of 2005 and eliminated it
entirely in August of 2006.
Banking Act of 2004 – the act strengthened the regulatory and supervisory functions of the Bank of Ghana
over the banking industry and has strengthened and stabilized the banking sector.
Universal Banking License – In 2003 the Bank of Ghana established the Universal Banking Business License
which has increased competition in the banking sector. Most major banks have now transitioned to
universal banks and the banking sector has expanded. Between 2000 and 2007 the number of deposit
money banks 4 in Ghana increased from 17 in 2000 to 23 in 20075 and 27 in 2009.6 During the same
1 (International Monetary Fund 2003). 2 Reported by every member of the banking industry the evaluation team interviewed. 3 In addition to a nine percent reserve requirement, banks were required in 2003 to hold a secondary reserve of 35 percent, at least 20 percent in treasury bills and 15 percent in inflation-indexed government bonds. 4 Deposit money banks include Commercial Banks, Merchant Banks, Development Banks, and Universal Banks. Since the Banking Law of 2004, most merchant and commercial banks in Ghana have transitioned to universal banks. 5 Bank of Ghana Annual Reports, Online: http://www.bog.gov.gh/index1.php?linkid=157, Accessed: March 10, 2009. 6 Personal communication with Jude Kofi Arthur, President, Ghana Association of Bankers.
Ghana EcoBank DCA Guarantee Evaluation 6
period the number of Rural and Community Banks increased from 113 to 126 (2007), and the number of
non-bank financial institutions7 increased from 37 to 41 (2007).8
Borrowers and Lenders Act (2008) and Non-Bank Financial Institutions Act (2007) – These acts are part
of a comprehensive package aimed at improving financial intermediation. The borrowers and Lenders Act
clarifies the rights and obligations of lenders and borrowers. It improves transparency in lending and
should ultimately increase access to credit. It also reduces the barriers banks face in seizing collateral
when borrowers default on loans (Economist Intelligence Unit 2009).
Credit Reporting Act (2007) – The act provides the foundation for establishing credit bureaus in Ghana –
one of which is now in operation. Widespread adoption of credit bureaus will reduce information
asymmetry between borrowers and lenders and reduce the cost of lending and interest rate spreads.
As a result of these policies and reforms, the Ghanaian banking sector now (2009) has excess liquidity. The entry
of new banks, and especially Nigerian banks after bank consolidation in that country, has increased competition and
banks are actively seeking new markets. In fact, each of the five representatives of the banking and microfinance
sectors, as well as TA contractors and government officials, that the evaluation team interviewed said that the
banking sector had become much more competitive and that banks were moving down market in search of savings
mobilization and lending opportunities. At least three banks - UniBank, EcoBank, and Barclays - have established
formal partnerships with MFIs to gain access to the lower end of the lending market.
A prominent representative of the banking industry believed that actively engaging the SME market would be
critical for banks’ survival. He stated that 70 percent of the cash in Ghana was outside of the banking system and
believed that future growth in lending depended on bringing this cash into the formal banking sector. The ability to
mobilize savings from the non-banked sectors would be key to reducing the cost of funds and remaining
competitive.
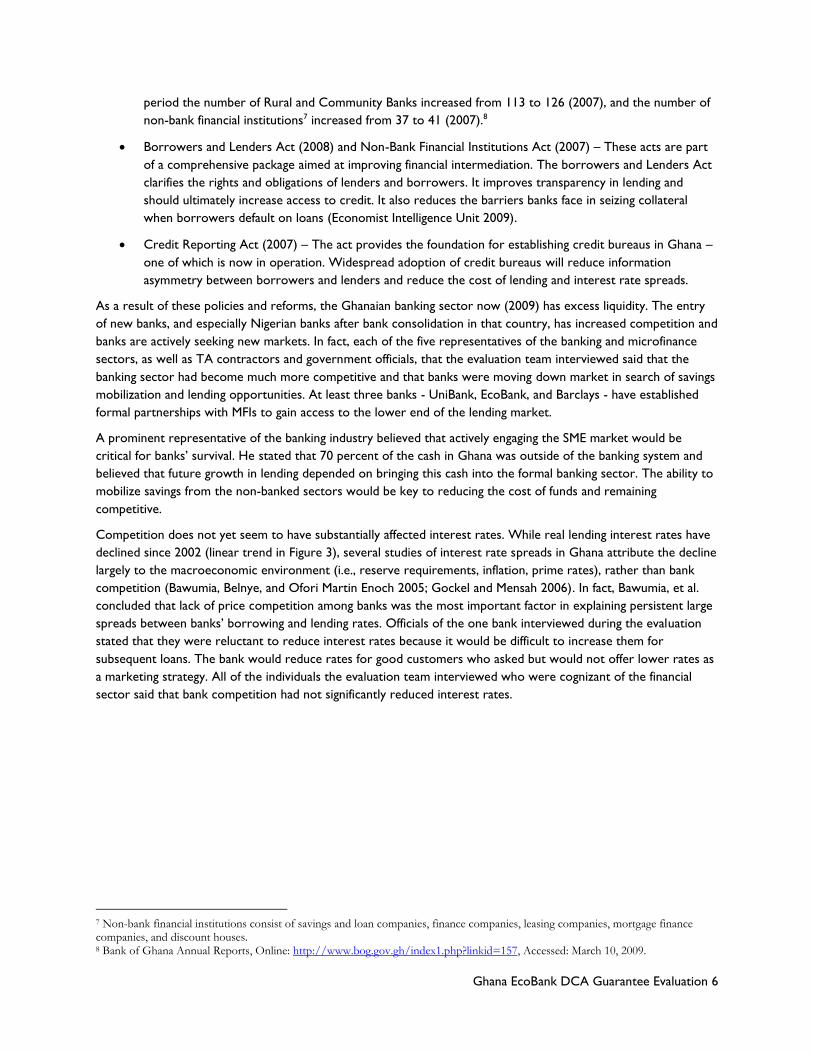
Competition does not yet seem to have substantially affected interest rates. While real lending interest rates have
declined since 2002 (linear trend in Figure 3), several studies of interest rate spreads in Ghana attribute the decline
largely to the macroeconomic environment (i.e., reserve requirements, inflation, prime rates), rather than bank
competition (Bawumia, Belnye, and Ofori Martin Enoch 2005; Gockel and Mensah 2006). In fact, Bawumia, et al.
concluded that lack of price competition among banks was the most important factor in explaining persistent large
spreads between banks’ borrowing and lending rates. Officials of the one bank interviewed during the evaluation
stated that they were reluctant to reduce interest rates because it would be difficult to increase them for
subsequent loans. The bank would reduce rates for good customers who asked but would not offer lower rates as
a marketing strategy. All of the individuals the evaluation team interviewed who were cognizant of the financial
sector said that bank competition had not significantly reduced interest rates.
7 Non-bank financial institutions consist of savings and loan companies, finance companies, leasing companies, mortgage finance companies, and discount houses. 8 Bank of Ghana Annual Reports, Online: http://www.bog.gov.gh/index1.php?linkid=157, Accessed: March 10, 2009.
Ghana EcoBank DCA Guarantee Evaluation 7
FIGURE 3: BANK LENDING RATES 2000-2007
Likewise, competition does not appear to have affected loan tenors or collateral requirements. The evaluation
team found no quantitative data on loan tenors or collateral requirements. However, a USAID technical assistance
contractor working in the agricultural sector had observed some reduction in collateral requirements for SME
borrowers in the agricultural sector but did not believe the practice was widespread. EcoBank reported changing
the composition of what it would accept as collateral (allowing up to 50 percent of the collateral requirement in
cash as opposed to all in landed property) but had not changed the total value of collateral required.
Respondents to the 2007 Business Climate Survey conducted by the Association of Ghana Industries ranked access
to credit and cost of credit among the five greatest barriers to growth.9 Another survey of SMEs in Ghana found
that over 50 percent of SMEs surveyed said that access to credit and the high cost of credit adversely affected their
operations (Bank of Ghana 2007). Access to medium to long-term financing necessary for capital investments
remains a particularly acute problem for SMEs (Mensah 2004).
Remaining barriers to credit for SMEs include:
All individuals the evaluation team interviewed in the financial sector stated that banks’ perceived risk
associated with lending to MSMEs was a key constraint to providing credit. This perceptions stems from
the limited capacity of many MSMEs to demonstrate creditworthiness, information asymmetry, and limited
bank experience with MSMEs. It results in higher interest rates, short tenors, and high collateral
requirements.
Limited acceptance and capacity among MSME owners to adhere to the requirements of obtaining credit
(e.g., disclosing accurate financial information, perception that loans are grants, unwillingness to invest in
capacity building) (Mensah 2004).
Difficulties demonstrating free-and-clear ownership of collateral.
9 The Association of Ghana Industries surveyed 451 businesses in the manufacturing, trade, tourism, services, construction, and finance sectors in seven regions of Ghana. Small businesses made up more than 66 percent of the sample. Almost half of respondents (49 percent) ranked the cost of credit among the five greatest barriers to growth and 43 percent said the same of access to credit.
0
10
20
30
40
50
60
2000 2001 2002 2003 2004 2005 2006 2007
Perc
en
t
Nominal lending rate Inflation rate
Real lending rate Linear (Real lending rate)

Ghana EcoBank DCA Guarantee Evaluation 8
Ghanaian banks’ cash for lending consists primarily of short-term savings deposits. Limited access to long-
term funds thus constrains banks’ ability to make medium to long-term loans.10
High bank delivery costs associated with smaller loans.11
The evaluation assessed the extent to which the DCA loan guarantees to the guarantee partner (EcoBank) have
improved access to credit for the target sectors (i.e., MSMEs) in Ghana. In particular, it asked the following
questions.
How did the DCA guarantees fit into EcoBank’s ongoing strategy? What market potential did the DCA
guarantee help open for EcoBank?
How did EcoBank implement its loan guarantee programs (e.g., marketing campaigns, changed terms,
training, revised staff structure and responsibilities, improved communications with branch offices, etc.)?
And why?
Did EcoBank’s use of the DCA guarantees improve access to credit for the target sectors? (i.e., did
characteristics of guaranteed loans differ from other loans in ways that improved access?)
Did EcoBank improve access to credit to the target sectors outside of the DCA guarantees (i.e., did the
bank move into any new sectors/industries, types of borrowers, types of loans, or loan terms)? If so, how
and why and to what extent were the DCA guarantees responsible for improving access to credit outside
of the guarantees?
What factors at EcoBank were responsible for achieving desired outcomes (e.g., TA; bank staff training;
revised bank strategy, procedures and structure; new management, etc.)?
Did other, non-partner banks initiate or increase lending to the target sectors? If so, to what extent was
the DCA guarantee to EcoBank responsible? How and why?
Did access to loans (or loan terms) improve for loans to the target sectors? If so, how and why?
10 Although this was not a formal interview question, two representatives of the banking sector, an SME expert, and representatives of the Bank of Ghana and Ministry of Finance mentioned it as a key constraint to medium to long-term credit. 11 2003 USAID DCA Action Package and (Bawumia, Belnye, and Ofori Martin Enoch 2005).
Ghana EcoBank DCA Guarantee Evaluation 9
III. THE DEVELOPMENT PROBLEM AND USAID’S RESPONSE
In 2003, USAID/Ghana’s Economic Growth strategy emphasized private sector-led growth fueled by increased
non-traditional exports, and especially agricultural exports. The strategy recognized the critical role of MSMEs in
attaining these objectives and its Trade and Investment Reform Program (TIRP) focused on increasing the
competitiveness of Ghana’s private sector exports in world markets.
PROBLEM STATEMENT
Several studies identified limited access to credit as a significant barrier to growth in the MSME sector in Ghana
(Mensah 2004; International Monetary Fund 2003; Association of Ghana Industries 2007). In fact, respondents to
the 2007 Business Climate Survey conducted by the Association of Ghana Industries (AGI) reported that access to
credit and cost of credit were among the five top challenges to growth. Mensah (2004) reported that “long term
financing in terms of equity capital, needed by growth-oriented mainly small and medium companies, is virtually
non-existent for SMEs.”
USAID’S INTERVENTION IN RESPONSE
To address these constraints and thus support its Economic Growth strategy, USAID/Ghana implemented two
DCA loan guarantees with EcoBank in 2003 and 2005. USAID/Ghana originally provided guarantees to two partner
banks in 2003 but then withdrew one because the partner was not utilizing the guarantee. The Mission then
redirected the funds from the terminated guarantee to establish a second guarantee with EcoBank (the 2005
guarantee) to focus on encouraging larger loan sizes than the initial guarantee. Both guarantees were specifically
structured to encourage EcoBank to provide longer-term loans to sectors with the potential to make substantial
contributions to growth. These included MSMEs, microfinance institutions (MFIs), and NGOs with activities in
agriculture, agricultural processing, salt mining/production, fisheries, tourism, value-added processing of wood
products, and textiles and garments. The Action Packages provide additional detail about qualifying loans. In
particular, they place a strong emphasis on loans to support non-traditional exports (NTEs) in specific sectors with
growth potential and spoke to the importance of improving access to long-term loans. The following excerpts
from the Action Packages illustrate the intended targets of guaranteed loans.
“The scope of the DCA program will leverage financing from local funds to both emerging SMEs and to
the micro-enterprise sector.” (2003 and 2005 Action Packages)
“The sectors that the Mission is seeking to strengthen through this assistance are primarily those that
have the most potential in non-traditional exports (NTEs). These are the tourism, textile, and garment
sectors.” (2003 and 2005 Action Packages)
“Specifically, the DCA activity will attempt to introduce medium and long-term capital to industries and
economic sectors that have, to date, been under-represented in the Ghanaian financial sector for various
reasons.”
Table 2 summarizes key characteristics of the two DCA Guarantee Agreements (the legal agreements between
EcoBank and USAID/Ghana).

Ghana EcoBank DCA Guarantee Evaluation 10
TABLE 2: SUMMARY OF DCA GUARANTEES
2003 DCA 2005 DCA
AUTHORITY DCA DCA
TYPE Loan Portfolio Guarantee (LPG) Loan Portfolio Guarantee (LPG)
GUARANTEED
PARTY EcoBank Ghana Limited EcoBank Ghana Limited
MAXIMUM
PORTFOLIO
AMOUNT
$3,000,000 of which not more than
$1,200,000 for projects not designed to
produce or market products for export
$7,000,000
USAID
GUARANTEE
PERCENTAGE
50% 50%
GUARANTEE
CEILING $1,500,000 $3,500,000
TERM OF
GUARANTEE 5 years (7/18/03 - 7/17/2008) 7 years (3/21/05 - 3/23/12)
ORIGINATION FEE 0.50% of guarantee ceiling ($7,500) 0.50% of guarantee ceiling ($17,500)
UTILIZATION FEE 0.25% per annum of portion of the
outstanding principle guaranteed by USAID
0.50% per annum of portion of the
outstanding principle guaranteed by USAID
MAXIMUM LOAN
AMOUNT $600,000 $1,400,000
TENOR 18 months to 5 years Less than or equal to 36 months
QUALIFYING
BORROWERS
Any small, medium, or large enterprises or
microfinance institutions carrying out
Qualified Projects in Ghana
Non-sovereign Ghanaian micro-, small-, and
medium-sized enterprises (MSMEs),
microfinance institutions (MFIs), and non-
governmental organizations (NGOs),
established under Ghanaian law that are
private enterprises in sectors such as
manufacturing, agro-processing, tourism,
textile, garment, and other potential growth
industries.
QUALIFYING
PROJECTS
Revenue-generating activities in agriculture
(excluding cocoa), agricultural processing,
salt mining/production, fisheries, tourism,
value added processing of wood products
(excluding financing related to the harvesting
or export of unprocessed timber), and
textiles and garments.
Investments designed to encourage growth
of Qualifying Borrowers in manufacturing,
agro-processing, tourism, textile, garment,
and other potential growth industry sectors.
The DCA guarantees continued a history of loan guarantees to EcoBank dating back to two Micro and Small
Enterprise Development (MSED) program guarantees in 1996 and 2001. The MSED guarantees provided the
foundation for EcoBank’s SME portfolio growth. The 118 loans guaranteed under the 1996 MSED agreement

Ghana EcoBank DCA Guarantee Evaluation 11
represented 61 percent of the 194 loans in the bank’s SME portfolio in 2002. This is not a perfect comparison
because the MSED loans were distributed over the five years between 1996 and 2001 while the 194 loans in 2002
represent outstanding loans at that time. However, the numbers do illustrate the importance of the MSED-
guaranteed loans to the bank’s SME portfolio. In 2002, the value of outstanding MSED-guaranteed loans accounted
for 26 percent of the EcoBank’s total SME portfolio value. The DCA guarantees build on the foundation of the
MSED guarantees by focusing on progressively larger loans and longer tenors. Table 3 summarizes key
performance characteristics of the four credit guarantees to date.
TABLE 3: SUMMARY OF LOAN GUARANTEES IN GHANA
Starting year
Ending year Type Ceiling ($)
Utilization Amount
($) Utilization Rate (%)
Number of
Loans
Average size of
Loans($)
Average tenor of
Loans(days)
Number of
Claims Value of
Claims($)
1996 2001 MSED $2,000,000
$4,521,617 100.00% 118 $38,319 272 2 $3,320
2001 2006 MSED $2,000,000
$6,877,153 100.00% 138 $49,834 612 8 $116,313
2003 2008 DCA $3,000,000
$2,208,830 73.63% 6 $368,132 1206 2 $341,675
2005 2012 DCA
$7,000,000
$4,446,664 63.52% 4
$1,111,666 619 0 $ -
IV. PURPOSE OF THE EVALUATION
The Ghana DCA loan guarantee evaluation is the first in a series of about 20 evaluations of EGAT’s Office of
Development Credit (EGAT/DC) Development Credit Authority (DCA) credit guarantees which will be
conducted over a four-year period. Each individual evaluation will address the performance of a particular
guarantee. A meta evaluation will synthesize results from the individual evaluations to address broad questions of
the performance of the DCA program. With the meta evaluation, EGAT/DC desires information “to (1) shape the
dialogue about when/how to engage the private sector in development, (2) strengthen USAID’s application of DCA
as a tool for achieving development results, and (3) influence the project design of new guarantees.” This report,
however, deals only with the individual Ghana DCA guarantees. It does not directly address meta evaluation
questions.
The individual evaluations address the performance of the guarantees from the perspective of EGAT/DC rather
than that of the respective USAID Missions. The evaluations address the guarantees’ performance at three levels –
output, outcome, and impact defined as follows.
Output level – Did EcoBank’s use of the guarantees conform to guarantee objectives and specifications as
described in the Guarantee Agreements?
Outcome level – Did EcoBank’s experience with the guarantees improve access to credit for enterprises
in the target sectors outside of guarantee coverage?
Impact level – Did the guarantees have a demonstration effect that improved access to credit for
enterprises in the target sectors from the broader banking sector?
The scope of this evaluation thus extends only to the guarantee partner’s behavior at the output and outcome
levels and on the behavior of the broader banking sector at the impact level. The evaluation does not examine
EGAT/DC’s management of the guarantees nor does it attempt to assess the impacts of the loans on borrowers
or on USAID/Ghana’s objectives.

Ghana EcoBank DCA Guarantee Evaluation 12
V. METHODOLOGY AND INDICATORS
A three-person team conducted the evaluation in Accra, Ghana between February 16 and 27, 2009. Prior to
departing for Ghana, the team met with EGAT/DC to discuss evaluation objectives and procedures and to
interview EGAT/DC personnel. The evaluation team also obtained and reviewed the following literature and data
relevant to the evaluation prior to arriving in Ghana.
Credit Monitoring System data for both the 2003 and 2005 guarantees
Action Packages for both the 2003 and 2005 guarantees
Guarantee Agreements for both guarantees
Biennial Reviews for both guarantees
Credit Review Board meeting notes
Data (two spreadsheets and partial response to a data request) sent by Ecobank
TIPCEE Annual Report, 10/05 – 9/06
Ghana at a Glance (World Bank)
Ghana Economic Memorandum (World Bank)
IMF Survey (w/Ghana article)
Ghana: Selected Issues (International Monetary Fund)
Ghana: 2008 Article IV Consultation (International Monetary Fund)
Economist Intelligence Unit (EIU) Country Report
EIU Country Profile
After reviewing the data and literature, the team worked with EGAT/DC to refine an evaluation framework that
defined the evaluation questions, data sources, data collection methods, and uses of the data. The evaluation
framework provided the foundation for developing detailed interview guides for each potential source of data.
Annex A contains the evaluation framework and the interview guides. Prior to departure the team also developed
a work plan for conducting evaluation activities in Ghana.
Upon arrival in Ghana the team scheduled and conducted structured interviews with key stakeholders and others
who could provide evidence for the evaluation.12 The team also collected literature and secondary data to support
the evaluation. Appendix B contains a list of interviews the evaluation team conducted. The Bibliography contains a
complete list of documents reviewed by the evaluation team.
Based on the Action Packages, the Guarantee Agreements, the literature review, and data availability, the primary
indicators of access to credit that are relevant to this evaluation are:
Change in the number of MSMEs with loans and/or the value of lending to MSMEs.
Change in interest rates for MSME borrowers.
Change in collateral requirements for MSME borrowers.
Change in loan tenors for MSME borrowers.
The evaluation attempted to obtain measures of each of these indicators at each relevant level of the evaluation
(i.e., output, outcome, and impact).
12 The evaluation team interviewed representatives of EcoBank; USAID/Ghana; the Millennium Challenge Corporation; TechnoServe; Chemonics/TIPCEE; the Ministry of Finance and Economic Planning; the Ghana Association of Microfinance Networks; the Ministry of Trade and Industry; the Ghana National Chamber of Commerce and Industry; the World Bank Institute of Statistical, Social, and Economic Research; the Bank of Ghana; the Ghana Association of Bankers; the International Finance Corporation; the World Bank; the Association of Rural Banks; Opportunity International; Millennium Development Authority; and the Association of Financial NGOs. See Annex B for a complete contact list.

Ghana EcoBank DCA Guarantee Evaluation 13
DATA LIMITATIONS
The evaluation team encountered a number of limitations on the type and quality of data available to conduct the
evaluation. The limited depth of data available to address some questions represented one such deficiency. For
example, output and outcome level questions focused on the behavior of the guarantee partner and EcoBank and
USAID were the sole authoritative sources for these data.13 Similarly, few Ghanaian banks (perhaps five) have SME
lending departments and could speak to impact level results. The result is that qualitative data presented in this
report is often thin.
The target sectors (i.e., MSMEs’ MFIs, and NGOs engaged in particular activities) presented another challenge.
These sectors do not match sector definitions used by economic data sources. Specifically, financial data in Ghana
is reported for 11 sectors -- Agriculture, forestry, and fisheries; Export trade; Manufacturing; Transport, storage,
and communication; Mining and quarrying; Import trade; Construction; Commerce and finance; Electricity, gas, and
water; Services; and Miscellaneous. The sectors targeted by the guarantees may cut across all of these sectors
under which data are typically reported.
The divergence between the sectors targeted by the guarantees and those under which economic data are
reported made it impossible to directly examine lending or other economic activity for the targeted sectors on a
broad scale. Many organizations, however, focus on the SME sector and there is, therefore, some limited data on
SMEs. Therefore, much of the analysis in this evaluation uses data on SMEs as a proxy for the target sectors of the
guarantees. However, the SME sector is so large and varied that national-level data on the sector is very thin.
13 Borrowers of guaranteed loans could have spoken to the issue of the impact of EcoBank’s use of the guarantees on access to credit but the evaluation framework developed with EGAT/DC did not include data collection from borrowers.

Ghana EcoBank DCA Guarantee Evaluation 14
VI. EXOGENOUS INFLUENCES ON GUARANTEE PERFORMANCE
Changes in macro-economic conditions and government policy have led to a substantial transformation of the
Ghanaian banking sector during the period of performance of the DCA guarantees. These changes have
substantially improved access to credit for individuals and for all range of businesses. To determine the impact of
the DCA guarantees on access to credit, the evaluation must, to the extent possible, separate the impacts of the
guarantees from the effects of factors external to the guarantees. The report’s introduction described the broader
lending environment in which EcoBank implemented the DCA guarantees and the host of external forces that have
affected access to credit between 2002 (prior to the DCA guarantees) and the present. This section frames those
factors in the context of their potential impact on the indicators used in the evaluation.
The general expansion of the banking sector, and corresponding increase in lending activity, is the most significant
external factor affecting the number of MSMEs with loans or the aggregate value of lending to MSMEs. As discussed
in the introduction, the reasons for the growth in the sector are many including macro-economic policy and
regulatory reforms which created additional liquidity in the banking system, increased competition, and a
strengthened lending environment. In fact, a particular challenge at the outcome and impact levels of this evaluation
was to determine the impact of a very small number of guaranteed loans on the substantial growth in lending for
EcoBank and for the larger banking sector.
Another indicator of improved access to credit is a change (reduction) in interest rates. However, other factors
such as the country’s fiscal policy (i.e., prime rate), bank’s operational expenses, and competition among banks are
likely to have a greater impact on interest rates than a small number of guaranteed loans. The same can be said of
changes in collateral requirements, i.e., that government actions with respect to land tenure, credit bureaus,
courts, and the rights of borrowers and lenders are likely to have a much greater impact on collateral
requirements than will a small number of guaranteed loans to a single bank.
The capacity of potential MSME borrowers represents a significant barrier to credit in Ghana. USAID and other
donors are making substantial investments in improving the capacity of MSMEs to contribute to economic growth.
To the extent that these activities are successful, they should increase access to credit. This factor did not appear
to be significant at the output level of this evaluation because the evaluation discovered no overlap between the
clients of capacity-building technical assistance projects and recipients of guaranteed loans. It was not possible to
determine the effect of capacity-building at the outcome or impact levels. As these activities mature and expand,
they may become significant external determinants of access to credit.
Finally, the efforts of other donors and the Ghanaian government to improve access to credit will, if they are
successful, represent external forces affecting the indicators used for this evaluation. Mensah (2004) identified 17
donor-supported efforts supporting MSMEs as well as at least one government-supported loan guarantee program.

Ghana EcoBank DCA Guarantee Evaluation 15
VII. FINDINGS AND CONCLUSIONS
This section reviews evaluation findings and conclusions. Separate sections examine findings and conclusions at the
output, outcome, and impact levels. Each section begins with a summary of the evaluation questions and then
addresses each question separately stating first the conclusion and then presenting the findings to support the
conclusion.
OUTPUT LEVEL FINDINGS AND CONCLUSIONS
At the output level the evaluation asked whether EcoBank used the guarantees to improve access to credit for
enterprises in the target sectors. The evaluation framework specified three questions at the output level.
Question 1: How did the DCA guarantees fit into EcoBank’s ongoing strategy? What market potential did
the DCA guarantee help open for EcoBank?
Question 2: How did EcoBank implement its loan guarantee programs (e.g., marketing campaigns, changed
terms, training, revised staff structure and responsibilities, improved communications with branch offices,
etc.)? And why?
Question 3: Did EcoBank’s use of the DCA guarantees improve access to credit for the target sectors?
(i.e., did characteristics of guaranteed loans differ from other loans in ways that improved access?)
The output level questions address EcoBank’s behavior in utilizing the guarantees. Sources of evidence to answer
the evaluation questions depended primarily on interviews with four senior individuals with EcoBank (the
Country/Regional Risk Manager, Head of the Credit Administration Department, Retail Risk Manager, and the SME
Department Head) who were most involved in administering the guarantees; EcoBank annual reports; data on the
guaranteed loans obtained from EcoBank and USAID’s Credit Management System (CMS); and reviews of USAID’s
Action Packages, Guarantee Agreements, and Biennial Reviews for both guarantees.
FINDINGS AND CONCLUSIONS FOR QUESTION 1
Question 1: How did the DCA guarantees fit into EcoBank’s ongoing strategy? What market potential did the
DCA guarantee help open for EcoBank?
Conclusion: The DCA guarantees complemented EcoBank’s strategy to transition from a largely wholesale bank
to a fully fledged retail bank with a corresponding increased emphasis on MSMEs. The guarantees allowed the bank
to gain experience with new industries/sectors and types of lending (i.e., financing capital investments) that
complemented this strategy.
Findings: Since its transition from a merchant bank to a universal bank in 2003, EcoBank has shifted its focus from
being a predominantly wholesale bank to a fully fledged retail bank.14 Bank personnel stated that EcoBank seeks to
elevate retail banking to 50 percent of its business although the economic downturn in 2008 has delayed
attainment of this goal. Retail banking implies includes a greater focus on MSMEs, high net worth individuals,
salaried workers, religious organizations, educational institutions, health institutions, and clubs and associations.15
The strategy thus generally coincides with an increased focus on the industries/sectors targeted by the DCA
guarantees (i.e., MSMEs). As one element of its pursuit of this strategy, EcoBank formed a partnership (EB-
ACCION Savings and Loan) with a leading microfinance institution in 2006 to extend its reach into microfinance
savings mobilization and lending.16
14 EcoBank Annual Report, 2005. 15 EcoBank Annual Report, 2006. 16 http://www.eb-accion.com/. Accessed: March 8, 2009.

Ghana EcoBank DCA Guarantee Evaluation 16
An EcoBank official familiar with the bank’s SME lending strategy spoke to the importance of the guarantees in
providing EcoBank the opportunity to test the potential of new firms, industries, and types of lending in which the
bank had little or no previous experience. EGAT/DC’s Biennial Reviews of the guarantees corroborated this
finding stating that the guarantees (and especially the MSED guarantees) “are used by Ecobank as an exploratory
research laboratory for testing the creditworthiness of potential clients.”
Information provided by EcoBank on pre-guarantee lending to the firms that received guaranteed loans and to the
industries/sectors they represent suggests that EcoBank used the guarantees to test new customers, new
industries/sectors, and longer-term financing for capital expenditures. Table 4 summarizes EcoBank’s pre- and
post-guarantee experience with the firms and industries to which it provided guaranteed loans. The first column
lists individual borrowers by their industry. The second and third columns show EcoBank’s pre-guarantee lending
experience with each individual borrower. The final column shows the type of loan provided under the guarantee.
TABLE 4: ECOBANK EXPERIENCE WITH BORROWERS/INDUSTRIES RECEIVING GUARANTEED
LOANS
Borrower and industry Pre-guarantee
Experience with borrower
Pre-guarantee Experience with
industry
Guaranteed loan type
Agricultural processing (vegetable oil milling)
None Long-term and
short-term loans Long-term loan
Rubber and plastics products manufacturing
None Short-term loans Long-term loan
Garment manufacturer None Short-term loans Long-term loan
Garment manufacturer None Short-term loans Long-term loan
Land development Short-term loans None Long-term loan
Well drilling Short-term loans Short-term loans Long-term loan
Mining and quarrying None None Long-term loan
Microfinance institution Short-term loans Short-term loans Long-term loan
Microfinance institution Short-term loans Short-term loans Long-term loan
Shore handling None None Long-term loan
Key findings include:

Ghana EcoBank DCA Guarantee Evaluation 17
Of the nine unique borrowers (one borrower received two loans) under the DCA guarantees, six
represented new clients for EcoBank.
Of the nine unique borrowers under the DCA guarantees, eight received long-term loans to finance
capital expenditures. None had received such loans prior to the guarantee. The ninth, an MFI, received
two large, long-term loans for on-lending to micro-enterprises.
Of the eight sectors/industries represented by the borrowers of guaranteed loans, EcoBank had no
previous experience with three and had provided long-term loans to only one.
An EcoBank official intimately involved in the guarantees and in lending strategy stated that the DCA guarantees
were critical to increasing the bank’s capacity to structure long-term investment transactions.
FINDINGS AND CONCLUSIONS FOR QUESTION 2
Question 2: How did EcoBank implement its loan guarantee programs (e.g., marketing campaigns, changed terms,
training, revised staff structure and responsibilities, improved communications with branch offices, etc.)? And why?
Conclusion: EcoBank integrated the guarantee into its normal loan assessment process. It did not provide any
special training or alter normal loan assessment procedures. It did not actively market the guarantee to potential
borrowers because of the risk of moral hazard.
Findings: EcoBank integrated the implementation of the guarantee program into its existing loan assessment
process. The normal process is for branch-level relationship managers to meet with loan applicants and make an
accept/reject recommendation to the branch manager who then makes a recommendation to the credit
committee at EcoBank headquarters in Accra. The credit committee makes the final ruling on loans but will not
over-rule a branch’s decision to reject a loan because the branch bears the responsibility for bad loans.
Consideration of the guarantees enters into the process in two places. First, EcoBank informed relationship
managers and branch managers by email or telephone of the availability and function of the guarantee. The
relationship managers and branch managers take this into consideration when deciding whether to recommend a
loan to the credit committee. The branches may, and do according to the one EcoBank official, recommend loans
specifically for the guarantees that they would not have recommended without the guarantee. Second, the credit
committee may also advise a branch to reconsider a rejection in light of the guarantee.
EcoBank does not advertise or market the guarantees to potential borrowers because of the risk of moral hazard.
Three people the evaluation team interviewed (two representatives of the banking sector and one government
representative) spoke of a history in Ghana of government-backed loan guarantees with little penalty for default.
These individuals, including EcoBank, believed that borrower awareness of the guarantees would increase the
likelihood of default.
FINDINGS AND CONCLUSIONS FOR QUESTION 3
Question 3: Did EcoBank’s use of the DCA guarantees improve access to credit for the target sectors? (i.e., did
characteristics of guaranteed loans differ from other loans in ways that improved access?)
Conclusion: EcoBank’s use of the guarantees improved access to medium and long-term credit for some firms in
the target sectors. The guarantees gave EcoBank the protection from risk necessary to extend loan sizes and
tenors beyond its typical range. The guaranteed loans focused on the upper end of the spectrum of qualified
borrowers by size. In fact, loan sizes appear consistent with lending almost exclusively to medium-sized
enterprises. Guaranteed loans were larger, and consequently fewer in number, than anticipated by USAID/Ghana
but still fell within the size and tenor parameters established in the Guarantee Agreements. Special waivers (2003
guarantee) and overly broad and imprecise definitions of target sectors (2005 guarantee) rendered the target
sectors defined in the Guarantee Agreements irrelevant.

Ghana EcoBank DCA Guarantee Evaluation 18
Findings: At the output level (i.e., EcoBank behavior within the guarantees) improved access to credit means that
EcoBank used the guarantees to provide new credit or new types of credit to borrowers who would not have
received the credit without the guarantees. The bank may make credit, or types of credit, more available by
offering larger and longer-term loans, reducing interest rates to make loan more affordable, or reducing collateral
requirements. These criteria reflect the objectives articulated in the Action Packages of “introducing medium and
long-term capital to industries and economic sectors that have, to date, been under-represented in the Ghanaian
financial sector,” encouraging a reduction in collateral requirements, and extending average loan maturity periods.
The findings presented here show first that EcoBank’s use of the guarantees improved access to credit (i.e., that
loan recipients would not likely have received the loans without the guarantee) and then that the characteristics of
guaranteed loans were generally consistent with [imprecisely defined] USAID/Ghana objectives.
The guaranteed loans represent improved access to credit only if EcoBank would not have made the loans, or
would not have offered the terms, outside of the guarantees’ coverage. Two sources of evidence – statements by
EcoBank personnel responsible for approving guaranteed loans and a comparison of the characteristics of
guaranteed loans to those of the bank’s overall SME portfolio – suggest that this is so.
The small number of guaranteed loans afforded the evaluation team the opportunity to review each loan
individually with EcoBank personnel. The team asked bank personnel, including those responsible for authorizing
the guaranteed loans, whether the bank would have extended the loans without the guarantees and the primary
reasons the bank chose to place the loans under the guarantees. These personnel said that EcoBank would have
extended the type of loans it did (i.e., long-term capital financing) to only one of the loan recipients without the
guarantee. Even in this case (the MFI), the bank would have required much greater security without the guarantee.
The primary reasons for placing the loans under the guarantees were the increased risk associated with lending to
firms/industries in which the bank had little experience and the relatively large size and long tenor of loans
associated with capital financing.
The size and tenor of the guaranteed loans also differ significantly from those of the bank’s overall SME portfolio.
This provides additional evidence that the guarantees improved access to credit by encouraging EcoBank to make
loans that it would not have made without the guarantees. Table 5 shows the distribution of loans by size for
EcoBank’s SME portfolio and for the guaranteed loans. All of the guaranteed loans fall within the top eight percent
of loans by size and 60 percent fall within the top two percent. Guaranteed loans account for 43 percent of loans
over $1 million and 22 percent of loans over $250,000.
TABLE 5: DISTRIBUTION OF ECOBANK'S SME LOANS BY SIZE
SME portfolio Guaranteed loans
Loan size ($) Number Cumulative
percent Number Cumulative
percent
$1 - $50,000 504 63.6% 0 0.0%
$51,000 - $99,000 137 80.9% 0 0.0%
$100,000 - $249,000 92 92.6% 1 10.0%
$250,000 - $499,000 32 96.6% 3 40.0%
$500,000 - $749,999 13 98.2% 3 70.0%
$750,000 - $999,000 7 99.1% 0 70.0%
$1,000,000 - $4,999,999 7 100.0% 3 100.0%
Source: EcoBank

Ghana EcoBank DCA Guarantee Evaluation 19
The guaranteed loans also had longer tenors than the bank’s typical SME loans. Guaranteed loans had tenors of
between 22 and 60 months (Table 7) with average tenors of 40 months (2003 guarantee) and 27 months (2005
guarantee). These tenors are well above the average tenor of 12 months in EcoBank’s overall SME portfolio.17
The longer tenors and larger loan sizes reflect the bank’s focus on using the guarantees to finance relatively risky
capital investments rather than working capital and are entirely consistent with Action Package objectives. Capital
investment loans are riskier because they are relatively large and require longer tenors for repayment.
Nevertheless, loans placed under the guarantees were much larger and consequently far fewer in number, than
anticipated by USAID/Ghana. Table 6 illustrates the divergence between anticipated and actual loan characteristics
under the 2003 and 2005 guarantees. EcoBank placed only six loans under the guarantee in 2003 with an average
value ten times that anticipated in the Action Package. In 2005 the bank placed less than one-seventh of the
anticipated number of loans under the guarantee with average values more than five times the anticipated average
loan size.
TABLE 6: ANTICIPATED VERSUS ACTUAL LOAN CHARACTERISTICS
2003 DCA
Anticipated 2003 DCA
Actual 2005 DCA
Anticipated 2005 DCA
Actual
Number of loans 80 6 35 4
Size of loans ($) $37,000 $368,132 $200,000 $1,111,666
Tenor (months) 24 40 36 21
Source: 2003 and 2005 Action Packages, EcoBank loan records.
USAID/Ghana and EcoBank developed the target loan sizes and numbers based on characteristics of EcoBank’s
SME portfolio at the time the guarantees were put in place. They thus reflect past experience more than a
considered attempt to select loan sizes consistent with accomplishing USAID/Ghana’s objectives. The anticipated
loan numbers and sizes were not binding, however, and EcoBank used the guarantees specifically to expand its
outreach into the market for larger loans required for capital investments – a direction that is entirely consistent
with the Action Package objective of “introducing medium and long-term capital to industries and economic
sectors that have, to date, been under-represented in the Ghanaian financial sector.”
The evaluation also examined the size of the guaranteed loans and sectors represented by recipient enterprises
relative to the target sectors described in the Guarantee Agreements. Table 7 summarizes guaranteed loans by
industry. The Guarantee Agreement for the 2003 guarantee defined specific qualifying borrowers and projects as
any small, medium, or large enterprises or microfinance institutions (MFIs) with activities in agriculture, agricultural
processing, salt mining/production, fisheries, tourism, value added processing of wood products, and textiles and
garments. The comparison of guaranteed loan sizes with all of EcoBank’s SME loans (Table 4) suggests that the
guaranteed loans were to enterprises at the upper end of the small-medium-large spectrum. Many of the loans
under the 2003 guarantee also do not appear to satisfy the definitions of qualifying sectors/industries as defined in
the Guarantee Agreement. USAID/Ghana, however, approved each loan under the 2003 guarantee and explicitly
waived the target sector requirement.18
17 Based on data provided by EcoBank. 18 Personal communication from Kofi Owusu-Boakye, EGAT/DC.

Ghana EcoBank DCA Guarantee Evaluation 20
TABLE 7: LOAN SUMMARY BY INDUSTRY
Type of enterprise Purpose of loan Loan amount
($) Loan tenor (months)
Agricultural processing (vegetable oil milling)
Capital equipment, working capital, and other expenses
$500,000 51
Rubber and plastics products manufacturing
Capital equipment purchase $240,000 24
Garment manufacturer Capital equipment purchase $250,000 48
Garment manufacturer Capital equipment purchase $500,000 60
Land development Capital equipment purchase $260,145 30
Well drilling Capital equipment purchase $458,644 25
Mining and quarrying Capital equipment purchase $1,400,000 22
Microfinance institution On-lending to micro-enterprises $1,007,005 25
Microfinance institution On-lending to micro-enterprises $1,400,000 24
Shore handling Capital equipment purchase $665,188 36
The 2005 guarantee focused on somewhat smaller enterprises than the 2003 guarantee adding micro-enterprises
and NGOs and dropping large enterprises. It is less specific about qualifying projects than is the 2003 guarantee
authorizing loans for growth-enhancing investments in sectors such as manufacturing, agro-processing, tourism,
textile, garment, and other potential growth industries. In spite of eliminating large enterprises, however, loans
under the 2005 guarantee were even larger than those under the 2003 guarantee. Virtually any sector/industry
could qualify for a guaranteed loan under the broad definitions of the 2005 Guarantee Agreement. All loans were
thus to qualified borrowers.
In spite of relatively large loan sizes under both guarantees, the sizes appear generally consistent with the SME
target.19 Nevertheless, one person outside of EcoBank who was intimately familiar with the rationale for and
details of the guarantee agreements questioned whether the shore handling company was an SME. He
acknowledged, however, that there was no formal definition of SMEs in Ghana.20 Furthermore, two of the largest
loans went to start-up companies which would have been relatively small at the time the loans were disbursed.
The 2003 Action Package restricts qualifying loans to no more than $600,000 and tenors to between 18 and 60
months. The 2005 Action Package specified a maximum loan size of $1,400,000 and tenors of no more than 36
months. The loans placed under the guarantees generally satisfied these criteria although two of the loans
(representing 54 percent of the loan value disbursed) placed under the 2005 guarantee were for the maximum
allowable size. As with the anticipated loan sizes and numbers, the maximum loan sizes defined in the Guarantee
Agreements likely reflect standard agreement language rather than any deliberate decision by USAID/Ghana.
19 When identifying SMEs from bank loan records in developing countries, the World Bank’s International Finance Corporation uses loan sizes of $10,000 to $100,000 as a proxy for small enterprises and loans between $100,000 and $1 million as a proxy for medium enterprises (IFC undated). 20 In fact, EcoBank defines SMEs as enterprises with less than $250,000 in assets (excluding land and buildings) and between $250,000 and $5 million in annual turnover. Alternative definitions include the number of employees (Bank of Ghana 2007). The EcoBank definition is more restrictive than that used by the National Board for Small Scale Industries which defines medium-sized enterprises as having fixed assets up to $1 million (Mensah 2004).

Ghana EcoBank DCA Guarantee Evaluation 21
Guarantee Agreements can specify any maximum allowable loan size up to 20 percent. Both agreements specified
the standard 20 percent maximum.
While direct recipients of guaranteed loans were generally larger enterprises, the loans to the MFI likely improved
access to credit for MSMEs indirectly. Guaranteed loans to the MFI totaled over $2.4 million and accounted for 54
percent of the value of loans under the 2005 guarantee. The MFI is large with $20.9 million disbursed to 117,528
borrowers in 2007.21 Its portfolio in 2007 consisted of 82 percent micro-enterprises and 18 percent SMEs. Most of
the MFI’s borrowers (60 to 70 percent) are traders, about 20 percent are production and manufacturing
enterprises, and about ten percent are service providers. Because of the largely urban location of the MFI’s
branches, agricultural enterprises make up only two to three percent of borrowers.22 This is significant because,
according to a person involved in writing the 2003 and 2005 Action Packages, MFIs were included as a target
sector specifically to improve access to credit for agricultural enterprises.
According to its Chief Financial Officer, the MFI that received the guaranteed loan is among the strongest
financially in Ghana but it still needs to borrow money to cover lending during peak seasons. By providing funds to
the MFI for on-lending to MSMEs, the guaranteed loan from EcoBank likely indirectly increased access to credit for
the lower end of the target sectors’ spectrum.
EcoBank personnel reported some modifications in the bank’s approach to collateral attributable to the DCA
guarantees. In particular, the bank has relaxed its requirement that collateral be in the form of landed property and
is now encouraging borrowers to build up savings to serve as 50 percent of collateral. This approach reduces the
dependence on property as collateral but still requires that borrowers hold assets (cash or property) to secure the
loan. Neither EcoBank nor any other person the evaluation team interviewed said that banks had reduced the
value of collateral (in whatever form) required to obtain a loan.
OUTCOME LEVEL FINDINGS AND CONCLUSIONS
At the outcome level, the evaluation addressed whether EcoBank’s experience with the guarantees improved
access to credit for enterprises in the target sectors outside of the coverage of the guarantees. Specific evaluation
questions are:
Question 4: Did EcoBank improve access to credit to the target sectors outside of the DCA guarantees
(i.e., did the bank move into any new sectors/industries, types of borrowers, types of loans, or loan
terms)? If so, how and why and to what extent were the DCA guarantees responsible for improving
access to credit outside of the guarantees?
Question 5: What factors at EcoBank were responsible for achieving desired outcomes (e.g., TA; bank
staff training; revised bank strategy, procedures and structure; new management, etc.)?
FINDINGS AND CONCLUSIONS FOR QUESTION 4
Question: Did EcoBank improve access to credit to the target sectors outside of the DCA guarantees (i.e., did
the bank move into any new sectors/industries, types of borrowers, types of loans, or loan terms)? If so, how and
why and to what extent were the DCA guarantees responsible for improving access to credit outside of the
guarantees?
Conclusion: EcoBank increased its lending to SMEs substantially since becoming a guarantee partner. However,
the growth largely reflects the bank’s ongoing strategy to increase retail lending rather than an impact of the
guarantees. Experience with the DCA guarantees prompted the bank to increase lending to some new industries
21 MFI annual reports and website. 22 MFI annual reports and website.

Ghana EcoBank DCA Guarantee Evaluation 22
and to extend some long-term loans for capital expenditures outside of the guarantee coverage. However, these
increases were small relative to the bank’s overall SME loan portfolio.
Findings: EcoBank substantially increased the volume and value of its lending to all sectors between 2002 (pre-
DCA guarantee) and 2008. The number of loans increased 1944 percent from 461 in 2002 to 9,422 in 2008 while
the value of loans increased by 355 percent from $93 million to $423 million. The number of loans to SMEs also
increased during the time period but more slowly (from 194 to 932, a 380 percent increase) than the overall
portfolio. The value of SME loans, however, increased by a greater percentage ($12 million to $72 million, a 500
percent increase) than the overall portfolio which increased 353 percent from $93 million to $422 million. The
growth in the overall portfolio and in the SME portfolio in particular, reflects EcoBank’s strategy to increase retail
lending relative to wholesale lending.23 Figures 4 and 5 illustrate the growth in the volume and value of EcoBank’s
overall and SME loan portfolios between 2002 and 2008.24
FIGURE 4: GROWTH IN ECOBANK'S LOAN PORTFOLIO BY VOLUME, 2002-2008
FIGURE 5: GROWTH IN ECOBANK'S LOAN PORTFOLIO BY VALUE, 2002-2008
23 Retail lending includes loans to SMEs and to individuals while wholesale lending includes lending to large enterprises. 24 Data provided by EcoBank.
0
2,000
4,000
6,000
8,000
10,000
2002 2003 2004 2005 2006 2007 2008
Nu
mb
er
of
ou
tsta
nd
ing
lo
an
s
Entire portfolio SME portfolio
$0
$100
$200
$300
$400
$500
2002 2003 2004 2005 2006 2007 2008
Po
rtfo
lio
valu
e (
$m
illio
ns)
Entire portfolio SME portfolio

Ghana EcoBank DCA Guarantee Evaluation 23
EcoBank personnel stated that the guarantees made, at most, a minor contribution to the growth in EcoBank’s
SME portfolio. Based on the volume and value of the bank’s SME loans in 2008, the ten guaranteed loans with a
total value of $6.6 million accounted for only one percent of all SME loans and nine percent of the value of SME
loans. However, the guarantees did influence the bank’s lending to particular industries and for particular types of
loans (i.e., long-term capital financing and lending to MFIs).
An EcoBank official familiar with the bank’s SME strategy stated that the ability to test these new industries/sectors
within the guarantee was critical to the bank’s lending in these industries/sectors outside of the guarantee
coverage.
Data on pre- and post-guarantee lending in the industries represented by borrowers of guaranteed loans bear this
out to some extent. Of the eight industries/sectors represented, EcoBank had no pre-guarantee experience with
two – land development and shore handling. Of the remaining six, the bank had provided only short-term loans to
four (garment manufacturing, plastics products manufacturing, well drilling, and MFIs) and capital investment loans
to two (agro-processing and mining and quarrying).25 Table 8 summarizes pre- and post-guarantee experience with
each of the industries represented by recipients of guaranteed loans.
TABLE 8: CHANGE IN ECOBANK'S LENDING BEHAVIOR SINCE THE GUARANTEES
Pre-guarantee experience Post-guarantee experience
Industry Number of
loans Type of loans
Number of loans
Type of loans
Agricultural processing 2 Long-term and short-
term loans 1
Long-term capital investment
Plastics products manufacturing
10 Short-term working
capital loans 11
Long-term capital investment
Garment manufacturing 1 Short-term working
capital loans 1
Long-term capital investment
Land development 0 None 1 Long-term capital
investment
Well drilling 1 Short-term working
capital loans 0 N.A.
Mining and quarrying 3 Long-term and short-
term loans 2
Long-term capital investment
Microfinance institutions 3 Short-term loans 4 Long-term loans
Shore handling 0 None 1 Long-term capital
investment
EcoBank has continued to lend without a guarantee to seven of the eight industries/sectors represented by
recipients of guaranteed loans. It has also extended loan tenors for borrowers in these industries as it focused on
financing capital expenditures.
EcoBank personnel also spoke of the importance of the guarantees to the bank’s willingness to take on the
additional risk of long-term financing for capital expenditures. They said that its experience with the DCA
25 Data provided by EcoBank.

Ghana EcoBank DCA Guarantee Evaluation 24
guarantees was crucial to the bank increasing the number of larger, long-term loans for capital expenditures in
recent years. The guaranteed loans exposed the bank to new industries and provided the opportunity to learn
about those industries so it could better evaluate lending risk. Bank officials recounted several examples where a
guaranteed loan provided them the comfort they needed to pursue future lending outside the guarantees.
EcoBank made two guaranteed loans to an MFI for on-lending to micro-enterprises. The loans were
larger, had longer tenors, and required less security than the bank had previously provided to an MFI.
Bank officials said that the comfort the bank gained with the loans was directly responsible for the bank’s
decision to extend a non-guaranteed $2 million loan to another MFI. The loan recipient had recently
improved its management capacity and this was another important factor in the decision to extend the
loan.
Ecobank extended a capital investment loan to a shore handling company under the 2005 guarantee. The
bank had no previous experience in this industry. The bank has gone on to provide non-guaranteed
loans to five stevedoring companies, an industry closely related to shore handling. Bank officials said that
the experience gained with the shore handling company was very responsible for the bank’s decision to
lend to stevedoring companies.
EcoBank had limited experience (i.e., one working capital loan) in the mining and quarrying sector prior
to the DCA guarantees. The bank used the 2005 guarantee to extend a large, medium-term loan to a
mining and quarrying company. The knowledge the bank gained of the industry because of the
guaranteed loan encouraged it to make additional loans in the sector outside the guarantee.
In spite of qualitative evidence that EcoBank is extending long-term loans outside of the guarantee coverage, the
limited quantitative data (i.e., that the guaranteed loans comprise such a large percentage of the bank’s larger loans
(Table 5) suggest that the practice is not widespread.
The performance of the guaranteed loans suggests that EcoBank did use the guarantees to take on riskier loans
than it might have otherwise. EcoBank reported an overall default rate in its SME portfolio of between five and ten
percent between 2002 and 2008. EGAT/DC paid claims of $341,675 on two loans under the 2003 DCA
agreement, however, implying losses of $683,350.26 EcoBank therefore experienced a 31 percent default rate on
loans guaranteed under the 2003 agreement27 and a default rate over both DCA guarantees of 10 percent.28
FINDINGS AND CONCLUSIONS FOR QUESTION 5
Question: What factors at EcoBank were responsible for achieving desired outcomes (e.g., TA; bank staff training;
revised bank strategy, procedures and structure; new management, etc.)?
Conclusion: The single most important factor affecting EcoBank’s performance relative to guarantee objectives
was its desire, articulated in its strategy, to increase lending to MSMEs.
Findings: EcoBank is aggressively pursuing the MSME market. It has dramatically increased lending to the SME
sector since implementing its strategy to focus on retail banking. And it has formed a partnership with a leading
MFI (EB-ACCION) to gain access to microfinance lending. The growth in EcoBank staff engaged in SME lending
(from eight in 2002 to 48 in 2008) emphasizes the bank’s commitment to increased SME lending.
26 EGAT/DC guarantees only 50 percent of the loss of principle. 27 Based on total disbursements of $2,208,789 (USAID Credit Management System and EcoBank). 28 Based on total disbursements of $6,655,453 (USAID Credit Management System and EcoBank).

Ghana EcoBank DCA Guarantee Evaluation 25
IMPACT LEVEL FINDINGS AND CONCLUSIONS
At the impact level, the evaluation asked whether the guarantees, through a demonstration effect, improved access
to credit for enterprises in the target sectors from the broader banking sector. The 2005 Action Package
articulates the intended impact level result as follows.
“USAID/Ghana hopes to demonstrate to a large proportion of the financial community the profitability
and sustainability of lending to these segments [target sectors] of the economy. It will also demonstrate
the possibility of making long term loans to these “risky” borrowers.”
Specific evaluation questions are:
Question 6: Did other, non-partner banks initiate or increase lending to the target sectors? If so, to what
extent was the DCA guarantee to EcoBank responsible? How and why?
Question 7: Did access to loans (or loan terms) improve for loans to the target sectors? If so, how and
why?
FINDINGS AND CONCLUSIONS FOR QUESTION 6
Question: Did other, non-partner banks initiate or increase lending to the target sectors? If so, to what extent
was the DCA guarantee to EcoBank responsible? How and why?
Conclusion: Lending to MSMEs (a proxy for the target sectors of the guarantee) has increased substantially in
Ghana since 2002 (pre-guarantee). Anecdotal evidence suggests that loan guarantees may have a demonstration
effect. However, given the small number of industries/sectors represented by EcoBank’s guaranteed loans, the
effect of the DCA guarantees is likely very modest. Factors external to the guarantees (i.e., overall growth in SME
lending resulting from increasing bank liquidity and increased bank focus on the MSMEs sector) are likely
responsible for most of the observed increase in lending to MSMEs.
Findings: Financial institutions and government economic data sources do not report data for the specific
industries/sectors targeted by the guarantees. The closest proxy measure for which data are available is lending to
SMEs and MSMEs. However, these data are also limited by a lack of formal data collection. The following analysis
thus rests primarily on triangulating data from several sources including special SME studies and extrapolation from
other sources. These include:
Analysis of deposit money banks’29 (DMB) lending by sector showing an increase in lending to sectors
dominated by SMEs.
Survey data on the growth of SME portfolios for banks with SME departments.
Growth in Ghanaian microfinance institutions’ (Community and Rural Banks, Savings and Loan
Companies, Financial NGOs, and Credit Unions) loan portfolios which are comprised largely of MSMEs.
Estimates of growth in SME lending from the Bank of Ghana’s Monetary Policy Committee.
The various sources of evidence all point to a substantial increase in access to credit for MSMEs.
29 Deposit money banks include Commercial Banks, Merchant Banks, Development Banks, and Universal Banks. Since the Banking Law of 2004, most merchant and commercial banks in Ghana have transitioned to universal banks.

Ghana EcoBank DCA Guarantee Evaluation 26
Deposit Money Bank lending: Figure 6 shows substantial growth in total DMB lending to the private sector by
sector between 2000 (pre-DCA guarantee) and 2008. Total DMB lending to the private sector as a percentage of
real GDP increased from 14 percent in 2000 to 28 percent in 2008 – a 100 percent increase. The figure does not
directly illustrate changes in lending to SMEs. However, the agriculture and retail trade (included in commerce and
finance) sectors contain many SMEs.30 The substantial increase in lending to the commerce and finance sector thus
suggests increased DMB lending to SMEs.
FIGURE 6: DEPOSIT MONEY BANKS CREDIT TO PRIVATE SECTOR AS PERCENT OF REAL GDP
SME lending survey: The evaluation team also conducted an email survey of five universal banks (Zenith Bank,
Amalgamated Bank, International Commercial Bank, Standard Chartered Bank, and Barclays Bank) with SME
departments to ask about increases in SME lending. The two of the three banks that responded reported
substantial increases (257 percent and 450 percent) in the value of their SME portfolios between 2002 and 2008.
Microfinance institution lending: Microfinance institutions have also substantially increased lending between
2001 and 2006 (the period for which data are available). Figure 7 illustrates growth in MFI lending. Since MFIs focus
on the MSME market, the growth in MFI lending directly reflects growth in availability of credit to MSMEs. In 2006,
lending by MFIs comprised about ten percent of all private sector lending.31 Rural and Community Banks account
for most of this lending and these banks serve primarily rural and peri-urban communities where loans finance
activities in agriculture and micro-enterprises.32
30
Interviews with a prominent member of the banking sector and a government official in the Ministry of Finance and Economic Planning. 31 Based on data on DMB and Rural and Community Bank lending from the Bank of Ghana’s Monetary Time Series, Statistical Releases, and Statistical Bulletins (http://www.bog.gov.gh/, Accessed: March 10, 2009) and MFI lending estimates from the Ghana Microfinance Institutions Network (GHAMFIN) as reported in (Ghana Microfinance Institutions Network 2008). 32 Ghana Microfinance Institutions Network (GHAMFIN).
0%
5%
10%
15%
20%
25%
30%
2000 2001 2002 2003 2004 2005 2006 2007 2008
Perc
en
t o
f re
al
GD
P
Miscellaneous
Services
Elect.,Gas & Water
Commerce & Finance
Construction
Import Trade
Mining & Quarrying
Trans.,Stor., & Comm.
Manufacturing
Export Trade
Agric.,For. & Fish.

Ghana EcoBank DCA Guarantee Evaluation 27
FIGURE 7: GROWTH IN CREDIT FROM MICROFINANCE INSTITUTIONS, 2001-2006
Bank of Ghana SME Survey: A 2005 Bank of Ghana survey on credit to SMEs found that:
“The share of SMEs in total exposure of banks has increased from 0.95 percent of GDP in 2001 to 1.54
percent of GDP by 2004; whereas total credit to the private sector increased from 11.8 percent to 13.05
percent of GDP over the same period. This is an indication that these enterprises are sharing in the
general growth in lending. The swings in lending in favor of SMEs are more pronounced in commerce, less
so for agriculture, services and manufacturing, and weakest for the transport and other sectors.”33
Increased Access to Credit: The above evidence shows that the financial sector has improved access to credit
for MSMEs – that is, more MSMEs are obtaining credit now than in the period prior to the DCA credit guarantees.
The remainder of this section reviews the factors responsible for increased access to credit and the likely role of
the DCA guarantees.
The “Exogenous Influences on Guarantee Performance” section of this report provides a complete discussion of
external factors affecting increased lending to MSMEs. The evidence that the increase in SME lending is largely an
outgrowth of an increasingly competitive banking sector that is actively seeking clients is overwhelming. Every
person the evaluation team asked about the factors affecting SME access to credit cited the increasingly
competitive banking sector that is actively seeking clients is overwhelming.
Impact of DCA guarantees: Several examples suggest that the DCA guarantees had an impact on increased
access to MSME credit at the margin (i.e., for the specific industries or firms represented by recipients of
guaranteed loans). Given the small number of guaranteed loans to a limited number of sectors, however, the
demonstration effect is likely small compared to the influence of the broader lending environment.
33 Reported in the July, 2005 press release of the Bank of Ghana’s Monetary Policy Committee. http://www.bog.gov.gh/index1.php?linkid=131&archiveid=302&page=4&adate=25/07/2005&SearchString=SMEs%20survey#302. Accessed February 25, 2009.
0.00%
0.50%
1.00%
1.50%
2.00%
2.50%
2001 2002 2003 2004 2005 2006
Perc
en
t o
f re
al
GD
P Community & Rural Banks
Financial NGOs
Credit Unions
Savings and Loans
Total
Ghana EcoBank DCA Guarantee Evaluation 28
Evidence from Ghana suggests that a demonstration effect is possible. An individual who manages another loan
guarantee program described his observation of impact level results of his program. He said he had observed an
increase in lending to the target sectors by non-guaranteed banks and attributed that increase in part to the
demonstration effect of his program. He described the impact pathway as follows. Non-guaranteed banks observe
the performance (i.e., loan servicing) of a guaranteed loan for a period of time. If the loan is performing well, these
banks approach the borrower to learn about loan terms and begin to enter the market if they can compete. An
additional impact of the guarantees is that these non-guaranteed banks have extended loan tenors (i.e., to 24
months compared to their usual 12 months) in a move towards the 60 month tenors provided by the guarantees
he manages.
Another person familiar with loan guarantees in Ghana also observed this behavior. He believed that the success of
a bank in a sector attracts the attention of competitors who then explore entering the market. He, and EcoBank
personnel, had also observed bank customers shopping loan terms around to other banks – particularly when
trying to refinance a loan. This represents another pathway to disseminating longer tenors to the broader financial
sector.
Evidence from a survey of five universal banks with SME lending programs conducted by the evaluation team
confirmed this finding. The three banks that responded stated that other banks’ experience in different industries
and with different loan sizes or tenors was either “very” or “somewhat” important in determining the banks
lending strategy.
FINDINGS AND CONCLUSIONS FOR QUESTION 7
Question: Did access to loans (or loan terms) improve for loans to the target sectors? If so, how and why?
Conclusion: Banks and MFIs have substantially increased lending to MSMEs indicating an increase in access to
credit. There is no evidence of widespread reductions in interest rates, increases in loan tenors, or reductions in
collateral requirements for SME lending in Ghana.
Findings: The Ghana Microfinance Institutions Network (GHAMFIN) (Ghana Microfinance Institutions Network
2008) reports that MFIs provided loans to 800,000 MSMEs in 2007 but there are no comparable data on bank
lending. Thus, while the value of lending to MSMEs has increased substantially, it is difficult to quantify the overall
extent of access to credit.
Two studies of interest rate spreads in Ghana revealed little change in lending interest rates over time (Akoena,
Aboagye, and Antwi-Asare undated; Gockel and Mensah 2006). EcoBank officials also said that the banks had not
reduced interest rates for guaranteed or non-guaranteed loans. Representatives of the banking sector interviewed
by the evaluation team, as well as other knowledgeable of the banking sector, reported that banks did not generally
compete on interest rates.
The evaluation team also found only limited anecdotal evidence of changes in collateral requirements. One USAID
TA contractor said that some banks had reduced collateral requirements for loans in the agricultural sector but
did not believe the practice was widespread. An EcoBank official stated that banks compete for qualified borrowers
through their customer services rather than through interest rates or collateral requirements citing examples of
relationship managers being available to customers 24 hours per day.

Ghana EcoBank DCA Guarantee Evaluation 29
VIII. SUMMARY OF CONCLUSIONS
In summary, the conclusions of the evaluation at the output, outcome, and impact levels are as follows.
OUTPUT CONCLUSIONS
The DCA guarantees complemented EcoBank’s strategy to transition from a largely wholesale bank to a
fully fledged retail bank with a corresponding increased emphasis on MSMEs. The guarantees allowed the
bank to gain experience with new industries/sectors and types of lending (i.e., financing capital
investments) that complemented this strategy.
EcoBank integrated the guarantee into its normal loan assessment process. It did not provide any special
training or alter normal loan assessment procedures. It did not actively market the guarantee to potential
borrowers because of the risk of moral hazard.
EcoBank’s use of the guarantees improved access to medium and long-term credit for some firms in the
target sectors. The guarantees gave EcoBank the protection from risk necessary to extend loan sizes and
tenors beyond its typical range. The guaranteed loans focused on the upper end of the spectrum of
qualified borrowers by size. In fact, loan sizes appear consistent with lending almost exclusively to
medium-sized enterprises. Guaranteed loans were larger, and consequently fewer in number, than
anticipated by USAID/Ghana but still fell within the size and tenor parameters established in the
Guarantee Agreements. Special waivers (2003 guarantee) and overly broad and imprecise definitions of
target sectors (2005 guarantee) rendered the target sectors defined in the Guarantee Agreements
irrelevant.
OUTCOME CONCLUSIONS
EcoBank increased its lending to SMEs substantially since becoming a guarantee partner. However, the
growth largely reflects the bank’s ongoing strategy to increase retail lending rather than an impact of the
guarantees. Experience with the DCA guarantees prompted the bank to increase lending to some new
industries and to extend some long-term loans for capital expenditures outside of the guarantee coverage.
However, these increases were small relative to the bank’s overall SME loan portfolio.
The single most important factor affecting EcoBank’s performance relative to guarantee objectives was its
desire, articulated in its strategy, to increase lending to MSMEs.
IMPACT CONCLUSIONS
Lending to MSMEs (a proxy for the target sectors of the guarantee) has increased substantially in Ghana
since 2002 (pre-guarantee). Anecdotal evidence suggests that loan guarantees may have a demonstration
effect. However, given the small number of industries/sectors represented by EcoBank’s guaranteed loans,
the effect of the DCA guarantees is likely very modest. Factors external to the guarantees (i.e., overall
growth in SME lending resulting from increasing bank liquidity and increased bank focus on the MSMEs
sector) are likely responsible for most of the observed increase in lending to MSMEs.
Banks and MFIs have substantially increased lending to MSMEs indicating an increase in access to credit.
There is no evidence of widespread reductions in interest rates, increases in loan tenors, or reductions in
collateral requirements for SME lending in Ghana.

Ghana EcoBank DCA Guarantee Evaluation 30
BIBLIOGRAPHY
Akoena, Dr. S. K., Dr. A. Q. Q. Aboagye, and Mr. T. O. Antwi-Asare. undated. "Banking industry structure and
interest rate spreads in Ghana (DRAFT)." Trade and Investment Program for a Competitive Export Economy:
Accra, Ghana.
Association of Ghana Industries. 2007. "AGI business climate survey 2007." Association of Ghana Industries, Accra,
Ghana.
Bank of Ghana. 2007. "Provision of consulting services for impact assessment study for SME financing schemes."
Bawumia, Mahamudu, Franklin Belnye, and Ofori Martin Enoch. 2005. "The determination of bank interest rate
spreads in Ghana: an empirical analysis of panel data." Bank of Ghana, Accra, Ghana.
Economist Intelligence Unit. 2009. "Country report: Ghana." Economist Intelligence Unit, London, UK.
Ghana Microfinance Institutions Network. 2008. "Performance benchmarks of microfinance institutions in Ghana."
Accra, Ghana.
Gockel, Augustine, and Sam Mensah. 2006. "Commercial bank interest rate spread in Ghana: determinants and
policy implications." Trade and Investment Program for a Competitive Export Economy: Accra, Ghana.
IFC. undated. Creating opportunities for small businesses, International Finance Corporation, World Bank Group.
International Monetary Fund. 2003. "Ghana: financial system stability update." IMF Country Report, No. 03/396.
International Monetary Fund, Washington, D.C.
Mensah, Sam. 2004. "A review of SME financing schemes in Ghana."

Ghana EcoBank DCA Guarantee Evaluation 31
ANNEXES
Annex A - Evaluation Framework and Interview Guides

GHANA ECOBANK DCA EVALUATION FRAMEWORK
EVALUATION QUESTIONS DATA SOURCES
(1) pre-field activities
(2) field activities
DATA COLLECTION
METHODS
(1) pre-field activities
(2) field activities
HOW DCA WILL USE THE EVALUATION
FINDINGS, CONCLUSIONS AND
RECOMMENDATIONS AND OTHER
COMMENTS
OUTPUT LEVEL (Loans Disbursed, Additionality…):
1a. How did the DCA guarantees fit into
EcoBank’s ongoing strategy? What
market potential did the DCA guarantee
help open for EcoBank?
1b. How did EcoBank implement its
loan guarantee programs (e.g., marketing
campaigns, changed terms, training,
revised staff structure and
responsibilities, improved
communications with branch offices,
etc.)? And why?
(1) DCA documents: Action
Packages, Guarantee
Agreements, CRB minutes,
Biennial Reviews, OMB PART,
(1) or (2) Mission documents
(2) Mission/ contractor/ staff
(2) EcoBank staff
(1) Review of data and
documents in
Washington/DCA; interviews
with DCA staff
(1) & (2) Review of
documents in USAID missions
(1) & (2) Interviews of
cognizant USAID / contractor
staff
(2) Review of EcoBank data
in the field
(2) Guided interviews with
EcoBank staff (HQ and
branches)
DCA use: Purposes 2 & 4 above and to enhance
discussions with potential guarantee partners; to enhance
the training that DCA provides to guarantee partners,
missions, et al.
Other Comments: this is primarily descriptive for each
guarantee partner.
2a. Did EcoBank use the DCA guarantee
to improve access to credit for the target
sectors? (i.e., did characteristics of
guaranteed loans differ from other loans
in ways that improved access?)
Indicators of improved access may
include:
Number of loans to target
sectors relative to pre-guarantee
(2002) baseline (absolute
(1) DCA Biennial Reviews
(2) Bank managers/staff (HQ &
branches)
(2) Bank electronic files (as
available)
(1) or (2) Bank annual reports
(1) or (2) Industry/Central bank
studies
(2)Mission technical officers,
CTOs and TA providers
(1) Documents review
(1) Interviews of cognizant
DCA staff
(2) Guided Interviews of
EcoBank staff. Given the
small number of loans,
probably reviewing each
separate loan.
DCA use: To report on loans to stakeholders and
Purposes 3 &4 above.
Other Comments: Question 2a is descriptive and
comparative for each guarantee partner, addressing what
happened with loans under guarantees vs. what would
likely have happened without the guarantees. Question
2b is explanatory, i.e., the extent to which the DCA
guarantees influenced change.
What we learn can affect what DCA does when talking

EVALUATION QUESTIONS DATA SOURCES
(1) pre-field activities
(2) field activities
DATA COLLECTION
METHODS
(1) pre-field activities
(2) field activities
HOW DCA WILL USE THE EVALUATION
FINDINGS, CONCLUSIONS AND
RECOMMENDATIONS AND OTHER
COMMENTS
improvement in access)
Proportion of loans to target
sector in portfolio (relative
improvement in access)
Value of loans to target sectors
relative to pre-guarantee (2002)
baseline
Proportion of portfolio value in
loans to target sectors relative
to pre-guarantee (2002)
baseline
Average (and median) loan size
and frequency distribution of
loans to target sectors relative
to pre-baseline (2002)
Average loan tenor for loans to
target sectors relative to pre-
guarantee (2002) baseline
Average percentage collateral
requirement for loans to target
sector relative to pre-guarantee
(2002) baseline
Types of collateral permitted
for loans to target sectors
relative to pre-guarantee (2002)
baseline
Percentage of new borrowers in
target sectors relative to pre-
guarantee (2002) baseline
Average interest rate for loans
to target sectors relative to pre-
(1) & (2) Analysis of EcoBank
electronic files on borrowers
covered by guarantee
to potential and actual guarantee partners, e.g., asking
them what they would change with a guarantee;
encouraging banks to do x, y, or z; and so on in
discussions; DCA TA and training to banks; and DCA
encouragement of missions to provide TA and training
aimed at increasing positive bank policies and behavior.
Because the number of guaranteed loans is very small
(12), the first four quantitative indicators are not likely to
be particularly informative. The remainder of the
quantitative indicators, however, will measure whether
characteristics of guaranteed loans are different than
other loans in the portfolio made to the target sectors.

EVALUATION QUESTIONS DATA SOURCES
(1) pre-field activities
(2) field activities
DATA COLLECTION
METHODS
(1) pre-field activities
(2) field activities
HOW DCA WILL USE THE EVALUATION
FINDINGS, CONCLUSIONS AND
RECOMMENDATIONS AND OTHER
COMMENTS
guarantee (2002) baseline
2b. To what extent did the DCA
guarantee influence observed/stated
changes in EcoBank’s loans to target
sectors? Etc
OUTCOME LEVEL (Partner Bank Behavior Change):
3a. To what extent was access to credit
in the target sectors increased outside of
the DCA guarantee?
Indicators from 2a applied to
EcoBank portfolio of loans to
target sector outside of
guarantee
3b. What factors at EcoBank were
responsible for achieving desired
outcomes (e.g., TA; bank staff training;
revised bank strategy, procedures and
structure; new management, etc.)?
(1) DCA documents: Action
Packages, CRB minutes, biennial
reviews
(1) or (2) Mission documents
(2) EcoBank electronic files (as
available) or samples of files
(2) EcoBank annual reports
(2) Mission/ contractor/ staff
(2) EcoBank staff
(1) Documents review
(2) Interviews of cognizant
Mission / contractor staff and
other stakeholders
(2) Guided Interviews of
EcoBank staff
(2) Analysis of EcoBank
electronic files on borrowers
covered by guarantee (either
sample of or full DCA loan
portfolio)
DCA use: Purposes 2, 3 & 4 above; to identify ways to
achieve desired outcomes when dealing with potential
guarantee recipients; to enhance the training that DCA
provides to guarantee partners, missions, et al.
Other comments: Question 3a. is both descriptive and
comparative (actual outcomes achieved through
guarantees vs. intended outcomes). Question 3b is
explanatory in nature (to identify factors associated with
why desired outcomes were achieved or not). Question
3c would be descriptive, and cross-cutting.
Question 3a has qualitative and quantitative components.
It will collect a qualitative assessment of whether access
to credit improved. It will also compare quantitative data
on portfolio characteristics at the pre-guaranteed (2002)
baseline to characteristics of the non-guaranteed
portfolio during and after the guarantees.
4a. Has EcoBank moved into any new
sectors/industries and types of borrowers
after their guarantees?
4b. If so, to what extent did the DCA
guarantees influence these decisions?
For both 4a and 4b:
(2) Mission technical officers,
CTOs and TA providers
(2) Bank managers/staff
(2) Guided Interviews
DCA use: Purposes 1 & 3.
Other comments: Question 4a is descriptive; question 4b
explanatory.

EVALUATION QUESTIONS DATA SOURCES
(1) pre-field activities
(2) field activities
DATA COLLECTION
METHODS
(1) pre-field activities
(2) field activities
HOW DCA WILL USE THE EVALUATION
FINDINGS, CONCLUSIONS AND
RECOMMENDATIONS AND OTHER
COMMENTS
How?
IMPACT LEVEL (Market Demonstration Effect):
5a. Did other, non-partner banks initiate
or increase lending to the target sectors?
If data are available, collect
data on indicators in 2a for
entire banking sector and
compare pre-guarantee (2002)
baseline characteristics during
and after the guarantees
5b. If so, to what extent was the DCA
guarantee to EcoBank responsible? How
and why?
(1) and (2) Sector/banking
reports (if available)
(2) EcoBank managers/staff
(2) Industry/bank associations in
the country/sector
(2) USAID TA providers
(2) Other key stakeholders
(1) and (2) Documents review
(2) Interviews of cognizant
USAID / other donor staff
/other stakeholders
(2)Guided interviews of
EcoBank staff
DCA use: Purposes 1 & 2.
Other comments: These questions will be answered
qualitatively, for the most part, citing available sectoral
data as appropriate.
6a. Did access to loans (or loan terms)
improve for loans to the target sectors?
6b. If so, how and why?
6c. If so, to what extent was the
EcoBank DCA guarantee responsible?
Same as for Question 5. Same as for Question 5. Same as for Question 5.
QUESTIONS THAT APPLY TO ALL THREE LEVELS—OUTPUT, OUTCOME AND IMPACT:
7a. What are the exogenous factors (e.g.,
financial sector reform, government
(1) Review of World Bank, and
other donor or research
(1) Documents review
DCA use: To set in context the Evaluation findings for
Questions 1 – 6.

EVALUATION QUESTIONS DATA SOURCES
(1) pre-field activities
(2) field activities
DATA COLLECTION
METHODS
(1) pre-field activities
(2) field activities
HOW DCA WILL USE THE EVALUATION
FINDINGS, CONCLUSIONS AND
RECOMMENDATIONS AND OTHER
COMMENTS
intervention, lender industry
competition, financial shocks, other
donor behavior, others?) that may have
affected access to credit for the target
sectors?
7b. How, it at all, have these factors
affected the performance of the DCA
guarantees? Did they affect EcoBank’s
lending to the target sector under the
guarantees? Did they affect EcoBank’s
lending to the target sector outside of the
guarantees? Did they affect lending to
the target sector by the broader banking
sector? If so, how?
documents / web sites
(2) Cognizant USAID /
contractor staff / other donor
representatives
(2) EcoBank managers/staff
Key stakeholders (e.g., central
banks, banking associations, etc.)
(2) Interviews of cognizant
USAID / contractor staff
(2) Guided interviews of
EcoBank staff
(2) Other donor / key
stakeholder interviews (TBD)

37
EcoBank Interview Guide
Questions 1a
1. Did the guarantees help EcoBank develop new markets that it would not have entered
without the guarantee?
a. If yes, what constraints did EcoBank face in these markets and how did DCA
guarantees address those constraints?
2. Did the guarantees help EcoBank expand more quickly into markets it was already
developing?
a. If yes, what constraints did EcoBank face in expanding more rapidly into these
markets and how did DCA guarantees address those constraints?
Questions 1b
1. Did EcoBank actively market guaranteed loans?
2. Did the terms EcoBank offered on guaranteed loans differ from those on loans that were
not guaranteed? How? Why?
3. Did EcoBank train staff specifically to assess borrowers for DCA-covered loans? How?
4. Did EcoBank do anything else to implement the loan guarantee programs? Describe?
Questions 2a_2
For each of the loans made under the guarantee?
1. When was the loan made?
2. Was this the first loan EcoBank made to this borrower?
3. Why was the borrower put under guarantee coverage?
4. Would EcoBank have extended a loan to this borrower without guarantee coverage? Why
or why not?
a. If yes, would the loan have been for a lower value without guarantee coverage? If
yes, why did the DCA guarantee affect loan size?
b. If yes, would the tenor of the loan have been different without the guarantee
coverage? If yes, why did the DCA guarantee affect loan tenor?
c. If yes, would the interest rate on the loan have been different without the
guarantee coverage? If yes, why did the DCA guarantee affect the interest rate?
5. What were the terms of the loan (confirm from records and fill in gaps)
a. Amount
b. Tenor/term
c. Interest rate
6. Collateral requirement (type, percent)
7. Did the borrower receive any other loans under the guarantee?
8. Has the borrower received any loans subsequent to the guaranteed loan that were not
covered by the guarantee?
a. If yes, how many?

38
b. If not, why not?
Questions 3a
1. To what extent did the DCA guarantees increase access to credit in the target sectors
within EcoBank but outside of the guarantee coverage? How?
2. On a scale from one to five where one is “not at all” and five is “a great deal”, to what
extent were the DCA guarantees responsible for increasing access to credit for the target
sectors within EcoBank but outside of DCA coverage?
Questions 3b
1. What factors associated with the DCA guarantee were responsible for increasing access
to credit in the target sector outside of the guarantee coverage? For example, did TA,
staff training, revised bank strategy, improved procedures, or other factors associated
with the DCA guarantee help increase access to credit? If so, how? How important were
each of these factors?
2. Are there other factors, other than the EcoBank guarantees, that could have improved
access to credit for the target sectors? If so, what are those factors? Explain.
3. Could EcoBank have done a better job of disseminating DCA guarantee results into its
broader portfolio in the target sectors? How?
Questions 4a/4b
1. Has EcoBank targeted any new market segments (industries, sectors, or types of
borrowers) since the DCA guarantee? Explain.
a. If so, to what extent did the DCA guarantee influence the decision to target new
market segments? How?
b. On a scale from one to five where one means “not at all” and five means “a great
deal”, to what did EcoBank’s DCA guarantee influence EcoBank’s decision to
target new market segments?
Questions 5a/5b
1. Did any banks other than EcoBank increase their lending to the target sectors?
c. If so, to what extent did the DCA guarantee to EcoBank influence these banks’
decisions? How?
d. What other factors, if any, might have been responsible for other banks’
increasing lending to the target sectors? Explain.
2. On a scale from one to five where one means “not at all” and five means “a great deal”,
to what extent did EcoBank’s DCA guarantee influence increased lending to the target
sector by other banks?
Questions 6a/6b/6c

39
1. Did access to loans, or loan terms, improve for the target sector?
a. If so, how?
b. If so, to what extent were the DCA guarantees to EcoBank responsible for the
improved access? How?
c. What other factors may have influenced access to credit for the target sector?
How?
d. On a scale from one to five where one means “not at all” and five means “a great
deal”, to what extent was the EcoBank DCA guarantee responsible for increased
access to loans in the target sectors?
2. Could EcoBank’s DCA guarantee have had a greater impact on access to credit in the
target sectors? How?

40
Banking Associations Interview Guide
Questions 1b
1. Did EcoBank actively market guaranteed loans?
2. Did the terms EcoBank offered on guaranteed loans differ from those on loans that were
not guaranteed? How? Why?
3. Did EcoBank train staff specifically to assess borrowers for DCA-covered loans? How?
4. Did EcoBank do anything else to implement the loan guarantee programs? Describe?
Questions 2a_1
1. Are the characteristics of borrowers and loans made under the DCA coverage different
than those made outside the DCA coverage (e.g., sectors, interest rates, tenors, collateral
requirements)?
a. If yes, how are they different?
b. If yes, to what extent was the DCA coverage responsible for the difference and
how was it responsible? (scale question?)
2. Are there other factors that might have influenced EcoBank to make these loans without
the guarantee? What factors? Explain.
3. Could EcoBank have improved access to credit in the target sectors more by using the
DCA guarantees differently? How? Explain.
Questions 3a
1. To what extent did the DCA guarantees increase access to credit in the target sectors
within EcoBank but outside of the guarantee coverage? How?
2. On a scale from one to five where one is “not at all” and five is “a great deal”, to what
extent were the DCA guarantees responsible for increasing access to credit for the target
sectors within EcoBank but outside of DCA coverage?
Questions 3b
1. What factors associated with the DCA guarantee were responsible for increasing access
to credit in the target sector outside of the guarantee coverage? For example, did TA,
staff training, revised bank strategy, improved procedures, or other factors associated
with the DCA guarantee help increase access to credit? If so, how? How important were
each of these factors?
2. Are there other factors, other than the EcoBank guarantees, that could have improved
access to credit for the target sectors? If so, what are those factors? Explain.
3. Could EcoBank have done a better job of disseminating DCA guarantee results into its
broader portfolio in the target sectors? How?

41
Questions 4a/4b
1. Has EcoBank targeted any new market segments (industries, sectors, or types of
borrowers) since the DCA guarantee? Explain.
e. If so, to what extent did the DCA guarantee influence the decision to target new
market segments? How?
f. On a scale from one to five where one means “not at all” and five means “a great
deal”, to what did EcoBank’s DCA guarantee influence EcoBank’s decision to
target new market segments?
Questions 5a/5b
1. Did any banks other than EcoBank increase their lending to the target sectors?
g. If so, to what extent did the DCA guarantee to EcoBank influence these banks’
decisions? How?
h. What other factors, if any, might have been responsible for other banks’
increasing lending to the target sectors? Explain.
2. On a scale from one to five where one means “not at all” and five means “a great deal”,
to what extent did EcoBank’s DCA guarantee influence increased lending to the target
sector by other banks?
Questions 6a/6b/6c
1. Did access to loans, or loan terms, improve for the target sector?
a. If so, how?
b. If so, to what extent were the DCA guarantees to EcoBank responsible for the
improved access? How?
c. What other factors may have influenced access to credit for the target sector?
How?
d. On a scale from one to five where one means “not at all” and five means “a great
deal”, to what extent was the EcoBank DCA guarantee responsible for increased
access to loans in the target sectors?
2. Could EcoBank’s DCA guarantee have had a greater impact on access to credit in the
target sectors? How?

42
Donors Interview Guide
Questions 3a
1. To what extent did the DCA guarantees increase access to credit in the target sectors
within EcoBank but outside of the guarantee coverage? How?
2. On a scale from one to five where one is “not at all” and five is “a great deal”, to what
extent were the DCA guarantees responsible for increasing access to credit for the target
sectors within EcoBank but outside of DCA coverage?
3. What other factors may have affected access to credit in the target sectors since 2002?
Questions 5a/5b
1. Did any banks other than EcoBank increase their lending to the target sectors?
i. If so, to what extent did the DCA guarantee to EcoBank influence these banks’
decisions? How?
j. What other factors, if any, might have been responsible for other banks’
increasing lending to the target sectors? Explain.
2. On a scale from one to five where one means “not at all” and five means “a great deal”,
to what extent did EcoBank’s DCA guarantee influence increased lending to the target
sector by other banks?
Questions 6a/6b/6c
1. Did access to loans, or loan terms, improve for the target sector?
e. If so, how?
f. If so, to what extent were the DCA guarantees to EcoBank responsible for the
improved access? How?
g. What other factors may have influenced access to credit for the target sector?
How?
h. On a scale from one to five where one means “not at all” and five means “a great
deal”, to what extent was the EcoBank DCA guarantee responsible for increased
access to loans in the target sectors?
i. Could EcoBank’s DCA guarantee have had a greater impact on access to credit in
the target sectors? How?

43
Industry Associations Interview Guide
Questions 3a
1. To what extent did the DCA guarantees increase access to credit in the target sectors
within EcoBank but outside of the guarantee coverage? How?
2. On a scale from one to five where one is “not at all” and five is “a great deal”, to what
extent were the DCA guarantees responsible for increasing access to credit for the target
sectors within EcoBank but outside of DCA coverage?
3. Are there other factors, other than the EcoBank guarantees, that could have improved
access to credit for the target sectors? If so, what are those factors? Explain.
Questions 4a/4b
1. Has EcoBank targeted any new market segments (industries, sectors, or types of
borrowers) since the DCA guarantee? Explain.
k. If so, to what extent did the DCA guarantee influence the decision to target new
market segments? How?
2. On a scale from one to five where one means “not at all” and five means “a great deal”,
to what did EcoBank’s DCA guarantee influence EcoBank’s decision to target new
market segments?

44
TA Providers Interview Guide
Questions 3b
1. What factors associated with the DCA guarantee were responsible for increasing access
to credit in the target sector outside of the guarantee coverage? For example, did TA,
staff training, revised bank strategy, improved procedures, or other factors associated
with the DCA guarantee help increase access to credit? If so, how? How important were
each of these factors?
2. Are there other factors, other than the EcoBank guarantees, that could have improved
access to credit for the target sectors? If so, what are those factors? Explain.
3. Could EcoBank have done a better job of disseminating DCA guarantee results into its
broader portfolio in the target sectors? How?
Questions 4a/4b
1. Has EcoBank targeted any new market segments (industries, sectors, or types of
borrowers) since the DCA guarantee? Explain.
a. If so, to what extent did the DCA guarantee influence the decision to target new
market segments? How?
b. On a scale from one to five where one means “not at all” and five means “a great
deal”, to what did EcoBank’s DCA guarantee influence EcoBank’s decision to
target new market segments?

45
USAID/Ghana Interview Guide
Questions 1a
1. Did the guarantees help EcoBank develop new markets that it would not have entered
without the guarantee?
b. If yes, what constraints did EcoBank face in these markets and how did DCA
guarantees address those constraints?
2. Did the guarantees help EcoBank expand more quickly into markets it was already
developing?
c. If yes, what constraints did EcoBank face in expanding more rapidly into these
markets and how did DCA guarantees address those constraints?
Questions 1b
1. Did EcoBank actively market guaranteed loans?
2. Did the terms EcoBank offered on guaranteed loans differ from those on loans that were
not guaranteed? How? Why?
3. Did EcoBank train staff specifically to assess borrowers for DCA-covered loans? How?
4. Did EcoBank do anything else to implement the loan guarantee programs? Describe?
Questions 2a_1
1. Are the characteristics of borrowers and loans made under the DCA coverage different
than those made outside the DCA coverage (e.g., sectors, interest rates, tenors, collateral
requirements)?
a. If yes, how are they different?
b. If yes, to what extent was the DCA coverage responsible for the difference and
how was it responsible? (scale question?)
2. Are there other factors that might have influenced EcoBank to make these loans without
the guarantee? What factors? Explain.
3. Could EcoBank have improved access to credit in the target sectors more by using the
DCA guarantees differently? How? Explain.
Questions 3a
1. Did the DCA guarantees increase access to credit in the target sectors within EcoBank
but outside of the guarantee coverage? How?
2. On a scale from one to five where one means “not at all responsible” and five means
“critically responsible”, to what extent were the DCA guarantees responsible for
EcoBank decisions to enter new markets outside of the DCA coverage? Select one of: 1
(Not at all responsible), 2 (Slightly responsible), 3 (Somewhat responsible), 4 (Very
responsible), or 5 (Critically responsible).

46
3. Are there other factors, other than the EcoBank guarantees, that could have improved
access to credit for the target sectors? If so, what are those factors? Explain.
Questions 3b
1. What factors associated with the DCA guarantee were responsible for increasing access
to credit in the target sector outside of the guarantee coverage? For example, did TA,
staff training, revised bank strategy, improved procedures, or other factors associated
with the DCA guarantee help increase access to credit? If so, how? How important were
each of these factors?
2. Are there other factors, other than the EcoBank guarantees, that could have improved
access to credit for the target sectors? If so, what are those factors? Explain.
3. Could EcoBank have done a better job of disseminating DCA guarantee results into its
broader portfolio in the target sectors? How?
Questions 4a/4b
1. Has EcoBank targeted any new market segments (industries, sectors, or types of
borrowers) since the DCA guarantee? Explain.
c. Did the DCA guarantee influence the decision to target new market segments?
How?
d. On a scale from one to five where one means “not at all” and five means “a great
deal”, to what did EcoBank’s DCA guarantee influence EcoBank’s decision to
target new market segments?
Questions 5a/5b
1. Did any banks other than EcoBank increase their lending to the target sectors since the
EcoBank DCA guarantee?
e. If so, to what extent did the DCA guarantee to EcoBank influence these banks’
decisions? How?
f. What other factors, if any, might have been responsible for other banks’
increasing lending to the target sectors? Explain.
2. On a scale from one to five where one means “not at all responsible” and five means
“critically responsible”, to what extent were EcoBank’s DCA guarantees responsible for
increased lending to the target sector by other banks? Select one of: 1 (Not at all
responsible), 2 (Slightly responsible), 3 (Somewhat responsible), 4 (Very responsible), or
5 (Critically responsible).
Questions 6a/6b/6c
1. Did access to loans, or loan terms, improve for the target sector?
j. If so, how?

47
k. If so, to what extent were the DCA guarantees to EcoBank responsible for the
improved access? How?
l. What other factors may have influenced access to credit for the target sector?
How?
2. On a scale from one to five where one means “not at all responsible” and five means
“critically responsible”, to what extent was the EcoBank DCA guarantee responsible for
improving loan terms to firms in the target sectors?? Select one of: 1 (Not at all
responsible), 2 (Slightly responsible), 3 (Somewhat responsible), 4 (Very responsible), or
5 (Critically responsible).
3. Could EcoBank’s DCA guarantee have had a greater impact on access to credit in the
target sectors? How?

48
MFI Interview Guide
General questions
1. Start by explaining a bit about GHAMFIN and what GHAMFIN does.
a. When and why was GHAMFIN created?
b. What is GHAMFIN’s role - does GHAMFIN regulate MFIs?
c. How broadly does GHAMFIN represent the MFI sector?
2. How do banks view MFIs – competitors/clients? If clients, how classified? (i.e. SME)
3. Where do MFIs get their capital – private or donor financing, deposits?
a. Which banks provide private financing? (Ecobank)
b. What are terms of private financing (interest rates, collateral, and tenor)? Has this
changed over time?
c. Constraints to accessing capital?
d. Trends in access to capital? Private versus donor.
4. Trends in MFI lending – volume, clients, terms, sectors.
5. What factors have most influenced access to credit for MFIs?
Questions 3a
1. To what extent did the DCA guarantees increase access to credit in the target sectors
within EcoBank but outside of the guarantee coverage? How?
2. On a scale from one to five where one is “not at all” and five is “a great deal”, to what
extent were the DCA guarantees responsible for increasing access to credit for the target
sectors within EcoBank but outside of DCA coverage?
3. Are there other factors, other than the EcoBank guarantees, that could have improved
access to credit for the target sectors? If so, what are those factors? Explain.
Questions 5a/5b
1. Did any MFIs increase their lending to the target sectors?
g. If so, to what extent did the DCA guarantee to EcoBank influence these MFI’s
decisions? How?
h. What other factors, if any, might have been responsible for other MFIs increasing
lending to the target sectors? Explain.
2. On a scale from one to five where one means “not at all” and five means “a great deal”,
to what extent did EcoBank’s DCA guarantee influence increased lending to the target
sector by MFIs?
Questions 6a/6b/6c
1. Did access to loans, or loan terms, improve for the target sector?
m. If so, how?

49
n. If so, to what extent were the DCA guarantees to EcoBank responsible for the
improved access? How?
o. What other factors may have influenced access to credit for the target sector?
How?
p. On a scale from one to five where one means “not at all” and five means “a great
deal”, to what extent was the EcoBank DCA guarantee responsible for increased
access to loans in the target sectors?
q. Could EcoBank’s DCA guarantee have had a greater impact on access to credit in
the target sectors? How?

50
Bank of Ghana (Central Bank) Interview Guide
Lending Environment
1. To start with, perhaps you could give us some background on the private sector’s access
to credit in Ghana.
a. Do, or have, banks had sufficient liquidity to serve private sector credit needs.
b. Are banks willing to lend to the private sector?
c. What have been the key factors affecting private sector access to credit in Ghana?
d. Have interest rates, loan tenors, or collateral requirements changed much over
time?
2. We are particularly interested in SMEs and their access to credit. We understand that this
is limited. Is this true?
a. What are the key constraints to SMEs access to credit?
3. Has access to credit for SME’s improved?
a. If so, what are the key factors responsible for increasing SME access to credit?
4. Do you think USAID’s DCA loan guarantees to EcoBank had any impact on increasing
access to credit for SMEs?
5. Are there any historic data on lending to SMEs, volume and value?
6. I’m trying to put together an historic picture (2002-present) of private sector lending in
Ghana using data from the BoG. Which data series would best represent DMB bank
holdings of government debt?
7. Are you aware of any data on lending by institutions that are not DMBs?
8. I got data on DMB lending by sector from the BoG Annual Reports. But it is not
consistent (i.e., reported every year or in the same format). Can you tell me where I might
find these data for 2002-2008?

51
Annex B – Contact List Name Title Organization
Joana Mensah Country/Regional Risk Manager-WAMZ & Head, Credit Centre EcoBank
Abdulai Abdul-Rahman Head, SME Banking EcoBank
Gordon Nyamekye-Pratt Retail Risk Manager EcoBank
Paul K. Acquah Head, Credit Administration Unit, Risk Management Department EcoBank
Brian Dusza Office Director, Economic Growth Office USAID/Ghana
Katerina S. Ntep Deputy Resident Country Director Millennium Challenge Corporation
Kwabena Appenteng USAID/Ghana (former) Nicholas H. Railston-Brown Country Director TechnoServe
Dr. Susan B. Hester Enabling Environment Director Chemonics/TIPCEE
Michael Brown Chief of Party Chemonics/TIPCEE
Lauren Ruth Deputy Chief of Party Chemonics/TIPCEE
Kobina Amoah Director, Microfinance Unit Ministry of Finance and Economic Planning
Dr. Sam Mensah Technical Director Ministry of Finance and Economic Planning
Clara Fosu Deputy Director GHAMFIN
Isaac Hagan Private Sector Development Strategy Coordinator Ministry of Trade and Industry
Wilson Atta Krofah President Ghana National Chamber of Commerce and Industry
Dr. William Steel World Bank / Institute of Statistical, Social and Economic Research
Dr. Mahamudu Bawumia Deputy Governor (former) Bank of Ghana (former)
Jude Kofi Arthur President / Managing Director Ghana Association of Bankers / First Atlantic Bank
Sam Akyianu Programme Manager IFC
Daniel Boakye Economist World Bank
Duke Osam-Duodu Deputy Managing Director Association of Rural Banks Apex Bank Ltd.
Enoch R. Arkaifie Credit Manager Association of Rural Banks Apex Bank Ltd.
Abdul-Raheem Iddi-Puyo Micro Finance Officer Association of Rural Banks Apex Bank Ltd.
Philip Asare Chief Financial Officer Opportunity International
Matthew Armah Chief Operating Officer Millennium Development Authority / Amex (former)
Nana Opare Djan General Secretary Association of Financial NGOs Magnus Amoa-Bosompem National Vice-Chairman Association of Financial NGOs

52


