25
GHG Inventory Report GHG Inventory Report Prepared By: Thomas Szatkowski, ARAMARK G H G December, 2008 Rosemont College Rosemont College
| Date post: | 18-Dec-2015 |
| Category: |
Documents |
| View: | 215 times |
| Download: | 0 times |

GHG Inventory ReportGHG Inventory Report
Prepared By: Thomas Szatkowski, ARAMARK
GHG
December, 2008
Rosemont CollegeRosemont College

2GHG
Executive Summary
• Team Members• Executive Summary• Introduction
– Presidents Climate Commitment– Greenhouse Gas Inventory Approach and Process
• Carbon Footprint– Baseline school year ending 2007 – Energy Use– GHG Emissions– Energy Consumption
• Conclusion– Rosemont’s Carbon Footprint– Rosemont’s Next Steps

3GHG
Climate Commitment-Team Members
Advisory Panel - ARAMARK
James Toth, District Manager Eastern Region
Christopher Flouris, Project Engineer
Advisory Panel - ARAMARK
James Toth, District Manager Eastern Region
Christopher Flouris, Project Engineer
Rosemont College, Climate Commitment Committee
Sharon Hirsh Ph.D., President of the CollegeSr. Jeanne Hatch, VP of MissionThomas Szatkowski, Director of FacilitiesMatthew Ferry, Assistant Director of FacilitiesAnn Marshall, Infrastructure Committee & AlumMichelle Moravec, FacultyPatricia Gallagher, Food Service DirectorBridget Cook, Student
Project Team
Thomas Szatkowski, Director of FacilitiesMatthew Ferry, Manager of FacilitiesButch Brown, Director of OperationsElsina Amedova, Office Assistant, FacilitiesPatricia Peterson, Office Manager, Facilities
Project Team
Thomas Szatkowski, Director of FacilitiesMatthew Ferry, Manager of FacilitiesButch Brown, Director of OperationsElsina Amedova, Office Assistant, FacilitiesPatricia Peterson, Office Manager, Facilities

4GHG
Executive Summary
• The Greenhouse Gas Inventory fulfills only the first year terms of the American College and University Presidents Climate Commitment (ACUPCC)
• Determines Rosemont’s Carbon Footprint
– Measure of the impact due to human activities on the environment in terms of amount of greenhouse gases produced
• This Greenhouse Gas Inventory was performed in the Spring/Summer/Fall of 2008 using the Clean-Air Cool-Planet’s Carbon Calculator (www.cleanair-coolplanet.org)
• Report is inclusive of all campus operations and activities

Image from:http://cheeju.files.wordpress.com/2007/10/earth-space002.jpg
IntroductionIntroduction

6GHG
President’s Climate Commitment
(ACUPCC)
GHG

7GHG
Contextual Overview
• Rosemont College, School Year Ending 2007– Rosemont, PA
– 397,124 GSF
– 498 Full-time Students, 329 Part Time Students
– 75 Faculty, 150 Staff
Building Space Allocation
35%
37%
15%
4%9%
Residence
Instructional
Miscellaneous
Athletics
Food/ Dining

8GHG
Greenhouse Gas Inventory Approach & Process
2007/08
May Apr Jun Jul DecMay
ACUPCC Signedby Rosemont College
GHG Process Overview Meeting
Meet with Department Leaders
DataCollection
Data Entry&
Quality Analysis
MarFeb
DataFinalization
Report Development
AASHEReport
DUE
PresentationOf Findings
Assignment & AccountabilityAssignment & Accountability
- Determine departmental participation and department leader- Prepare and submit data request templates- Review department roles and responsibilities
Meeting withPerson(s)
Accountable
Meeting withPerson(s)
Accountable
Actions & Deadlines Defined
Actions & Deadlines Defined
- Review collection process with each department lead- Discuss department accountability and communication protocols- Meet with student groups- Define collection timeline and deadlines
- Consolidation of data entry submittals from each department leader- Analyze data, make assumptions and document anomalies- Present data findings with Institution’s Environmental Committee- Provide report for submission to ACUPCC by Rosemont College-The college was granted an extension for filing the GHG Survey to Jan. 15, 2009
3/26/20083/26/2008
4/3/20084/3/2008
12/22/0812/22/08

9GHG
Emission Factors
• All results are reported in Carbon Dioxide Equivalents, eCO2
– Allows comparison of all types of greenhouse gases
– Converted using respective individual heat trapping potential (global warming potential)
• Intergovernmental Panel on Climate Change (IPCC)– Provides the accepted
values for global warming potentials (GWP)
Carbon EquivalentsGas 2007 IPCC
GWPCarbon Dioxide – CO2 1
Methane – CH4 25
Nitrous Oxide – N2O 298
Hydrofluorocarbon – HFC-23 14,800
Hydrofluorocarbon – HFC-134a
1,430
Sulfur Hexafluoride – SF6 22,800

10GHG
Site and Source Emissions
– PECO– Rosemont's Electric Region is Mid-Atlantic Area
Council (MAAC)– Electricity Production Fuel Mixture Consists of
Nuclear, Natural Gas, #6 Fuel Oil, and #2 Fuel Oil
– Natural Gas– #2 Fuel Oil
– Student, Faculty & Staff Commuter Trips– University Fleet Vehicles– Faculty & Staff Air Miles
– HCFC-22
– Landfill with CH4 recovery and flaring
– Synthetic & Organic Fertilizer
Purchased Electricity
Stationary Sources
Transportation
Refrigerants
Agriculture
Solid Waste
Carbon FootprintCarbon Footprint

12GHG
Footprint Calculation
• Collect University Data– Purchased Electricity– Purchased Natural Gas & # 2 Fuel Oil– Aggregate Transportation– Refrigerant Usage– Solid Waste Disposal
• Clean Air-Cool Planet Campus Carbon Calculator (CA-CP)– Input Data into CA-CP– CA-CP Converts to Generated Emissions

13GHG
Greenhouse Gas Emission Breakdown
• Purchased Electricity, Natural Gas, and #2 Fuel Oil were responsible for 61% and Transportation 37% of Rosemont's total GHG emissions in 2007.
Source Energy Consumed (MMBtu) eCO2 Emitted (Metric Tonnes)
Source Energy Consumed (MMBtu) eCO2 Emitted (Metric Tonnes)
Electricity 19,694 841
Transportation 21,998 1,579
Natural Gas/Oil 32,852 1,772
Refrigerants n/a 35
Solid Waste n/a 32
Agriculture n/a 2
Totals 74,544 4,261

14GHG
Transportation
– Commuter• Students, Faculty & Staff
– University Fleet• Facilities Vehicles• Sports team travel
– Air Travel• Most greenhouse gas intensive• Faculty & Staff
– 176,926 gallons of gas consumed– 1,579 metric tonnes eCO2 emitted– 37% of total eCO2 emissions
Rosemont
2007 School Year

15GHG
Transportation
• Transportation was responsible for 37% of the College’s 2007 GHG emissions
Type of Transportation Gasoline Consumption (gal) Emissions (MT eCO2)
Student Commuters 108,315 1,009
Faculty/Staff Commuters 54,543 492
Air Travel 9,517 37
University Fleet 4,551 41
Total 176,926 1,579

16GHG
Campus Refrigerants
– Main refrigerant used: HCFC-22– Used in Air Conditioning Applications– Release hydrofluorocarbons (HFC’s)
• Highest global warming potential
– 0.1125 metric tonnes of refrigerant used
– 35 metric tonnes of eCO2 emitted
– < 1% of total eCO2 emissions
Rosemont
2007 School Year
17GHG
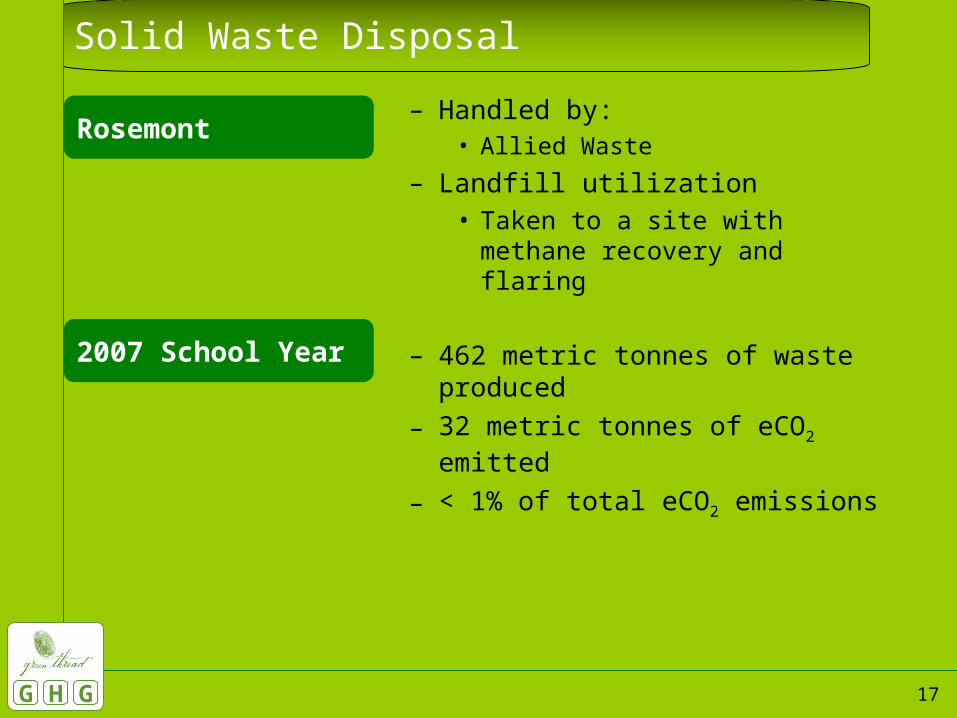
Solid Waste Disposal
– Handled by:• Allied Waste
– Landfill utilization• Taken to a site with methane
recovery and flaring
– 462 metric tonnes of waste produced
– 32 metric tonnes of eCO2 emitted
– < 1% of total eCO2 emissions
Rosemont
2007 School Year

18GHG
Campus Agriculture
– Emissions from synthetic/organic fertilizer
• 24% nitrogen content• Releases nitrous oxide
– 1.2 metric tonnes applied
– 2 metric tonnes of eCO2 emitted
– < 1% of total eCO2 emissions
Rosemont
2007 School Year

Image from: http://a.abcnews.com/images/Technology/pd_earth_hand_070904_ms.jpg
ConclusionConclusion

20GHG
Rosemont' Carbon Footprint
• Main Contributors:– 61% Powering, Heating and Cooling Buildings
– 37% Transportation
• Rosemont emitted 4261 metric tonnes of eCO2 in 2007

21GHG
Rosemont’s Next Steps
– Rosemont College was granted an extension to file the GHG Inventory, Submit to AASHE by January 15, 2009
– Continue data input via CA-CP database.– Annually submit inventory to AASHE.
– The college does not require LEED certification, however the college has committed to building to a minimum Silver LEED standard.
– The College has adopted an Energy Star procurement policy.– Promote use of public transportation. R 5 & R 100 Trains. – The College has a policy for social responsibility in investing;
the College has a proposal through the finance committee to look into this action item in detail.
– Continue participation in RecycleMania competition adopting three or more measures to reduce waste.
– Develop an action plan to aspire for climate neutrality.– Identifies major greenhouse gas emission sources and
general reduction strategies.– Submit to AASHE by Sept. 15, 2009.
1. GHG Inventory
2. Tangible Actions
3. Action Plan

22GHG
Rosemont’s Next Steps: To Do Action Plan
– Emissions trajectory for “business as usual”
– Determine date for aspiring to achieve climate neutrality as soon as possible
– Determine mitigation strategies and action items to reduce energy and GHG emissions
– Calculate financial impact exposures for alternate action items
– Incorporate climate neutrality and sustainability into curriculum and other educational experience for students
– Implement actions to expand research and other efforts to achieve climate neutrality
– Compile action plan into report format in compliance with AASHE
– Submit to AASHE by Sept. 15, 2009
Analyze Data
Target Date
Reduction Plan
Financial Impacts
Sustainability
Action Plan
Research
23GHG
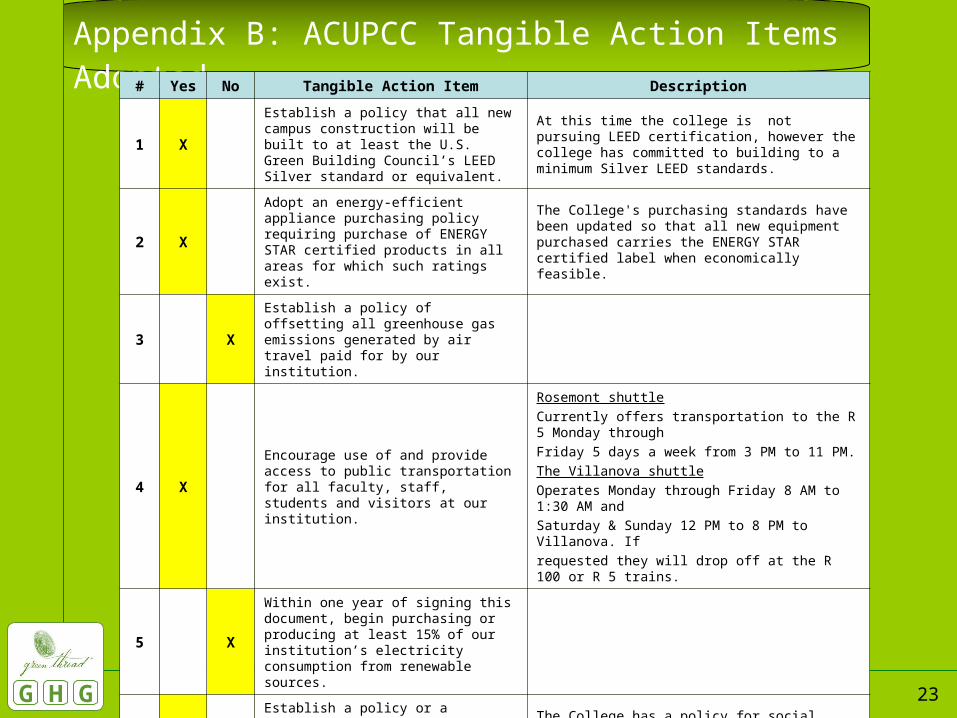
Appendix B: ACUPCC Tangible Action Items Adopted # Yes No Tangible Action Item Description
1 X
Establish a policy that all new campus construction will be built to at least the U.S. Green Building Council’s LEED Silver standard or equivalent.
At this time the college is not pursuing LEED certification, however the college has committed to building to a minimum Silver LEED standards.
2 X
Adopt an energy-efficient appliance purchasing policy requiring purchase of ENERGY STAR certified products in all areas for which such ratings exist.
The College's purchasing standards have been updated so that all new equipment purchased carries the ENERGY STAR certified label when economically feasible.
3 XEstablish a policy of offsetting all greenhouse gas emissions generated by air travel paid for by our institution.
4 XEncourage use of and provide access to public transportation for all faculty, staff, students and visitors at our institution.
Rosemont shuttle
Currently offers transportation to the R 5 Monday through
Friday 5 days a week from 3 PM to 11 PM.
The Villanova shuttle
Operates Monday through Friday 8 AM to 1:30 AM and
Saturday & Sunday 12 PM to 8 PM to Villanova. If
requested they will drop off at the R 100 or R 5 trains.
5 X
Within one year of signing this document, begin purchasing or producing at least 15% of our institution’s electricity consumption from renewable sources.
6X
Establish a policy or a committee that supports climate and sustainability shareholder proposals at companies where our institution’s endowment is invested.
The College has a policy for social responsibility in investing; the College has a proposal through the finance committee to look into this action item in detail.
7 X
Participate in the Waste Minimization component of the national RecycleMania competition, and adopt 3 or more associated measures to reduce waste.
The college participates in the National RecycleMania Competition. We have recently converted to single stream recycling. The benefits are more items can be recycled and can be commingled in the same container.

24GHG
Appendix C: Carbon Equivalents
• The EPA’s Greenhouse Gas Equivalencies Calculator was used to convert Rosemont’s emissions.
• To offset Rosemont’s total emissions from 2007, 968 acres would have to be filled completely with pine trees.
• Rosemont’s 2007 emissions is equivalent to the amount of greenhouse gases produced annually by 780 passenger vehicles.
Image from: http://www.nature.org/wherewework/northamerica/states/delaware/preserves/art12413.html
http://smgenglish.typepad.com/photos/uncategorized/2007/07/24/traffic.jpg
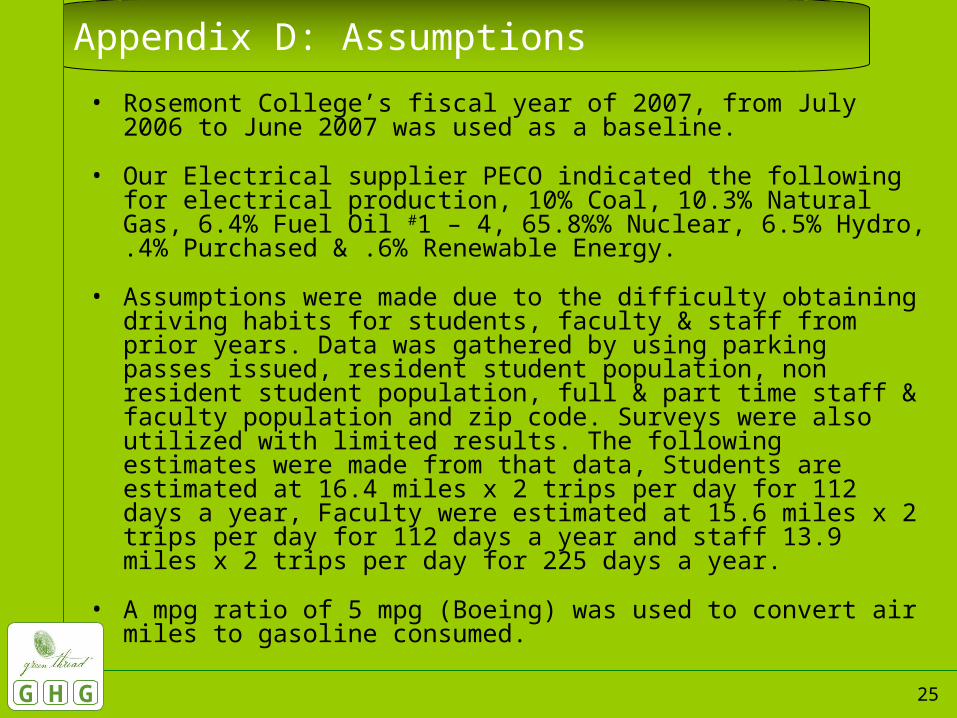
25GHG
• Rosemont College’s fiscal year of 2007, from July 2006 to June 2007 was used as a baseline.
• Our Electrical supplier PECO indicated the following for electrical production, 10% Coal, 10.3% Natural Gas, 6.4% Fuel Oil #1 – 4, 65.8%% Nuclear, 6.5% Hydro, .4% Purchased & .6% Renewable Energy.
• Assumptions were made due to the difficulty obtaining driving habits for students, faculty & staff from prior years. Data was gathered by using parking passes issued, resident student population, non resident student population, full & part time staff & faculty population and zip code. Surveys were also utilized with limited results. The following estimates were made from that data, Students are estimated at 16.4 miles x 2 trips per day for 112 days a year, Faculty were estimated at 15.6 miles x 2 trips per day for 112 days a year and staff 13.9 miles x 2 trips per day for 225 days a year.
• A mpg ratio of 5 mpg (Boeing) was used to convert air miles to gasoline consumed.
Appendix D: Assumptions


