Erlacher et al 44 A GPU-based Parallelization Approach to conduct Spatially- Explicit Uncertainty and Sensitivity Analysis in the Application Domain of Landscape Assessment GI_Forum 2017, Issue 1 Page: 44 - 58 Full Paper Corresponding Author: [email protected]DOI: 10.1553/giscience2017_01_s44 Christoph Erlacher 1,3 , Piotr Jankowski 2 , Thomas Blaschke 3 , Gernot Paulus 1 and Karl- Heinrich Anders 1 1 Carinthia University of Applied Sciences, Department of Geoinformation and Environmental Technologies 2 San Diego State University, Department of Geography 3 University of Salzburg, Geoinformatics – Z_GIS Abstract This paper illustrates a CUDA GPU-based concept to accelerate the computationally intensive calculations of performing spatially-explicit uncertainty and sensitivity analysis in multi-criteria decision-making models. Uncertainty and sensitivity analysis is a two-step approach to validating the robustness of spatial- and non-spatial model solutions. The uncertainty analysis quantifies the variability of model outcomes, while the sensitivity analysis accounts for the contributions of model inputs to the overall model output variability. The proposed solution is applicable for large-scale spatial problems that incorporate millions of alternatives and hundreds of thousands of simulation runs. Furthermore, this GPU-based concept represents a low-cost approach in comparison to high-performance computing that incorporates super computers. Additionally, the concept allows the integration of different decision rules (e.g. simple additive weighting, ideal point, ordered weighting averaging, or analytical hierarchy process) in order to evaluate the performance of the alternatives involved. The proposed approach was tested on a landscape assessment example in order to identify the variability of the model outcomes with respect to the criteria ‘Compactness’, ‘Mean Patch Area’, ‘Relief Energy’ and ‘Variety’ that define landscape diversity. Keywords: spatially-explicit uncertainty and sensitivity analysis, spatial multi-criteria decision making, parallelization, GPU, landscape assessment. 1 Introduction Spatial multi-criteria decision making (S-MCDM) models support decision makers in a wide variety of application domains (e.g. natural hazard risk assessment, allocation of funds for sustainable agriculture, or landscape impact assessment of infrastructure projects).
Christoph Erlacher1,3, Piotr Jankowski2, Thomas Blaschke3, Gernot Paulus1 and Karl-
Heinrich Anders1
1Carinthia University of Applied Sciences, Department of Geoinformation and
Environmental Technologies 2San Diego State University, Department of Geography 3University of Salzburg, Geoinformatics – Z_GIS
Abstract
This paper illustrates a CUDA GPU-based concept to accelerate the computationally
intensive calculations of performing spatially-explicit uncertainty and sensitivity analysis in
multi-criteria decision-making models. Uncertainty and sensitivity analysis is a two-step
approach to validating the robustness of spatial- and non-spatial model solutions. The
uncertainty analysis quantifies the variability of model outcomes, while the sensitivity
analysis accounts for the contributions of model inputs to the overall model output
variability. The proposed solution is applicable for large-scale spatial problems that
incorporate millions of alternatives and hundreds of thousands of simulation runs.
Furthermore, this GPU-based concept represents a low-cost approach in comparison to
high-performance computing that incorporates super computers. Additionally, the
concept allows the integration of different decision rules (e.g. simple additive weighting,
ideal point, ordered weighting averaging, or analytical hierarchy process) in order to
evaluate the performance of the alternatives involved. The proposed approach was
tested on a landscape assessment example in order to identify the variability of the model
outcomes with respect to the criteria ‘Compactness’, ‘Mean Patch Area’, ‘Relief Energy’
and ‘Variety’ that define landscape diversity.
Keywords:
spatially-explicit uncertainty and sensitivity analysis, spatial multi-criteria decision making,
parallelization, GPU, landscape assessment.
1 Introduction
Spatial multi-criteria decision making (S-MCDM) models support decision makers in a wide variety of application domains (e.g. natural hazard risk assessment, allocation of funds for sustainable agriculture, or landscape impact assessment of infrastructure projects).
Erlacher et al
45
Consequently, the S-MCDM-derived solutions have potentially significant impacts on decisions in terms of costs and resources, but very often lack detailed information about the quality and robustness of results. This drawback is in large part due to a failure to account for the distribution of uncertainty incorporated in model solutions. The key measures of S-MCDM model robustness are the uncertainty of model outputs and its sensitivity to uncertain model inputs. Spatial uncertainty-sensitivity analysis promises to provide a critical improvement in assessing the robustness of S-MCDM results. Therefore its development stands to make a significant contribution to more informed, and hence potentially better, decision making.
This research focuses on the development of a concept in order to improve the computational time conducting Spatially-Explicit Uncertainty and Sensitivity Analysis (SEUSA) within the scope of multi-criteria decision-making and spatial decision support. Performing spatial uncertainty and sensitivity analysis in S-MCDM can be complex and time-consuming. The computational intensity of analysis depends on the number of evaluation criteria, decision alternatives, and the complexity of the S-MCDM model. Accordingly, an important objective of this project is to design a scalable and adaptable SEUSA concept which can be deployed within a reasonable computational time and is adoptable for different application domains. GPUs (Graphic Processing Units) are powerful and relatively affordable, resulting in their widespread use in various application areas and research fields, including physics, operations research, chemistry, biology, engineering, environmental science, nuclear and industrial safety, economics and finance. In this paper, a GPU-based low- to medium-cost solution to perform SEUSA for the landscape assessment application domain is presented. The knowledge that has been gained in this project will support analysts and experts in the decision-making process thanks to the increased traceability, applicability, objectivity and transparency of the approach.
2 State of the art and theoretical background
The following sections provide an overview of the current status of research on Spatial Multi-Criteria Decision Making (S-MCDM), Spatially-Explicit Uncertainty and Sensitivity Analysis (SEUSA), and Parallelization and Distributed Computing.
Spatial Multi-Criteria Decision Making
S-MCDM techniques (Malczewski 1999, Malczewski 2006, Malczewski & Rinner 2015) are well known and have been investigated for decades. This research area belongs to the field of Spatial Decision Support Systems (SDSS) and focuses on a set of alternatives that are evaluated on the basis of conflicting criteria. The criteria are described and collected by experts and stored in a criterion catalogue. The criterion catalogue represents the basis for defining an S-MCDM model that involves objectives and attributes, which are hierarchically structured. Objectives are expressed in terms of a set of criteria where every criterion refers to a certain preference (trade-off) value. This preference is commonly expressed as criterion weight. In contrast to traditional MCDM, which relies on evaluation criteria that typically do not express spatial relationships, S-MCDM employs both non-spatial and spatial criteria that
Erlacher et al
46
explicitly represent spatial relationships (e.g. proximity, overlap, intersection) and spatial derivatives (e.g. slope, density, solar insolation). According to Ligmann-Zielinska and Jankowski (2008), spatial decision problems include both aspatial and spatial aspects. The majority of research activities concerning sensitivity analysis have focused on the aspatial nature of decision situations. Spatial distributions of decision alternatives and criteria values could potentially impact S-MCDM solutions. Therefore, Ligmann-Zielinska and Jankowski (2008) argued for the inclusion of spatially-explicit criteria such as ‘proximity’, ‘compactness’ or ‘contiguity’, and for the spatially-dependent weighting of criterion importance as a way to ‘spatialize’ MCDM. Moreover, unlike traditional (non-spatial) MCDM, S-MCDM solutions can be communicated by maps accompanied by tables and graphs, thus enhancing the comprehension of results. This capability is commonly achieved by integrating MCDM with Geographic Information Systems (GIS) (Jankowski, 1995; Malczewski & Rinner, 2015). Spatial data in GIS can be represented either by a set of pixels (regularized locations resulting from a grid representation), or by a set of points or of linear or polygonal objects. Each location-specific object or a combination thereof represents a decision alternative that can be characterized by a set of attributes. Spatially explicit attributes to which a preference order can be ascribed (i.e. which can be maximized or minimized) can be treated in S-MCDM as evaluation criteria, and their spatial distributions represented on maps. Criteria maps are used to evaluate the performance of alternatives. In addition to criteria maps, constraint maps in S-MCDM represent limitations on criterion values. Common S-MCDM steps involve standardizing criteria to facilitate the comparison of alternatives on the set of evaluation criteria, and combining standardized criterion scores for each alternative with criterion weights representing preferences/trade-offs between the criteria. A number of combination functions (i.e. decision rules) proposed for MCDM, including simple additive weighting, ordered weighted averaging, analytic hierarchy process and ideal point, were adopted for S-MCDM (Malczewski & Rinner, 2015).
Spatially-Explicit Uncertainty and Sensitivity Analysis
In spatial multi-criteria evaluation, uncertainty derives both from accuracy and precision of input data and from the structural elements of an S-MCDM model such as decision criteria, criteria measurements (inaccuracy and measurement error), criteria standardization procedure, criteria weights, and decision rules (Hwang & Yoon, 1981; Ligmann-Zielinska & Jankowski, 2012; Ganji et al., 2016). The propagation of uncertainty in spatial data can affect the S-MCDM model outcome and should therefore be addressed. An important step in this direction is to verify the robustness and stability of the model solution by accounting for the model’s input-output uncertainties through the integration of uncertainty analysis (UA) with sensitivity analysis (SA). Saltelli et al. (2008) describe SA as ‘the study of how uncertainty in the output of a model (numerical or otherwise) can be apportioned to different sources in the model input’ (p. 1). Uncertainty and sensitivity analysis adds a critical step in spatial multi-criteria evaluation, with uncertainty analysis quantifying the variability of the results and sensitivity analysis identifying model inputs that are responsible for the variability. SA can be roughly differentiated into local and global sensitivity analysis (GSA) methods. As stated by Wainwright et al. (2014), ‘GSAs explore the parameter space so that they provide robust sensitivity measures in the presence of nonlinearity and interactions among the parameters compared to the local sensitivity analysis’ (p. 84).
Erlacher et al
47
The spatially-explicit, integrated uncertainty-sensitivity approach proposed by Ligmann-Zielinska and Jankowski (2012, 2014) has been applied so far in only a handful of other studies (Feizizadeh et al., 2014; Şalap-Ayça & Jankowski, 2016). In their 2014 paper, Ligmann-Zielinska and Jankowski examined the robustness of S-MCDM-based evaluation of land suitability with the help of Monte Carlo Simulation (MCS) and variance-based global sensitivity analysis. The MCS was used to generate a large number of suitability maps that incorporated probabilistic criteria weights, and enabled the calculation of a mean suitability map, a standard deviation (uncertainty) map, and model sensitivity maps. The areas of high average suitability and high uncertainty found in the mean suitability and standard deviation maps represented candidates that needed to be further investigated with variance-based sensitivity analysis. The resultant sensitivity maps described locations where a particular criterion weight influences the uncertainty of suitability scores (Ligmann-Zielinska & Jankowski 2014). Feizizadeh et al. (2014) applied a GIS-based spatially-explicit uncertainty and sensitivity analysis approach to landslide susceptibility mapping. They analysed the uncertainty and sensitivity of landslide susceptibility with the help of MCS and Global Sensitivity Analysis (GSA), and validated the results with Dempster–Shafer theory (DST). The authors argued that this approach could improve the accuracy of model results by identifying and minimizing the uncertainties associated with the respective methods for multi-criteria decision analyses (Feizizadeh et al., 2014). Şalap-Ayça and Jankowski (2016) focused on extending the spatially-explicit uncertainty and sensitivity analysis framework to integrate it with the local multi-criteria evaluation technique proposed by Malczewski (2011) in the application context of prioritizing agricultural land units for conservation purposes. The uncertainty and sensitivity analysis in this spatially-explicit model refers to local weight changes where the output depends on inputs from neighbourhoods (local spatial dependency). Using a spatially-explicit uncertainty and sensitivity analysis approach, Şalap-Ayça and Jankowski (2016), showed how finding the areas where the model input factors contributed the most to the uncertainty of the environmental benefit index could be used to acquire more reliable input data and ultimately improve the reliability of land evaluation for conservation decisions.
Parallelization and Distributed Computing
In conducting spatially-explicit uncertainty-sensitivity analysis, the variance-based approach is often recommended for its model-independent procedure suitable to both linear and non-linear models with spatial data inputs. The probabilistic bases of variance-based global sensitivity analysis, however, pose high computational demands (Nossent et al., 2011). In particular, for spatially-explicit uncertainty and sensitivity analysis (for vector and especially raster representations) the computational load depends on the number of simulations for each location (e.g. feature or raster cell), thus generating a large volume of suitability, uncertainty and sensitivity maps. In addition, local dependencies in spatial neighbourhoods will increase further the computational time. For example, Şalap-Ayça and Jankowski (2016) ran SEUSA for a local multi-criteria evaluation model with the study area comprising 31 polygons. The computational time to obtain reliable results for the first- and total-order sensitivity indices was more than 47 hours.
Erlacher et al
48
Parallelization and distributed computing approaches offer a strategy to achieve the acceleration of computationally intensive steps in SEUSA. In contrast to serial computation (discrete series of instructions), parallel and distributed computing is more suitable to model and simulate real-world phenomena, and to conduct computationally intensive algorithms. Distributed computing approaches connect separated processors via communication links and can be coordinated by standard MPI (Message Passing Interfaces) for message-passing and transmission protocols that incorporate guidelines for data exchange (e.g. Transmission Control Protocol) (Yang et al., 2011). Graphics-processing units (GPU) are so powerful that currently they are commonly used for general purpose computations (e.g. NVIDIA CUDA API). This field of computer engineering research is called General-Purpose computing on Graphics Processing Units (GPGPU). GPU co-processors are constructed to accelerate parallel floating-point operations massively (Krömer et al., 2014). As stated by Owens et al. (2008), the current development of GPUs provides the opportunity to tackle computationally demanding and complex problems and represents a low-cost solution. GPUs have a parallel architecture that incorporates thousands of smaller but more efficient cores in comparison with CPUs. The majority of programming problems have different parallel solutions, and the best solution might differ from an existing sequential algorithm. Parallel algorithm design represents an opportunity to develop parallel strategies for a given programming problem in order to achieve performance increase. GPGPU is very efficient when the computational problem is coarse-grained or presents ‘embarrassing’ parallelism. This means that the sub-tasks of the problem do not communicate very often, or do so rarely in the case of embarrassing parallelism. Monte Carlo simulations in the field of sensitivity analysis (Bullard & Sebald, 1988) are often embarrassingly parallel.
3 Concept Development
This section presents the development of a conceptual framework to accelerate the computationally intensive parts of the SEUSA approach in order to increase the applicability for large datasets. Furthermore, the proposed framework incorporates an adaptable and extendable structure, which allows integrating various aggregation techniques (decision rules such as simple additive weighting, analytical hierarchy process, ordered weighted averaging, or ideal point).
Spatially-Explicit Uncertainty and Sensitivity Approach
Ligmann-Zielinska and Jankowski (2012, 2014) proposed a SEUSA Framework incorporating a variance-based global sensitivity analysis approach. This approach includes a Monte Carlo Simulation (MCS) in order to generate a stack of suitability surfaces, where each surface represents the performance of the alternatives with respect to the criterion weights. The weight samples are created with the help of Sobol’s quasi-random experimental design.
This study focuses on conducting a spatially-explicit uncertainty and sensitivity analysis approach for the application domain ‘Landscape Assessment’. Infrastructure projects influence the landscape and often result in heated discussions between planners and people behind citizens’ initiatives. Therefore, the preliminary study (Erlacher et al., 2014) focused on
Erlacher et al
49
a standardized workflow to assess the influence of planned infrastructure projects. Landscape alternatives are represented as pixel locations and are composed by the main criteria ‘Landscape Diversity’ (rich in landscape shape structures), ‘Landscape Characteristics’ (landscape-distinctive and non-interchangeable elements), and ‘Existing Infrastructures’ (e.g. industries, wind parks, streets). The first two criteria are of benefit type (increase the vulnerability of landscape locations), while the third denotes a cost criterion (decreases the vulnerability of landscape locations). Landscape locations with high vulnerability values are more sensitive to potential infrastructure projects. The criterion ‘Landscape Diversity’ incorporates the uncertainty concerning the expert preferences of the sub-criteria ‘Compactness’, ‘Variety’, ‘Relief Energy’ and ‘Mean Patch Area’, which were generated by a satellite imagery analysis. A detailed explanation of these sub-criteria can be found in Moser et al. (2002). Figure 1 provides an overview of the variance-based SEUSA approach for computing the landscape diversity of each pixel location. ‘Compactness’, ‘Mean Patch Area’, ‘Relief Energy’ and ‘Variety’ represent inputs in this approach, where lighter colours indicate higher pixel values for the locations (see Figure 2). The first two inputs represent the cost criteria (see equation 1), whereas inputs three and four represent the benefit criteria (see equation 2). This information is important for the standardization process in order to enable comparability of the criteria. For each location of criterion c, the index i represents the row and the index j represents the column. Consequently, x’ijc indicates the standardized
criterion value for each alternative (location), where xcmin and xc
max are the minimum and maximum values for the corresponding criterion.
x′ijc =xijc − xc
min
xcmax − xc
min (1)
x′ijc =xc
max − xijc
xcmax − xc
min (2)
For the generation of weight samples, Sobol’s quasi-random experimental design is used, which provides a more uniform distribution than simple random sampling. The weight samples, consisting of two weight sets (A and B), were created using the software SimLab 2.2, which is provided by the European Joint Research Centre, a member of the international SAMO research group (download centre: https://ec.europa.eu/jrc/en/samo/simlab). For each weight sample incorporating weight sets A and B, a radial weight matrix of dimension [c+2;c] is generated, where c indicates a criterion. Therefore, the total number of simulations runs R can be established by the following equation, where c represents the number of criteria and N represents the number of rows for the weight samples:
R = (c + 2) ∗ N (3)
The Ideal Point decision rule was used to calculate the performance of each alternative with respect to the relative closeness rcij to the ideal point:
rcij+ =sij−
sij++ sij− (4)
The separation to the ideal point sij+ for each alternative represents the distance between the standardized criterion of the ijth location and the ideal value of the cth criterion (see
Erlacher et al
50
equation 5). The separation from the negative ideal point sij- for each alternative represents the distance between the standardized criterion of the ijth location and the ideal value of the cth criterion (see equation 6). For the distance metric, the power parameter p is set to 2, which indicates the Euclidean distance (straight line) between two points. Finally, the square root of the summed and weighted distance values of the criteria is computed.
sij+ = [∑ wcp
c (vijc − v+c)p]1/p (5)
sij− = [∑ wcp
c (vijc − v−c)p]1/p (6)
Each simulation outcome represents one suitability surface that indicates the performance (landscape diversity value) for each pixel location (alternative). The stack of suitability surfaces constitutes the input for the spatial uncertainty and sensitivity analysis. In the course of the uncertainty analysis, an average suitability map and a standard deviation map are computed in order to quantify the variability of each location. Locations with a high average suitability value and a high standard deviation value represent choice candidates, which should be further investigated in order to identify criterion weights that influence high standard deviation (the uncertainty of model outcome). As described by Ligmann-Zielinska and Jankowski (2014): ‘the first order index (S) captures the independent contribution of a given input on output variability, whereas the total effect index (ST) also accounts for interactions among a given input and other inputs’ (p. 236).
Figure 1: Illustration of the workflow to perform a variance-based spatially-explicit Uncertainty and
Sensitivity Analysis.
Erlacher et al
51
Figure 2: From left to right: representations for the sub-criteria ‘Compactness’, ‘Mean Patch Area’,
‘Relief Energy’ and ‘Variety’ of the main criterion ‘Landscape Diversity’, in the Grazer Feld case study
area in Austria.
Parallelization Workflow
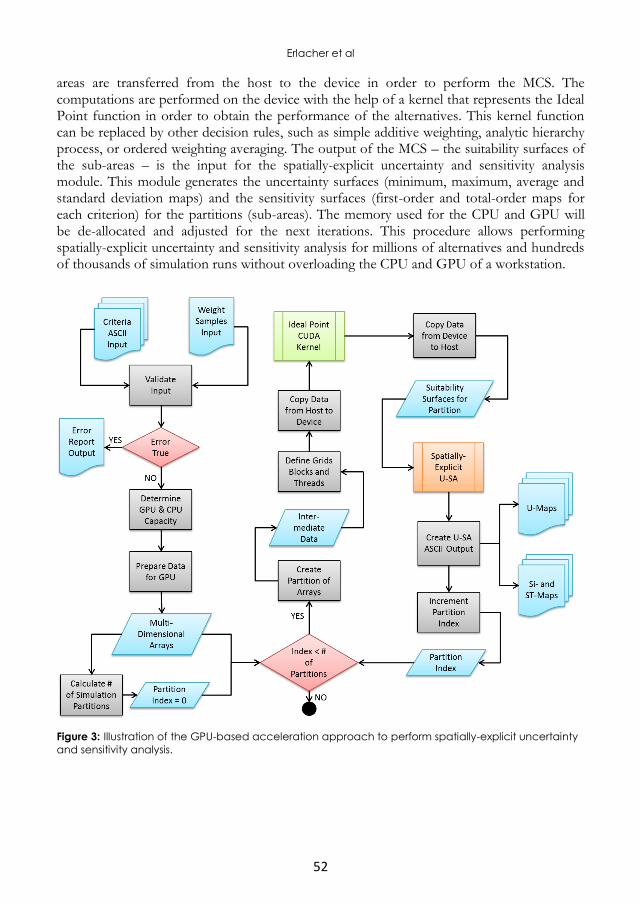
In the course of the experimental study, a concept for a GPU-based solution was developed in order to accelerate the spatial uncertainty and sensitivity analysis approach. Figure 3 illustrates the GPU-based acceleration strategy that utilizes the Compute Unified Device Architecture (CUDA-API) from NVIDIA. The criteria represent two-dimensional ASCII files, where each standardized criterion value of a location can be identified by the indices of row and column. A single row of the weight samples input is expressed as one dimensional array that includes the independent weight sets A and B. At the beginning of this workflow, both input datasets are valid. The validation module verifies the availability and the dimensionality of all datasets. Furthermore, this module validates the scale of each criterion map (checks for standardized values) and normalizes the weights. If the programme passes the validation process, the GPU (Device) and CPU (Host) capabilities will be determined next. This information is necessary because of the limited resources with respect to the memory (CPU and GPU), number of cores, streaming multiprocessors and warp size for the GPU. The host represents the program logic that controls memory allocation, data partitioning and recombination, and the device accelerates the computation of the suitability surfaces (Monte Carlo Simulation), which indicates the most computationally-intensive task of the SEUSA workflow. In order to perform the MCS on the GPU, the program logic has to pre-calculate the memory requirements for generating the suitability surfaces on the basis of the weight sample size, the number of criteria and the number of alternatives (pixel locations). According to the computed memory requirements and the available resources, the number of partitions is calculated in order to avoid a memory overflow for the GPU and the CPU. Each partition represents a sub-area of the whole case study (pixel locations). The criterion maps of the sub-area are restructured to one-dimensional arrays and are associated with the corresponding weights in the radial weight matrix. For each partition, the threads per block and the blocks per grid have to be defined, which depends on the number of columns (pixel locations of each sub-area) and the number of all simulations (number of weight sets of the radial weight matrix). The number of threads per block refers to the device capability warp size. Additionally, the distribution of the two-dimensional parameters (x- and y-indices) for the threads per block and the blocks per grid refers to the number of rows and columns of the suitability surfaces. The information of the distribution parameters, the restructured input data and the predefined data structure of suitability surfaces for the sub-
Erlacher et al
52
areas are transferred from the host to the device in order to perform the MCS. The computations are performed on the device with the help of a kernel that represents the Ideal Point function in order to obtain the performance of the alternatives. This kernel function can be replaced by other decision rules, such as simple additive weighting, analytic hierarchy process, or ordered weighting averaging. The output of the MCS – the suitability surfaces of the sub-areas – is the input for the spatially-explicit uncertainty and sensitivity analysis module. This module generates the uncertainty surfaces (minimum, maximum, average and standard deviation maps) and the sensitivity surfaces (first-order and total-order maps for each criterion) for the partitions (sub-areas). The memory used for the CPU and GPU will be de-allocated and adjusted for the next iterations. This procedure allows performing spatially-explicit uncertainty and sensitivity analysis for millions of alternatives and hundreds of thousands of simulation runs without overloading the CPU and GPU of a workstation.
Figure 3: Illustration of the GPU-based acceleration approach to perform spatially-explicit uncertainty
and sensitivity analysis.
Erlacher et al
53
4 Proof of Concept
Simulation Speed-Ups
The proposed concept to achieve a sufficient speed-up and subsequently to enable spatially-explicit uncertainty and sensitivity analysis was implemented in Python incorporating the Anaconda CUDA acceleration packages. For the performance tests, the Tesla K40 GPU from NVIDIA was used and compared with a CPU-based NumPy implementation. NumPy is a Python package for scientific computing. The Grazer Feld case study in Austria includes 5,000 alternatives (pixel locations). For performing the MCS, different weight sample sizes were chosen (288, 576, 1152, 2304, 4608, 9216 and 18432), resulting in 110,592 simulation runs for a weight sample size of 18,432. The simulations for this case study can be accelerated up to the speed-up factor of 150, which indicates that the GPU-based solution is 150 times faster than the CPU-based solution. Figure 4 illustrates the acceleration of the GPU-based approach in comparison with the CPU-based approach.
Figure 4: Comparison of GPU-based speed-ups for chosen weight sample sizes.
Spatially-Explicit Uncertainty and Sensitivity Analysis Results
The spatially-explicit uncertainty analysis incorporates the relationship between the mean output map and the standard deviation map in order to select the priority locations with confidence. Locations with high average values and low standard deviation values are considered robust, whereas locations with high average values and high standard deviation values are deemed to be possible candidates. Therefore, the relationship between both maps is identified by creating four quadrants that can be divided into high AVG and high STD locations (candidate locations), high AVG and low STD locations (robust regions), low AVG and high STD locations, and low AVG and low STD locations. The boundary values for
Erlacher et al
54
defining those quadrants are the global mean of the average suitability map (0.41875) and the global standard deviation (0.12287). Figure 5 illustrates the spatial distribution (left) and the bar chart (right) of the four relationship quadrants with respect to the AVG and STD maps.
Figure 5: ‘Landscape Diversity’ priority locations where
High AVG and High STD locations (red) represent
candidates, and High AVG and Low STD locations
(yellow) represent robust regions.
Figure 5. illustrates the spatial distribution of the first-order and total sensitivity indices for the sub-criterion ‘Compactness’. The first-order and total-order maps for the criterion ‘Compactness’ incorporate more high- and low-value clusters than the remaining sensitivity maps. Furthermore, the standard deviation value for the S-Map ‘Compactness’ is higher than for any of the other S-Maps. The differences between first-order and total-order maps of all sub-criteria are low, due to low interactions between the sub-criteria of the main criterion ‘Landscape Diversity’. Locations with lighter colours indicate relatively high interactions (see Figures 7 and 8).
The higher the first-order values of a criterion, the greater the single contribution to the observed variability in the suitability score. Figure 9 represents the distribution of dominant criteria (highest pixel values) for candidate locations with respect to the first-order sensitivity indices. The dominant criteria for both the first-order and the total-order sensitivity indices are criterion 2 (Mean Patch Area) and criterion 3 (Relief Energy), whereas criterion 4
Erlacher et al
55
(Variety) indicates a low contribution to the variability of the suitability scores. The proportion of dominant locations in comparison to the overall study area decreases dramatically for criterion 1 (Compactness).
Figure 6: First-order (left) and total-order (right)
sensitivity maps for the criterion ‘Compactness’.
Figure 7: Interaction maps between the main order index (S) (left) and the total-order index (ST) (right)
for the criteria ‘Compactness’ and ‘Mean Patch Area’, where lighter colours indicate locations
incorporating relatively high interactions.
Erlacher et al
56
Figure 8: Interaction maps between the main order index (S) (left) and the total-order index (ST) (right)
for the criteria ‘Relief Energy’ and ‘Variety’, where lighter colours indicate locations incorporating
relatively high interactions.
Figure 9: Distribution of dominant criteria for potential candidate locations concerning the first-order
sensitivity indices.
Erlacher et al
57
5 Summary, Discussion and Future Prospects
The proposed concept for a GPU-based solution to accelerate spatially-explicit uncertainty and sensitivity analysis provides reasonable computational speed-ups. This development increases the applicability of the SEUSA workflow. Furthermore, various decision rules such as simple additive weighting, ordered weighted averaging or the analytical hierarchy process can be integrated in the proposed conceptual development by changing the CUDA kernel function. Additionally, this implementation is applicable for extensive data sets incorporating millions of alternatives (i.e. individual pixel locations) and hundreds of thousands of simulation runs. Locations showing a high landscape diversity can be interpreted as critical in the decision-making process: they are areas with high vulnerability with regard to the planned infrastructure project. The major benefit of this new approach is the further chance it offers of classifying those high vulnerability locations in terms of the associated model uncertainty. Locations with high vulnerability and low uncertainty values represent a high probability of robust MCDM results, whereas areas with high vulnerability and high uncertainty values are candidate locations for further investigation. In this case study, more than 41% of the study area presents candidate locations. The criteria ‘Mean Patch Area’ and ‘Relief Energy’ are the cause of the uncertainty for the majority of locations. Further investigation of these locations is therefore recommended, as is their detailed evaluation, before any final recommendation is made. For example, the determination of weight ranges for criteria in collaboration with domain experts may reduce the uncertainty of candidate locations and represent one option for a reassessment loop.
This approach represents the first step towards developing computationally robust techniques to enable the use of SEUSA for a wider range of application-oriented user communities. Currently, the proposed solution is limited to vertical raster operations incorporating local aggregation techniques. Further partitioning strategies to perform spatially-explicit uncertainty and sensitivity analysis for local spatial dependency (neighbourhood analysis) have still to be conceptualized and integrated into the existing workflow. Additionally, further parallelization and distributed computing methods involving clusters of workstations are of interest, as well as examining the effectiveness of communication-model uncertainty and sensitivity through visualization techniques. Finally, the long-term vision for this research is the development of a computationally-efficient low-cost framework to perform spatially-explicit uncertainty and sensitivity analysis in different kinds of application domains (e.g. natural hazard risk assessment, environmental protection, or land use management), in order to increase the quality and reliability of spatial decision-making processes.
References
Bullard, C. W., & Sebald, A. V. (1988). Monte Carlo Sensitivity Analysis of Input-Output Models. The Review of Economics and Statistics, 70 (4), 708-712.
Erlacher, C., Paulus, G., Eisl, M., Melcher, D., Bogner, D., Griesser, B., Pöll, W., Rieger, A., & Umgeher, L. (2014). Ein neuer standardisierter Workflow zur quantitativen Landschaftsbildbewertung bei UVP-Verfahren. In: J. Strobl, T. Blaschke, G. Griesebner & B.
Feizizadeh, B., Jankowski, P., & Blaschke, T. (2014). A GIS based Spatially-explicit Sensitivity and Uncertainty Analysis Approach for Multi-Criteria Decision Analysis. Computers and Geosciences, 64, 81-95.
Ganji, A., Maier, H., & Dandy, G. (2016). A modified Sobol’ sensitivity analysis method for decision making in environmental problems. Environmental Modelling & Software, 75, 15-27.
Hwang, C. L., & Yoon, K. (1981). Multiple Attribute Decision Making Methods and Applications: A State of the Art Survey. Springer-Verlag, Berlin.
Jankowski, P. (1995). Integrating geographical information systems and multiple criteria decisionmaking methods. International Journal of Geographical Information Systems, 9(3), 252-273.
Krömer, P., Platoš, J., & Snášel, V. (2014). Nature-Inspired Meta-Heuristics on Modern GPUs: State of the Art and Brief Survey of Selected Algorithms. International Journal of Parallel Programming, 42(5), 681–709.
Ligmann-Zielinska, A., & Jankowski, P. (2008). A Framework for Sensitivity Analysis in Spatial Multiple Criteria Evaluation. In: Cova, T. J., Miller, H. J., Beard, K., Frank, A. U., Goodchild, M. F., (Eds.). Proceedings from the Fifth Intentional Conference on Geographic Information Science, LNCS 5266, Springer-Verlag Berlin, 217-333.
Ligmann-Zielinska, A., & Jankowski, P. (2012). Impact of proximity-adjusted preferences on rankorder stability in geographical multicriteria decision analysis. Journal of Geographical Systems, 14(2), 167-187.
Ligmann-Zielinska, A., & Jankowski, P. (2014). Spatially-Explicit Integrated Uncertainty and Sensitivity Analysis of Criteria Weights in Multicriteria Land Suitability Evaluation. Environmental Modelling & Software, 57, 235-247.
Malczewski, J. (1999). GIS and Multicriteria Decision Analysis. New York, Wiley. Malczewski, J. (2006). Ordered weighted averaging with fuzzy quantifiers: GIS-based multicriteria
evaluation for land-use suitability analysis. International Journal of Applied Earth Observation and Geoinformation, 8, 270–277.
Malczewski, J. (2011). Local Weighted Linear Combination. Transactions in GIS, 15(4), 439-455. Malczewski, J., & Rinner, C. (2015). Multicriteria Decision Analysis in Geographic Information
Science, Advances in Geographic Information Science. New York, Springer. Moser, D., Zechmeister, H. G., Plutzar, C., Sauberer, N., Wrbka, T., & Grabherr, G. (2002).
Landscape patch shape complexity as an effective measure for plant species richness in rural landscapes. Landscape Ecology, 17, 657–669.
Nossent, J., Elsen, P., & Bauwens, W. (2011). Sobol’ sensitivity analysis of a complex environmental modeling. Environmental Modelling & Software, 26(12), 1515-1525.
Owens, J. D., Houston, M., Luebke, D., Green, S., Stone, J. E., & Phillips, J. C. (2008). Graphics Processing Units - powerful, programmable, and highly parallel – are increasingly targeting general-purpose computing applications. Proceedings of the IEEE, 96(5), 879-899.
Şalap-Ayça, S., & Jankowski, P. (2016). Integrating Local Multi-Criteria Evaluation with Spatially Explicit Uncertainty-Sensitivity Analysis. Spatial Cognition & Computation, 16(2), 106-132.
Saltelli, A., Ratto, M., Andres, T., Campolongo, F., Cariboni, J., Gatelli, D., Saisana, M., & Tarantola, S. (2008). Global Sensitivity Analysis: The Primer. John While & Sons, Ltd.
Wainwright, H., M., Finsterle, S., Jung, Y., Zhou, Q., & Birkholzer, J. T. (2014). Making sense of global sensitivity analyses. Computers & Geosciences, 65, 84-94.
Yang, C. T., Huang, C. L., & Lin, C. F. (2011). Hybrid CUDA, OpenMP, and MPI parallel programming on multicore GPU clusters. Computer Physics Communications, 182, 266-269.