31
1 I Godrej Industries Limited I Q4 & FY 2012-13 | Performance Update | May-28-2013 Q4 & FY 2012-13 - PERFORMANCE UPDATE May 28, 2013
1 I Godrej Industries Limited I Q4 & FY 2012-13 | Performance Update | May-28-2013
Q4 & FY 2012-13 - PERFORMANCE UPDATE
May 28, 2013

2 I Godrej Industries Limited I Q4 & FY 2012-13 | Performance Update | May-28-2013
“Some of the statements in this communication may be ‘forward looking statements’
within the meaning of applicable laws and regulations. Actual results might differ
substantially or materially from those expressed or implied. Important developments
that could affect the Company’s operations include changes in industry structure,
significant changes in political and economic environment in India and overseas, tax
laws, import duties, litigation and labour relations.”
DISCLAIMER

3 I Godrej Industries Limited I Q4 & FY 2012-13 | Performance Update | May-28-2013
AGENDA
• Results
• Financial Highlights – Consolidated
• Segment Performance
• Business Performance
• Performance highlights including Subsidiaries and Associates
• Other information

4 I Godrej Industries Limited I Q4 & FY 2012-13 | Performance Update | May-28-2013
FINANCIAL HIGHLIGHTS – CONSOLIDATED

5 I Godrej Industries Limited I Q4 & FY 2012-13 | Performance Update | May-28-2013
FINANCIAL HIGHLIGHTS - CONSOLIDATED
Particulars (` crore)
Q4FY
2012 -13
Q4FY
2011-12
% Growth FY
2012 -13FY
2011-12
% Growth
Total Income * 1472 1479 -- 7198 5804 24%
PBDIT * 118 87 35% 596 457 30%
Depreciation 16 13 60 56
Interest 24 29 110 111
PBT * 78 45 73% 426 290 47%
Net Profit 94 43 119% 391 292 34%
* Including other income and exceptional items

6 I Godrej Industries Limited I Q4 & FY 2012-13 | Performance Update | May-28-2013
CONSOLIDATED RESULTS – SEGMENT PERFORMANCE

7 I Godrej Industries Limited I Q4 & FY 2012-13 | Performance Update | May-28-2013
23%
39%18%
6%6% 8%
CHEMICALS ANIMAL FEEDs
VEGOILS ESTATE & PROPERTY DEVELOPMENT
FINANCE & INVESTMENTS OTHERS
21
38
-1
93
4 0
SEGMENT-WISE CONTRIBUTION TO FINANCIALS:Q4 FY2012-13
329
553
156
295
7132
Revenue* (` Crore) PBIT (` Crore)
*net of inter-segment revenue
8 I Godrej Industries Limited I Q4 & FY 2012-13 | Performance Update | May-28-2013
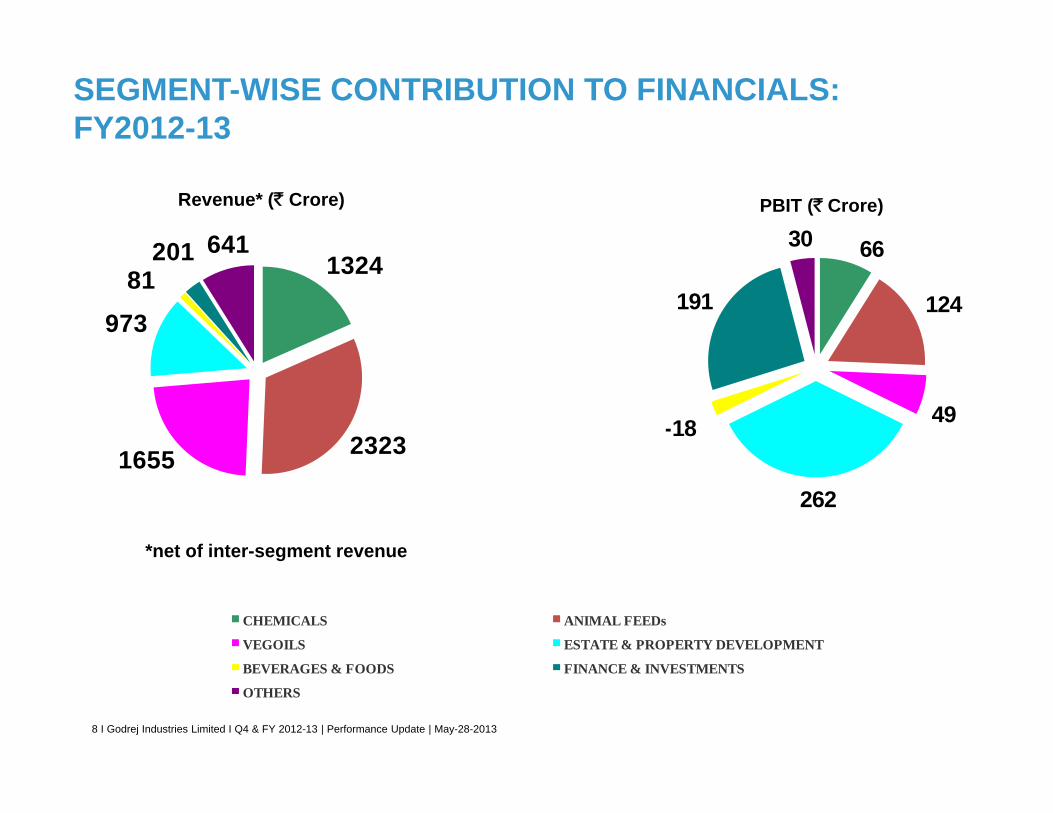
22%
36%17%
6%5%6% 8%
CHEMICALS ANIMAL FEEDs
VEGOILS ESTATE & PROPERTY DEVELOPMENT
BEVERAGES & FOODS FINANCE & INVESTMENTS
OTHERS
66
124
49
262
-18
191
30
SEGMENT-WISE CONTRIBUTION TO FINANCIALS:FY2012-13
1324
23231655
97381
201 641
Revenue* (` Crore) PBIT (` Crore)
*net of inter-segment revenue

9 I Godrej Industries Limited I Q4 & FY 2012-13 | Performance Update | May-28-2013
BUSINESS PERFORAMCE: Performance Highlights incl. subsidiaries, JVs and Associates

10 I Godrej Industries Limited I Q4 & FY 2012-13 | Performance Update | May-28-2013
OUR “CREATE” GROUP PORTFOLIO STRATEGY
Consumer & Chemicals
Real
Estate
Agri
Transformation
Emergent
4 core businesses
Drive to full potentialFocused incubationof new businesses
11 I Godrej Industries Limited I Q4 & FY 2012-13 | Performance Update | May-28-2013
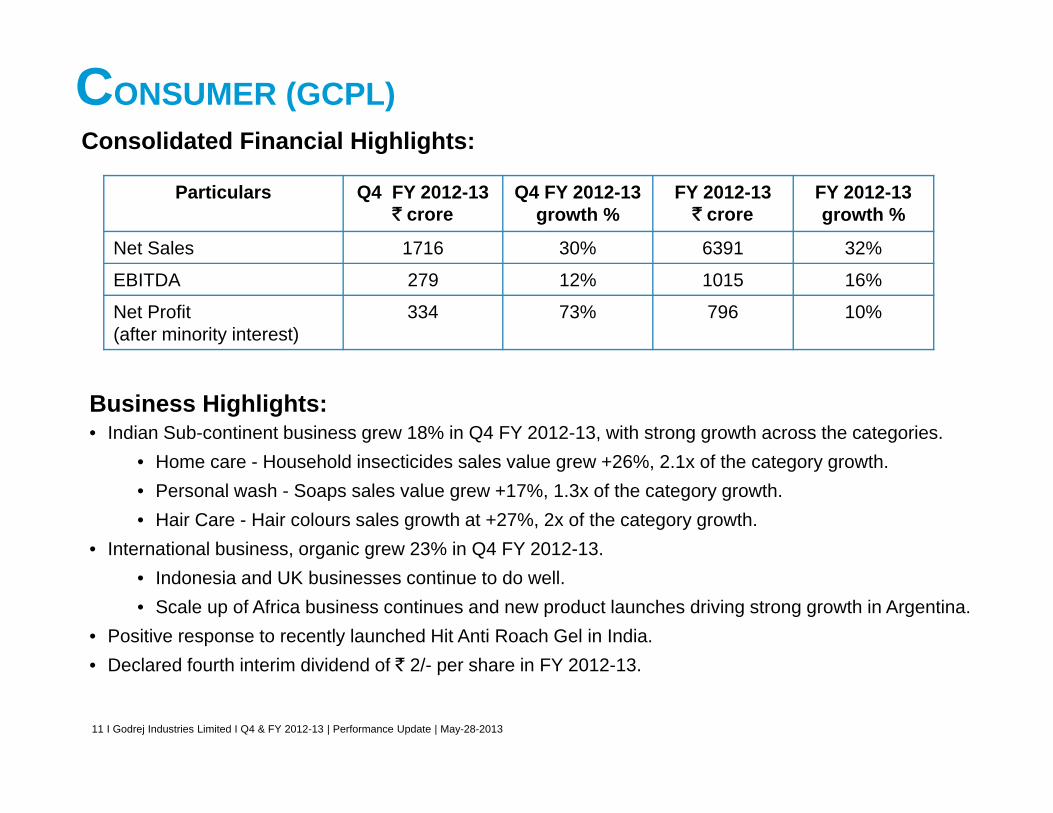
CONSUMER (GCPL)Consolidated Financial Highlights:
Particulars Q4 FY 2012-13` crore
Q4 FY 2012-13 growth %
FY 2012-13` crore
FY 2012-13 growth %
Net Sales 1716 30% 6391 32%
EBITDA 279 12% 1015 16%
Net Profit(after minority interest)
334 73% 796 10%
Business Highlights:• Indian Sub-continent business grew 18% in Q4 FY 2012-13, with strong growth across the categories.
• Home care - Household insecticides sales value grew +26%, 2.1x of the category growth.• Personal wash - Soaps sales value grew +17%, 1.3x of the category growth.• Hair Care - Hair colours sales growth at +27%, 2x of the category growth.
• International business, organic grew 23% in Q4 FY 2012-13.• Indonesia and UK businesses continue to do well.• Scale up of Africa business continues and new product launches driving strong growth in Argentina.
• Positive response to recently launched Hit Anti Roach Gel in India.• Declared fourth interim dividend of ` 2/- per share in FY 2012-13.

12 I Godrej Industries Limited I Q4 & FY 2012-13 | Performance Update | May-28-2013
CHEMICALSProduct Portfolio Q4 FY 2012-13
Revenue distribution by CategoryQ4 FY 2012-13
Fatty Acids
41.8%
Fatty Alcohols
38.3%
Glycerin
4.7%
Surfactants
14.1%
Others
1.2%
Domestic
` 188 crore
(57%)
Exports
` 141 crore
(43%)
• The performance of the Chemicals business wasimpacted due to difficult global economic environmentand also on account of raw material price fluctuation.
• Exports at ` 141 crore in Q4 FY 2012-13.• Now exporting to 80 countries
• Exports for FY 2012-13 stood at ` 515 crore
• The new manufacturing facility at Ambernath isprogressing well and is on schedule
• Expected to be operational in Q3 FY 2013-14
` Crore Q4 FY 2012-13 Amount
Q4 FY 2011-12Amount
FY2012-13 Amount
FY2011-12Amount
Revenue 329 334 1324 1284
PBIT 21 37 66 120
Highlights:
13 I Godrej Industries Limited I Q4 & FY 2012-13 | Performance Update | May-28-2013
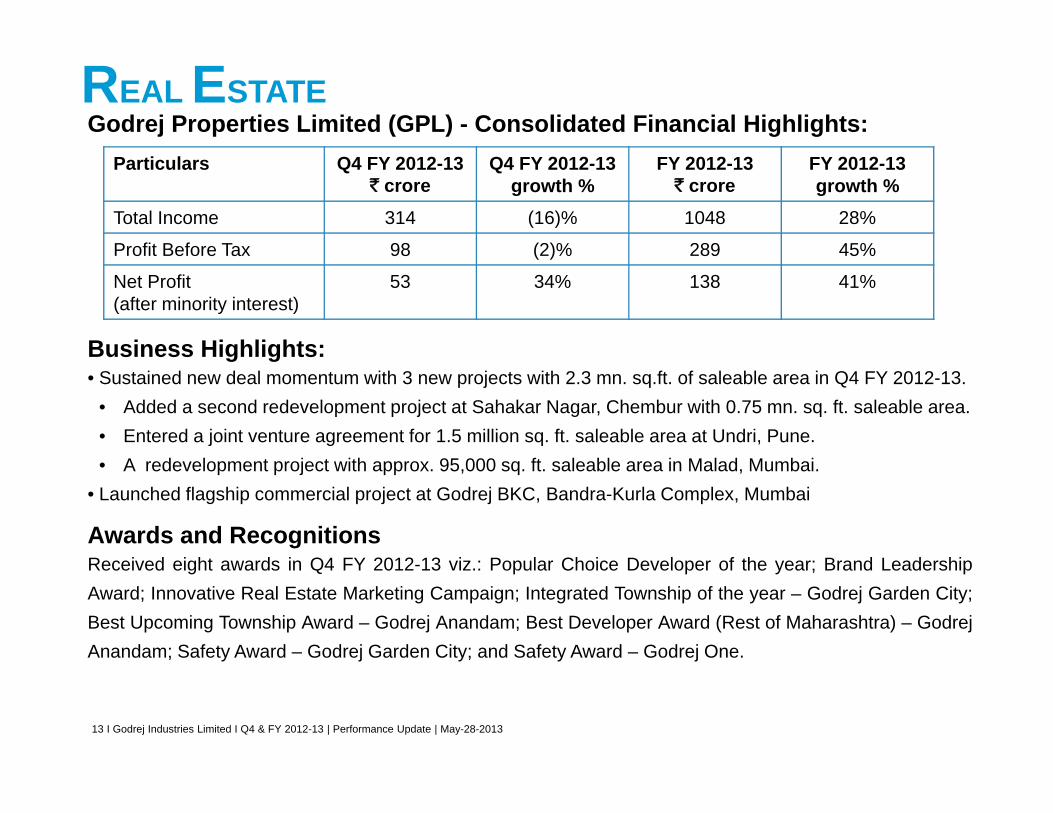
REAL ESTATE Godrej Properties Limited (GPL) - Consolidated Financial Highlights:
Business Highlights:• Sustained new deal momentum with 3 new projects with 2.3 mn. sq.ft. of saleable area in Q4 FY 2012-13.
• Added a second redevelopment project at Sahakar Nagar, Chembur with 0.75 mn. sq. ft. saleable area.• Entered a joint venture agreement for 1.5 million sq. ft. saleable area at Undri, Pune.• A redevelopment project with approx. 95,000 sq. ft. saleable area in Malad, Mumbai.
• Launched flagship commercial project at Godrej BKC, Bandra-Kurla Complex, Mumbai
Awards and RecognitionsReceived eight awards in Q4 FY 2012-13 viz.: Popular Choice Developer of the year; Brand LeadershipAward; Innovative Real Estate Marketing Campaign; Integrated Township of the year – Godrej Garden City;Best Upcoming Township Award – Godrej Anandam; Best Developer Award (Rest of Maharashtra) – GodrejAnandam; Safety Award – Godrej Garden City; and Safety Award – Godrej One.
Particulars Q4 FY 2012-13` crore
Q4 FY 2012-13growth %
FY 2012-13` crore
FY 2012-13growth %
Total Income 314 (16)% 1048 28%
Profit Before Tax 98 (2)% 289 45%
Net Profit(after minority interest)
53 34% 138 41%
14 I Godrej Industries Limited I Q4 & FY 2012-13 | Performance Update | May-28-2013
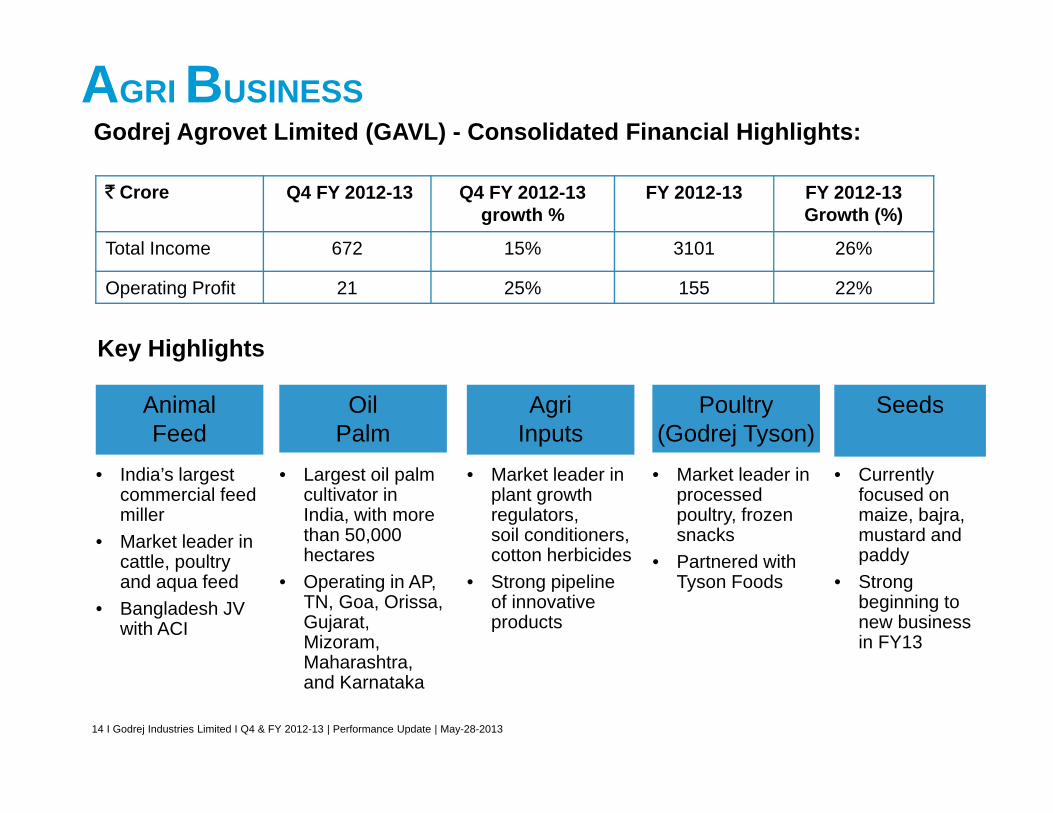
AGRI BUSINESSGodrej Agrovet Limited (GAVL) - Consolidated Financial Highlights:
` Crore Q4 FY 2012-13 Q4 FY 2012-13 growth %
FY 2012-13 FY 2012-13Growth (%)
Total Income 672 15% 3101 26%
Operating Profit 21 25% 155 22%
Animal Feed
• India’s largest commercial feed miller
• Market leader in cattle, poultry and aqua feed
• Bangladesh JV with ACI
Poultry (Godrej Tyson)• Market leader in
processed poultry, frozen snacks
• Partnered with Tyson Foods
Oil Palm
• Largest oil palm cultivator in India, with more than 50,000 hectares
• Operating in AP, TN, Goa, Orissa, Gujarat, Mizoram, Maharashtra, and Karnataka
AgriInputs
• Market leader in plant growth regulators, soil conditioners, cotton herbicides
• Strong pipeline of innovative products
Seeds
• Currently focused on maize, bajra, mustard and paddy
• Strong beginning to new business in FY13
Key Highlights
15 I Godrej Industries Limited I Q4 & FY 2012-13 | Performance Update | May-28-2013
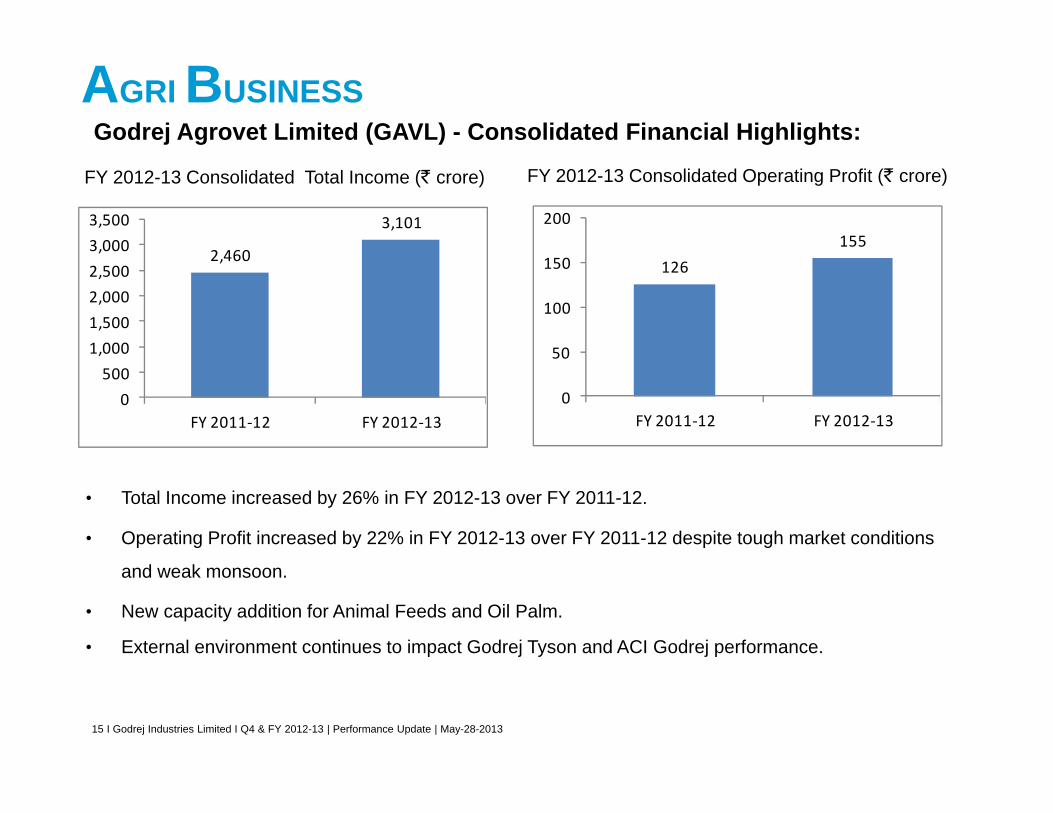
AGRI BUSINESSGodrej Agrovet Limited (GAVL) - Consolidated Financial Highlights:
2,460
3,101
0500
1,0001,5002,0002,5003,0003,500
FY 2011‐12 FY 2012‐13
126155
0
50
100
150
200
FY 2011‐12 FY 2012‐13
• Total Income increased by 26% in FY 2012-13 over FY 2011-12.
• Operating Profit increased by 22% in FY 2012-13 over FY 2011-12 despite tough market conditions
and weak monsoon.
• New capacity addition for Animal Feeds and Oil Palm.
• External environment continues to impact Godrej Tyson and ACI Godrej performance.
FY 2012-13 Consolidated Total Income (` crore) FY 2012-13 Consolidated Operating Profit (` crore)

16 I Godrej Industries Limited I Q4 & FY 2012-13 | Performance Update | May-28-2013
AGRI BUSINESS ANIMAL FEED CONTINUES TO GROW DESPITE TOUGH MARKET CONDITION
• Sales increased by 33% in FY 2012-13 over FY 2011-12 primarily due to 31% growth
in aqua feed volume and 10% growth in cattle feed volume.
• Produced ~1.05 million MT of animal feed in FY2012-13
• Feed volumes increased by 3% in FY 2012-13 over FY 2011-12 despite drop in milk prices and lower broiler placements.
• New feed mill capacities commenced operations across India.
FY 2012-13 Animal Feed Sales (` crore)
1,293
1,748
2,323
0
500
1,000
1,500
2,000
2,500
FY 2010‐11 FY 2011‐12 FY 2012‐13
358
470553
0
100
200
300
400
500
600
Q4 FY11 Q4 FY12 Q4 FY13
Quarterly Animal Feed Sales (` crore)

17 I Godrej Industries Limited I Q4 & FY 2012-13 | Performance Update | May-28-2013
AGRI BUSINESS
• Sales increased by 23% in FY 2012-13 over FY 2011-12 despite lower oil
prices due to 19% increase in Fresh Fruit Bunches (FFB) tonnage.
• New oil mill at Chintampalli, Andhra Pradesh commenced operations and further expansion in progress.
• Over 6,800 new hectares of oil palm plantations cultivated in FY2012-13. Total area coverage is ~ 45,000 hectares.
• Allotted new command area in Chhattisgarh.
FY 2012-13 Oil Palm Sales (` crore)
115
224275
0
50
100
150
200
250
300
FY 2010‐11 FY 2011‐12 FY 2012‐13
2123 24
0
5
10
15
20
25
Q4 FY11 Q4 FY12 Q4 FY13
Quarterly Oil Palm Sales (` crore)
DECLINE IN OIL PALM SALES DUE TO LOWER OIL PRICES

18 I Godrej Industries Limited I Q4 & FY 2012-13 | Performance Update | May-28-2013
AGRI BUSINESS AGRI INPUTS DELIVERS STRONG GROWTH IN FY13 DESPITE WEAK MONSOON
• Sales increased by 17% in FY 2012-13 over FY 2011-12 despite a weak monsoon impacting the overall agrochemicals industry.
• HBR sales volumes increased by 49% in FY 2012-13 over FY 2011-12.• Zymegold granules volumes have grown by 104% in FY 2012-13 over FY 2011-12.• New product pipeline on track for FY2013-14 launches.
157
207243
0
50
100
150
200
250
300
FY 2010‐11 FY 2011‐12 FY 2012‐13
FY 2012-13 Agri Inputs Sales (` crore)
18
2730
0
10
20
30
40
Q4 FY11 Q4 FY12 Q4 FY13
Quarterly Agri Inputs Sales (` crore)
19 I Godrej Industries Limited I Q4 & FY 2012-13 | Performance Update | May-28-2013
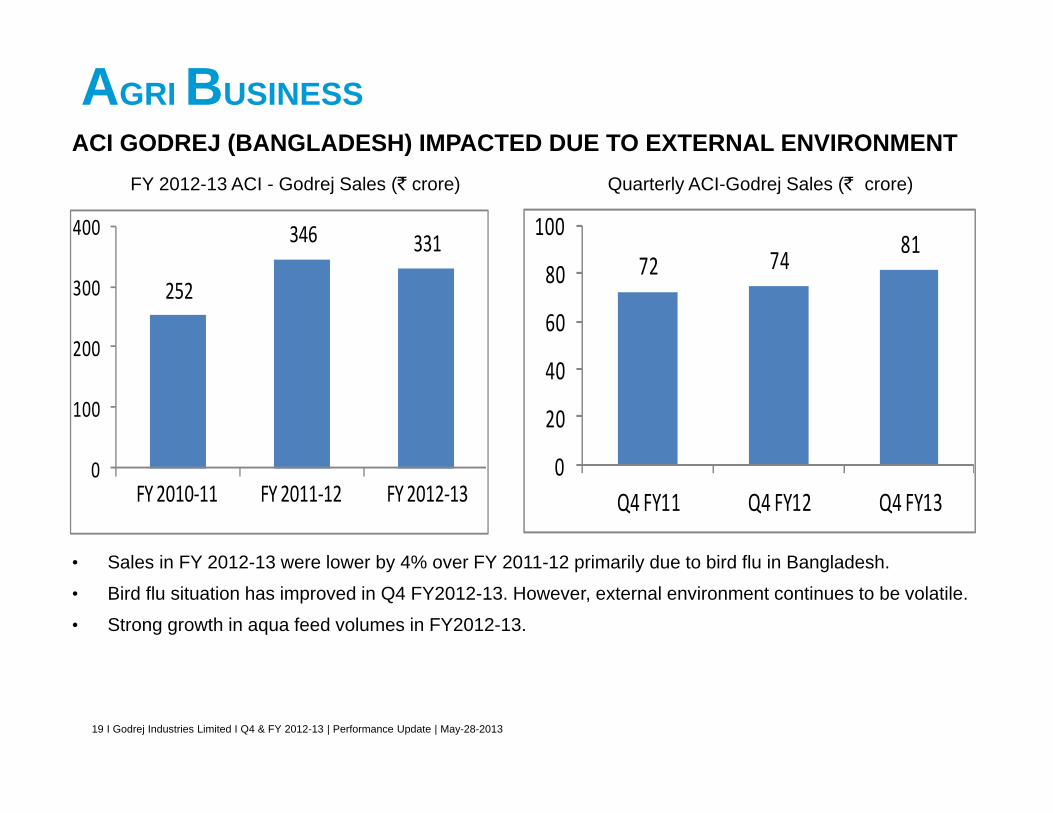
AGRI BUSINESS ACI GODREJ (BANGLADESH) IMPACTED DUE TO EXTERNAL ENVIRONMENT
• Sales in FY 2012-13 were lower by 4% over FY 2011-12 primarily due to bird flu in Bangladesh.
• Bird flu situation has improved in Q4 FY2012-13. However, external environment continues to be volatile.
• Strong growth in aqua feed volumes in FY2012-13.
FY 2012-13 ACI - Godrej Sales (` crore)
252
346 331
0
100
200
300
400
FY 2010‐11 FY 2011‐12 FY 2012‐13
72 74 81
0
20
40
60
80
100
Q4 FY11 Q4 FY12 Q4 FY13
Quarterly ACI-Godrej Sales (` crore)
20 I Godrej Industries Limited I Q4 & FY 2012-13 | Performance Update | May-28-2013
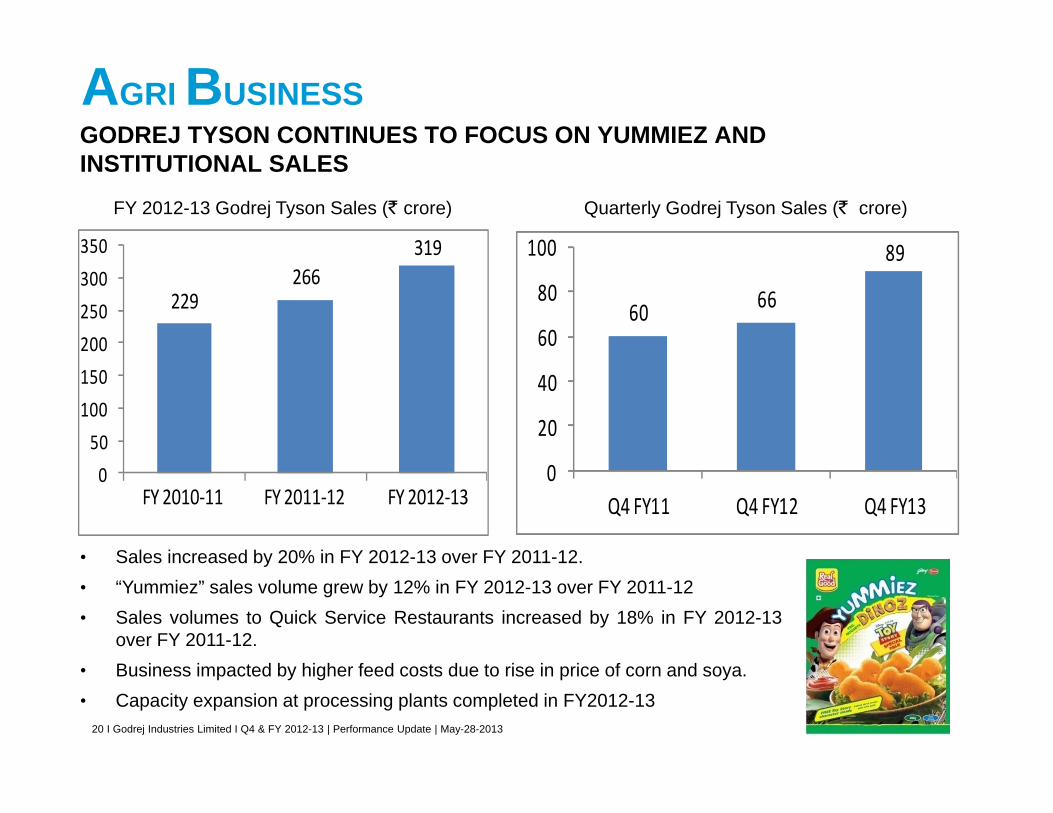
AGRI BUSINESS GODREJ TYSON CONTINUES TO FOCUS ON YUMMIEZ ANDINSTITUTIONAL SALES
• Sales increased by 20% in FY 2012-13 over FY 2011-12.• “Yummiez” sales volume grew by 12% in FY 2012-13 over FY 2011-12• Sales volumes to Quick Service Restaurants increased by 18% in FY 2012-13
over FY 2011-12.• Business impacted by higher feed costs due to rise in price of corn and soya.• Capacity expansion at processing plants completed in FY2012-13
FY 2012-13 Godrej Tyson Sales (` crore)
229266
319
050
100150200250300350
FY 2010‐11 FY 2011‐12 FY 2012‐13
60 66
89
0
20
40
60
80
100
Q4 FY11 Q4 FY12 Q4 FY13
Quarterly Godrej Tyson Sales (` crore)
21 I Godrej Industries Limited I Q4 & FY 2012-13 | Performance Update | May-28-2013
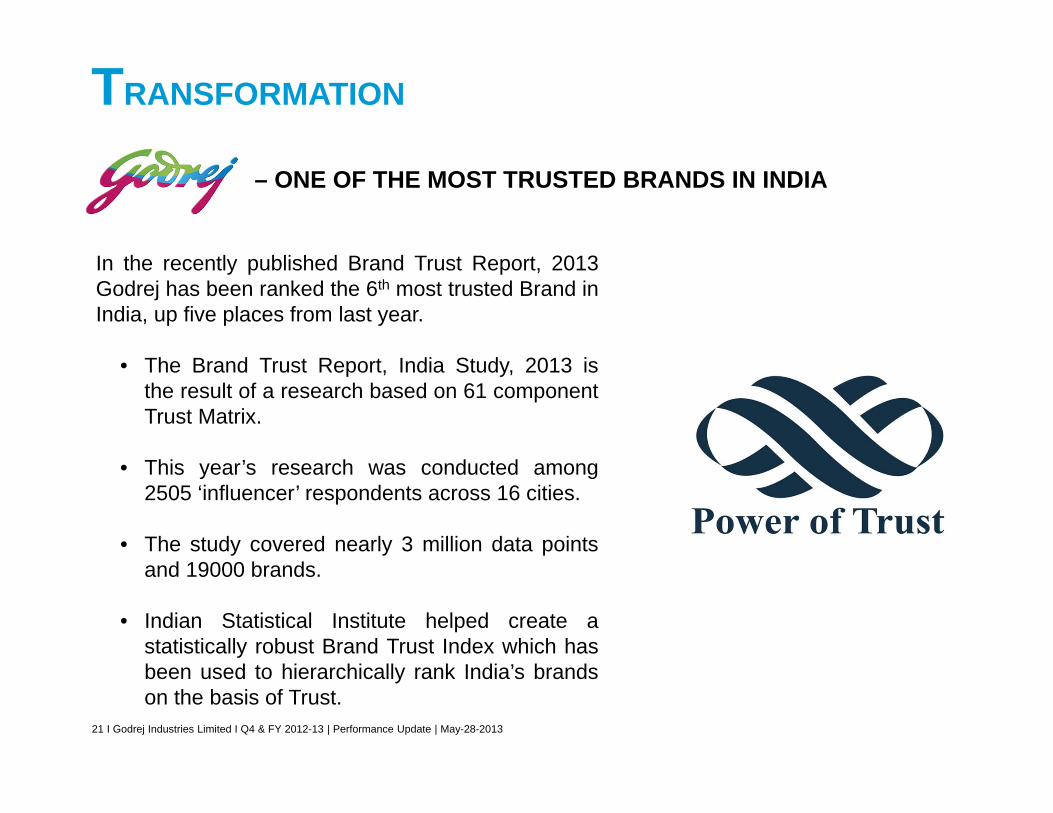
Godrej logo – ONE OF THE MOST TRUSTED BRANDS IN INDIA
In the recently published Brand Trust Report, 2013Godrej has been ranked the 6th most trusted Brand inIndia, up five places from last year.
• The Brand Trust Report, India Study, 2013 isthe result of a research based on 61 componentTrust Matrix.
• This year’s research was conducted among2505 ‘influencer’ respondents across 16 cities.
• The study covered nearly 3 million data pointsand 19000 brands.
• Indian Statistical Institute helped create astatistically robust Brand Trust Index which hasbeen used to hierarchically rank India’s brandson the basis of Trust.
TRANSFORMATION
22 I Godrej Industries Limited I Q4 & FY 2012-13 | Performance Update | May-28-2013
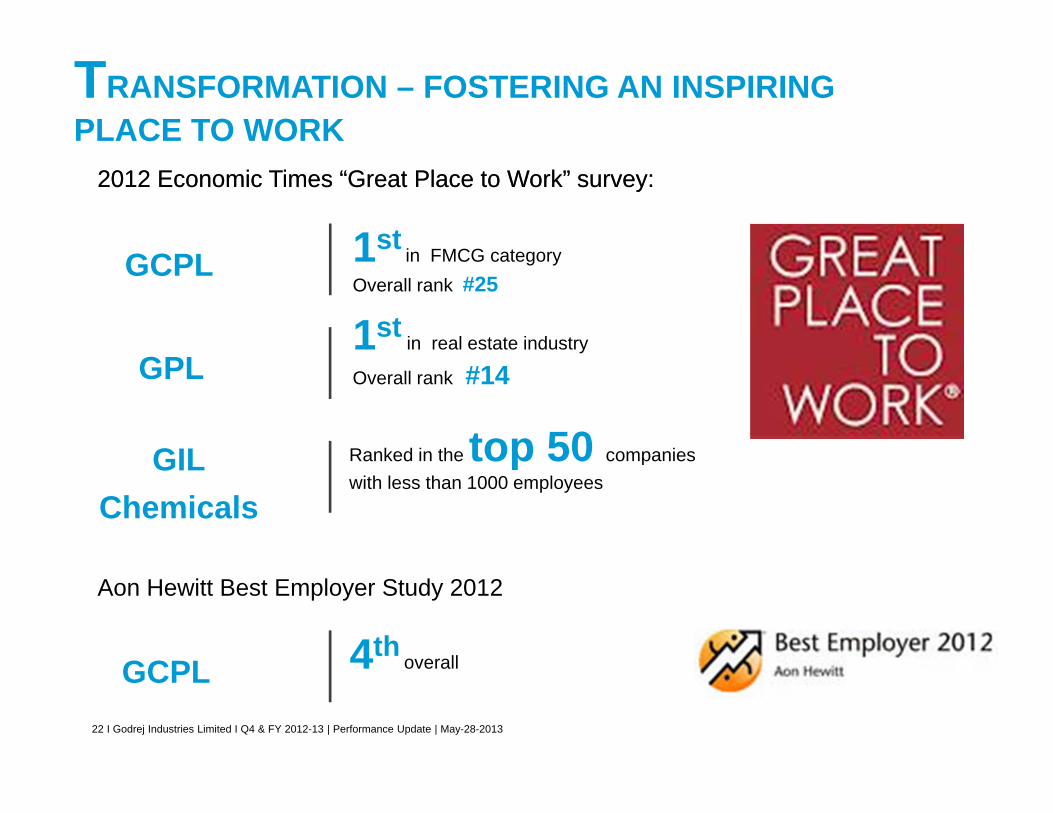
2012 Economic Times “Great Place to Work” survey:
TRANSFORMATION – FOSTERING AN INSPIRING PLACE TO WORK
GILChemicals
Ranked in the top 50 companies with less than 1000 employees
GPL1st
in real estate industry
Overall rank #14
GCPL 1stin FMCG category
Overall rank #25
2012 Economic Times “Great Place to Work” survey:
Aon Hewitt Best Employer Study 2012
GCPL 4thoverall
23 I Godrej Industries Limited I Q4 & FY 2012-13 | Performance Update | May-28-2013
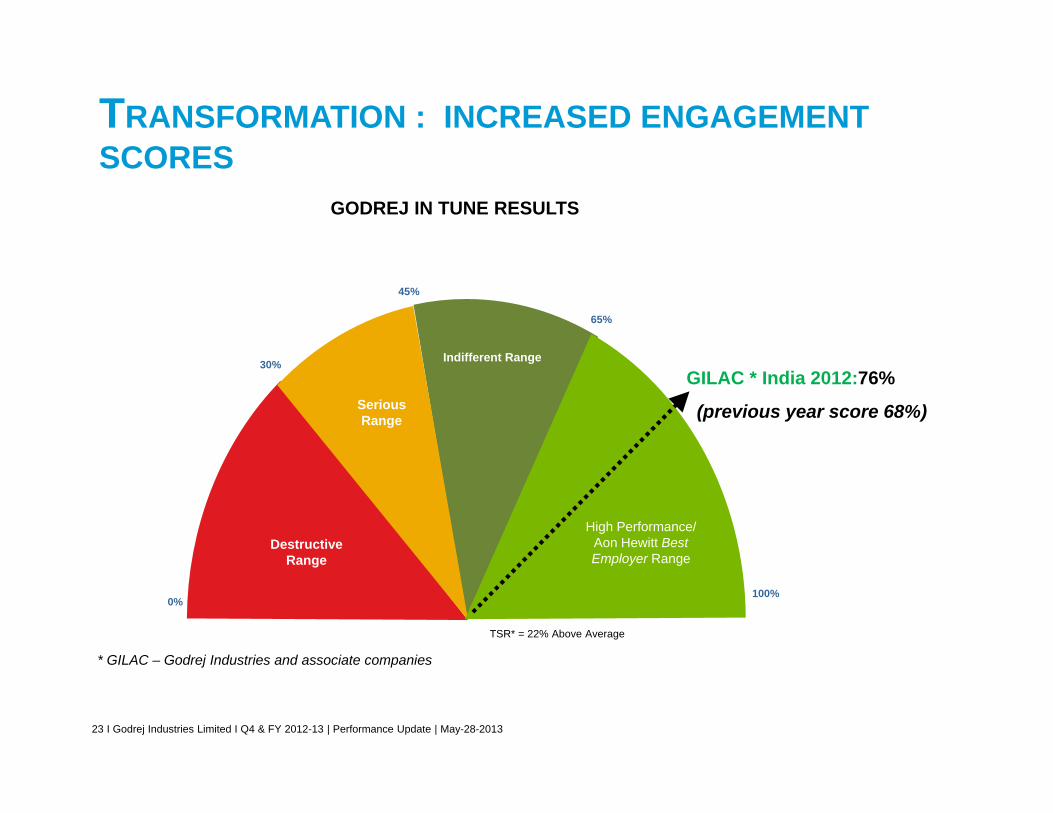
TRANSFORMATION : INCREASED ENGAGEMENT SCORES
GODREJ IN TUNE RESULTS
High Performance/
Aon Hewitt Best Employer
Range
65%
DestructiveRange
SeriousRange
30%
100%0%
45%
GILAC * India 2012:76%
(previous year score 68%)
TSR* = 22% Above Average
Indifferent Range
High Performance/Aon Hewitt BestEmployer Range
* GILAC – Godrej Industries and associate companies

24 I Godrej Industries Limited I Q4 & FY 2012-13 | Performance Update | May-28-2013
TRANSFORMATION : TRACTION ON ‘GOOD & GREEN’
ensuring employability
train 1 million rural
and urban youth in
skilled employment
creating agreener India
achieve zero waste,
carbon neutrality, positive
water balance and 30%
renewable energy
innovating for good & green
have a third of our
portfolio revenues
comprising good and/
or green products and
services
by 2020…
Beyond Business: Building a More Inclusive and Greener India
25 I Godrej Industries Limited I Q4 & FY 2012-13 | Performance Update | May-28-2013
EMERGENT NATURES BASKET(FRESH FOOD AND GOURMET STORES)
• 27 stores across 6 key metros (Mumbai, Delhi, NCR, Pune, Hyderabad, and Bengaluru).• 2 new stores added in Q4, one each in Mumbai and in New Delhi.• New flagship property inaugurated at Bandra in Mumbai.• Overall 2500 new products introduced during FY 2012-13, taking up contribution from new
products to 9% of sales.
Financial Highlights:• Net Sales at ` 35 crore in Q4 FY 2012-13 and ` 128 crore in FY 2012-13 .
• Growth in Q4 FY 2012-13 over Q4 FY 2011-12 : 49%.• Growth in FY 2012-13 over FY 2011-12 : 56%.
Awards and Recognitions:• Won two prestigious Industry Awards at the prestigious Asia Retail Congress in Q 4.• Award for Retail Excellence – Retailer of the year (food & grocery)
26 I Godrej Industries Limited I Q4 & FY 2012-13 | Performance Update | May-28-2013
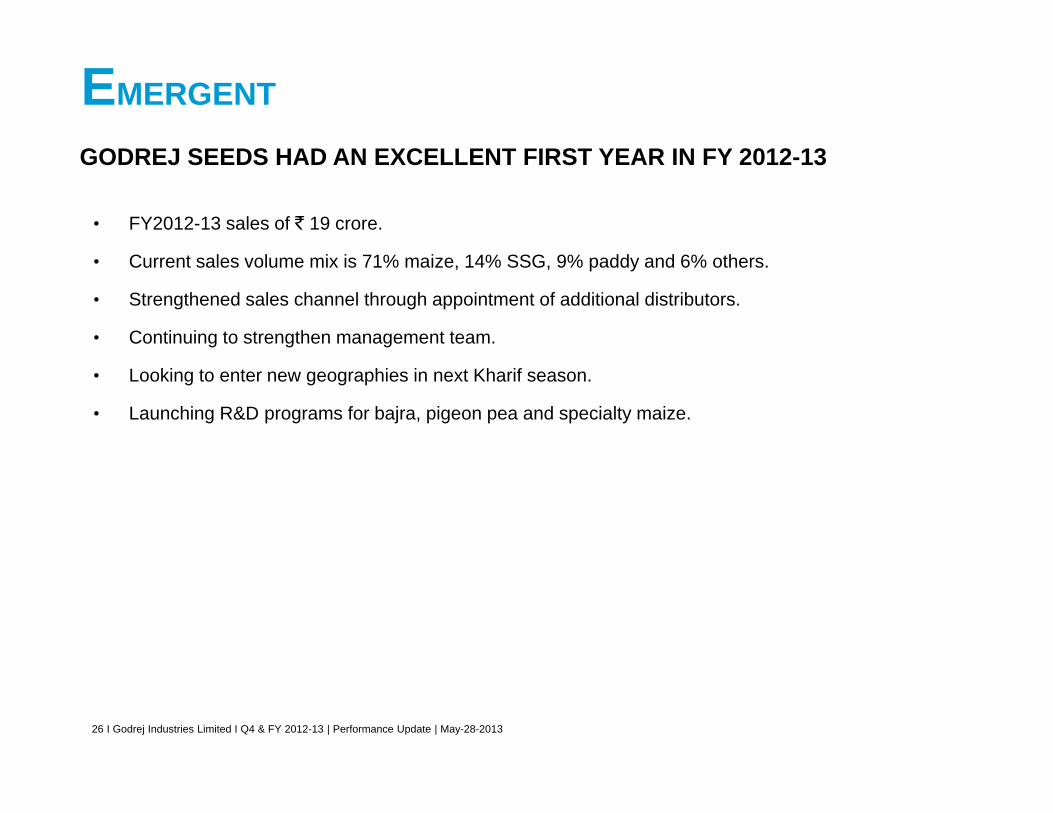
EMERGENT
GODREJ SEEDS HAD AN EXCELLENT FIRST YEAR IN FY 2012-13
• FY2012-13 sales of ` 19 crore.
• Current sales volume mix is 71% maize, 14% SSG, 9% paddy and 6% others.
• Strengthened sales channel through appointment of additional distributors.
• Continuing to strengthen management team.
• Looking to enter new geographies in next Kharif season.
• Launching R&D programs for bajra, pigeon pea and specialty maize.

27 I Godrej Industries Limited I Q4 & FY 2012-13 | Performance Update | May-28-2013
OTHER INFORMATION

28 I Godrej Industries Limited I Q4 & FY 2012-13 | Performance Update | May-28-2013
GODREJ INDUSTRIES LIMITEDCORPORATE STRUCTURE
Own Businesses:
Chemicals, Estate Management,Finance & Investments
Shareholding %
Godrej Properties61.5%
Godrej Agrovet63.7% Others
• Nature’s Basket (100%)
• Other investments
Godrej Consumer Products21.6%
29 I Godrej Industries Limited I Q4 & FY 2012-13 | Performance Update | May-28-2013
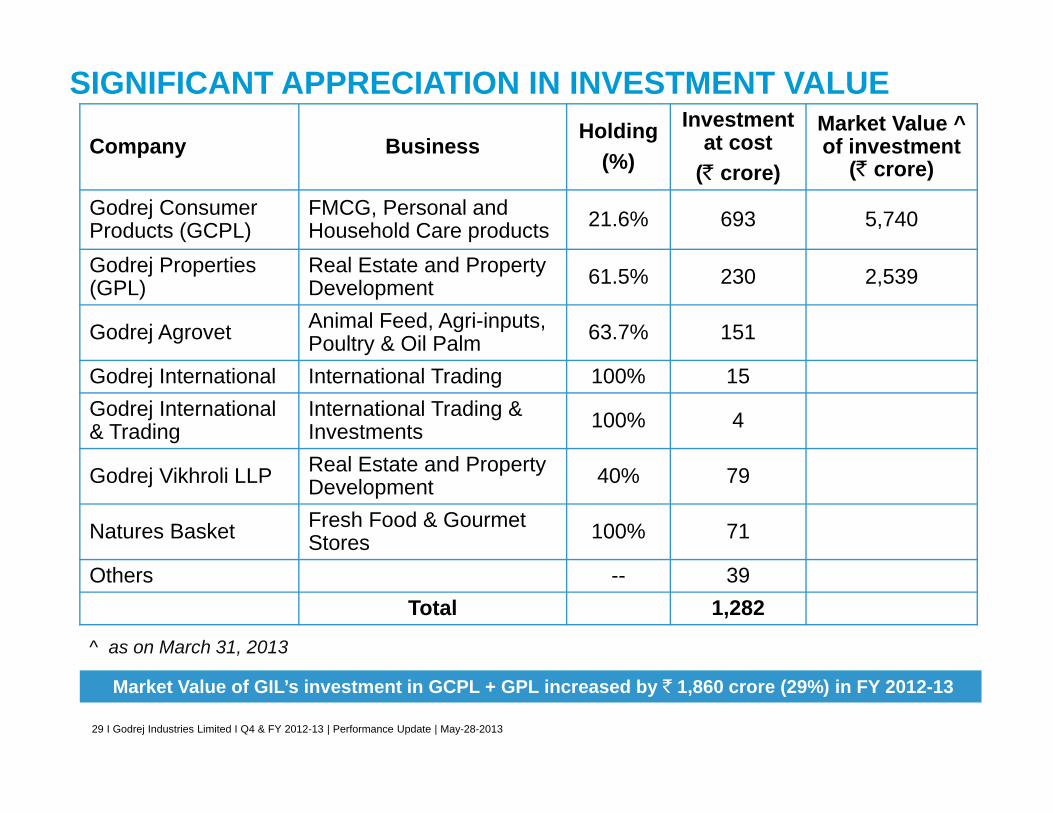
SIGNIFICANT APPRECIATION IN INVESTMENT VALUE
Company BusinessHolding
(%)
Investment at cost
(` crore)
Market Value ^ of investment
(` crore)
Godrej Consumer Products (GCPL)
FMCG, Personal and Household Care products 21.6% 693 5,740
Godrej Properties (GPL)
Real Estate and Property Development 61.5% 230 2,539
Godrej Agrovet Animal Feed, Agri-inputs, Poultry & Oil Palm 63.7% 151
Godrej International International Trading 100% 15Godrej International & Trading
International Trading & Investments 100% 4
Godrej Vikhroli LLP Real Estate and Property Development 40% 79
Natures Basket Fresh Food & Gourmet Stores 100% 71
Others -- 39Total 1,282
^ as on March 31, 2013
Market Value of GIL’s investment in GCPL + GPL increased by ` 1,860 crore (29%) in FY 2012-13

30 I Godrej Industries Limited I Q4 & FY 2012-13 | Performance Update | May-28-2013
SHAREHOLDING PATTERN AS ON MARCH 31, 2013
Category Shares held (nos.) % of holding
Promoter holding 25,12,34,174 74.96
Institutional investors :
- Mutual funds & UTI 60,87,512 1.82
- Banks, financial institutional investors & Insurance companies 53,67,214 1.60
- Foreign Institutional Investors 3,56,04,385 10.62
Others :
- Private corporate bodies 1,31,35,910 3.92
- Indian Public 2,28,74,970 6.82
- NRI/OCBs 8,61,752 0.26
Total 33,51,65,917 100.00

31 I Godrej Industries Limited I Q4 & FY 2012-13 | Performance Update | May-28-2013
THANK YOU FOR YOUR TIME AND CONSIDERATION


