sensors Review Smartphone-Based Food Diagnostic Technologies: A Review Giovanni Rateni *, Paolo Dario and Filippo Cavallo The BioRobotics Institute, Scuola Superiore Sant’Anna, Viale Rinaldo Piaggio 34, 56025 Pontedera (PI), Italy; [email protected] (P.D.); fi[email protected] (F.C.) * Correspondence: [email protected]Received: 31 March 2017; Accepted: 14 June 2017; Published: 20 June 2017 Abstract: A new generation of mobile sensing approaches offers significant advantages over traditional platforms in terms of test speed, control, low cost, ease-of-operation, and data management, and requires minimal equipment and user involvement. The marriage of novel sensing technologies with cellphones enables the development of powerful lab-on-smartphone platforms for many important applications including medical diagnosis, environmental monitoring, and food safety analysis. This paper reviews the recent advancements and developments in the field of smartphone-based food diagnostic technologies, with an emphasis on custom modules to enhance smartphone sensing capabilities. These devices typically comprise multiple components such as detectors, sample processors, disposable chips, batteries and software, which are integrated with a commercial smartphone. One of the most important aspects of developing these systems is the integration of these components onto a compact and lightweight platform that requires minimal power. To date, researchers have demonstrated several promising approaches employing various sensing techniques and device configurations. We aim to provide a systematic classification according to the detection strategy, providing a critical discussion of strengths and weaknesses. We have also extended the analysis to the food scanning devices that are increasingly populating the Internet of Things (IoT) market, demonstrating how this field is indeed promising, as the research outputs are quickly capitalized on new start-up companies. Keywords: mobile diagnostics; food analysis; smartphone sensor; lab-on-smartphone; food safety; on-site detection; biosensors; spectroscopy; IoT; cloud computing 1. Introduction Mobile diagnostics is gaining more and more attention in healthcare, environmental monitoring, and agro-food sectors, allowing rapid and on-site analysis for preliminary and meaningful information extraction. The aim is to bypass the use of expensive and bulky instrumentation-based routine tests, performed by trained personnel, with the goal of cost saving and time efficiency. Not by chance, recently a Horizon Prize regarding the challenge of developing a rapid non-invasive food scanning device has been launched [1], reflecting the fact that it comes to a hot topic not only in research, but also for the market. Moreover, this approach could have a substantial positive effect on health, environmental, and food diagnostics technologies in both developed and developing countries, leading to a democratization in measurement science, thanks to the massive volume of mobile phone users spread globally [2]. Indeed, the ubiquitous availability of smartphones throughout the world enables a broad accessibility. Smartphones can be deployed in a variety of environments, including remote or underdeveloped rural regions. For example, the current methods for ensuring food safety rely on routine, but highly resource-intensive laboratory-based examination of chemicals and/or foodborne pathogens. In remote areas, where resources are scarce, sending specimens to an analysis laboratory Sensors 2017, 17, 1453; doi:10.3390/s17061453 www.mdpi.com/journal/sensors
Received: 31 March 2017; Accepted: 14 June 2017; Published: 20 June 2017
Abstract: A new generation of mobile sensing approaches offers significant advantages overtraditional platforms in terms of test speed, control, low cost, ease-of-operation, and datamanagement, and requires minimal equipment and user involvement. The marriage of novel sensingtechnologies with cellphones enables the development of powerful lab-on-smartphone platformsfor many important applications including medical diagnosis, environmental monitoring, and foodsafety analysis. This paper reviews the recent advancements and developments in the field ofsmartphone-based food diagnostic technologies, with an emphasis on custom modules to enhancesmartphone sensing capabilities. These devices typically comprise multiple components such asdetectors, sample processors, disposable chips, batteries and software, which are integrated witha commercial smartphone. One of the most important aspects of developing these systems is theintegration of these components onto a compact and lightweight platform that requires minimalpower. To date, researchers have demonstrated several promising approaches employing varioussensing techniques and device configurations. We aim to provide a systematic classification accordingto the detection strategy, providing a critical discussion of strengths and weaknesses. We have alsoextended the analysis to the food scanning devices that are increasingly populating the Internet ofThings (IoT) market, demonstrating how this field is indeed promising, as the research outputs arequickly capitalized on new start-up companies.
Mobile diagnostics is gaining more and more attention in healthcare, environmental monitoring,and agro-food sectors, allowing rapid and on-site analysis for preliminary and meaningful informationextraction. The aim is to bypass the use of expensive and bulky instrumentation-based routine tests,performed by trained personnel, with the goal of cost saving and time efficiency. Not by chance,recently a Horizon Prize regarding the challenge of developing a rapid non-invasive food scanningdevice has been launched [1], reflecting the fact that it comes to a hot topic not only in research,but also for the market. Moreover, this approach could have a substantial positive effect on health,environmental, and food diagnostics technologies in both developed and developing countries, leadingto a democratization in measurement science, thanks to the massive volume of mobile phone usersspread globally [2]. Indeed, the ubiquitous availability of smartphones throughout the world enablesa broad accessibility. Smartphones can be deployed in a variety of environments, including remoteor underdeveloped rural regions. For example, the current methods for ensuring food safety rely onroutine, but highly resource-intensive laboratory-based examination of chemicals and/or foodbornepathogens. In remote areas, where resources are scarce, sending specimens to an analysis laboratory
can be difficult. Smartphone-based analytical platform, instead, could bypass these logistic issues viaon-site testing or remote confirmation of detection [3].
Smartphones are equipped with numerous components that can be employed for measurementand detection, such as a fast multicore processor, digital camera, battery, visual display, and intuitiveuser interface. Smartphones also possess several wireless data transfer modalities (e.g., cellulardata service, Wi-Fi, Bluetooth), allowing test results to be displayed immediately to the user and/ortransmitted to cloud databases. Nevertheless, smartphones can-not function alone as laboratoryinstruments. Rather, they need to be augmented by other accessories. Such augmented deviceshave great potential as mobile diagnostic platforms for food analysis. In recent years, many externalsensor modules have been designed and integrated with smartphones to extend their capabilitiesfor extracting more-sophisticated diagnostic information. These portable, low-cost devices have thepotential to run routine tests, which are currently performed by trained personnel using laboratoryinstrumentation, rapidly and on-site, thanks to the global widespread use of cellphones. In the field offood, this ability translates to improved awareness of what we eat. Examples include empowering themobile phone of an allergic subject with personalized diagnostic capability, or allowing rapid inspectionin the case of suspected contamination by foodborne pathogens or other hazardous contaminants.Moreover, even the agro-food sector could benefit from the development of portable lab-on-smartphoneplatforms, allowing on-field extraction of valuable data about a crop’s maturity and health state.With advances in micro-manufacture, sensor technology, and miniaturized electronics, diagnosticdevices on smartphones will be used increasingly to perform biochemical detections in healthcarediagnosis, environmental monitoring, and food evaluation in the near future [4].
Much effort has been directed toward using the mobile phone as a sensing device, as described inLi et al. [5]. The increasing number of measurement applications on smartphones is due to their growingcapabilities of sensing physical quantities by leveraging new embedded sensors or through wirelessand wired connection possibilities and smart visual interfaces, to receive measurements from differentexternal systems [6]. While many works have focused on the development of point-of-care systems forbiomedical purposes as reported in Xu et al. [7], smartphone diagnostic platforms also have emerged inother important applications. Recent existing reviews by Roda et al. [8], Liu et al. [9], and Yang et al. [10]have described these advancements. However, to the best of our knowledge, a review focused on thespecific application of smartphone-based diagnostic platforms for food analysis is not yet available.
To fill this gap, we provide a review of analytical devices able to enhance the ordinary smartphonewith diagnostic capabilities. First, we explain the review methodology we pursued to create theprovided bibliography. Then, we provide the reader with an overview of the latest relevant researchworks categorized according to the diagnostic method, with each working principle explained. We alsomention the recent commercial exploitations in this sector, and provide the most interesting solutions.We conclude by discussing our perspectives on the current limitations, challenges, and future directionsof this novel, emerging field of research.
2. Materials and Methods
This systematic review collects the latest developments in smartphone-based food analyticalsystems and food bio-sensing approaches reported from 2002 to the present. The bibliography hasbeen built upon searches in the Web of Science, US National Library of Medicine (PubMed), Scopus,and ScienceDirect databases. Reference lists of included articles and relevant review articles wereexamined to identify every study which the electronic search strategy may have missed. The searchqueries included the following terms: “(smartphone OR cellphone) AND (portable OR mobile ORinstrument OR sensor OR device OR platform) AND (sensing OR testing OR analysis OR detectionOR measurement OR monitoring) AND (food OR fruit OR meal OR beverage)”.
Application of these search keys provided 115 hits in the Web of Science in the field ‘Topic’,126 hits in PubMed in ‘All fields’, 168 hits in Scopus in ‘Article title, abstract, keywords’ fields, and31 hits in ScienceDirect in ‘Article title, abstract, keywords’ fields.
Sensors 2017, 17, 1453 3 of 22
Articles obtained from the database search were exported using Mendeley reference manager.After deletion of overlaps, this process resulted in a total of 292 records that met the search criteria.
Titles and abstracts retrieved by the electronic search were read first, to identify articles deservinga full review. Papers not written in English were excluded. Improvement of works presented by sameauthors were counted as one. After application of a title filtering process, 223 works were excludedbecause they were out of topic; 69 works remained at this stage.
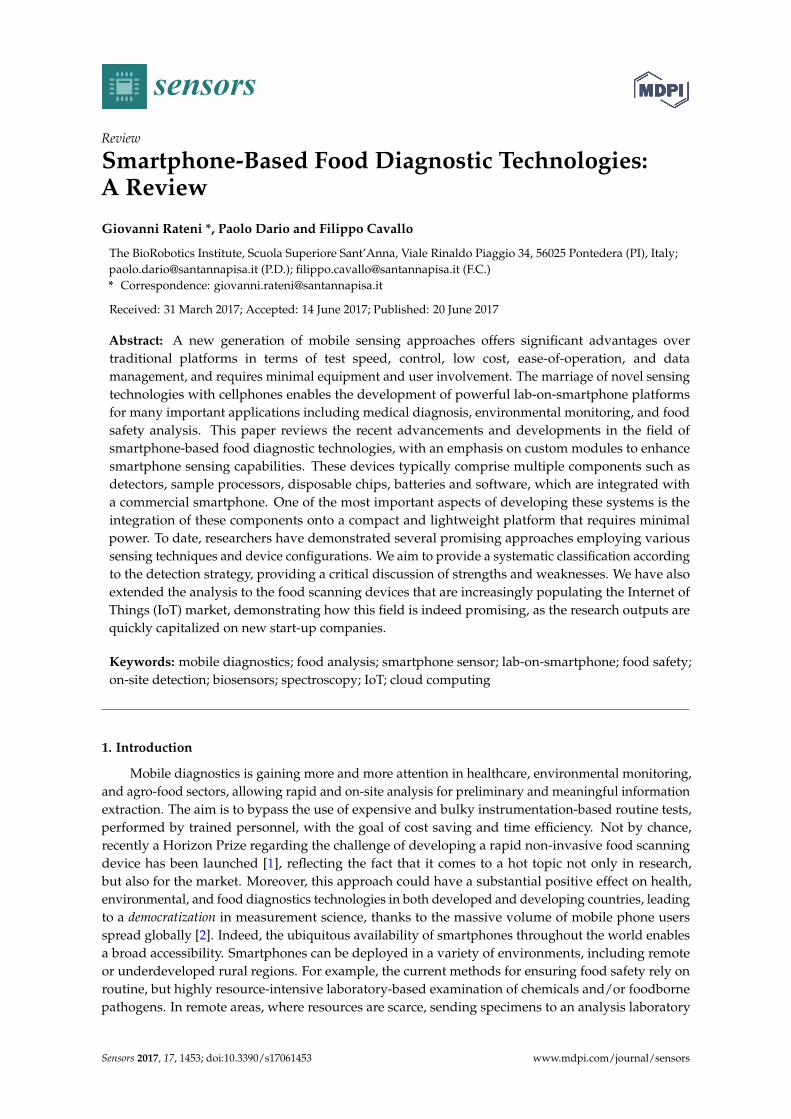
After abstract analysis, nine works were discarded because they were out of topic, and fivewere found to be interesting review papers, used to contextualize the descriptions. Then, a full-textassessment was carried out, resulting in 23 studies based on smartphone use for food intake trackingand dietary/diabetes management. These were excluded, because the focus of this review were worksdescribing the development of sensing modules used in combination with smartphone to performdiagnostic analysis. Thus, the final list included 27 published studies, which satisfy the selectioncriteria. The year of publication spans from 2012 to the present. This review was performed in Februaryand March 2017. The studies selection process is shown in Figure 1.
Sensors 2017, 17, 1453 3 of 22
Articles obtained from the database search were exported using Mendeley reference manager. After deletion of overlaps, this process resulted in a total of 292 records that met the search criteria.
Titles and abstracts retrieved by the electronic search were read first, to identify articles deserving a full review. Papers not written in English were excluded. Improvement of works presented by same authors were counted as one. After application of a title filtering process, 223 works were excluded because they were out of topic; 69 works remained at this stage.
After abstract analysis, nine works were discarded because they were out of topic, and five were found to be interesting review papers, used to contextualize the descriptions. Then, a full-text assessment was carried out, resulting in 23 studies based on smartphone use for food intake tracking and dietary/diabetes management. These were excluded, because the focus of this review were works describing the development of sensing modules used in combination with smartphone to perform diagnostic analysis. Thus, the final list included 27 published studies, which satisfy the selection criteria. The year of publication spans from 2012 to the present. This review was performed in February and March 2017. The studies selection process is shown in Figure 1.
Figure 1. Flow diagram of the paper selection process.
3. Results
Smartphone-based food diagnostic approaches can be divided into two categories: lab-on-smartphone biosensors and smartphone optical and spectroscopy. Studies are presented in chronological order for each detection method. An explanation is provided of the technique employed and the added value the integration of a smartphone in the loop provides to the approach.
Figure 1. Flow diagram of the paper selection process.
3. Results
Smartphone-based food diagnostic approaches can be divided into two categories:lab-on-smartphone biosensors and smartphone optical and spectroscopy. Studies are presented inchronological order for each detection method. An explanation is provided of the technique employedand the added value the integration of a smartphone in the loop provides to the approach.
Sensors 2017, 17, 1453 4 of 22
Table 1. Summary of recent lab-on-smartphone biosensor platforms.
Detection Target Methodology Materials LoD/Test Time/Performance Smartphone Use Reference
Escherichia coli in water Fluorescent imaging Antibody, quantum dots, UV LED 5–10 CFU mL−1 Cellphone imaging withcamera attachment [11]
rbST antibodies in milk Microsphere fluorescent immunoassay Antibody, quantum dots, UV LED andwhite LED
80% true-positive rate and 95%true-negative rate
Cellphone imaging withcamera attachment [12]
Lactose and galactose inundiluted food samples Engineered bacteria fluorescence Blue light and optical filter 1–1000 mM Cellphone imaging [13]
Peanut allergen in food samples Colorimetric assays ELISA allergen test kit, cellphone attachmentwith 2 test tubes and 2 LEDs
~1 parts per million (ppm),20-min preparation phase
Cellphone assay with cameraattachment [14]
Aflatoxin B1 in maize Lateral flow immunoassay Paper strip, close-up lens and a white LED 5 µg/kg Smartphone imaging via LFIAreader adapter [15]
BDE-47 in food sample Microfluidics and competitive ELISA Arduino Nano, PCB, microfluidic chip Readout time of 15 min and inputsample volume considerably reduced
Smartphone as power source,imaging reader and cloud sender [16]
Red wine properties Paper microfluidics, colorimetric assay,and PCA Chemical dyes Successful distinction of red wines by
their grape varieties and oxidation. Smartphone imaging [17]
Amines as indication offoodborne pathogens in meat
Membrane technology colorimetry andunsupervised chemometric tools Dyes Down to 1 ppm concentration of amine Camera imaging [18]
Antibiotic residues in milk SPE and fluorescence spectroscopy Photography lightbox with fluorescent light LoC 0.50 mL−1 and LoQ 1.50 µg mL−1 Smartphone camera used asspectrometer [19]
Glutamate in food compound,instant soup and wines Paper-based colorimetric assay Glutamate-specific enzyme 0.028 mmol L−1 Camera acquisition and analysis [20]
ALP as indicator of incorrectmilk pasteurization Disposable lateral flow-through strip Sample pad 0.1 U L−1, within 10 min with a detection
range of 0.1–150 U L−1Image acquisition and
Matlab analysis [21]
OA and STX in shellfish Competitive immunoassay strip 3D-printed smartphone strip adapter 2.800 ng mL−1 for OA and9.808 ng mL−1 for STX in 30 min
Camera acquisition via strip adapterand data processing [22]
Fluoride in water Colorimetric imaging Compact sample chamber adapter forsmartphone Linear range 0–2 mg L−1 Smartphone colorimeter [23]
Catechols in water Colorimetric imaging 96-well sensor array, light-tight box,white LED
PCA, HCA and LDA for qualitydiscrimination and PLS for quantitative
determination
Smartphone colorimeter coupled toremote server [24]
sensor, Wi-Fi module 1.4 × 10⁴ CFU mL−1 Dedicated app to operate the systemand upload on internet server [25]
Escherichia coli O157:H7 andSalmonella enterica
DNA transduction onmicrofluidic device Magnetic beads Down to 20 genomic copies of E. coli Custom written app for cell phone
image analysis [26]
Clenbuterol Electric field-driven immunoreaction Functionalized electrodes 0.076 ng mL−1 CLB in 6 min USB Smartphone tool biochip [27]
Pattern recognition of Brazilianhoney samples Cyclic voltammetry assay Electrode of gold, homemade potentiostat
with USB connection and Bluetooth moduleSuccessfully generation of voltammetricfingerprints of numerous honey samples
Chemometric data processingon smartphone [28]
Sensors 2017, 17, 1453 5 of 22
3.1. Lab-On-Smartphone Biosensors
Biosensors are analytical devices that integrate a bio-receptors with an appropriate transducingmethod to detect analytes of interest. The specific interaction between the target analyte and thereceptor produces an output measurable signal, which highlights the presence of the sought element.Thus, this approach has high selectivity, since direct detection of the target analyte is achieved.However it always includes an invasive sample pre-treatment phase to give rise to transduction.Biosensors allow low-cost, and fast analysis, with results in a few minutes, and show perspectives forminiaturization and portability. Taking advantage of the combined use of smartphone and adaptedbiochemical assay, biosensor-based analytical systems are promising tools for on-site detection ofanalytes including contaminants, drugs, pesticide residues, and foodborne pathogens. A detailedoverview of the revised Lab-On-Smartphone Biosensors works is provided with Table 1.
3.1.1. Fluorescence Imaging Using Smartphone
Fluorescence imaging is the visualization of fluorescent dyes as labels for biological or chemicalmolecules of interest. It enables a wide range of experimental observations including the locationof gene expression, protein expression and molecular interactions in cells and tissues. To label abiological molecule of interest, a fluorescent marker, which is able to bind the target molecule, has to beintroduced. The setups found in the revised works, which perform fluorescence imaging, also includea mono-chromatic light source, typically a UV LED, to generate the dye excitation and a smartphonecamera used as detector to collect and measure the fluorescence intensity. The presented systems,proposed for a specific detection application, have the advantage of being applicable to other targets ofinterest through the use of different specific molecular dyes.
Zhu et al. [11] developed a portable Escherichia coli detection platform for screening of water andfood samples. The cellphone-based fluorescence imaging platform was specifically realized to quantifythe bacterial concentration in a water sample loaded into glass capillaries, opportunely functionalizedwith antibody directed against E. coli. Secondary antibodies, conjugated with quantum dots, weresubsequently dispensed into the capillaries and served as the fluorescence signal. Quantum dotsare inorganic nanocrystals with unique optical and chemical properties that give them exceptionalbrightness and photo-stability. In this case, UV-LEDs provided the excitation signal. The emission fromthe quantum dots through an additional lens was conveyed to the phone camera unit. A light-weight(~28 g) and compact (3.5 cm × 5.5 cm × 2.4 cm) attachment to the existing camera unit of a cellphonewas designed to host the diagnostic platform. By quantifying the fluorescent light emission from eachcapillary tube, the concentration of E. coli in the sample was determined. The authors reported thatthe test can be completed within 2 h, including sample preparation, sample loading and incubation,with a detection limit of 5–10 CFU mL−1 in buffer solution. They also demonstrated the efficacy ofthis approach using fat-free milk as a matrix, where a similar detection limit was achieved. The sameconcept was used by Ludwig et al. [12] for the detection of the presence of anti-recombinant bovinesomatotropin (rbST) antibodies in milk, which are endogenously produced upon administrationof rbST, a milk production enhancer in dairy cattle which is illegal in the EU and represents apublic health concern in the US. To monitor the presence of this biomarker, multiple immunoassaymicrospheres were used for the detection of multiple antibodies simultaneously within a small volumeof a single sample. In addition to the same setup previously described, a white LED for dark-fieldimaging of all microspheres present in the sample was used. The cellphone-based diagnostic platformwas successfully applied to milk sample extracts from rbST-treated and untreated cows. An 80%true-positive rate and 95% true-negative rate were achieved. The designed system can be adaptedto any available cellphone that has a camera module simply by modifying the dimensions of thecellphone holder and 3D-printing another one accordingly (Figure 2).
Sensors 2017, 17, 1453 6 of 22
Sensors 2017, 17, 1453 6 of 22
Figure 2. Schematic overview of the cellphone attachment for fluorescence diagnostics developed by Ludwig et al. [14]. Adapted with permission of Springer.
Mora et al. [13] developed a biosensor to accurately quantify lactose or galactose in undiluted food samples using genetically modified bacteria (E. coli) engineered to fluoresce in response to the analyte to reveal its diffusion behavior when using a blue-light source and optical filter. The authors reported detection limit concentrations in the range of 1–1000 mM requiring a sample volume of 1–10 μL and a storability of at least seven days at 4 °C without losing functionality. Bacteria possibily could be reprogrammed to serve as biosensors for other molecules. In this case, the smartphone is proposed as an alternative to visual inspection to quantify the fluorescent read-out.
3.1.2. Smartphone-Based Colorimetric Readers
Colorimetric assay is widely used in biochemistry to test for the presence of several analytes of interest, such as enzymes, antibodies, and peptides. It works by measuring the amount of light absorbed by a chromogenic reagent or a reaction product at a characteristic wavelength. This wavelength is specific to the reagent being measured. The amount of absorbed light is proportional to the concentration of reagent present in the assay well. Different solutions must be made, including a control solution for reference. In this section, the most used architecture is a smartphone camera used to detect the read-out from assay reactions.
Coskun et al. [14] presented a cellphone-based system for colorimetric assays performed in tubes toward sensitive and specific detection of peanut allergen in food samples. They developed a cellphone attachment composed of two tubes, for the test and control solution, illuminated by two LEDs, whose wavelength matches the absorbance wavelength of the reagent activated in the test tube. The light intensity was measured by a dedicated application developed on the smartphone, to quantify the allergen concentration, after a calibration was performed with known concentrations of analyte within the test tube. The colorimetric assays were conducted based on an ELISA test kit specific to peanuts. A 20-min preparation phase was described for sampling and treatment of the target food sample to be ready for the digital reader implemented on the cellphone. The separate optical readout, optimized illumination and imaging configuration resulted to be sensitive, robust, repeatable and immune from manual reading errors compared to visual inspection which can be subject to variable light conditions. Weighing approximately 40 g, this digital tool was able to quantify peanut contamination in food samples with a minimum detection level of ~1 parts per million (ppm) (Figure 3).
Figure 2. Schematic overview of the cellphone attachment for fluorescence diagnostics developed byLudwig et al. [14]. Adapted with permission of Springer.
Mora et al. [13] developed a biosensor to accurately quantify lactose or galactose in undilutedfood samples using genetically modified bacteria (E. coli) engineered to fluoresce in response to theanalyte to reveal its diffusion behavior when using a blue-light source and optical filter. The authorsreported detection limit concentrations in the range of 1–1000 mM requiring a sample volume of1–10 µL and a storability of at least seven days at 4 ◦C without losing functionality. Bacteria possibilycould be reprogrammed to serve as biosensors for other molecules. In this case, the smartphone isproposed as an alternative to visual inspection to quantify the fluorescent read-out.
3.1.2. Smartphone-Based Colorimetric Readers
Colorimetric assay is widely used in biochemistry to test for the presence of several analytesof interest, such as enzymes, antibodies, and peptides. It works by measuring the amount oflight absorbed by a chromogenic reagent or a reaction product at a characteristic wavelength.This wavelength is specific to the reagent being measured. The amount of absorbed light is proportionalto the concentration of reagent present in the assay well. Different solutions must be made, including acontrol solution for reference. In this section, the most used architecture is a smartphone camera usedto detect the read-out from assay reactions.
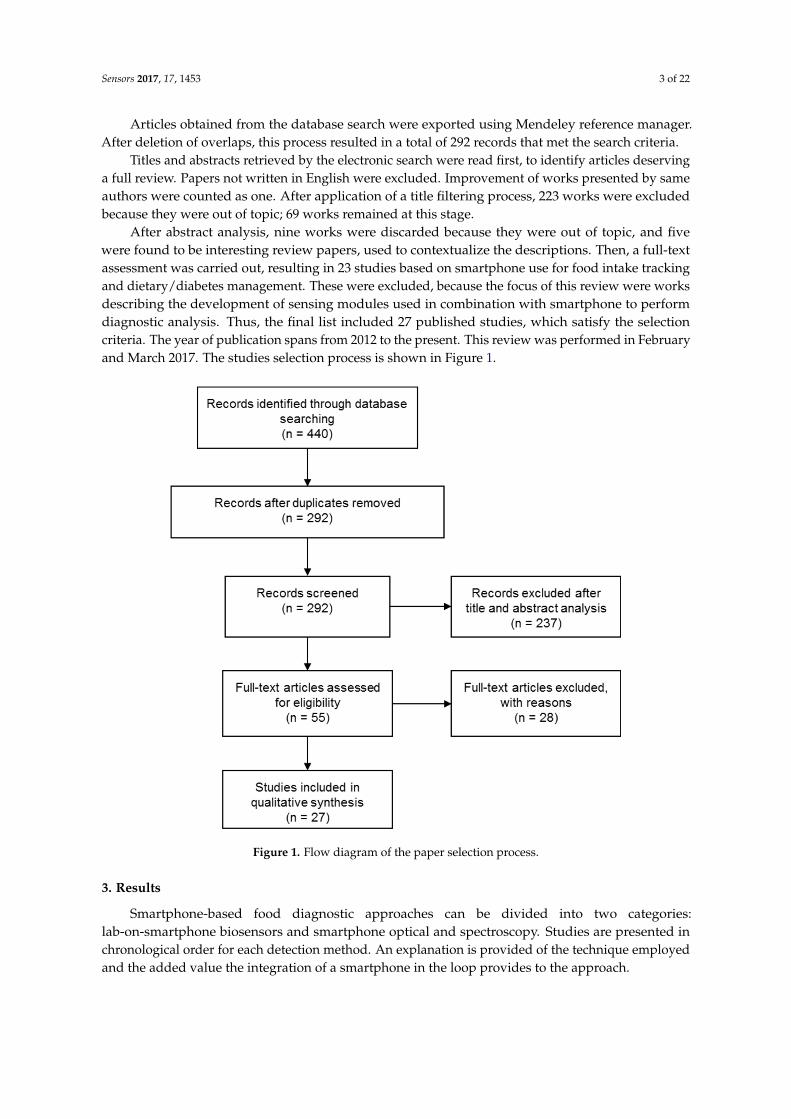
Coskun et al. [14] presented a cellphone-based system for colorimetric assays performed in tubestoward sensitive and specific detection of peanut allergen in food samples. They developed a cellphoneattachment composed of two tubes, for the test and control solution, illuminated by two LEDs, whosewavelength matches the absorbance wavelength of the reagent activated in the test tube. The lightintensity was measured by a dedicated application developed on the smartphone, to quantify theallergen concentration, after a calibration was performed with known concentrations of analyte withinthe test tube. The colorimetric assays were conducted based on an ELISA test kit specific to peanuts.A 20-min preparation phase was described for sampling and treatment of the target food sample to beready for the digital reader implemented on the cellphone. The separate optical readout, optimizedillumination and imaging configuration resulted to be sensitive, robust, repeatable and immune frommanual reading errors compared to visual inspection which can be subject to variable light conditions.Weighing approximately 40 g, this digital tool was able to quantify peanut contamination in foodsamples with a minimum detection level of ~1 parts per million (ppm) (Figure 3).
Sensors 2017, 17, 1453 7 of 22Sensors 2017, 17, 1453 7 of 22
Figure 3. The iTube platform for performing cellphone-based colorimetric assays developed by Coskun et al. Adapted from [16] DOI: 10.1039/c2lc41152k with permission from The Royal Society of Chemistry. All rights reserved.
Lee et al. [15] developed a simple, rapid, and accurate smartphone-based lateral flow immunoassay (LFIA) reader for diagnosis of aflatoxin-B1 in maize. Aflatoxins are toxic secondary metabolites produced by a species of corn fungi. The Lateral Flow Immunoassay (LFIA) is a paper strip-based method for the detection and quantification of analytes. A liquid sample containing the analyte of interest moves under capillary action through various zones of strip, on which molecules that can interact with the analyte are attached. Starting from one end, the sample flows along the strip and it is bound by specific antibodies conjugated with colored or fluorescent particles, finally arriving at the other end of detection in which the recognition takes place, whose read-out is detectable by visual inspection or dedicated reader. In this work, a Samsung Galaxy S2 Smartphone is used as LFIA reader together with a close-up lens and a white LED, to improve the detection limit and sensitivity of the LFIA for AFB1 in maize, minimizing the read-out errors caused by visual inspection. The final result did not rely on the subjective interpretation of an operator. Combining microfluidics and competitive ELISA, Chen et al. [16] developed a smartphone-based portable system for the mobile detection of BDE-47, a common environmental contaminant in food samples. Through the USB port, the smartphone powered an Arduino Nano microcontroller integrated with a PCB, which in turn drove current to a microfluidic-based ELISA chip, triggering the analyte-mediated reaction. The colorimetric read-out was then acquired by the smartphone camera, and the image is then wirelessly transferred to a computing server for post-processing. This lab-on-chip assay showed a significant faster readout time of 15 min compared to conventional ELISAs which typically take at least 2 h. The input sample volume was considerably reduced with respect to laboratory ELISA. This allows the device to be field-deployable in a point-of-care to analyse less-than-ideal samples that the conventional method is insensitive and incapable of detecting (Figure 4).
Figure 3. The iTube platform for performing cellphone-based colorimetric assays developed by Coskunet al. Adapted from [16] DOI: 10.1039/c2lc41152k with permission from The Royal Society of Chemistry.All rights reserved.
Lee et al. [15] developed a simple, rapid, and accurate smartphone-based lateral flowimmunoassay (LFIA) reader for diagnosis of aflatoxin-B1 in maize. Aflatoxins are toxic secondarymetabolites produced by a species of corn fungi. The Lateral Flow Immunoassay (LFIA) is a paperstrip-based method for the detection and quantification of analytes. A liquid sample containing theanalyte of interest moves under capillary action through various zones of strip, on which moleculesthat can interact with the analyte are attached. Starting from one end, the sample flows along thestrip and it is bound by specific antibodies conjugated with colored or fluorescent particles, finallyarriving at the other end of detection in which the recognition takes place, whose read-out is detectableby visual inspection or dedicated reader. In this work, a Samsung Galaxy S2 Smartphone is usedas LFIA reader together with a close-up lens and a white LED, to improve the detection limit andsensitivity of the LFIA for AFB1 in maize, minimizing the read-out errors caused by visual inspection.The final result did not rely on the subjective interpretation of an operator. Combining microfluidicsand competitive ELISA, Chen et al. [16] developed a smartphone-based portable system for the mobiledetection of BDE-47, a common environmental contaminant in food samples. Through the USB port,the smartphone powered an Arduino Nano microcontroller integrated with a PCB, which in turn drovecurrent to a microfluidic-based ELISA chip, triggering the analyte-mediated reaction. The colorimetricread-out was then acquired by the smartphone camera, and the image is then wirelessly transferred toa computing server for post-processing. This lab-on-chip assay showed a significant faster readouttime of 15 min compared to conventional ELISAs which typically take at least 2 h. The input samplevolume was considerably reduced with respect to laboratory ELISA. This allows the device to befield-deployable in a point-of-care to analyse less-than-ideal samples that the conventional method isinsensitive and incapable of detecting (Figure 4).
Sensors 2017, 17, 1453 8 of 22
Sensors 2017, 17, 1453 8 of 22
Figure 4. Schematic of the integrated mobile-interfaced diagnostic platform developed by Chen et al. Reprinted from [18], with the permission of AIP Publishing.
Park et al. [17] proposed a portable quality-control method for appraising red wine properties, by means of paper microfluidic channels and colorimetric assay performed with chemical dyes. Six different red wines were used as “model sample set” and four red wines were tested as “evaluation sample set”. A smartphone was used to acquire and analyse the colorimetric result, later processed by means of PCA analysis. Successful distinction of red wines by their grape varieties and oxidation was accomplished. PC1 was interpreted as explaining the sweetness (sweet or dry), while PC2 the body (light or heavy) of red wine. Minimization of sample-to-sample variation by splitting a single, undiluted red wine sample into eight different wells and filtering particulate matters by paper improved the reproducibility and led to smaller errors, resulting in better separation in the PCA plot. Such image processing and PCA can eventually be implemented as a stand-alone smartphone application, or within a cloud computing environment. Bueno et al. [18] developed a non-destructive method to discriminate three amines, as a diagnostic approach to detect foodborne pathogens in meat, combining membrane technology, dyes, chemometric tools and smartphone technology. A colorimetric test was evaluated using a smartphone and unsupervised chemometric tools, PCA and HCA, achieving a detection limit down to 1 ppm concentration of amine. To demonstrate the effectiveness of the proposed system in a real sample, sample meat were adulterated with amines and then analysed, but to infer the presence of bacteria, authors foresaw the necessity to test the biogenic amine production profile. With the aim of detecting antibiotic residues in milk, Masawat et al. [19] described the development of a smartphone-based digital image colorimeter. Although this work is not properly based on the use of biosensors, the analysis proposed here involved a sample pre-treatment procedure by using invasive Solid-Phase Extraction (SPE) technique to isolate and concentrate analyte of interest, tetracycline (TC), from the liquid matrix in which was dissolved. To protect the system from outside light, a photography lightbox was made with the internal walls sprayed with black paint. The TC solution filled in a quartz cuvette was located in a sample cell holder under fluorescent light inside the lightbox. An iPhone model was used for capturing digital images from outside the box via a drill hole, and the ColorConc application was used to analyze the images. A software calibration phase was performed with a set of images obtained from reference concentrations. Thus, the Euclidean distance algorithm was used to find the closest match to the given image, to identify sample concentration. Results were compared with double-beam UV–Vis Spectrophotometer. Obtained Limit of Detection (LOD) and Limit of Quantitation (LOQ) for TC concentration measurement, 0.50 and 1.50 μg mL−1, respectively, were higher than the Maximum Residue Limit (MRL) of TC in milk (0.1 μg mL−1). Thus, the pre-concentration of the sample in milk with SPE is necessary to detect TC at low concentration, with the effect of losing portability and ease
Figure 4. Schematic of the integrated mobile-interfaced diagnostic platform developed by Chen et al.Reprinted from [18], with the permission of AIP Publishing.
Park et al. [17] proposed a portable quality-control method for appraising red wine properties,by means of paper microfluidic channels and colorimetric assay performed with chemical dyes.Six different red wines were used as “model sample set” and four red wines were tested as “evaluationsample set”. A smartphone was used to acquire and analyse the colorimetric result, later processed bymeans of PCA analysis. Successful distinction of red wines by their grape varieties and oxidation wasaccomplished. PC1 was interpreted as explaining the sweetness (sweet or dry), while PC2 the body(light or heavy) of red wine. Minimization of sample-to-sample variation by splitting a single, undilutedred wine sample into eight different wells and filtering particulate matters by paper improved thereproducibility and led to smaller errors, resulting in better separation in the PCA plot. Such imageprocessing and PCA can eventually be implemented as a stand-alone smartphone application, or withina cloud computing environment. Bueno et al. [18] developed a non-destructive method to discriminatethree amines, as a diagnostic approach to detect foodborne pathogens in meat, combining membranetechnology, dyes, chemometric tools and smartphone technology. A colorimetric test was evaluatedusing a smartphone and unsupervised chemometric tools, PCA and HCA, achieving a detection limitdown to 1 ppm concentration of amine. To demonstrate the effectiveness of the proposed systemin a real sample, sample meat were adulterated with amines and then analysed, but to infer thepresence of bacteria, authors foresaw the necessity to test the biogenic amine production profile.With the aim of detecting antibiotic residues in milk, Masawat et al. [19] described the development ofa smartphone-based digital image colorimeter. Although this work is not properly based on the use ofbiosensors, the analysis proposed here involved a sample pre-treatment procedure by using invasiveSolid-Phase Extraction (SPE) technique to isolate and concentrate analyte of interest, tetracycline (TC),from the liquid matrix in which was dissolved. To protect the system from outside light, a photographylightbox was made with the internal walls sprayed with black paint. The TC solution filled in a quartzcuvette was located in a sample cell holder under fluorescent light inside the lightbox. An iPhonemodel was used for capturing digital images from outside the box via a drill hole, and the ColorConcapplication was used to analyze the images. A software calibration phase was performed with a set ofimages obtained from reference concentrations. Thus, the Euclidean distance algorithm was used tofind the closest match to the given image, to identify sample concentration. Results were compared withdouble-beam UV–Vis Spectrophotometer. Obtained Limit of Detection (LOD) and Limit of Quantitation(LOQ) for TC concentration measurement, 0.50 and 1.50 µg mL−1, respectively, were higher than the
Sensors 2017, 17, 1453 9 of 22
Maximum Residue Limit (MRL) of TC in milk (0.1 µg mL−1). Thus, the pre-concentration of the samplein milk with SPE is necessary to detect TC at low concentration, with the effect of losing portabilityand ease of use of the proposed system. Monosik et al. [20] presented a paper-based colorimetricassay for the analysis of selected food compounds, instant soups and wines. Food samples weretreated with a glutamate-specific enzyme, and colorimetric analyses were conducted after taking apicture with a smartphone, using freeware ImageJ. As a result, a limit of detection of 0.028 mmol L−1
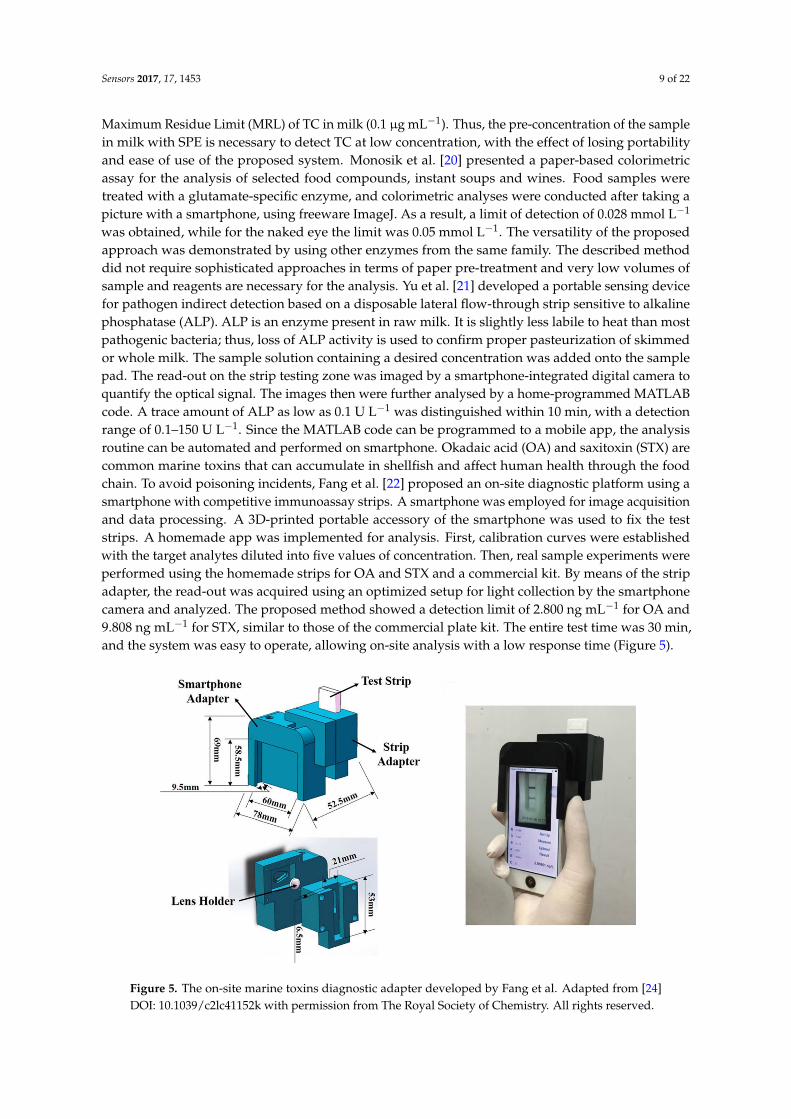
was obtained, while for the naked eye the limit was 0.05 mmol L−1. The versatility of the proposedapproach was demonstrated by using other enzymes from the same family. The described methoddid not require sophisticated approaches in terms of paper pre-treatment and very low volumes ofsample and reagents are necessary for the analysis. Yu et al. [21] developed a portable sensing devicefor pathogen indirect detection based on a disposable lateral flow-through strip sensitive to alkalinephosphatase (ALP). ALP is an enzyme present in raw milk. It is slightly less labile to heat than mostpathogenic bacteria; thus, loss of ALP activity is used to confirm proper pasteurization of skimmedor whole milk. The sample solution containing a desired concentration was added onto the samplepad. The read-out on the strip testing zone was imaged by a smartphone-integrated digital camera toquantify the optical signal. The images then were further analysed by a home-programmed MATLABcode. A trace amount of ALP as low as 0.1 U L−1 was distinguished within 10 min, with a detectionrange of 0.1–150 U L−1. Since the MATLAB code can be programmed to a mobile app, the analysisroutine can be automated and performed on smartphone. Okadaic acid (OA) and saxitoxin (STX) arecommon marine toxins that can accumulate in shellfish and affect human health through the foodchain. To avoid poisoning incidents, Fang et al. [22] proposed an on-site diagnostic platform using asmartphone with competitive immunoassay strips. A smartphone was employed for image acquisitionand data processing. A 3D-printed portable accessory of the smartphone was used to fix the teststrips. A homemade app was implemented for analysis. First, calibration curves were establishedwith the target analytes diluted into five values of concentration. Then, real sample experiments wereperformed using the homemade strips for OA and STX and a commercial kit. By means of the stripadapter, the read-out was acquired using an optimized setup for light collection by the smartphonecamera and analyzed. The proposed method showed a detection limit of 2.800 ng mL−1 for OA and9.808 ng mL−1 for STX, similar to those of the commercial plate kit. The entire test time was 30 min,and the system was easy to operate, allowing on-site analysis with a low response time (Figure 5).
Sensors 2017, 17, 1453 9 of 22
of use of the proposed system. Monosik et al. [20] presented a paper-based colorimetric assay for the analysis of selected food compounds, instant soups and wines. Food samples were treated with a glutamate-specific enzyme, and colorimetric analyses were conducted after taking a picture with a smartphone, using freeware ImageJ. As a result, a limit of detection of 0.028 mmol L−1 was obtained, while for the naked eye the limit was 0.05 mmol L−1. The versatility of the proposed approach was demonstrated by using other enzymes from the same family. The described method did not require sophisticated approaches in terms of paper pre-treatment and very low volumes of sample and reagents are necessary for the analysis. Yu et al. [21] developed a portable sensing device for pathogen indirect detection based on a disposable lateral flow-through strip sensitive to alkaline phosphatase (ALP). ALP is an enzyme present in raw milk. It is slightly less labile to heat than most pathogenic bacteria; thus, loss of ALP activity is used to confirm proper pasteurization of skimmed or whole milk. The sample solution containing a desired concentration was added onto the sample pad. The read-out on the strip testing zone was imaged by a smartphone-integrated digital camera to quantify the optical signal. The images then were further analysed by a home-programmed MATLAB code. A trace amount of ALP as low as 0.1 U L−1 was distinguished within 10 min, with a detection range of 0.1–150 U L−1. Since the MATLAB code can be programmed to a mobile app, the analysis routine can be automated and performed on smartphone. Okadaic acid (OA) and saxitoxin (STX) are common marine toxins that can accumulate in shellfish and affect human health through the food chain. To avoid poisoning incidents, Fang et al. [22] proposed an on-site diagnostic platform using a smartphone with competitive immunoassay strips. A smartphone was employed for image acquisition and data processing. A 3D-printed portable accessory of the smartphone was used to fix the test strips. A homemade app was implemented for analysis. First, calibration curves were established with the target analytes diluted into five values of concentration. Then, real sample experiments were performed using the homemade strips for OA and STX and a commercial kit. By means of the strip adapter, the read-out was acquired using an optimized setup for light collection by the smartphone camera and analyzed. The proposed method showed a detection limit of 2.800 ng mL−1 for OA and 9.808 ng mL−1 for STX, similar to those of the commercial plate kit. The entire test time was 30 min, and the system was easy to operate, allowing on-site analysis with a low response time (Figure 5).
Figure 5. The on-site marine toxins diagnostic adapter developed by Fang et al. Adapted from [24] DOI: 10.1039/c2lc41152k with permission from The Royal Society of Chemistry. All rights reserved.
Driven by the Indian issue of endemic fluorosis, a chronic disease resulting from excess intake of fluoride, Levin et al. [23] presented a field deployable colorimeter for screening of groundwater for fluoride in endemic areas. The proposed method used a commercially available reagent and
Figure 5. The on-site marine toxins diagnostic adapter developed by Fang et al. Adapted from [24]DOI: 10.1039/c2lc41152k with permission from The Royal Society of Chemistry. All rights reserved.
Sensors 2017, 17, 1453 10 of 22
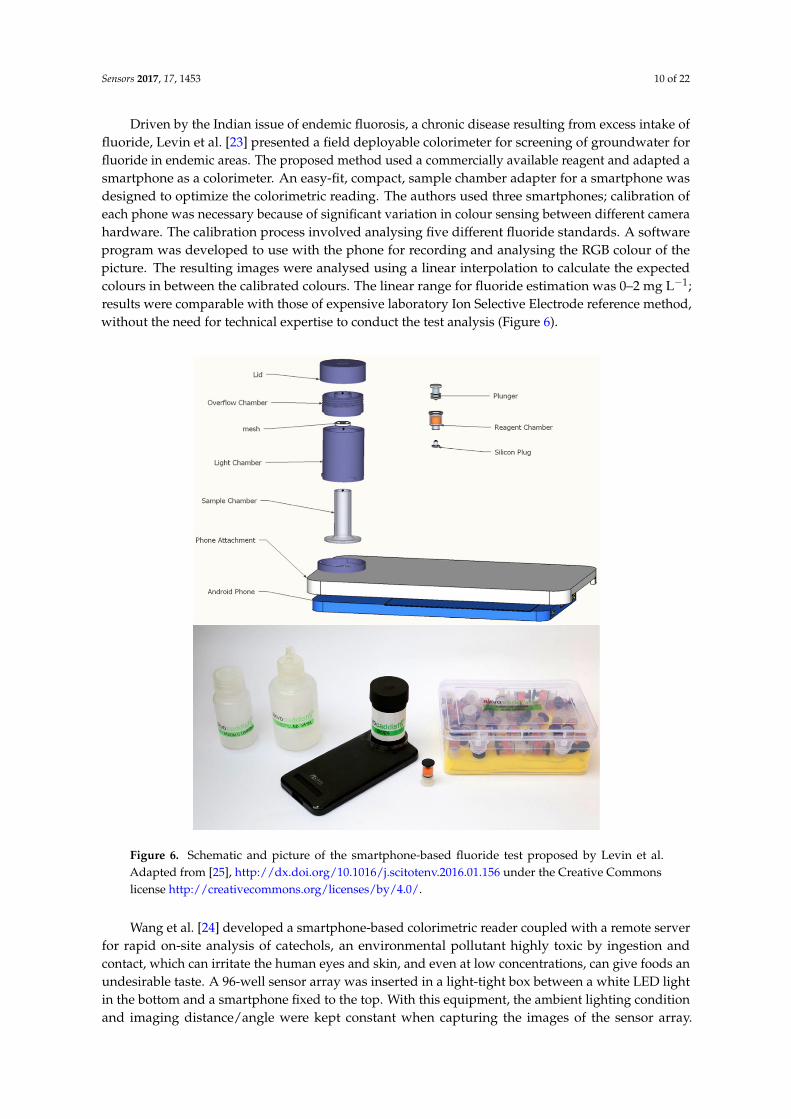
Driven by the Indian issue of endemic fluorosis, a chronic disease resulting from excess intake offluoride, Levin et al. [23] presented a field deployable colorimeter for screening of groundwater forfluoride in endemic areas. The proposed method used a commercially available reagent and adapted asmartphone as a colorimeter. An easy-fit, compact, sample chamber adapter for a smartphone wasdesigned to optimize the colorimetric reading. The authors used three smartphones; calibration ofeach phone was necessary because of significant variation in colour sensing between different camerahardware. The calibration process involved analysing five different fluoride standards. A softwareprogram was developed to use with the phone for recording and analysing the RGB colour of thepicture. The resulting images were analysed using a linear interpolation to calculate the expectedcolours in between the calibrated colours. The linear range for fluoride estimation was 0–2 mg L−1;results were comparable with those of expensive laboratory Ion Selective Electrode reference method,without the need for technical expertise to conduct the test analysis (Figure 6).
Sensors 2017, 17, 1453 10 of 22
adapted a smartphone as a colorimeter. An easy-fit, compact, sample chamber adapter for a smartphone was designed to optimize the colorimetric reading. The authors used three smartphones; calibration of each phone was necessary because of significant variation in colour sensing between different camera hardware. The calibration process involved analysing five different fluoride standards. A software program was developed to use with the phone for recording and analysing the RGB colour of the picture. The resulting images were analysed using a linear interpolation to calculate the expected colours in between the calibrated colours. The linear range for fluoride estimation was 0–2 mg L−1; results were comparable with those of expensive laboratory Ion Selective Electrode reference method, without the need for technical expertise to conduct the test analysis (Figure 6).
Figure 6. Schematic and picture of the smartphone-based fluoride test proposed by Levin et al. Adapted from [25], http://dx.doi.org/10.1016/j.scitotenv.2016.01.156 under the Creative Commons license http://creativecommons.org/licenses/by/4.0/.
Wang et al. [24] developed a smartphone-based colorimetric reader coupled with a remote server for rapid on-site analysis of catechols, an environmental pollutant highly toxic by ingestion and contact, which can irritate the human eyes and skin, and even at low concentrations, can give foods an undesirable taste. A 96-well sensor array was inserted in a light-tight box between a white LED light in the bottom and a smartphone fixed to the top. With this equipment, the ambient lighting condition and imaging distance/angle were kept constant when capturing the images of the sensor array. Thirteen different catechols at six serial concentrations were evaluated for system calibration using PCA, HCA and LDA for quality discrimination and PLS for quantitative determination. Data
Figure 6. Schematic and picture of the smartphone-based fluoride test proposed by Levin et al.Adapted from [25], http://dx.doi.org/10.1016/j.scitotenv.2016.01.156 under the Creative Commonslicense http://creativecommons.org/licenses/by/4.0/.
Wang et al. [24] developed a smartphone-based colorimetric reader coupled with a remote serverfor rapid on-site analysis of catechols, an environmental pollutant highly toxic by ingestion andcontact, which can irritate the human eyes and skin, and even at low concentrations, can give foods anundesirable taste. A 96-well sensor array was inserted in a light-tight box between a white LED lightin the bottom and a smartphone fixed to the top. With this equipment, the ambient lighting conditionand imaging distance/angle were kept constant when capturing the images of the sensor array.
Thirteen different catechols at six serial concentrations were evaluated for system calibration usingPCA, HCA and LDA for quality discrimination and PLS for quantitative determination. Data wereuploaded to a remote server to form analysis polynomials for LDA and PLS of an unknown sample.Real water sample analysis was performed, with very good estimation results achieved. The authorsclaim this work to be the first dealing with the on-site detection of analytes using a smartphone-basedcolorimetric reader coupled to a remote server. With the aim of separating the detection meansfrom the phone to resolve the difficulties in applying different models of mobile devices to thefield test, Seo et al. [25] realized a pocket-sized immunosensor system for the on-site detection offoodborne pathogenic bacteria. The immunoassay procedure was based on chemiluminometricsignal generation. The biosensor cartridge included a lens-free CMOS image sensor (CIS) physicallycontacting the signal generation part of the cartridge and Wi-Fi module installed in the circuit board.The system was controlled by a smartphone app programmed by the authors. The internet-of-things(IoT) technique was intended for use in food contamination monitoring and was demonstrated byanalyzing V. parahaemolyticus present on fish samples and uploading the data to a server via a wirelessnetwork. Prior to food testing, the target bacterium was pre-cultivated. The cultured medium thenwas analysed by employing the immunosensor system controlled by the mobile device, and the resultwas uploaded as information to an internet server. A LoD of 1.4 × 10⁴ CFU mL−1 was achieved.Such a technique combining a biosensor with IoT can be used to issue a warning immediately aftercomplete analysis about food contamination before purchase or consumption, so that the supply chaincan be promptly blocked. The authors claim the study to be the first exemplification of pathogenmonitoring via IoT. Finally, DuVall et al. [26] presented a rapid detection of foodborne pathogens using acell phone and custom-written app, in which the physical identification was made by pathogen DNAtransduction, mediated by magnetic bead aggregation with pathogenic DNA fragments. The smartphonewas used to acquire picture of the assay reaction and analyse the image to perform a qualitative Yes orNo detection of pathogen presence. The proposed detection modality was fully portable for point-of-caredetection of food-borne pathogens Escherichia coli O157:H7 and Salmonella enterica.
Electroanalytical methods use electrodes to make electrical contact with the analyte solution, inconjunction with electric or electronic devices to which they are attached, to measure an electricalparameter of the solution. The measured parameter is related to the quantity of an analytein solution. According to the electric parameters that are measured, electroanalytical methodsinclude potentiometry, amperometry, conductometry, electrogravimetry, voltammetry and coulometry.The names of the methods reflect the measured electric property or its units. Electroanalytical methodsare particularly interesting for the development of smartphone-based platforms for on-site fooddiagnostics, as they combine high-performance detection with great simplicity, low-cost, portability,autonomy, cable-free operation, and capacity to conduct in real-time the entire analytical measurementat remote places.
Dou et al. [27] described a biosensing system for the detection of clenbuterol (CLB), usinga mobile electrochemical device with an electric field-driven acceleration strategy. CLB has beenillegally used in livestock raising to improve growth rate, reduce fat deposition and increase proteinaccretion. However it has been banned as a feed additive in food-producing animals in most countriesbecause it can easily remain in animal tissues and result in clinical symptom in human such astemporary dizziness and palpitations. The electric field-driven method was selected to accelerate theimmunoreaction at the solid-liquid interface of electrodes, speeding up the transport of low-abundantdrug molecules. A smartphone tool biochip was developed to conduct the electrochemical detectionand send data to the phone via USB port. The smartphone-based immunosensor was able to detecta minimum of 0.076 ng mL−1 CLB in 6 min. The advantage of this method is that, by combiningdifferent functionalized electrodes, this device can meet the requirements for field detection of all foodsecurity-related species. In another study, Giordano et al. [28] coupled a homemade potentiostat to a
Sensors 2017, 17, 1453 12 of 22
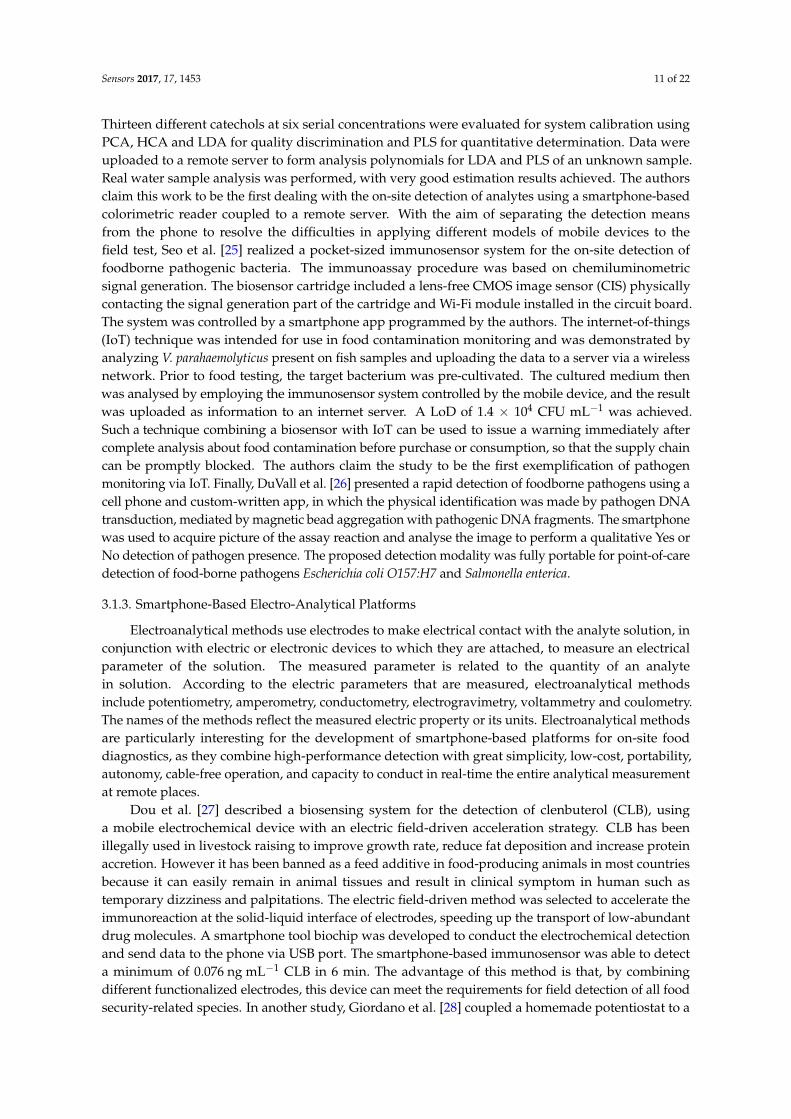
mobile phone for point-of-use assays successfully applied for pattern recognition of Brazilian honeysamples according to their botanical and geographic origins. The method relied on the unsupervisedtechnique of principal component analysis (PCA), and the assays were performed by cyclic voltammetryusing a working electrode of gold. The proposed biosensor platform was provided with both USBconnection and Bluetooth module integrated in the potentiostat hardware. An in-house app wasdeveloped to ensure the on-site processing of multivariate data using PCA. The system was also createdwith the possibility to share data through the cloud (e-mail, Google drive, or even social media) forbackup or remote processing of the electroanalytical results with more advanced chemometric tools.The authors claim that this is the first reported work concerning the development of a totally integratedpoint-of-use system with chemometric data processing on a smartphone (Figure 7).
Sensors 2017, 17, 1453 12 of 22
were performed by cyclic voltammetry using a working electrode of gold. The proposed biosensor platform was provided with both USB connection and Bluetooth module integrated in the potentiostat hardware. An in-house app was developed to ensure the on-site processing of multivariate data using PCA. The system was also created with the possibility to share data through the cloud (e-mail, Google drive, or even social media) for backup or remote processing of the electroanalytical results with more advanced chemometric tools. The authors claim that this is the first reported work concerning the development of a totally integrated point-of-use system with chemometric data processing on a smartphone (Figure 7).
Figure 7. Portable platform deployed for point-of-use analyses. Electrochemical system. (a) Sample; (b) hand-held potentiostat; (c) and smartphone; (d) Reprinted from [29] with permission from Elsevier. http://www.sciencedirect.com/science/article/pii/S0013468616320400.
3.2. Smartphone Spectroscopy
The works reviewed in this section belong to the optical diagnostics macro-category. Unlike the approach based on biosensors, in which it is necessary a reagent to trigger the transduction, in this case the analysis is performed in a non-invasive manner. In particular, spectroscopy has been a powerful tool in research and industrial applications. It is extensively and successfully used in applications including diagnostics, assessment of food quality, environmental sensing, and drug analysis testing. This technique is intrinsically rapid and non-destructive. However, most spectrometer setups used in industrial or laboratory-based applications are expensive and bulky, limiting them to controlled laboratory settings. Recently, due to advancements in electronics and fabrication methods, more portable spectrometers have been realized. Technological progress has allowed the release of micro-spectrometers which take advantage of new micro-technologies such as microelectromechanical systems (MEMS), micro-opto-electromechanical systems (MOEMS), micro-mirror arrays, etc. These improvements reduce cost and size while allowing good performance and high-volume manufacturability. Compared to lab-based instruments, miniaturized systems must become a black-box, providing expected results with high reliability and without intervention of technicians specialized in spectroscopy measurements. The ultimate goal, in the future, is the integration of a spectrometer into a smartphone, taking advantage of the highly efficient processing abilities in the compact configuration, to offer spectroscopic information on the fly. Moreover, they will use the large community of users to build databanks based on machine learning through apps [30]. A detailed overview of the revised Smartphone Spectroscopy works is provided with Table 2.
Liang et al. [29] proposed a detection method for microbial spoilage of beef by means of a smartphone-based optical diagnostic system. An 880 nm near infrared (NIR) LED was irradiated perpendicular to the surface of ground beef, while the digital camera of a smartphone detected the scatter signal angled at 15°, 30°, 40°, and 60° from the incident light. Experiments were performed with and without positioning stagwhere in the latter case, a software application and the built-in gyro
Figure 7. Portable platform deployed for point-of-use analyses. Electrochemical system. (a) Sample;(b) hand-held potentiostat; (c) and smartphone; (d) Reprinted from [29] with permission from Elsevier.http://www.sciencedirect.com/science/article/pii/S0013468616320400.
3.2. Smartphone Spectroscopy
The works reviewed in this section belong to the optical diagnostics macro-category. Unlikethe approach based on biosensors, in which it is necessary a reagent to trigger the transduction,in this case the analysis is performed in a non-invasive manner. In particular, spectroscopy hasbeen a powerful tool in research and industrial applications. It is extensively and successfullyused in applications including diagnostics, assessment of food quality, environmental sensing,and drug analysis testing. This technique is intrinsically rapid and non-destructive. However,most spectrometer setups used in industrial or laboratory-based applications are expensive andbulky, limiting them to controlled laboratory settings. Recently, due to advancements in electronicsand fabrication methods, more portable spectrometers have been realized. Technological progresshas allowed the release of micro-spectrometers which take advantage of new micro-technologiessuch as microelectromechanical systems (MEMS), micro-opto-electromechanical systems (MOEMS),micro-mirror arrays, etc. These improvements reduce cost and size while allowing good performanceand high-volume manufacturability. Compared to lab-based instruments, miniaturized systemsmust become a black-box, providing expected results with high reliability and without interventionof technicians specialized in spectroscopy measurements. The ultimate goal, in the future, is theintegration of a spectrometer into a smartphone, taking advantage of the highly efficient processingabilities in the compact configuration, to offer spectroscopic information on the fly. Moreover, they willuse the large community of users to build databanks based on machine learning through apps [30].A detailed overview of the revised Smartphone Spectroscopy works is provided with Table 2.
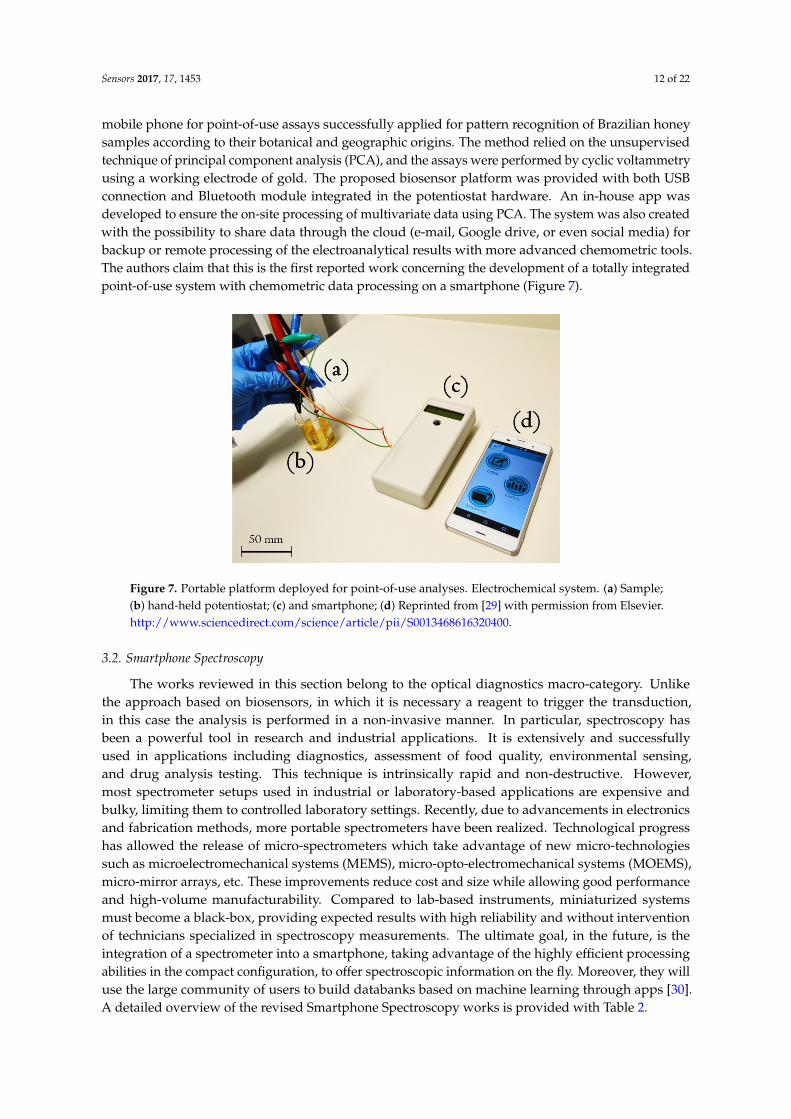
Liang et al. [29] proposed a detection method for microbial spoilage of beef by means ofa smartphone-based optical diagnostic system. An 880 nm near infrared (NIR) LED was irradiatedperpendicular to the surface of ground beef, while the digital camera of a smartphone detected thescatter signal angled at 15◦, 30◦, 40◦, and 60◦ from the incident light. Experiments were performedwith and without positioning stagwhere in the latter case, a software application and the built-in gyrosensor of the smartphone were used to control the incidence angle between the iPhone camera and theNIR LED light source. Concentrations of E. coli (from 101 CFU/mL to 108 CFU/mL) were determinedby the “pattern” of such scatter intensities over the angles. The proposed device was presented as apreliminary screening tool to monitor microbial contamination of meat products. Mignani et al. [31]presented the proof-of-concept of SpiderSpec, a compact colorimeter composed of a 3D printedcylindrical housing containing a LED array for illumination and a compact spectrometer for detection,with food control proposed as a possible application. The 12 visible LEDs were arranged in a circulararray in the optical head, with 45◦ orientation with respect to the central detection axis, which is one ofthe standard configuration for reflectance measurements. The chosen spectrometer had an operativerange of 350–800 nm. A custom Labview software interface was used for managing the LEDs andspectrometer. However, the authors, in a view of configuring the spectroscopic colorimeter as an IoTdevice, depicted future development of functionalities which could be selected using a smartphone ora tablet (Figure 8).
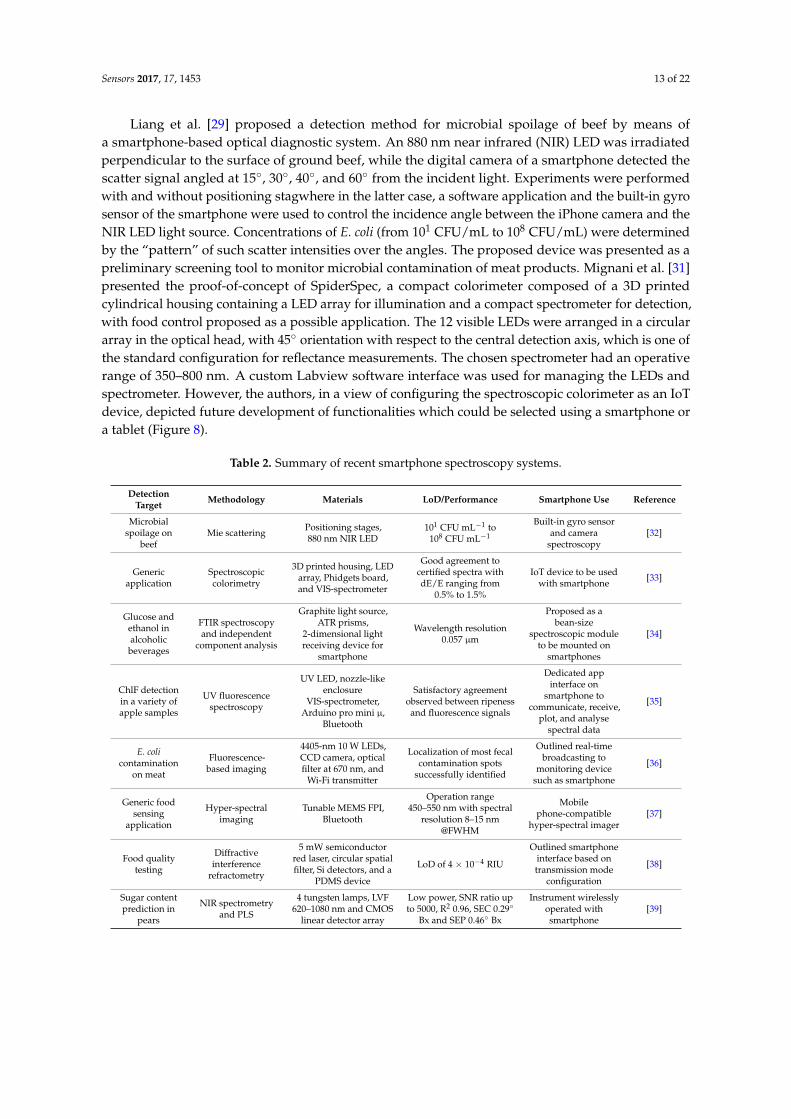
Table 2. Summary of recent smartphone spectroscopy systems.
DetectionTarget Methodology Materials LoD/Performance Smartphone Use Reference
Microbialspoilage on
beefMie scattering Positioning stages,
880 nm NIR LED101 CFU mL−1 to
108 CFU mL−1
Built-in gyro sensorand camera
spectroscopy[32]
Genericapplication
Spectroscopiccolorimetry
3D printed housing, LEDarray, Phidgets board,and VIS-spectrometer
Good agreement tocertified spectra withdE/E ranging from
0.5% to 1.5%
IoT device to be usedwith smartphone [33]
Glucose andethanol inalcoholicbeverages
FTIR spectroscopyand independent
component analysis
Graphite light source,ATR prisms,
2-dimensional lightreceiving device for
smartphone
Wavelength resolution0.057 µm
Proposed as abean-size
spectroscopic moduleto be mounted on
smartphones
[34]
ChlF detectionin a variety ofapple samples
UV fluorescencespectroscopy
UV LED, nozzle-likeenclosure
VIS-spectrometer,Arduino pro mini µ,
Bluetooth
Satisfactory agreementobserved between ripenessand fluorescence signals
Dedicated appinterface on
smartphone tocommunicate, receive,
plot, and analysespectral data
[35]
E. colicontamination
on meat
Fluorescence-based imaging
4405-nm 10 W LEDs,CCD camera, opticalfilter at 670 nm, and
Wi-Fi transmitter
Localization of most fecalcontamination spots
successfully identified
Outlined real-timebroadcasting to
monitoring devicesuch as smartphone
[36]
Generic foodsensing
application
Hyper-spectralimaging
Tunable MEMS FPI,Bluetooth
Operation range450–550 nm with spectral
resolution 8–15 nm@FWHM
Mobilephone-compatible
hyper-spectral imager[37]
Food qualitytesting
Diffractiveinterference
refractometry
5 mW semiconductorred laser, circular spatialfilter, Si detectors, and a
PDMS device
LoD of 4 × 10⁻⁴ RIU
Outlined smartphoneinterface based ontransmission mode
configuration
[38]
Sugar contentprediction in
pears
NIR spectrometryand PLS
4 tungsten lamps, LVF620–1080 nm and CMOS
linear detector array
Low power, SNR ratio upto 5000, R2 0.96, SEC 0.29◦
Bx and SEP 0.46◦ Bx
Instrument wirelesslyoperated withsmartphone
[39]
Sensors 2017, 17, 1453 14 of 22
Sensors 2017, 17, 1453 14 of 22
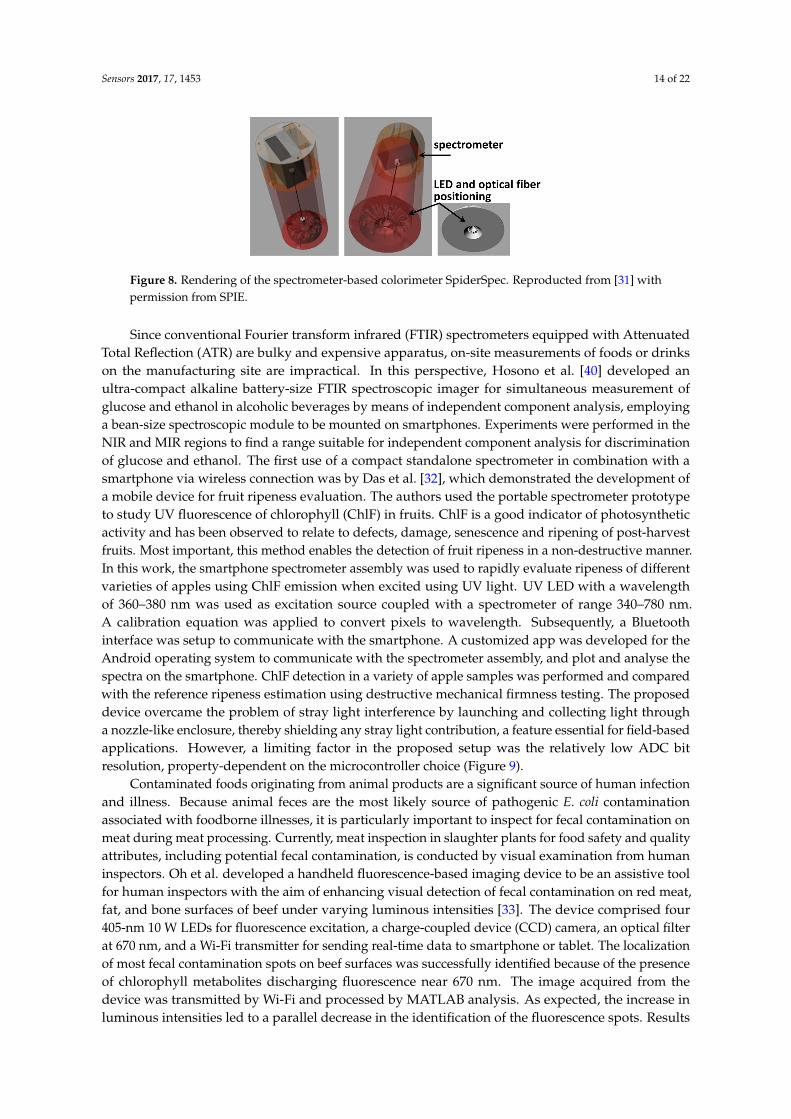
Figure 8. Rendering of the spectrometer-based colorimeter SpiderSpec. Reproducted from [31] with permission from SPIE.
Since conventional Fourier transform infrared (FTIR) spectrometers equipped with Attenuated Total Reflection (ATR) are bulky and expensive apparatus, on-site measurements of foods or drinks on the manufacturing site are impractical. In this perspective, Hosono et al. [40] developed an ultra-compact alkaline battery-size FTIR spectroscopic imager for simultaneous measurement of glucose and ethanol in alcoholic beverages by means of independent component analysis, employing a bean-size spectroscopic module to be mounted on smartphones. Experiments were performed in the NIR and MIR regions to find a range suitable for independent component analysis for discrimination of glucose and ethanol. The first use of a compact standalone spectrometer in combination with a smartphone via wireless connection was by Das et al. [32], which demonstrated the development of a mobile device for fruit ripeness evaluation. The authors used the portable spectrometer prototype to study UV fluorescence of chlorophyll (ChlF) in fruits. ChlF is a good indicator of photosynthetic activity and has been observed to relate to defects, damage, senescence and ripening of post-harvest fruits. Most important, this method enables the detection of fruit ripeness in a non-destructive manner. In this work, the smartphone spectrometer assembly was used to rapidly evaluate ripeness of different varieties of apples using ChlF emission when excited using UV light. UV LED with a wavelength of 360–380 nm was used as excitation source coupled with a spectrometer of range 340–780 nm. A calibration equation was applied to convert pixels to wavelength. Subsequently, a Bluetooth interface was setup to communicate with the smartphone. A customized app was developed for the Android operating system to communicate with the spectrometer assembly, and plot and analyse the spectra on the smartphone. ChlF detection in a variety of apple samples was performed and compared with the reference ripeness estimation using destructive mechanical firmness testing. The proposed device overcame the problem of stray light interference by launching and collecting light through a nozzle-like enclosure, thereby shielding any stray light contribution, a feature essential for field-based applications. However, a limiting factor in the proposed setup was the relatively low ADC bit resolution, property-dependent on the microcontroller choice (Figure 9).
Figure 8. Rendering of the spectrometer-based colorimeter SpiderSpec. Reproducted from [31] withpermission from SPIE.
Since conventional Fourier transform infrared (FTIR) spectrometers equipped with AttenuatedTotal Reflection (ATR) are bulky and expensive apparatus, on-site measurements of foods or drinkson the manufacturing site are impractical. In this perspective, Hosono et al. [40] developed anultra-compact alkaline battery-size FTIR spectroscopic imager for simultaneous measurement ofglucose and ethanol in alcoholic beverages by means of independent component analysis, employinga bean-size spectroscopic module to be mounted on smartphones. Experiments were performed in theNIR and MIR regions to find a range suitable for independent component analysis for discriminationof glucose and ethanol. The first use of a compact standalone spectrometer in combination with asmartphone via wireless connection was by Das et al. [32], which demonstrated the development ofa mobile device for fruit ripeness evaluation. The authors used the portable spectrometer prototypeto study UV fluorescence of chlorophyll (ChlF) in fruits. ChlF is a good indicator of photosyntheticactivity and has been observed to relate to defects, damage, senescence and ripening of post-harvestfruits. Most important, this method enables the detection of fruit ripeness in a non-destructive manner.In this work, the smartphone spectrometer assembly was used to rapidly evaluate ripeness of differentvarieties of apples using ChlF emission when excited using UV light. UV LED with a wavelengthof 360–380 nm was used as excitation source coupled with a spectrometer of range 340–780 nm.A calibration equation was applied to convert pixels to wavelength. Subsequently, a Bluetoothinterface was setup to communicate with the smartphone. A customized app was developed for theAndroid operating system to communicate with the spectrometer assembly, and plot and analyse thespectra on the smartphone. ChlF detection in a variety of apple samples was performed and comparedwith the reference ripeness estimation using destructive mechanical firmness testing. The proposeddevice overcame the problem of stray light interference by launching and collecting light througha nozzle-like enclosure, thereby shielding any stray light contribution, a feature essential for field-basedapplications. However, a limiting factor in the proposed setup was the relatively low ADC bitresolution, property-dependent on the microcontroller choice (Figure 9).
Contaminated foods originating from animal products are a significant source of human infectionand illness. Because animal feces are the most likely source of pathogenic E. coli contaminationassociated with foodborne illnesses, it is particularly important to inspect for fecal contamination onmeat during meat processing. Currently, meat inspection in slaughter plants for food safety and qualityattributes, including potential fecal contamination, is conducted by visual examination from humaninspectors. Oh et al. developed a handheld fluorescence-based imaging device to be an assistive toolfor human inspectors with the aim of enhancing visual detection of fecal contamination on red meat,fat, and bone surfaces of beef under varying luminous intensities [33]. The device comprised four405-nm 10 W LEDs for fluorescence excitation, a charge-coupled device (CCD) camera, an optical filterat 670 nm, and a Wi-Fi transmitter for sending real-time data to smartphone or tablet. The localizationof most fecal contamination spots on beef surfaces was successfully identified because of the presenceof chlorophyll metabolites discharging fluorescence near 670 nm. The image acquired from thedevice was transmitted by Wi-Fi and processed by MATLAB analysis. As expected, the increase inluminous intensities led to a parallel decrease in the identification of the fluorescence spots. Results
Sensors 2017, 17, 1453 15 of 22
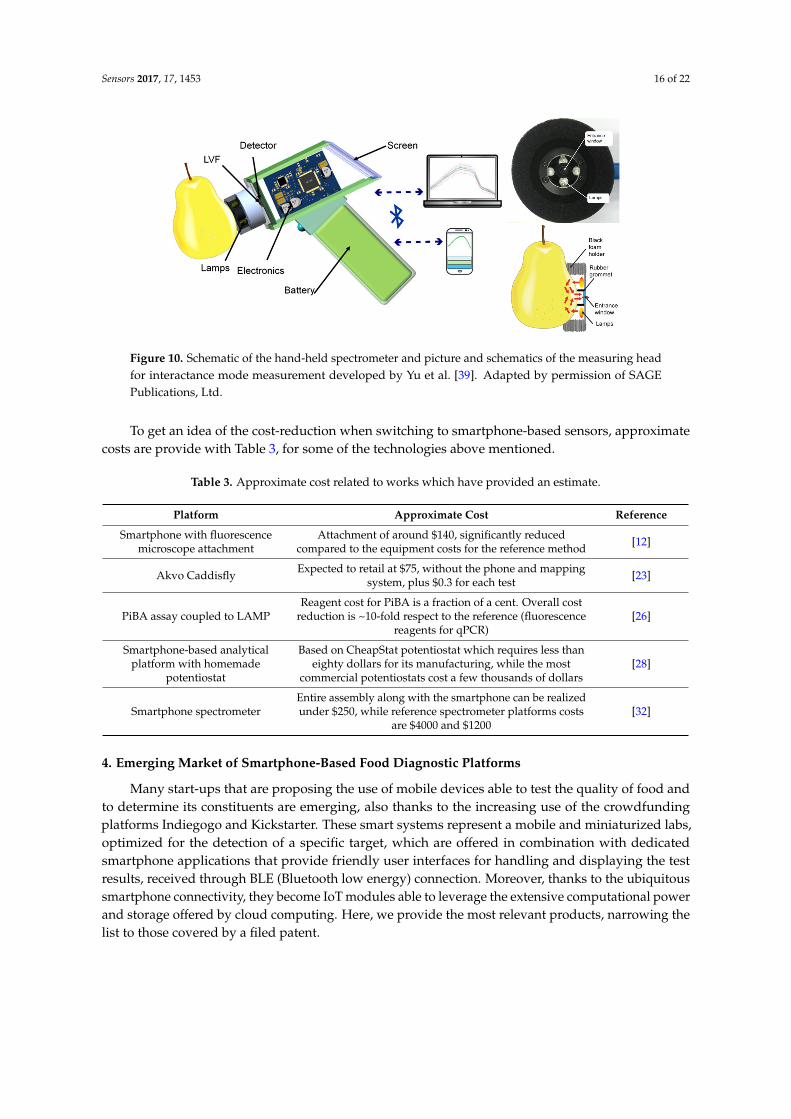
indicated the proposed system as an effective way to aid visual inspection for fecal contaminationdetection. Rissanen et al. demonstrated a mobile phone-compatible hyper-spectral imager based ona tunable MEMS Fabry-Perot interferometer for authentication, counterfeit detection, and potentialhealth/wellness and food sensing applications [34]. The authors described the development of aMEMS Fabry-Perot interferometer (FPI) tunable optical filters integrated with an iPhone 5s camerato perform hyper-spectral imaging in the vis-NIR range 450–550 nm. The communication betweenthe MEMS FPI module and iPhone 5 was arranged using Bluetooth. A configuration of two cascadedFPIs (λ = 500 nm and λ = 650 nm) combined with an RGB colour camera showed potential to expandthe wavelength tuning range to 400–700 nm. Sasikumar et al. [35] developed a handheld opticalanalyser consisting of a collimated 5 mW semiconductor red laser (635 nm) as the source, a circularspatial filter, Si detectors, and a Polydimethylsiloxane (PDMS) device. Fabrication of the PDMS devicewith integrated sample well was adapted for refractometric, and hence concentration, measurements.Potential integration of this device with smartphones was outlined, and featured a simple interfacebased on transmission mode configuration to explore several applications in food quality testing.Yu et al. realized a handheld NIR spectrometer specifically designed to assess the internal quality offruit. In particular, a key development aspect was the Linear Variable Filter module as a light-dispersioncomponent [36]. The proposed spectrometer system was a gun-shaped device, operating in the vis-NIRrange (620–1080 nm) in interactance mode. The light source consisted of four tungsten lamps placedsymmetrically around the entrance window. A 6-mm-diameter rubber grommet surrounded theentrance window and acted as a light seal, thus preventing surface-scattered light from reaching thewindow directly. A soft black foam ring around the detector head was provided to support the fruitduring analysis and shield it from external light. The platform was tested for determining the sugarcontent in Crown Pear. Light from the source entered the fruit and penetrated part of the tissue, andthat which emerged from the fruit entered the window. Results were compared with the referencemethod of Brix measurements, recorded with a handheld refractometer. Models were developedusing PLS regression with the full band of the absorbance spectra and were optimised by applyingMSC, SNV, and first derivative. The instrument was able to analyse spectral data using an on-boardprediction model and to operate wirelessly with a smartphone, tablet or laptop computer. It provedhighly suitable for predicting fruit internal quality. However, modified software is needed, and furtherstudies are required to test the performance of the spectrometer for predicting other attributes ordetecting sugar in other fruits (Figure 10).
Sensors 2017, 17, 1453 15 of 22
Figure 9. Schematic of the different components of the smartphone spectrometer prototype. Adapted from [35]. Published online 8 September 2016. doi:10.1038/srep32504, under the Creative Commons license http://creativecommons.org/licenses/by/4.0/.
Contaminated foods originating from animal products are a significant source of human infection and illness. Because animal feces are the most likely source of pathogenic E. coli contamination associated with foodborne illnesses, it is particularly important to inspect for fecal contamination on meat during meat processing. Currently, meat inspection in slaughter plants for food safety and quality attributes, including potential fecal contamination, is conducted by visual examination from human inspectors. Oh et al. developed a handheld fluorescence-based imaging device to be an assistive tool for human inspectors with the aim of enhancing visual detection of fecal contamination on red meat, fat, and bone surfaces of beef under varying luminous intensities [33]. The device comprised four 405-nm 10 W LEDs for fluorescence excitation, a charge-coupled device (CCD) camera, an optical filter at 670 nm, and a Wi-Fi transmitter for sending real-time data to smartphone or tablet. The localization of most fecal contamination spots on beef surfaces was successfully identified because of the presence of chlorophyll metabolites discharging fluorescence near 670 nm. The image acquired from the device was transmitted by Wi-Fi and processed by MATLAB analysis. As expected, the increase in luminous intensities led to a parallel decrease in the identification of the fluorescence spots. Results indicated the proposed system as an effective way to aid visual inspection for fecal contamination detection. Rissanen et al. demonstrated a mobile phone-compatible hyper-spectral imager based on a tunable MEMS Fabry-Perot interferometer for authentication, counterfeit detection, and potential health/wellness and food sensing applications [34]. The authors described the development of a MEMS Fabry-Perot interferometer (FPI) tunable optical filters integrated with an iPhone 5s camera to perform hyper-spectral imaging in the vis-NIR range 450–550 nm. The communication between the MEMS FPI module and iPhone 5 was arranged using Bluetooth. A configuration of two cascaded FPIs (λ = 500 nm and λ = 650 nm) combined with an RGB colour camera showed potential to expand the wavelength tuning range to 400–700 nm. Sasikumar et al. [35] developed a handheld optical analyser consisting of a collimated 5 mW semiconductor red laser (635 nm) as the source, a circular spatial filter, Si detectors, and a Polydimethylsiloxane (PDMS) device. Fabrication of the PDMS device with integrated sample well was adapted for refractometric, and hence concentration, measurements. Potential integration of this device with smartphones was outlined, and featured a simple interface based on transmission mode configuration to explore several applications in food quality testing. Yu et al. realized a handheld NIR spectrometer specifically designed to assess the internal quality of fruit. In particular, a key
Figure 9. Schematic of the different components of the smartphone spectrometer prototype. Adaptedfrom [35]. Published online 8 September 2016. doi:10.1038/srep32504, under the Creative Commonslicense http://creativecommons.org/licenses/by/4.0/.
development aspect was the Linear Variable Filter module as a light-dispersion component [36]. The proposed spectrometer system was a gun-shaped device, operating in the vis-NIR range (620–1080 nm) in interactance mode. The light source consisted of four tungsten lamps placed symmetrically around the entrance window. A 6-mm-diameter rubber grommet surrounded the entrance window and acted as a light seal, thus preventing surface-scattered light from reaching the window directly. A soft black foam ring around the detector head was provided to support the fruit during analysis and shield it from external light. The platform was tested for determining the sugar content in Crown Pear. Light from the source entered the fruit and penetrated part of the tissue, and that which emerged from the fruit entered the window. Results were compared with the reference method of Brix measurements, recorded with a handheld refractometer. Models were developed using PLS regression with the full band of the absorbance spectra and were optimised by applying MSC, SNV, and first derivative. The instrument was able to analyse spectral data using an on-board prediction model and to operate wirelessly with a smartphone, tablet or laptop computer. It proved highly suitable for predicting fruit internal quality. However, modified software is needed, and further studies are required to test the performance of the spectrometer for predicting other attributes or detecting sugar in other fruits (Figure 10).
Figure 10. Schematic of the hand-held spectrometer and picture and schematics of the measuring head for interactance mode measurement developed by Yu et al. [39]. Adapted by permission of SAGE Publications, Ltd.
To get an idea of the cost-reduction when switching to smartphone-based sensors, approximate costs are provide with Table 3, for some of the technologies above mentioned.
Table 3. Approximate cost related to works which have provided an estimate.
Platform Approximate Cost Ref.Smartphone with fluorescence
microscope attachment Attachment of around $140, significantly reduced compared to the
equipment costs for the reference method [12]
Akvo Caddisfly Expected to retail at $75, without the phone and mapping system,
plus $0.3 for each test [23]
PiBA assay coupled to LAMP Reagent cost for PiBA is a fraction of a cent. Overall cost reduction is ~10-fold respect to the reference (fluorescence reagents for qPCR)
[26]
Smartphone-based analytical platform with homemade
potentiostat
Based on CheapStat potentiostat which requires less than eighty dollars for its manufacturing, while the most commercial
potentiostats cost a few thousands of dollars [28]
Smartphone spectrometer Entire assembly along with the smartphone can be realized under $250, while reference spectrometer platforms costs are $4000 and
$1200 [32]
4. Emerging Market of Smartphone-Based Food Diagnostic Platforms
Many start-ups that are proposing the use of mobile devices able to test the quality of food and to determine its constituents are emerging, also thanks to the increasing use of the crowdfunding
Figure 10. Schematic of the hand-held spectrometer and picture and schematics of the measuring headfor interactance mode measurement developed by Yu et al. [39]. Adapted by permission of SAGEPublications, Ltd.
To get an idea of the cost-reduction when switching to smartphone-based sensors, approximatecosts are provide with Table 3, for some of the technologies above mentioned.
Table 3. Approximate cost related to works which have provided an estimate.
Platform Approximate Cost Reference
Smartphone with fluorescencemicroscope attachment
Attachment of around $140, significantly reducedcompared to the equipment costs for the reference method [12]
Akvo Caddisfly Expected to retail at $75, without the phone and mappingsystem, plus $0.3 for each test [23]
PiBA assay coupled to LAMPReagent cost for PiBA is a fraction of a cent. Overall cost
reduction is ~10-fold respect to the reference (fluorescencereagents for qPCR)
[26]
Smartphone-based analyticalplatform with homemade
potentiostat
Based on CheapStat potentiostat which requires less thaneighty dollars for its manufacturing, while the most
commercial potentiostats cost a few thousands of dollars[28]
Smartphone spectrometerEntire assembly along with the smartphone can be realizedunder $250, while reference spectrometer platforms costs
are $4000 and $1200[32]
4. Emerging Market of Smartphone-Based Food Diagnostic Platforms
Many start-ups that are proposing the use of mobile devices able to test the quality of food andto determine its constituents are emerging, also thanks to the increasing use of the crowdfundingplatforms Indiegogo and Kickstarter. These smart systems represent a mobile and miniaturized labs,optimized for the detection of a specific target, which are offered in combination with dedicatedsmartphone applications that provide friendly user interfaces for handling and displaying the testresults, received through BLE (Bluetooth low energy) connection. Moreover, thanks to the ubiquitoussmartphone connectivity, they become IoT modules able to leverage the extensive computational powerand storage offered by cloud computing. Here, we provide the most relevant products, narrowing thelist to those covered by a filed patent.
Sensors 2017, 17, 1453 17 of 22
Cellmic LLC (formerly Holomic LLC), founded by Professor Aydogan Ozcan, offers a suite ofrapid diagnostic test readers for advanced mobile diagnostics [37]. Among these is the allergen testingplatform already described in this paper [16] and covered by a patent [38]. This device was developedby UCLA researchers for the detection of allergens, based on ELISA kit and a test tubes-containingmodule attachment to the smartphone camera. MyDx Inc. is a science and technology company thathas created MyDx, a handheld electronic analyser that leverages electronic nose nanotechnology toaccurately measure chemicals of interest in food and water, to detect traces of pesticides or metals, andsend results to smartphone handled by the MyDx app [39]. The company owns many related patentsincluding [41].
Scientists and researchers of Kaunas University of Technology, in cooperation with the companyARS Lab, have developed the patented [42] smart electronic nose FOODsniffer (formerly PERES).It is based on gas sensors and is intended to signal the deterioration of meat and fish by detectinggases that reflect such deterioration. It was selling on the company website for $129.99 at the timeof writing [43]. Nimasensor [44], was developed by Nima Labs Inc. and enables the detection of thepresence of gluten in food. It is based on the immunosensor technique, in which a specific antibodybinds gluten, sparking the transduction process. Therefore, it is necessary to sample the food insidea disposable cartridge that is then inserted into the main body of the device. Results are providedthrough a dedicated app. The Nima device embeds an OLED display indicating a smile for glutenunder 20 ppm. The Nima Starter Kit cost at the time of writing was $279.00 [45].
Many new companies are offering sensors based on the emergent and promising technique of NIRspectroscopy. Spectral Engine Oy presented a plethora of high-tech products based on a tunable opticalfilter as a peculiar component, originated from years of research done at VTT Technical ResearchCentre of Finland, which resulted in many filed patents, including [46]. The Wireless NIR sensordevice platform, which is designed for portable applications development, can be operated with acomputer, a tablet, and a smartphone. The Food Scanner solution concept uses the wireless NIRsensor in conjunction with advanced algorithms, cloud-connectivity, and a vast material library toreveal the fat, protein, sugar, and total energy content of food items with a good level of accuracy [47].TellSpec Inc. proposed a pocket-sized NIR spectrometer, a cloud-based patented [48] analysis engine,and a mobile app that work together to scan foods; identify calories, macronutrients, allergens, andcontaminants; and provide relevant information such as food fraud, food adulteration, and food quality.The spectrometer is based on the Texas Instruments DLP® NIRscan™ technology. At the time of writing,two solutions are currently delivered on the company website, the Enterprise Scanner at $1300.00 andthe Software Development Kit at $2000.00 [49]. Finally, with several filed patents including the [50],the Israeli company Consumer Physics (formerly Verifood Ltd.), has the in-house-developed product,SCIO, a pocket-sized NIR spectrometer for molecular analysis, including food. It is delivered inthe solutions of Consumer Edition at $299.00 and SDK at $499.00 at the time of writing. Moreover,in partnership with Changhong and Analog Devices, the company has just announced the world’sfirst Molecular Sensing Smartphone, a smartphone integrating the Scio spectrometer module [51].The presented commercial devices are depicted in order of the description above in Figure 11.
Sensors 2017, 17, 1453 18 of 22
Sensors 2017, 17, 1453 18 of 22
Figure 11. Commercial products for mobile food diagnostics.
5. Discussion
The proposed sensing strategies, which used a phone as the read-out tool (e.g., colorimetric and fluorescence imaging), are optimized for the phone models used for carried out the analysis. In order to meet the property of repeatability between different platforms, calibration of each phone is necessary because there is significant variation in color profile between different phones, due to hardware differences. Indeed, cameras may have different spectral responsivities, lamps may have different spectral emittances, and digitizer elements may be different. Moreover, the above mentioned properties may change over time. Another point to be addressed when dealing with pictures and colors is the image format. As smartphone cameras have become more and more powerful, it is now possible to shot in lossless RAW format, instead of lossy JPEG. In scientific imaging, there are several reasons to choose the first one. When shooting in JPEG image information is compressed and lost. The camera does its own processing to convert into a JPEG. The white balance and colour space are applied to the image by default. Drawback of this built-in processing is that it is clearly camera-dependent. With RAW, within the image all data from sensor are recorded, so it is always possible to perform post-processing, like adjusting white balance and selecting the proper colour space where to export out the picture.
Sample preparation is still a bottleneck for the field of food mobile diagnostics, which aim is to bypass the use of expensive and bulky instrumentation-based tests, operated by trained personnel. Sampling performed by non-expert user may lead to unwanted contamination, resulting in defiled measurements. For example, in colorimetric assay, if unwanted solutes in the sample buffers positively or negatively affect light absorbance, it results respectively in false positives or negatives. This intrinsic drawback affects mostly detection strategies in which sampling is a necessary preliminary step. The commercial systems presented have tried to overcome this problem through a user-friendly design, inserting guidelines to assist customer during sampling and calibration procedure.
Figure 11. Commercial products for mobile food diagnostics.
5. Discussion
The proposed sensing strategies, which used a phone as the read-out tool (e.g., colorimetricand fluorescence imaging), are optimized for the phone models used for carried out the analysis.In order to meet the property of repeatability between different platforms, calibration of each phoneis necessary because there is significant variation in color profile between different phones, due tohardware differences. Indeed, cameras may have different spectral responsivities, lamps may havedifferent spectral emittances, and digitizer elements may be different. Moreover, the above mentionedproperties may change over time. Another point to be addressed when dealing with pictures andcolors is the image format. As smartphone cameras have become more and more powerful, it isnow possible to shot in lossless RAW format, instead of lossy JPEG. In scientific imaging, there areseveral reasons to choose the first one. When shooting in JPEG image information is compressedand lost. The camera does its own processing to convert into a JPEG. The white balance and colourspace are applied to the image by default. Drawback of this built-in processing is that it is clearlycamera-dependent. With RAW, within the image all data from sensor are recorded, so it is alwayspossible to perform post-processing, like adjusting white balance and selecting the proper colour spacewhere to export out the picture.
Sample preparation is still a bottleneck for the field of food mobile diagnostics, which aim is tobypass the use of expensive and bulky instrumentation-based tests, operated by trained personnel.Sampling performed by non-expert user may lead to unwanted contamination, resulting in defiledmeasurements. For example, in colorimetric assay, if unwanted solutes in the sample buffers positivelyor negatively affect light absorbance, it results respectively in false positives or negatives. This intrinsicdrawback affects mostly detection strategies in which sampling is a necessary preliminary step.
Sensors 2017, 17, 1453 19 of 22
The commercial systems presented have tried to overcome this problem through a user-friendly design,inserting guidelines to assist customer during sampling and calibration procedure.
The methodologies discussed indirectly identify the concentration of a target substance, sofor all of them it is necessary to make a calibration with a reference standard, using the puresubstance at different concentrations, in order to build the instrument calibration curve for thatspecifically target. All conditions under which standards and unknowns are prepared shouldbe kept identical. For fluorescence, dye- and glass-based reference materials are used to correctfluorescence emission for relative intensity, comparing an unknown measured intensity value withthe certified values. In colorimetric assay, to correctly identify unknown samples, first the softwaremodule should be calibrated with a set of images obtained from reference concentrations. Each imagewill be associated with a concentration level. In case of electro-analytical techniques, the measuredelectrical quantity is proportional to the concentration of some component of the analyte. Calibration isdone using standard buffer solutions at different known concentrations, developing the transductioncharacteristics. Reflectance spectroscopy needs calibration against a reference method with the ingredientof interest, to associate to a spectra a quantitative information. In the case of non-invasive analysis,such as reflectance spectroscopy, sampling is less important than performing a correct workflow formeasurements. In the future, it is hoped that these systems will be able to self-calibrate. Non-invasiveand machine learning-based systems, which rather than following standard calibration using referenceconcentrations, can count on huge amount of data, are definitely favorites from this point of view. Indeed,smartphone-based diagnostics allows ease capture of data and generation of large datasets, which can beappropriately managed by means of advanced computational analytics, such as machine/deep learningin combination with human expertise, for the extraction of meaningful information [52].
6. Conclusions
In this review, we have presented the recent developments in smartphone-based food diagnosticswithin the past 5 years. Results show that this novel field of research represents a promising areathat has high scientific and commercial impact. In particular, advancements in biomedical science,chemistry, biotechnology, optics, and engineering have led to new diagnostic platforms which aremore portable, economical and easier to use than conventional lab-based assays. Furthermore, theuniversal presence of mobile phones in our society makes it possible to leverage these devices foron-site testing. Nevertheless, these systems raise questions about use protocols and reliability ofmeasurements. The repeatability of a measure, intrinsically guaranteed by a laboratory apparatus,becomes a delicate condition to be met in case of portable modules for on-site analysis. Opportuneoptimizations must be evaluated at the design stage for the physicality of the instrument, to exclude orminimize any external noise sources.
Researchers have come up with different solutions and embodiments for exploiting the greatpotential offered by smartphones. According to the detection strategy, we have classified the revisedworks into two main classes; biosensor-, and spectroscopy-based smartphone platforms. In both ofthese approaches, mobile phone provided a simplified user interface, visual display, data processing,storage, and wireless transmission. While both strategies feature advantages, they also face severallimitations. Biosensors are economic and intrinsically sensitive to a specific target and only need slightcomputation processes. Nevertheless, they are based on disposable cartridges or strips, and requireinvasive sampling to perform the diagnostics. Spectroscopy indeed allows peculiar rapid non-invasiveand non-destructive analysis. However, it is not a target-specific method and it must be associatedwith complex multivariate statistical and chemometric tools for spectral dataset analysis to extractthe relevant chemical information. While in the biosensors based-approach, the key-enabling factorsare the choices of the reagent and the transduction process, in case of spectroscopy, the critical designcriteria are represented by the selections of the wavelength range for source and detector, and of themeasurement setup. Thus, both approaches are easily adaptable methods, since calibration and tuningof the systems are performed according to the desired application. Moreover, they require only a
Sensors 2017, 17, 1453 20 of 22
basic training, and a few minutes for detecting and processing, with the potential for providing auser-friendly, on-the-go, scanning scenario. While lab-on-smartphone biosensor applications are wellestablished, the exploitation of smartphone spectroscopy is in its infancy. Fortuitously, advancementsin the fabrication of optical sensors, which are leading to increasingly miniaturized and economicaltechnology, are keeping pace with the development of increasingly sophisticated machine-learningalgorithms. This, combined with the enormous potential offered by cloud computing, and the abilityof modern smartphones to act as both connecting portals and interfaces for analysis and display ofresults, dramatic developments are foreseen in the field of mobile diagnostics, operated not only forfood monitoring applications, but also for environmental and biomedical sensing.
Acknowledgments: This work has been supported by TIM S.p.A., Innovation Department-Joint OpenLab initiative.
Author Contributions: Giovanni Rateni conducted the literature review with the discussion, correction, andguidance provided by all the other authors.
Conflicts of Interest: The authors declare no conflict of interest.
References
1. Horizon Prize Food Scanner 1. Available online: http://ec.europa.eu/research/horizonprize/index.cfm?prize=food-scanner (accessed on 1 February 2017).
2. Ozcan, A. Mobile phones democratize and cultivate next-generation imaging, diagnostics and measurementtools. Lab Chip 2014, 14, 3187–3194. [CrossRef] [PubMed]
4. Zhang, D.; Liu, Q. Biosensors and bioelectronics on smartphone for portable biochemical detection.Biosens. Bioelectron. 2016, 75, 273–284. [CrossRef] [PubMed]
5. Li, F.; Bao, Y.; Wang, D.; Wang, W.; Niu, L. Smartphones for sensing. Sci. Bull. 2016, 61, 190–201. [CrossRef]6. Daponte, P.; Vito, L.; de Picariello, F.; Riccio, M. State of the art and future developments of measurement
et al. Advances in Smartphone-Based Point-of-Care Diagnostics. Proc. IEEE 2015, 103, 236–247. [CrossRef]8. Roda, A.; Michelini, E.; Zangheri, M.; Di Fusco, M.; Calabria, D.; Simoni, P. Smartphone-based biosensors:
A critical review and perspectives. TrAC Trends 2016, 79, 317–325. [CrossRef]9. Liu, X.; Lin, T.-Y.; Lillehoj, P.B. Smartphones for Cell and Biomolecular Detection. Ann. Biomed. Eng. 2014, 42,
2205–2217. [CrossRef] [PubMed]10. Yang, K.; Peretz-Soroka, H.; Liu, Y.; Lin, F. Novel developments in mobile sensing based on the integration
of microfluidic devices and smartphones. Lab Chip 2016, 16, 943–958. [CrossRef] [PubMed]11. Zhu, H.; Sikora, U.; Ozcan, A. Quantum dot enabled detection of Escherichia coli using a cell-phone. Analyst
Ozcan, A. Cellphone-based detection platform for rbST biomarker analysis in milk extracts using a microspherefluorescence immunoassay. Anal. Bioanal. Chem. 2014, 406, 6857–6866. [CrossRef] [PubMed]
13. Mora, C.A.; Herzog, A.F.; Raso, R.A.; Stark, W.J. Programmable living material containing reportermicro-organisms permits quantitative detection of oligosaccharides. Biomaterials 2015, 61, 1–9. [CrossRef][PubMed]
14. Coskun, A.F.; Wong, J.; Khodadadi, D.; Nagi, R.; Tey, A.; Ozcan, A. A personalized food allergen testingplatform on a cellphone. Lab Chip 2013, 13, 636–640. [CrossRef] [PubMed]
15. Lee, S.; Kim, G.; Moon, J. Performance improvement of the one-dot lateral flow immunoassay for aflatoxinB1 by using a smartphone-based reading system. Sensors 2013, 13, 5109–5116. [CrossRef] [PubMed]
22. Fang, J.; Qiu, X.; Wan, Z.; Zou, Q.; Su, K.; Hu, N.; Wang, P. A sensing smartphone and its portable accessoryfor on-site rapid biochemical detection of marine toxins. Anal. Methods 2016, 8, 6895–6902. [CrossRef]
23. Levin, S.; Krishnan, S.; Rajkumar, S.; Halery, N.; Balkunde, P. Monitoring of fluoride in water samples usinga smartphone. Sci. Total Environ. 2016, 551–552, 101–107. [CrossRef] [PubMed]
24. Wang, Y.; Li, Y.; Bao, X.; Han, J.; Xia, J.; Tian, X.; Ni, L. A smartphone-based colorimetric reader coupled witha remote server for rapid on-site catechols analysis. Talanta 2016, 160, 194–204. [CrossRef] [PubMed]
25. Seo, S.M.; Kim, S.W.; Jeon, J.W.; Kim, J.H.; Kim, H.S.; Cho, J.H.; Lee, W.H.; Paek, S.H. Food contaminationmonitoring via internet of things, exemplified by using pocket-sized immunosensor as terminal unit.Sens. Actuators B Chem. 2016, 233, 148–156. [CrossRef]
27. Dou, Y.; Jiang, Z.; Deng, W.; Su, J.; Chen, S.; Song, H.; Aldalbahi, A.; Zuo, X.; Song, S.; Shi, J.; Fan, C. Portabledetection of clenbuterol using a smartphone-based electrochemical biosensor with electric field-drivenacceleration. J. Electroanal. Chem. 2016, 781, 339–344. [CrossRef]
28. Giordano, G.F.; Vicentini, M.B.R.; Murer, R.C.; Augusto, F.; Ferrão, M.F.; Helfer, G.A.; da Costa, A.B.;Gobbi, A.L.; Hantao, L.W.; Lima, R.S. Point-of-use electroanalytical platform based on homemade potentiostatand smartphone for multivariate data processing. Electrochim. Acta 2016, 219, 170–177. [CrossRef]
29. Liang, P.-S.; Park, T.S.; Yoon, J.-Y. Rapid and reagentless detection of microbial contamination within meatutilizing a smartphone-based biosensor. Sci. Rep. 2014, 4, 5953. [CrossRef] [PubMed]
30. Bouyé, C.; Kolb, H.; D’Humières, B. Mini and micro spectrometers pave the way to on-field advancedanalytics. In Proceedings of the SPIE-Photonics Instrumentation Engineering III, San Francisco, CA, USA,13 February 2016; SPIE: Bellingham, WA, USA, 2016; Volume 9754.
31. Mignani, A.G.; Mencaglia, A.A.; Baldi, M.; Ciaccheri, L. SpiderSpec: A low-cost compact colorimeter withIoT functionality. In Proceedings of the SPIE Fifth Asia-Pacific Optical Sensors Conference, Jeju, Korea,20 May 2015; Lee, B., Lee, S.B., Rao, Y., Eds.; SPIE: Bellingham, WA, USA, 2015; Volume 9655.
32. Das, A.J.; Wahi, A.; Kothari, I.; Raskar, R. Ultra-portable, wireless smartphone spectrometer for rapid,non-destructive testing of fruit ripeness. Sci. Rep. 2016, 6, 32504. [CrossRef] [PubMed]
33. Oh, M.; Lee, H.; Cho, H.; Moon, S.-H.; Kim, E.-K.; Kim, M.S. Detection of fecal contamination on beefmeat surfaces using handheld fluorescence imaging device (HFID). In Proceedings of the SPIE Sensing forAgriculture and Food Quality and Safety VIII, Baltimore, MD, USA, 17 April 2016; Kim, M.S., Chao, K.,Chin, B.A., Eds.; SPIE: Bellingham, WA, USA, 2016; Volume 9864.
34. Rissanen, A.; Saari, H.; Rainio, K.; Stuns, I.; Viherkanto, K.; Holmlund, C.; Nakki, I.; Ojanen, H. MEMSFPI-based smartphone hyperspectral imager. In Proceedings of the SPIE Next-Generation SpectroscopicTechnologies IX, Baltimore, MD, USA, 17 April 2016; Druy, M.A., Crocombe, R.A., Eds.; SPIE: Bellingham,WA, USA, 2016; Volume 9855.
35. Sasikumar, H.; Prasad, V.; Pal, P.; Varma, M.M. Diffractive Interference Optical Analyzer (DiOPTER).In Proceedings of the SPIE Optical Diagnostics and Sensing XVI: Toward Point-of-Care Diagnostics,San Francisco, CA, USA, 13 February 2016; Cote, G.L., Ed.; SPIE: Bellingham, WA, USA, 2016; Volume 9715.
36. Yu, X.; Lu, Q.; Gao, H.; Ding, H. Development of a handheld spectrometer based on a linear variable filterand a complementary metal-oxide-semiconductor detector for measuring the internal quality of fruit. J. NearInfrared Spectrosc. 2016, 24, 69–76. [CrossRef]
37. CELLMIC | We Innovate Mobile Diagnostics |. Available online: http://www.cellmic.com/ (accessed on20 March 2017).
38. Ozcan, A.; Coskun, A.; Wong, J. Allergen Testing Platform for Use with Mobile Electronic Devices. US Pat.App. 14/053,475, 14 October 2013.
39. OrganaDx Sensor | Portable Food Tester Analyzer. Available online: http://www.cdxlife.com/organa-sensor/(accessed on 20 March 2017).
40. Hosono, S.; Qi, W.; Sato, S.; Suzuki, Y.; Fujiwara, M.; Hiramatsu, H.; Suzuki, S.; Abeygunawardhana, P.K.W.;Wada, K.; Nishiyama, A.; et al. Proposal of AAA-battery-size one-shot ATR Fourier spectroscopic imager foron-site analysis-Simultaneous measurement of multi-components with high accuracy. In Proceedings of theSPIE 9314, Optics and Biophotonics in Low-Resource Settings, San Francisco, CA, USA, 7 February 2015;SPIE: Bellingham, WA, USA, 2015; Volume 9314.
41. Rouse, R. Apparatus for Detection and Delivery of Volatilized Compounds and RELATED Methods.U.S. Patent Application 14/905,780, 14 July 2014.
42. Gailius, D. Electronic Nose for Determination of Meat Freshness. U.S. Patent Application 14/376,939, 8 June 2014.43. FOODsniffer. Available online: http://www.myfoodsniffer.com/ (accessed on 20 March 2017).44. Sundvor, S.; Portela, S.; Ward, J.; Walton, J. System and Method for Detection of Target Substances. U.S. Patent
Application 15/265,171, 26 September 2016.45. Nima-A Portable Gluten Tester | Nima. Available online: https://nimasensor.com/ (accessed on 20 March 2017).46. Antila, J.; Kantojärvi, U.; Mäkynen, J. Optical Measurement System. WO2016071572A1, 2016.47. Food Scanner. Available online: https://www.spectralengines.com/products/food-scanner (accessed on
23 March 2017).48. Watson, W.; Correa, I. Analyzing and Correlating Spectra, Identifying Samples and Their Ingredients, and
Displaying Related Personalized Information. US Patent 9,212,996, 5 August 2015.49. Tellspec–Beam Your Health Up–TellSpec. Available online: http://tellspec.com/en/ (accessed on 20 March 2017).50. Goldring, D.; Sharon, D. Low-Cost Spectrometry System for End-User Food Analysis. U.S. Patent 9,377,396,
31 October 2016.51. Consumer Physics. Available online: https://www.consumerphysics.com/myscio/ (accessed on 20 March 2017).52. Contreras-Naranjo, J.; Wei, Q. Mobile phone-based microscopy, sensing, and diagnostics. IEEE J. Sel. 2016,