48
CAP 5510: Introduction to Bioinformatics Giri Narasimhan ECS 254; Phone: x3748 [email protected] www.cis.fiu.edu/~giri/teach/BioinfS08.html
CAP 5510: Introduction to Bioinformatics!
Giri Narasimhan ECS 254; Phone: x3748
[email protected] www.cis.fiu.edu/~giri/teach/BioinfS08.html
Introduction
Page 215
Darwin: Evolution & Natural Selection! Charles Darwin’s 1859 book (On the Origin of Species
By Means of Natural Selection, or the Preservation of Favoured Races in the Struggle for Life) introduced the Theory of Evolution.
Struggle for existence induces a natural selection. Offspring are dissimilar from their parents (that is, variability exists), and individuals that are more fit for a given environment are selected for. In this way, over long periods of time, species evolve. Groups of organisms change over time so that descendants differ structurally and functionally from their ancestors.
Slide by Pevsner
Dominant View of Evolution! All existing organisms are derived from a common
ancestor and that new species arise by splitting of a population into subpopulations that do not cross-breed.
Organization: Directed Rooted Tree; Existing species: Leaves; Common ancestor species (divergence event): Internal node; Length of an edge: Time.
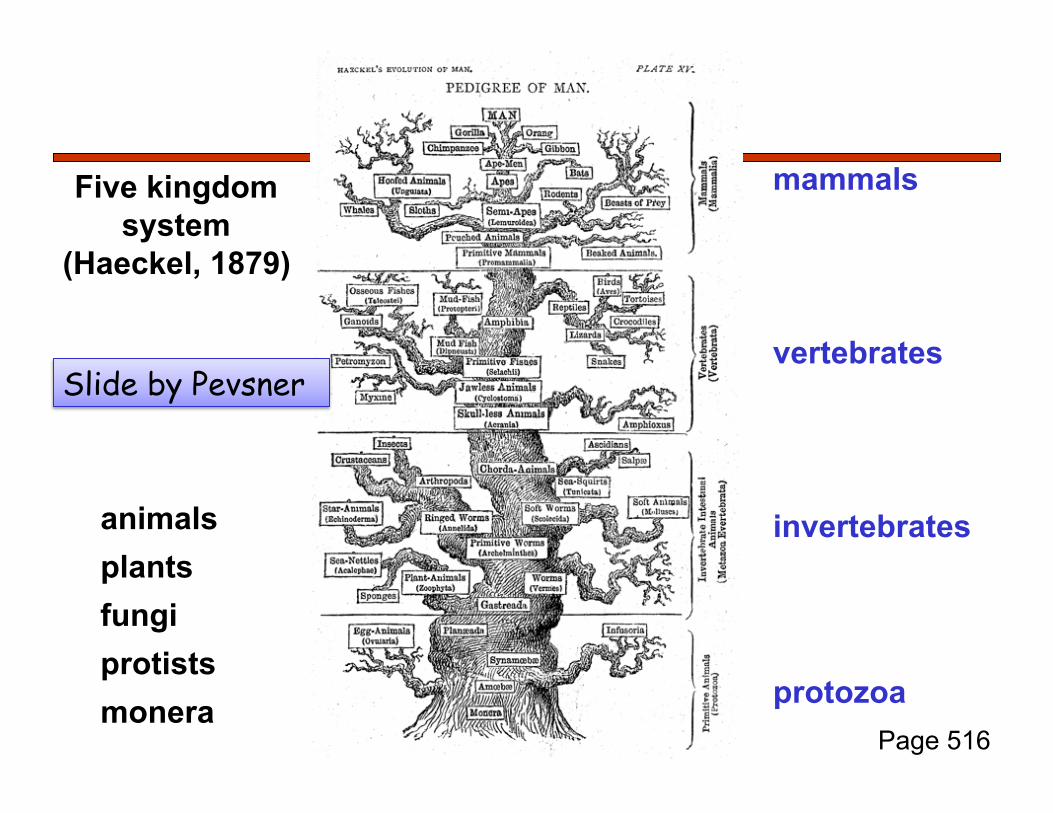
plants animals
monera
fungi protists
protozoa
invertebrates
vertebrates
mammals Five kingdom system
(Haeckel, 1879)
Page 516
Slide by Pevsner
Evolution & Phylogeny! At the molecular level, evolution is a process of
mutation with selection. Molecular evolution is the study of changes in genes
and proteins throughout different branches of the tree of life.
Phylogeny is the inference of evolutionary relationships. Traditionally, phylogeny relied on the comparison of morphological features between organisms. Today, molecular sequence data are also used for phylogenetic analyses.
Slide by Pevsner
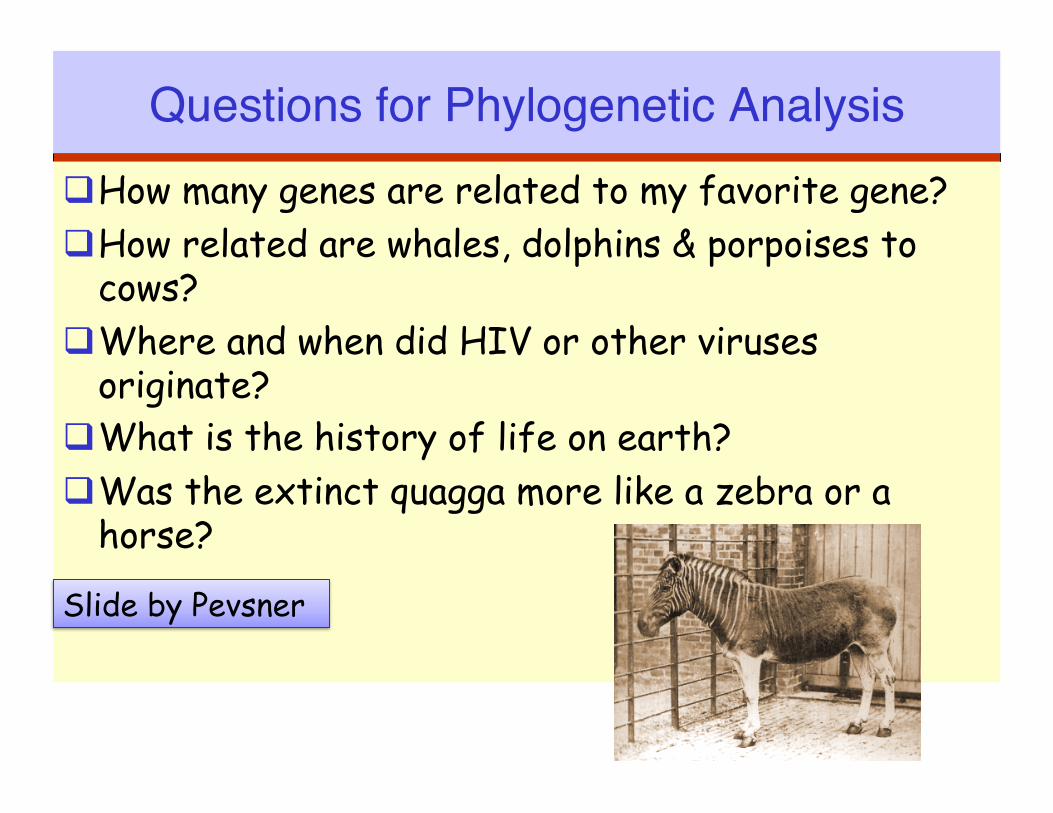
Questions for Phylogenetic Analysis! How many genes are related to my favorite gene? How related are whales, dolphins & porpoises to
cows? Where and when did HIV or other viruses
originate? What is the history of life on earth? Was the extinct quagga more like a zebra or a
horse?
Slide by Pevsner
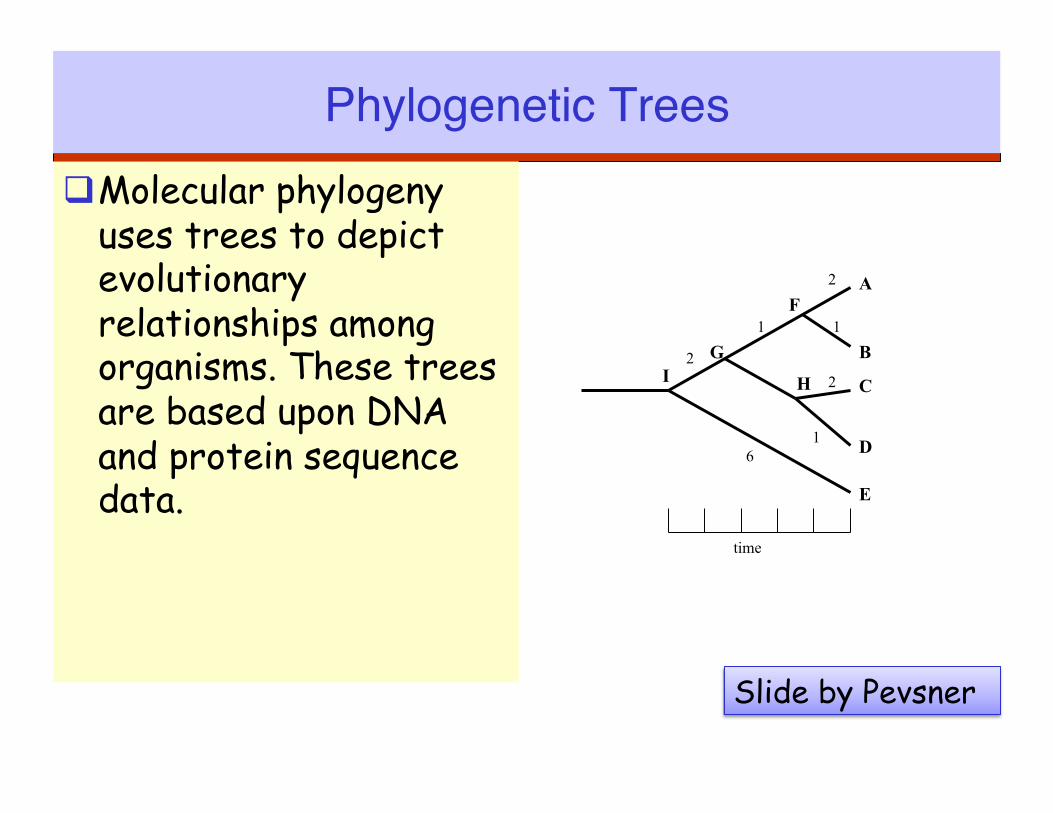
Phylogenetic Trees! Molecular phylogeny
uses trees to depict evolutionary relationships among organisms. These trees are based upon DNA and protein sequence data.
A
B
C
D
E
F
G
H I
time
6
2 1 1
2
1
2
Slide by Pevsner
A
B
C
D
E
F
G
H I
time
6
2 1 1
2
1
2
6
1 2
2
1
A
B C
2
1
2 D
E one unit
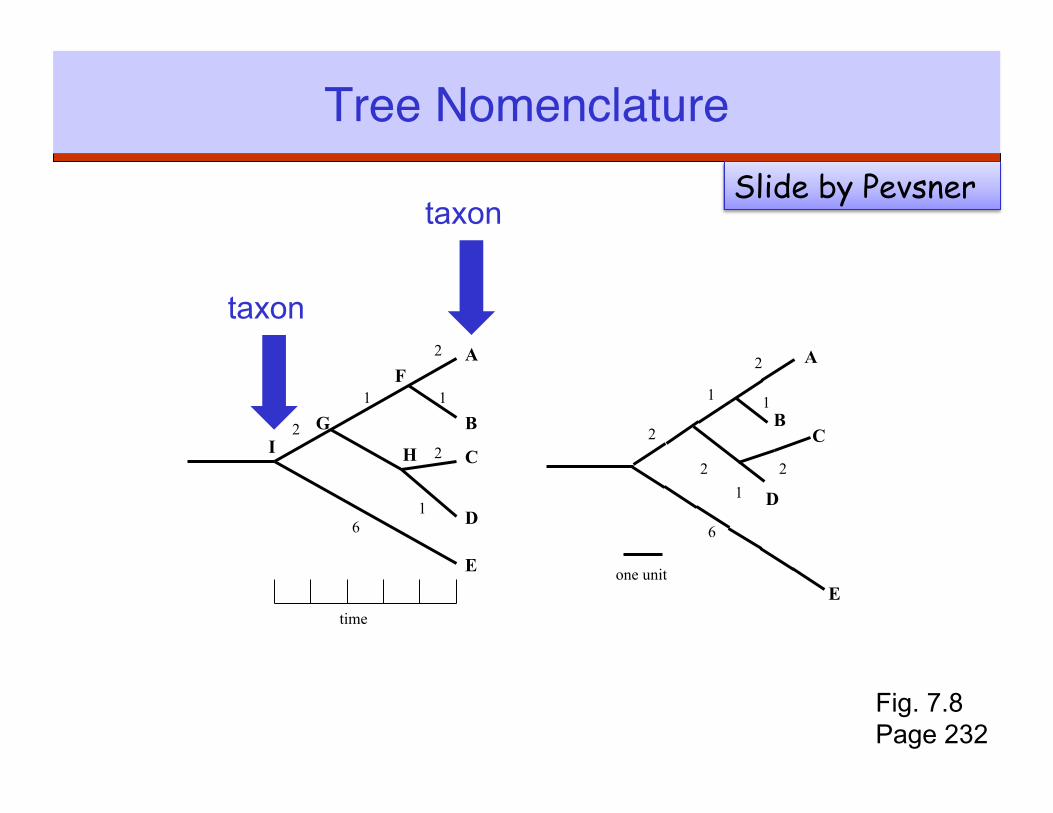
Tree nomenclature
taxon
taxon
Fig. 7.8 Page 232
Tree Nomenclature!Slide by Pevsner
A
B
C
D
E
F
G
H I
time
6
2 1 1
2
1
2
6
1 2
2
1
A
B C
2
1
2 D
E one unit
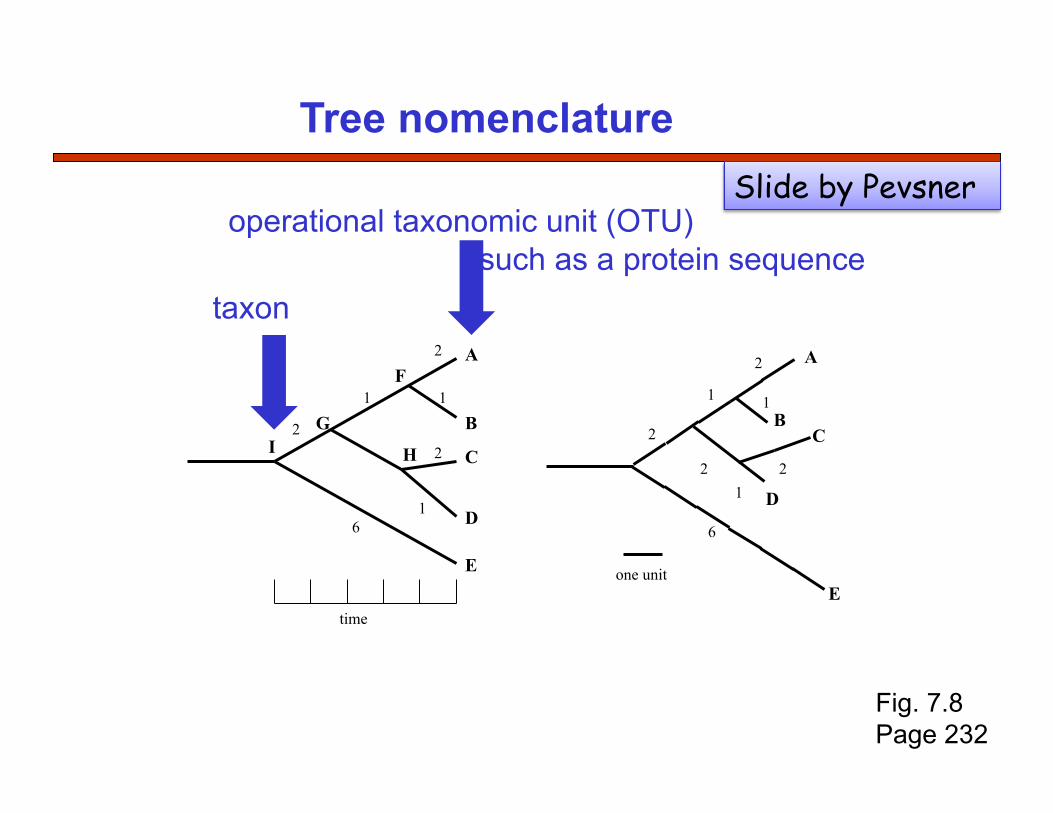
Tree nomenclature
taxon
operational taxonomic unit (OTU) such as a protein sequence
Fig. 7.8 Page 232
Slide by Pevsner
A
B
C
D
E
F
G
H I
time
6
2 1 1
2
1
2
6
1 2
2
1
A
B C
2
1
2 D
E one unit
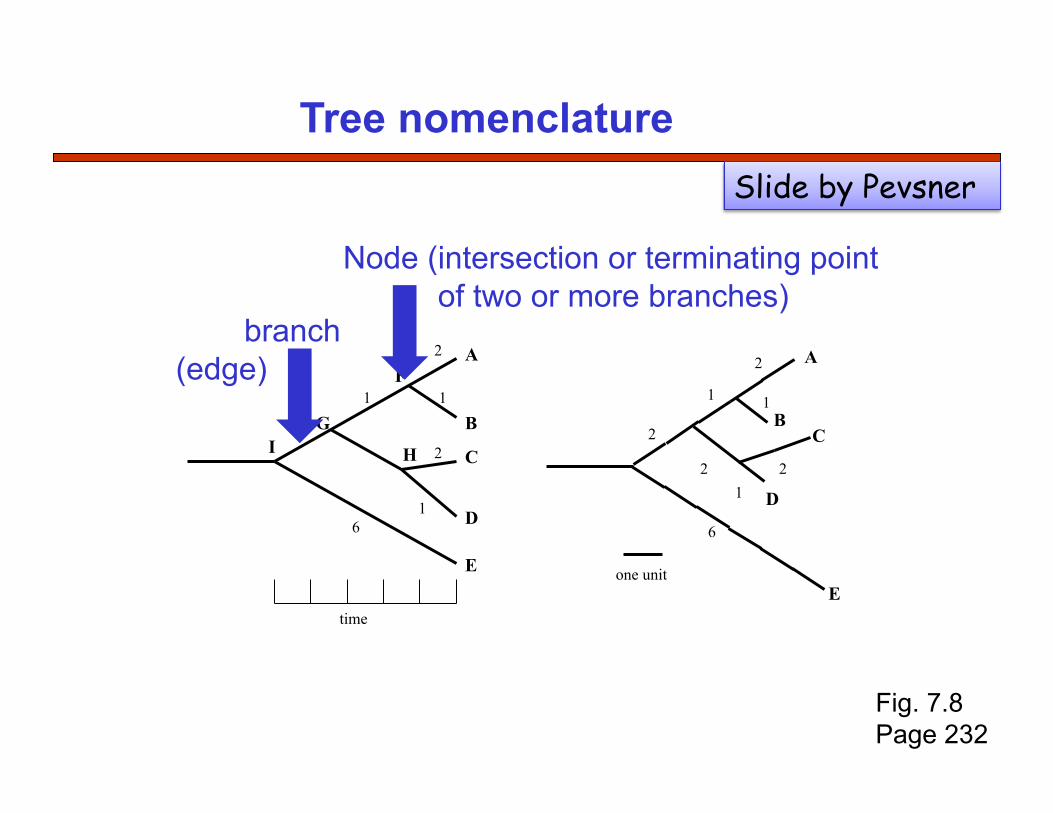
Tree nomenclature
branch (edge)
Node (intersection or terminating point of two or more branches)
Fig. 7.8 Page 232
Slide by Pevsner
A
B
C
D
E
F
G
H I
time
6
2 1 1
2
1
2
6
1 2
2
1
A
B C
2
1
2 D
E one unit
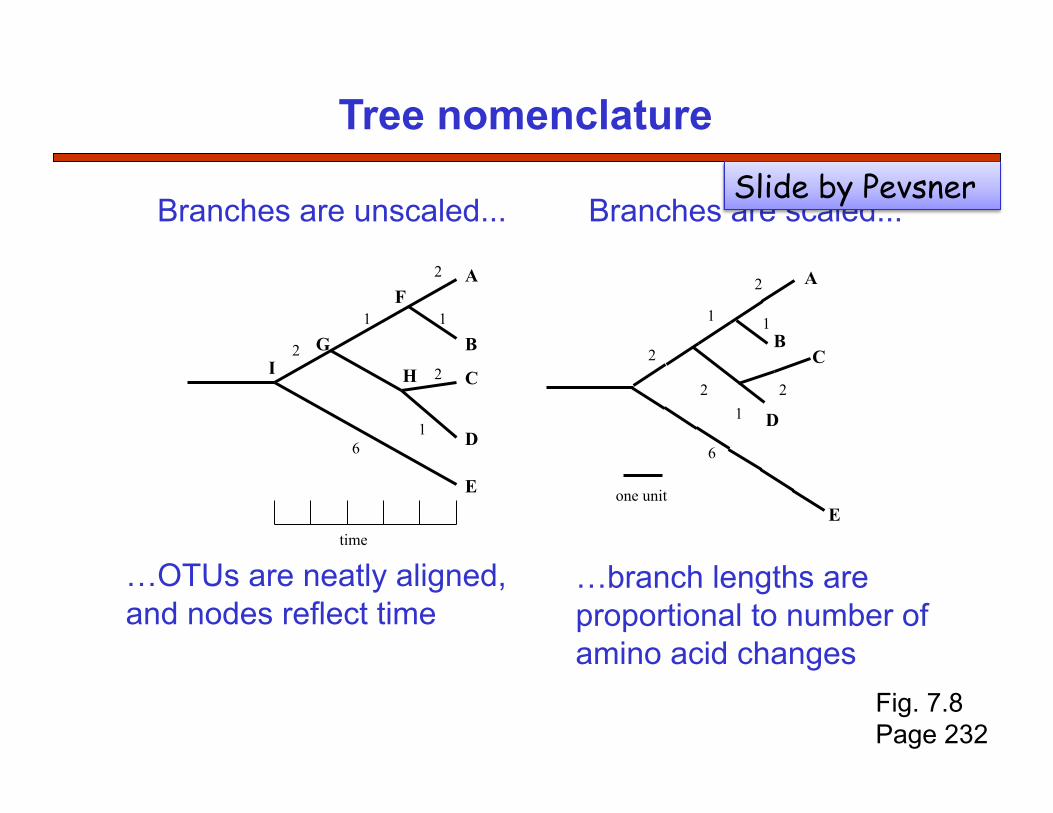
Tree nomenclature
Branches are unscaled... Branches are scaled...
…branch lengths are proportional to number of amino acid changes
…OTUs are neatly aligned, and nodes reflect time
Fig. 7.8 Page 232
Slide by Pevsner
A
B
C
D
E
F
G
H I
time
6
2 1 1
2
1
2
6
1 2
2
1
A
B C
2 2 D
E one unit
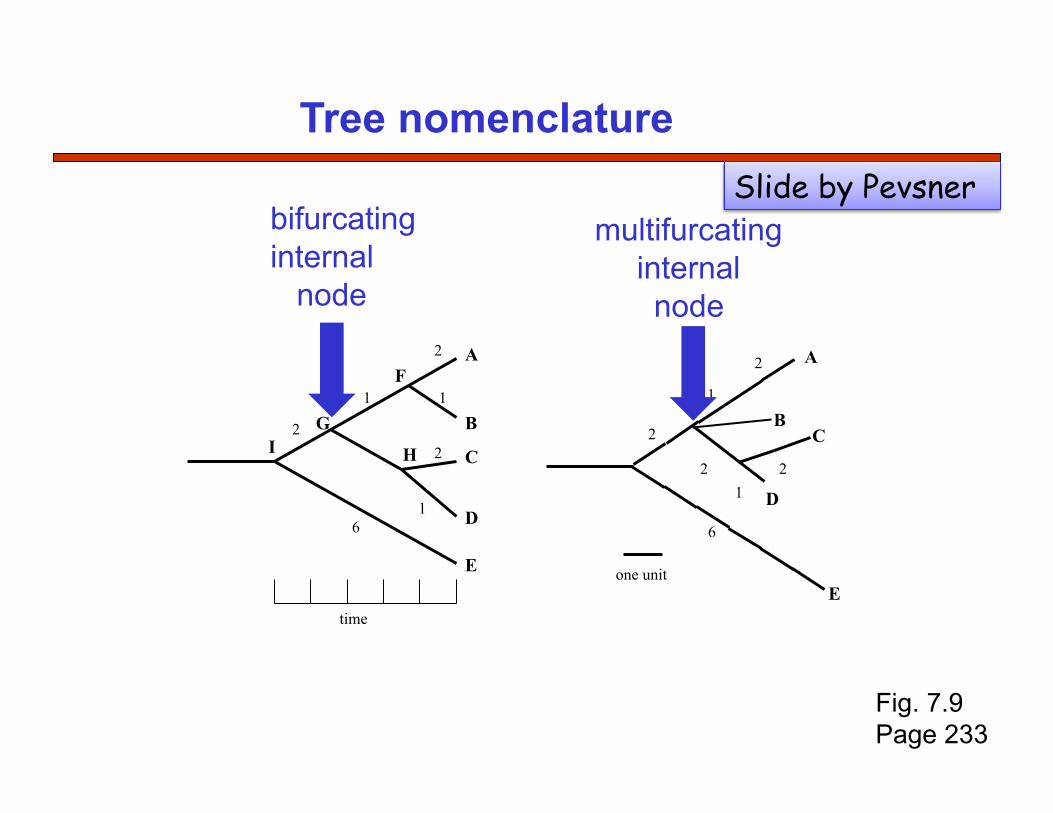
Tree nomenclature
bifurcating internal node
multifurcating internal node
Fig. 7.9 Page 233
Slide by Pevsner
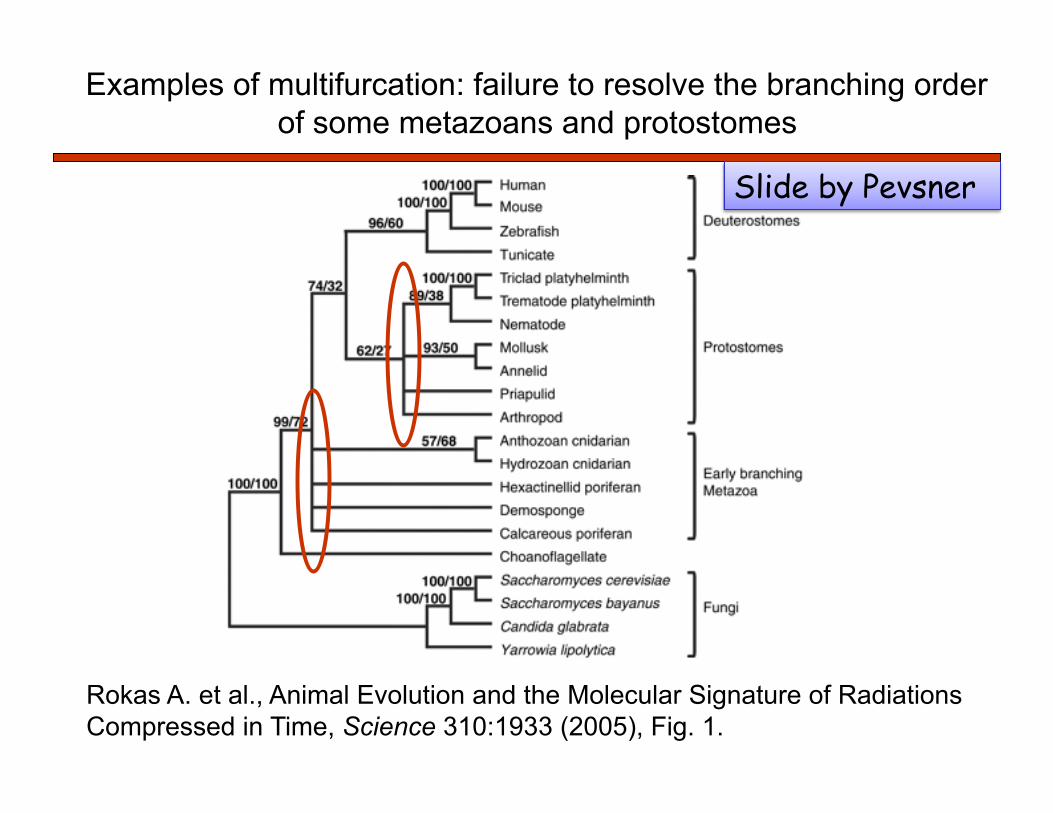
Examples of multifurcation: failure to resolve the branching order of some metazoans and protostomes
Rokas A. et al., Animal Evolution and the Molecular Signature of Radiations Compressed in Time, Science 310:1933 (2005), Fig. 1.
Slide by Pevsner
A
B C
D
E
F
G
H I
time
6
2 1 1
2
1
2
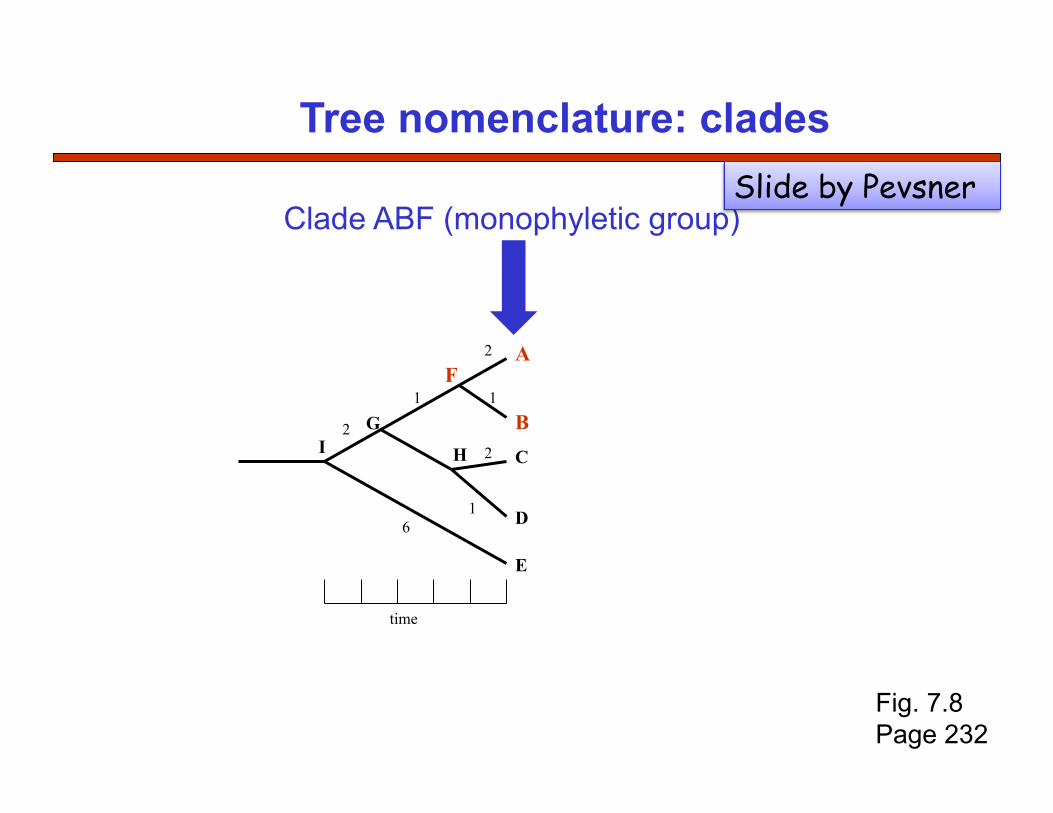
Tree nomenclature: clades
Clade ABF (monophyletic group)
Fig. 7.8 Page 232
Slide by Pevsner
A
B
C
D
E
F
G
H I
time
6
2 1 1
2
1
2
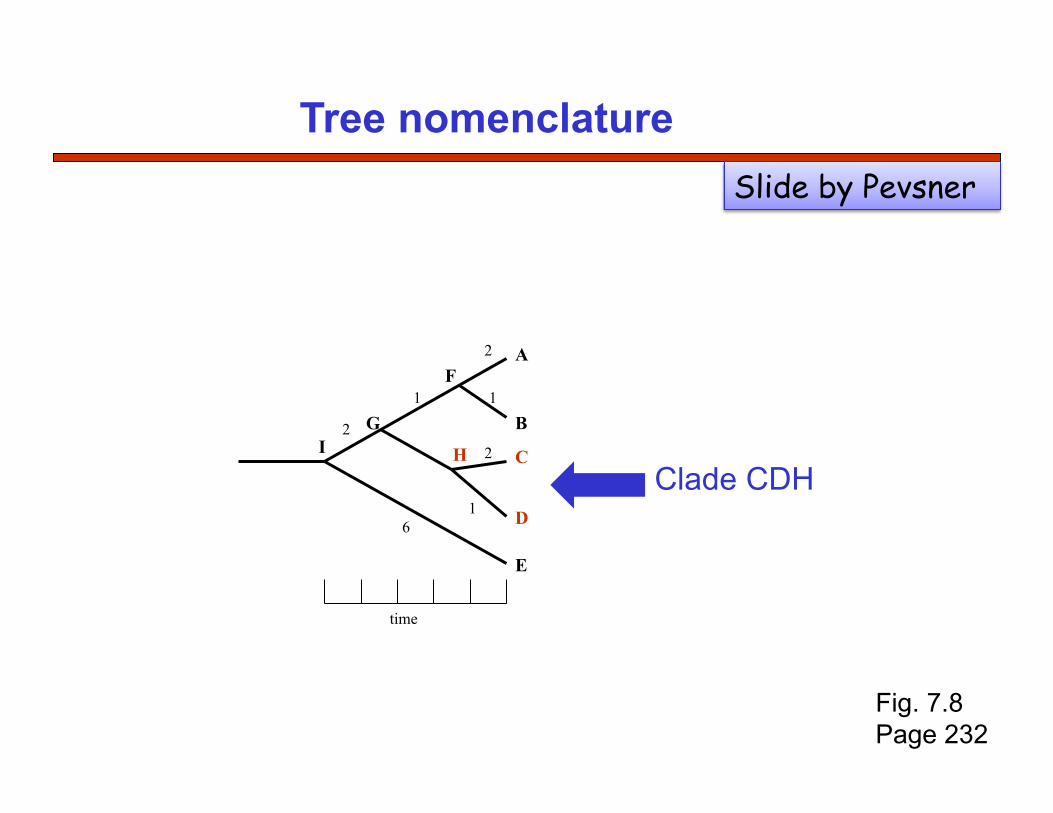
Tree nomenclature
Clade CDH
Fig. 7.8 Page 232
Slide by Pevsner
A
B
C
D
E
F
G
H I
time
6
2 1 1
2
1
2
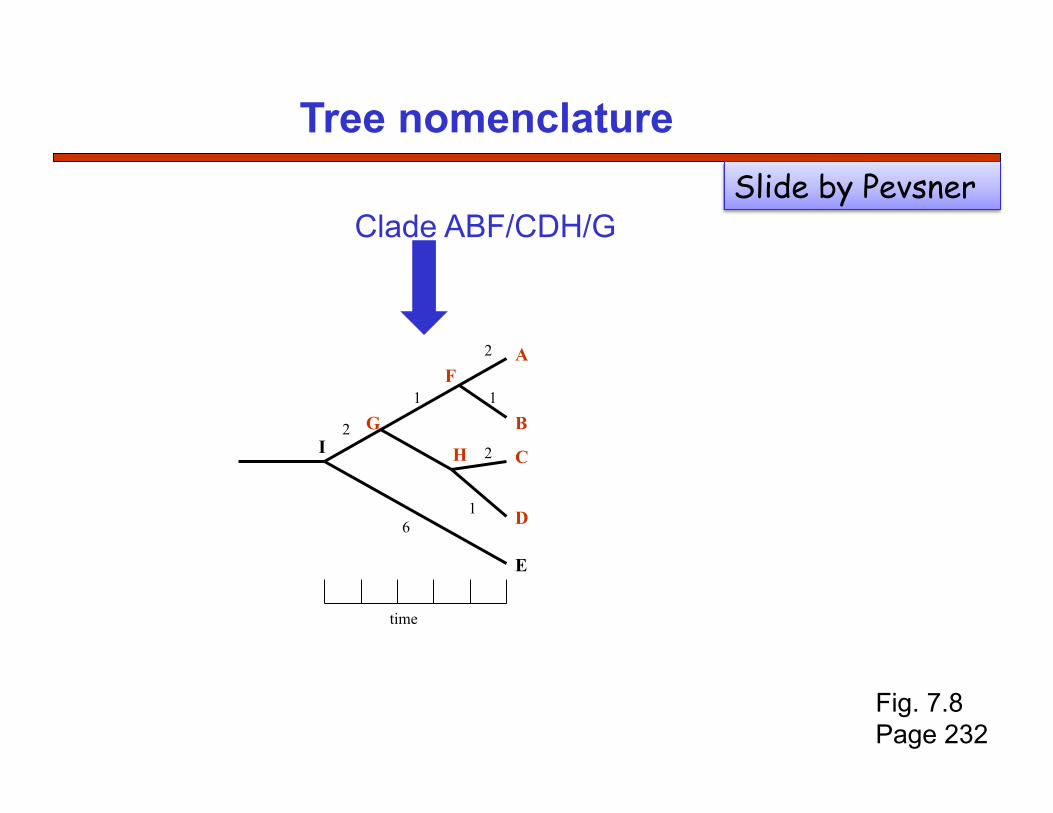
Tree nomenclature
Clade ABF/CDH/G
Fig. 7.8 Page 232
Slide by Pevsner
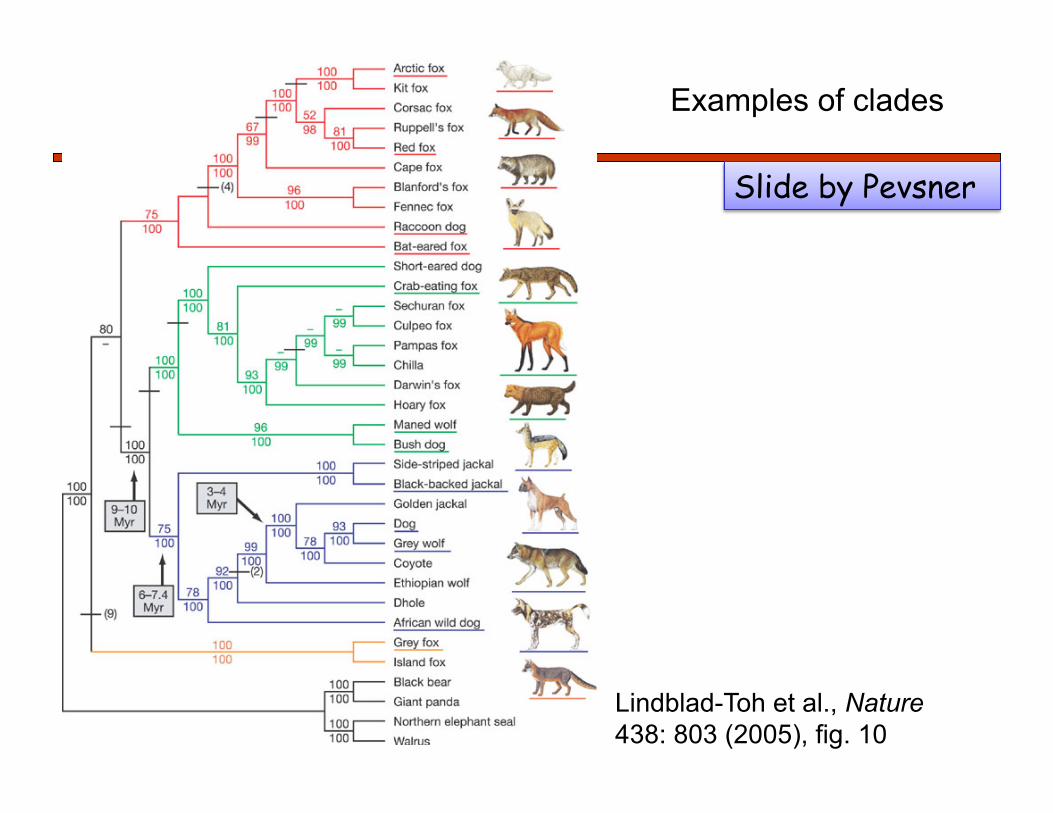
Examples of clades
Lindblad-Toh et al., Nature 438: 803 (2005), fig. 10
Slide by Pevsner
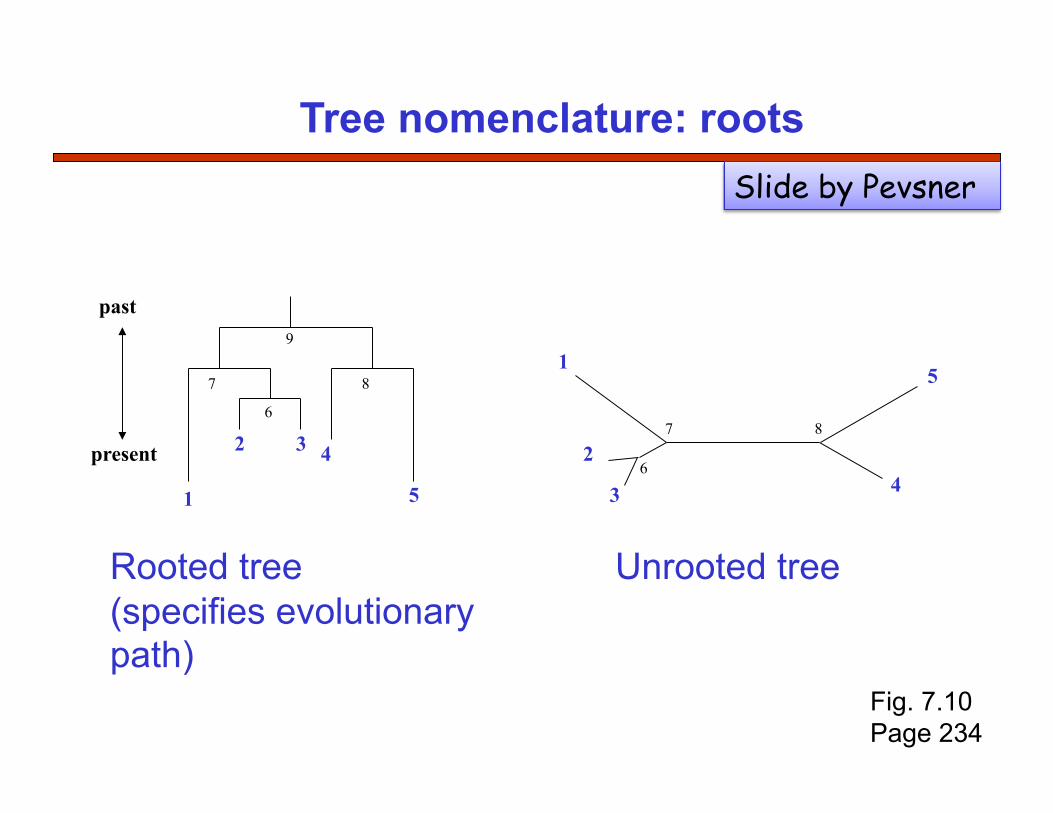
Tree nomenclature: roots
past
present
1
2 3 4
5
6 7 8
9
4
5
8 7
1
2
3 6
Rooted tree (specifies evolutionary path)
Unrooted tree
Fig. 7.10 Page 234
Slide by Pevsner
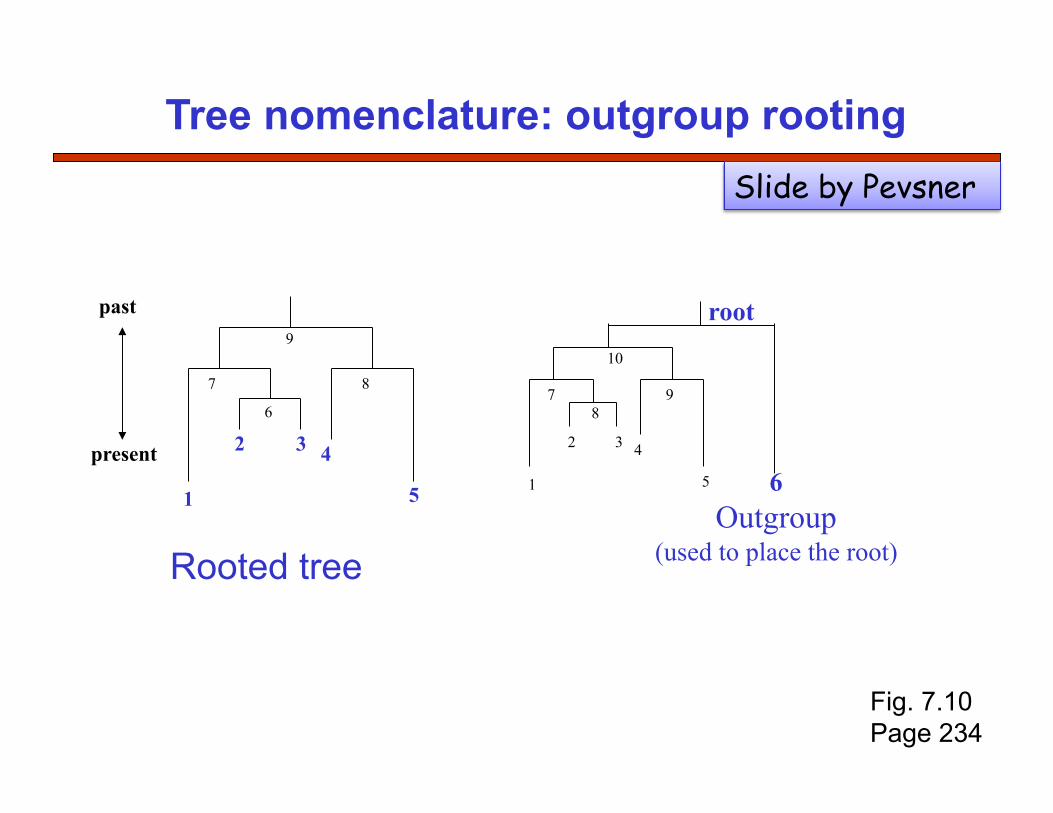
Tree nomenclature: outgroup rooting
past
present
1
2 3 4
5
6 7 8
9
Rooted tree
1 2 3 4
5 6 Outgroup
(used to place the root)
7 9 10
root
8
Fig. 7.10 Page 234
Slide by Pevsner
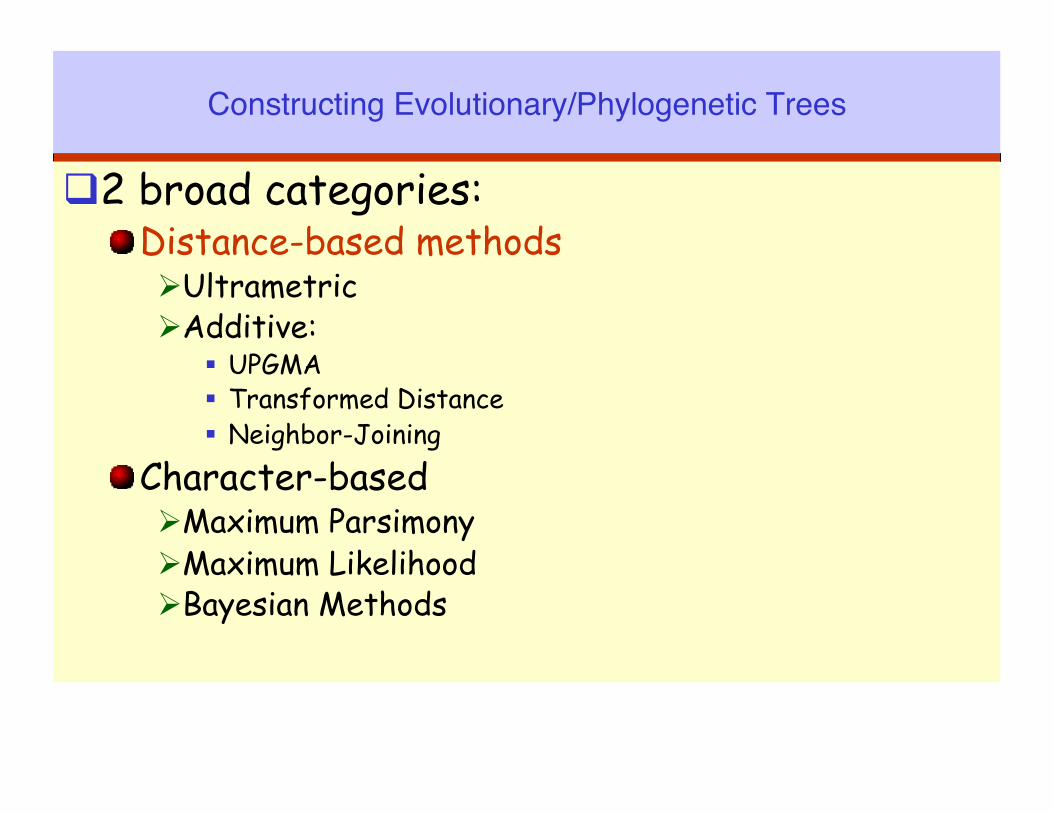
Constructing Evolutionary/Phylogenetic Trees!
2 broad categories: ! Distance-based methods
Ultrametric Additive:
UPGMA Transformed Distance Neighbor-Joining
! Character-based Maximum Parsimony Maximum Likelihood Bayesian Methods
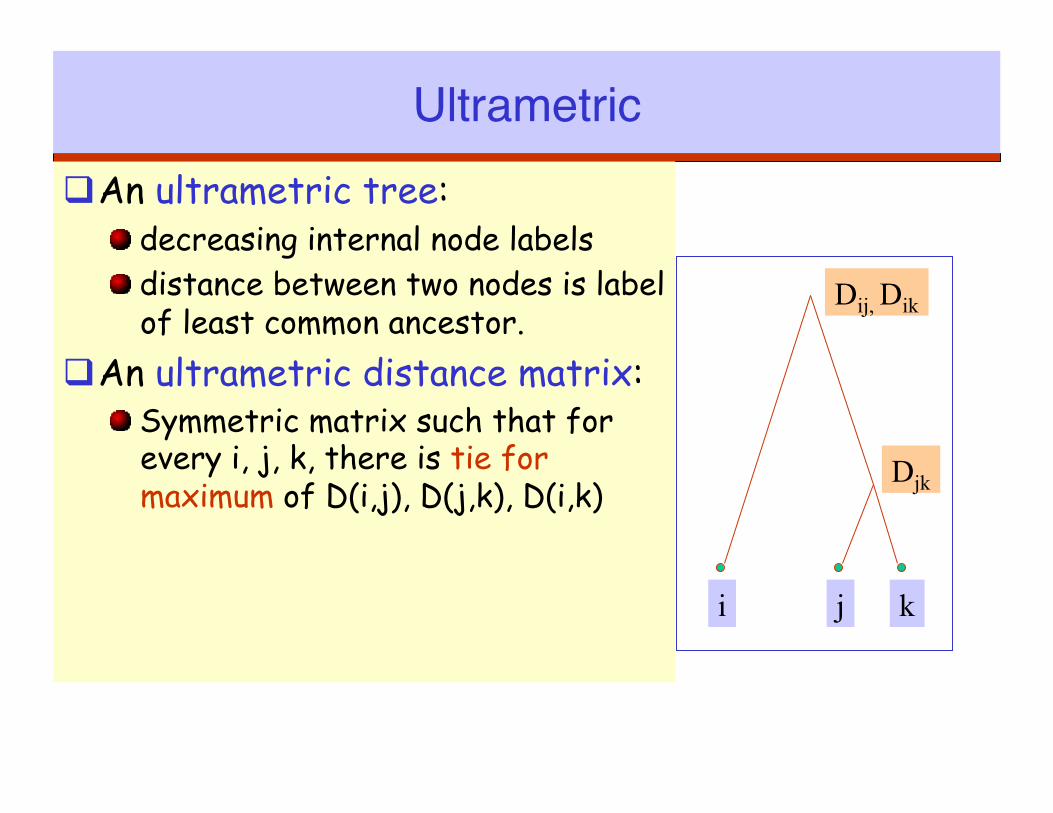
Ultrametric! An ultrametric tree:
! decreasing internal node labels ! distance between two nodes is label
of least common ancestor. An ultrametric distance matrix:
! Symmetric matrix such that for every i, j, k, there is tie for maximum of D(i,j), D(j,k), D(i,k)
Dij, Dik
i j k
Djk
Ultrametric: Assumptions! Molecular Clock Hypothesis, Zuckerkandl & Pauling,
1962: Accepted point mutations in amino acid sequence of a protein occurs at a constant rate. ! Varies from protein to protein ! Varies from one part of a protein to another
Ultrametric Data Sources! Lab-based methods: hybridization
! Take denatured DNA of the 2 taxa and let them hybridize. Then measure energy to separate.
Sequence-based methods: distance
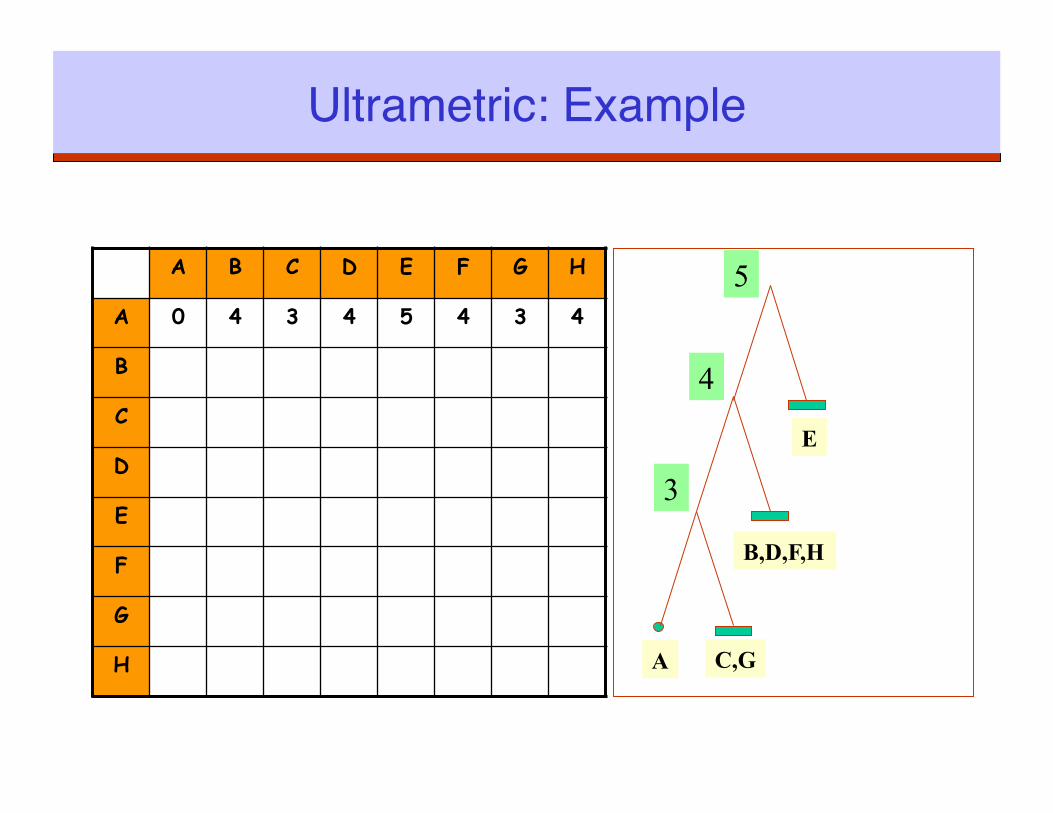
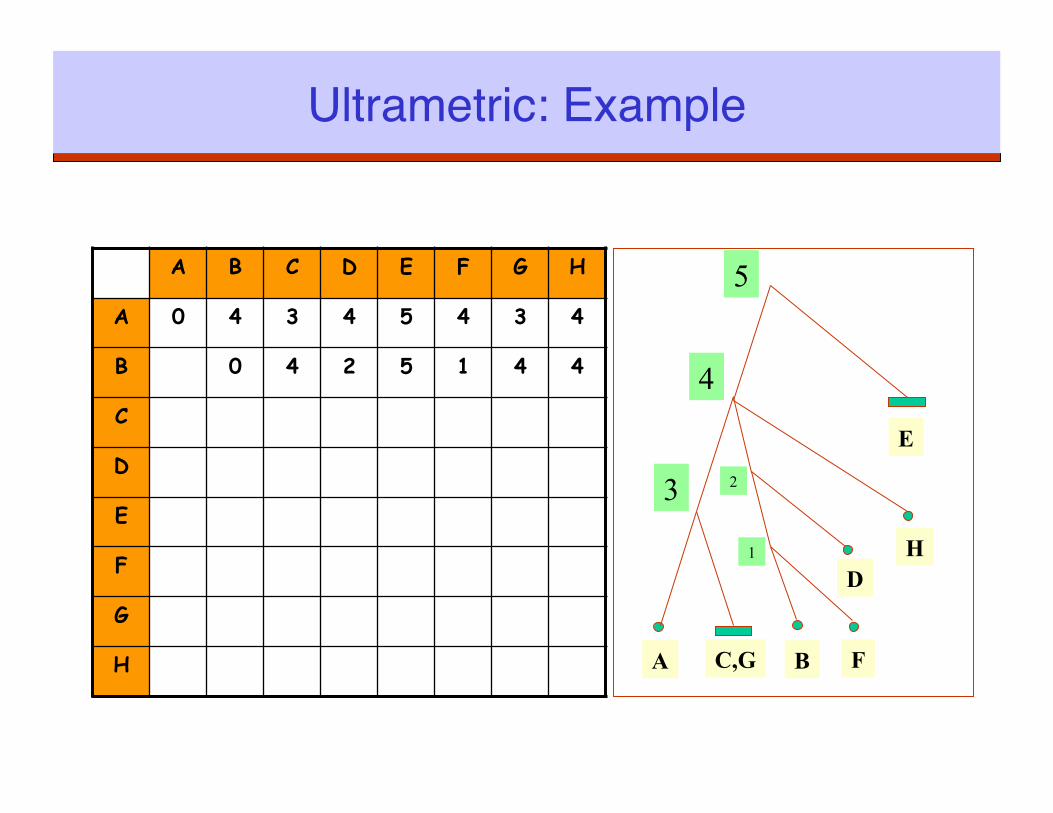
Ultrametric: Example!
A B C D E F G H
A 0 4 3 4 5 4 3 4
B
C
D
E
F
G
H C,G
B,D,F,H
E
A
5
4
3
Ultrametric: Example!
A B C D E F G H
A 0 4 3 4 5 4 3 4
B 0 4 2 5 1 4 4
C
D
E
F
G
H A C,G
E
5
4
3
F
D H
B
2
1
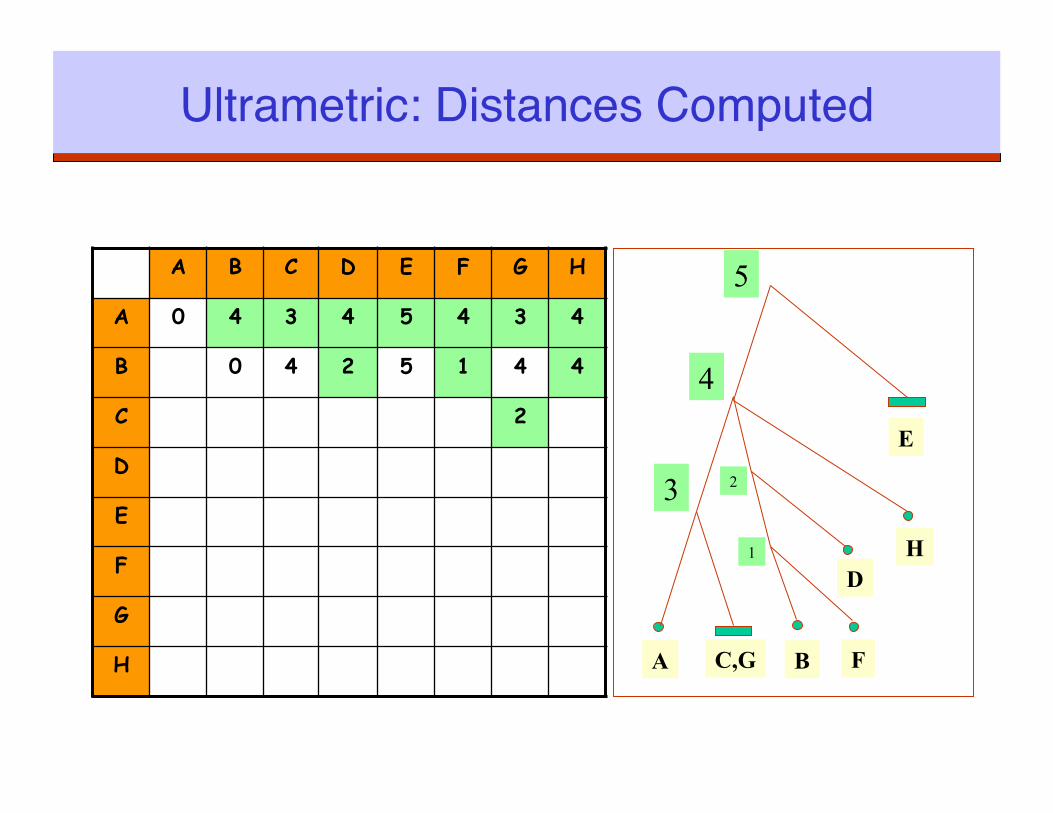
Ultrametric: Distances Computed!
A B C D E F G H
A 0 4 3 4 5 4 3 4
B 0 4 2 5 1 4 4
C 2
D
E
F
G
H A C,G
E
5
4
3
F
D H
B
2
1

Ultrametric: Assumptions! Molecular Clock Hypothesis, Zuckerkandl & Pauling,
1962: Accepted point mutations in amino acid sequence of a protein occurs at a constant rate. ! Varies from protein to protein ! Varies from one part of a protein to another

Ultrametric Data Sources! Lab-based methods: hybridization
! Take denatured DNA of the 2 taxa and let them hybridize. Then measure energy to separate.
Sequence-based methods: distance
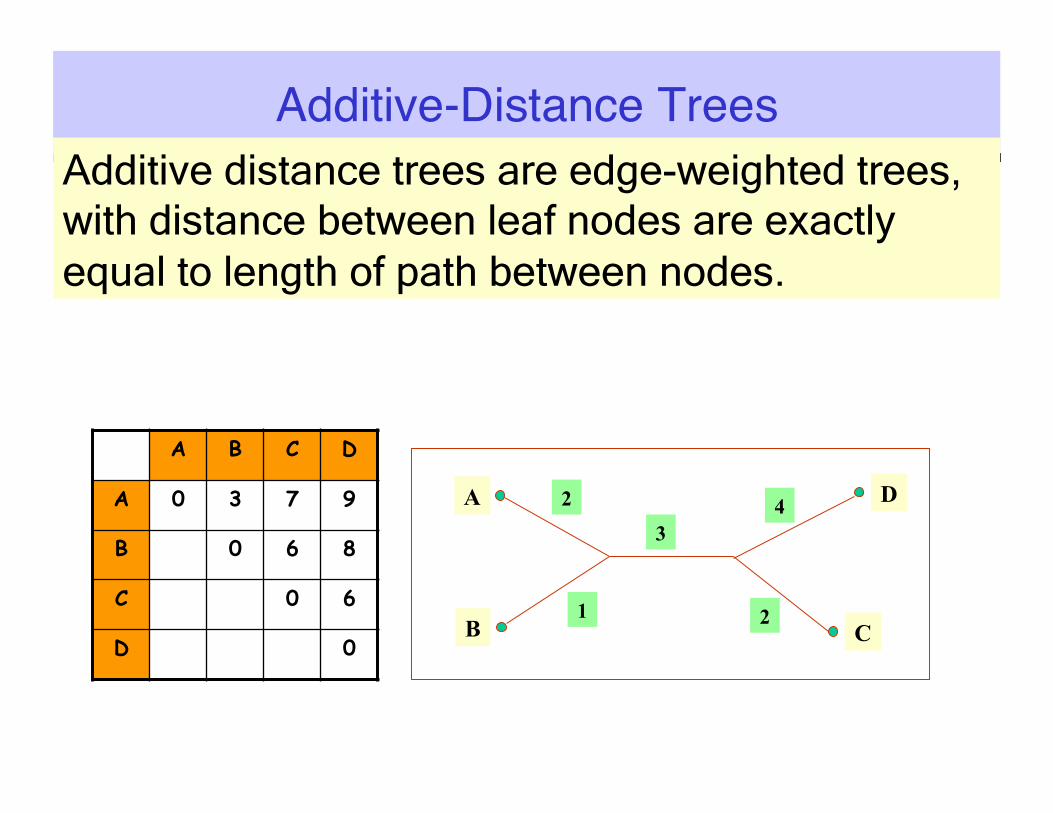
Additive-Distance Trees!
A B C D
A 0 3 7 9
B 0 6 8
C 0 6
D 0
A 2
B C
D 3
2
4
1
Additive distance trees are edge-weighted trees, with distance between leaf nodes are exactly equal to length of path between nodes.
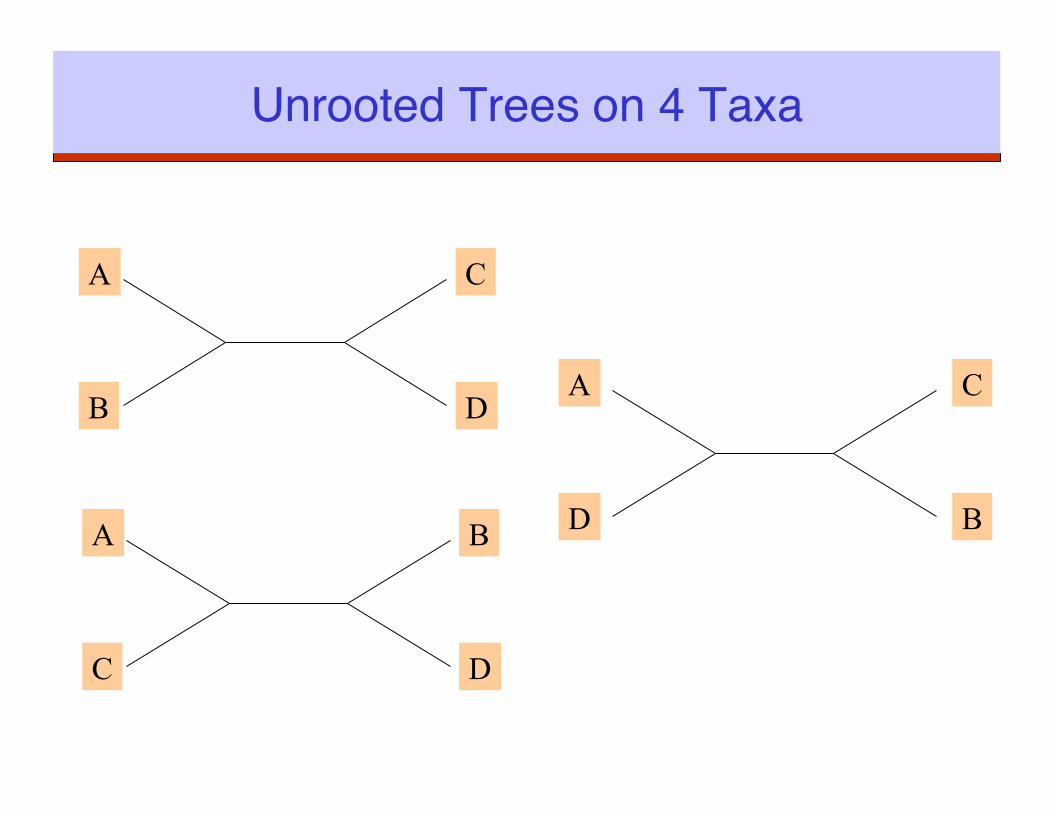
Unrooted Trees on 4 Taxa!
A
D
C
B
A
D
B
C
A
B
C
D
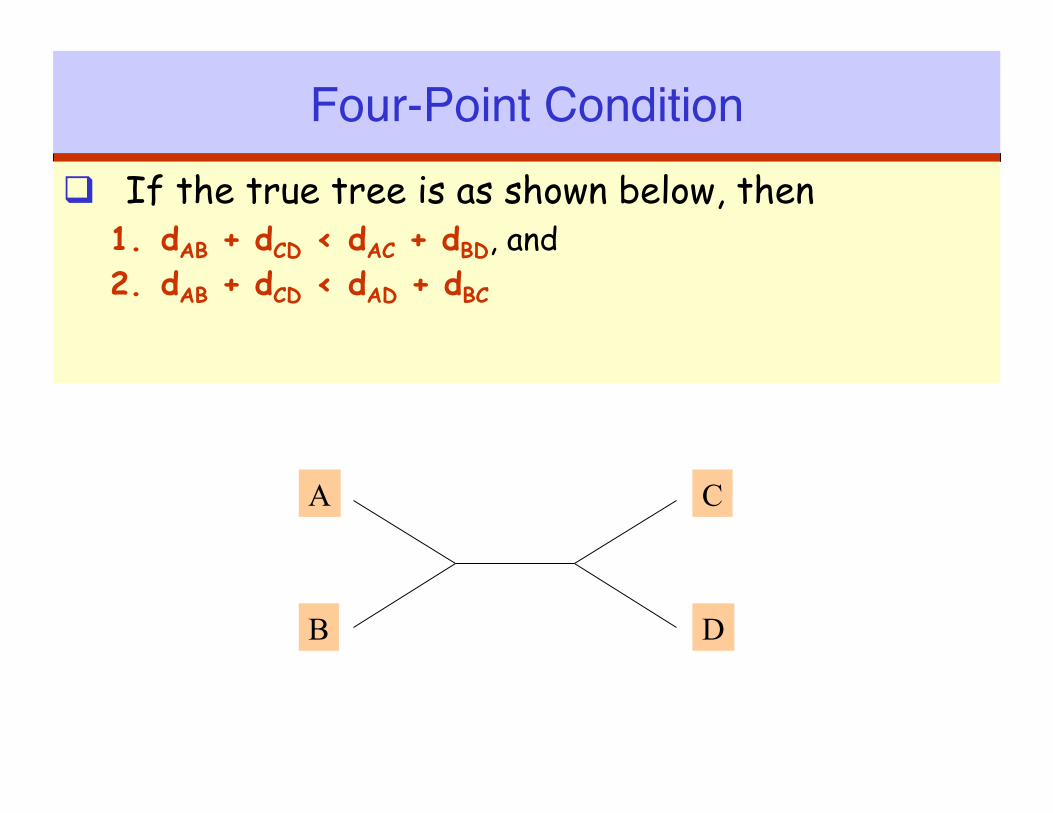
Four-Point Condition! If the true tree is as shown below, then
1. dAB + dCD < dAC + dBD, and 2. dAB + dCD < dAD + dBC
A
D
C
B
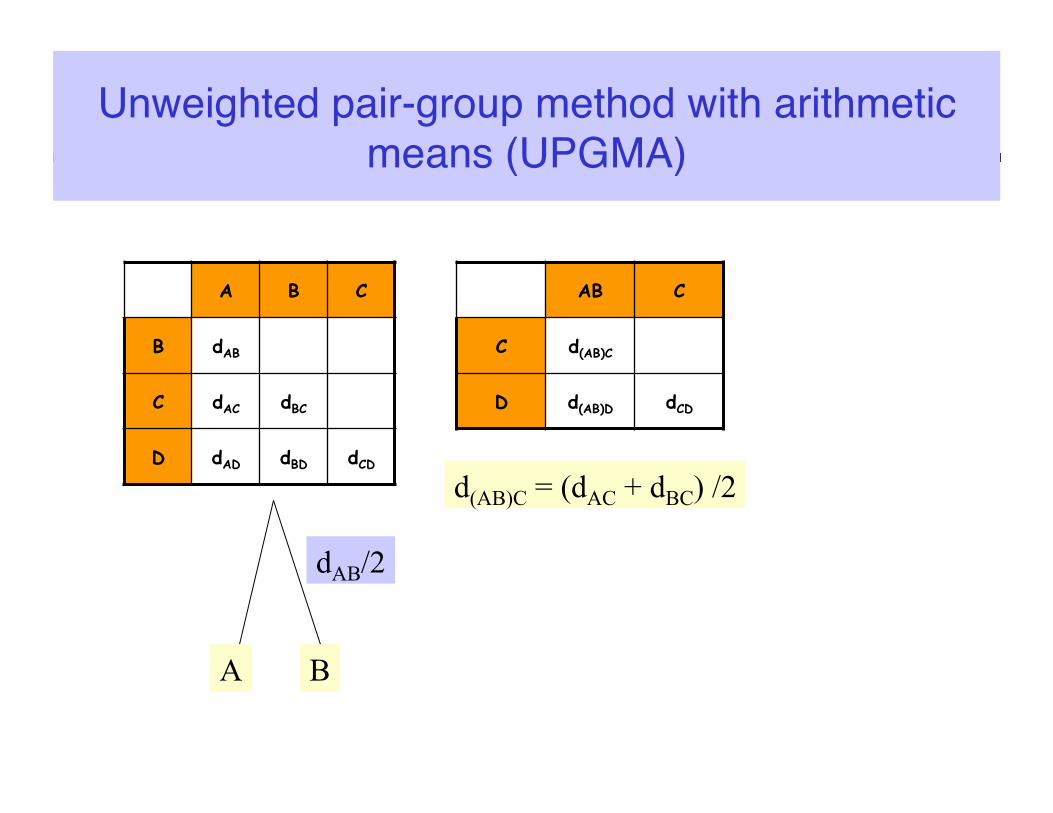
Unweighted pair-group method with arithmetic means (UPGMA)!
A B C
B dAB
C dAC dBC
D dAD dBD dCD
A B
dAB/2
AB C
C d(AB)C
D d(AB)D dCD
d(AB)C = (dAC + dBC) /2
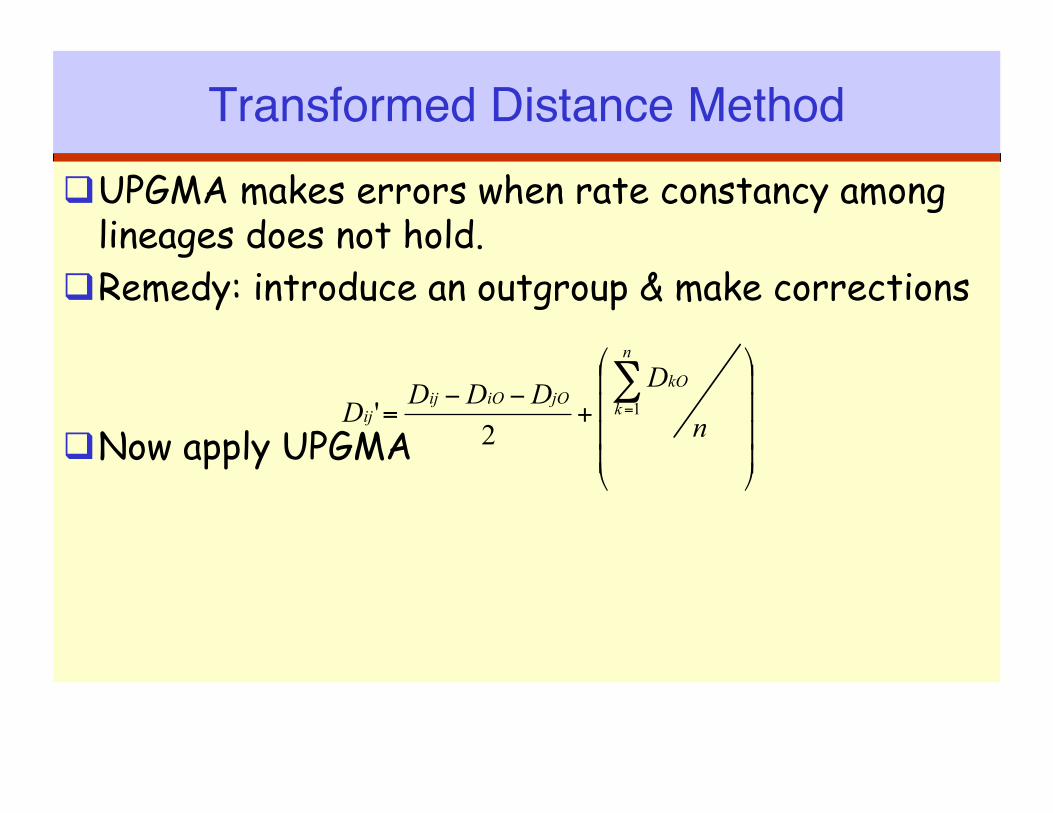
Transformed Distance Method! UPGMA makes errors when rate constancy among
lineages does not hold. Remedy: introduce an outgroup & make corrections
Now apply UPGMA ⎟⎟⎟⎟
⎠
⎞
⎜⎜⎜⎜
⎝
⎛
+−−
=∑=
n
DDDDD
n
kkO
jOiOijij 1
2'
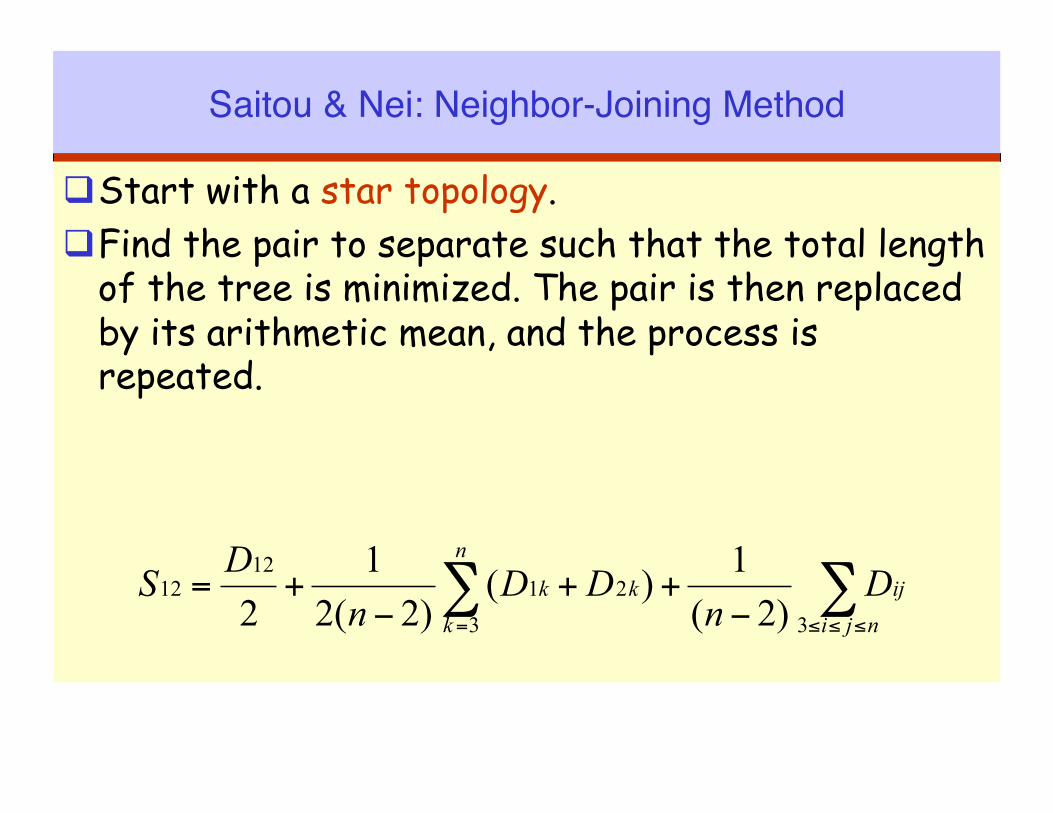
Saitou & Nei: Neighbor-Joining Method!
Start with a star topology. Find the pair to separate such that the total length
of the tree is minimized. The pair is then replaced by its arithmetic mean, and the process is repeated.
∑∑≤≤≤= −
++−
+=njiij
n
kkk D
nDD
nDS
3321
1212
)2(1)(
)2(21
2
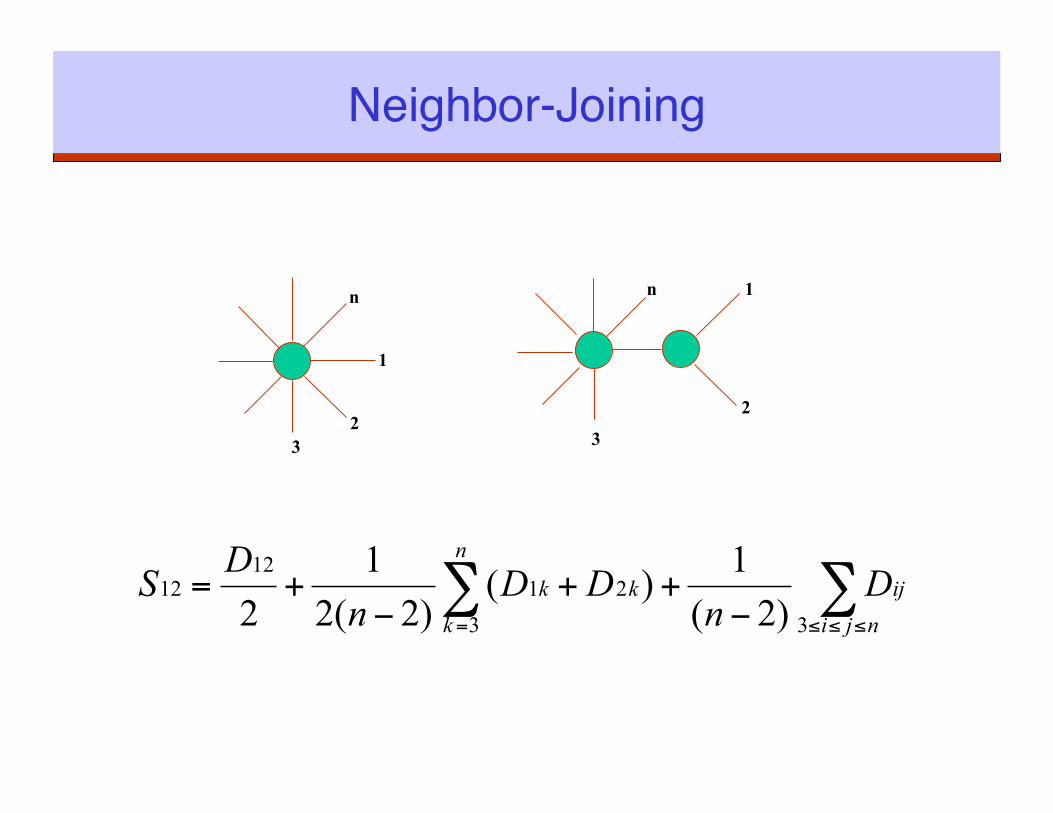
Neighbor-Joining!
1
2
n n
3 3
1
2
∑∑≤≤≤= −
++−
+=njiij
n
kkk D
nDD
nDS
3321
1212
)2(1)(
)2(21
2
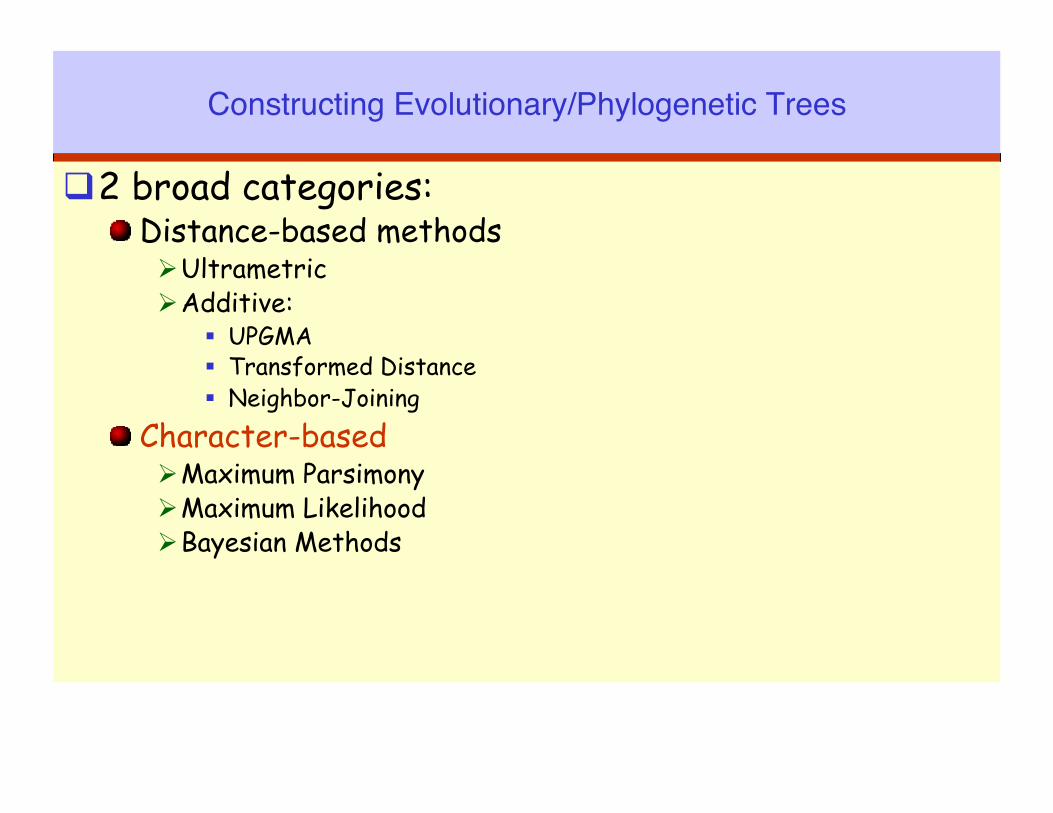
Constructing Evolutionary/Phylogenetic Trees!
2 broad categories: ! Distance-based methods
Ultrametric Additive:
UPGMA Transformed Distance Neighbor-Joining
! Character-based Maximum Parsimony Maximum Likelihood Bayesian Methods
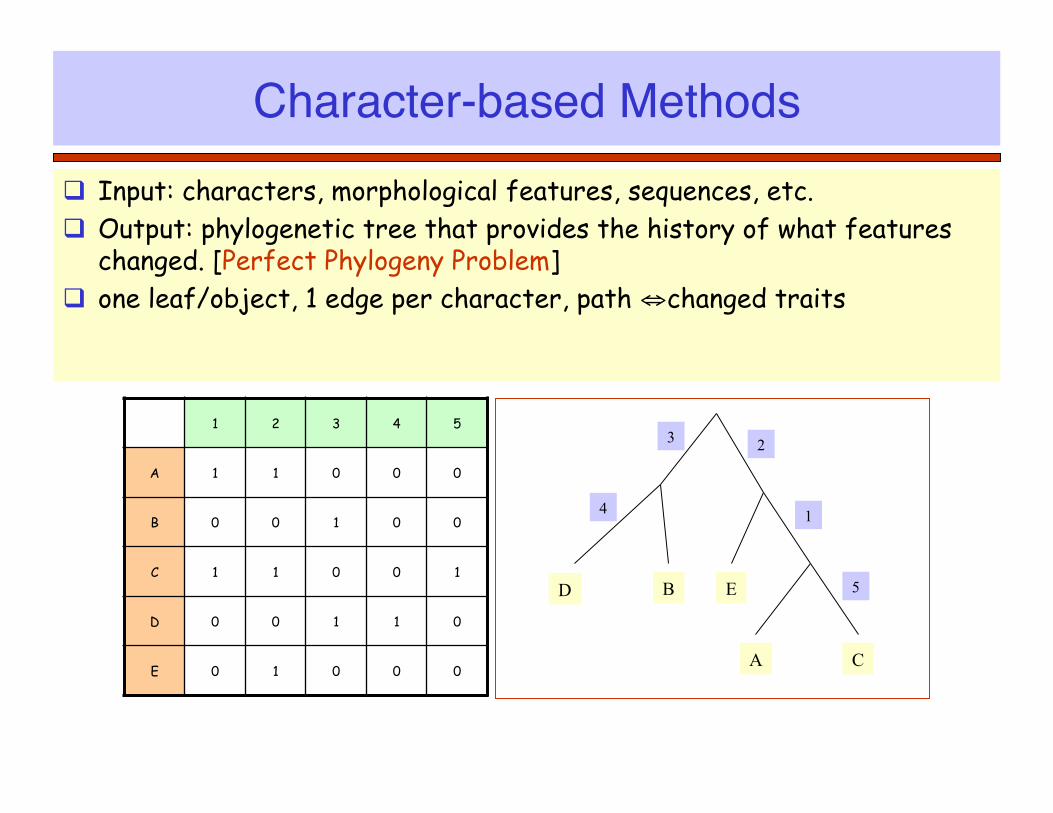
Character-based Methods! Input: characters, morphological features, sequences, etc. Output: phylogenetic tree that provides the history of what features
changed. [Perfect Phylogeny Problem] one leaf/object, 1 edge per character, path ⇔changed traits
1 2 3 4 5
A 1 1 0 0 0
B 0 0 1 0 0
C 1 1 0 0 1
D 0 0 1 1 0
E 0 1 0 0 0
3
4
2
1
5 D
A C
E B
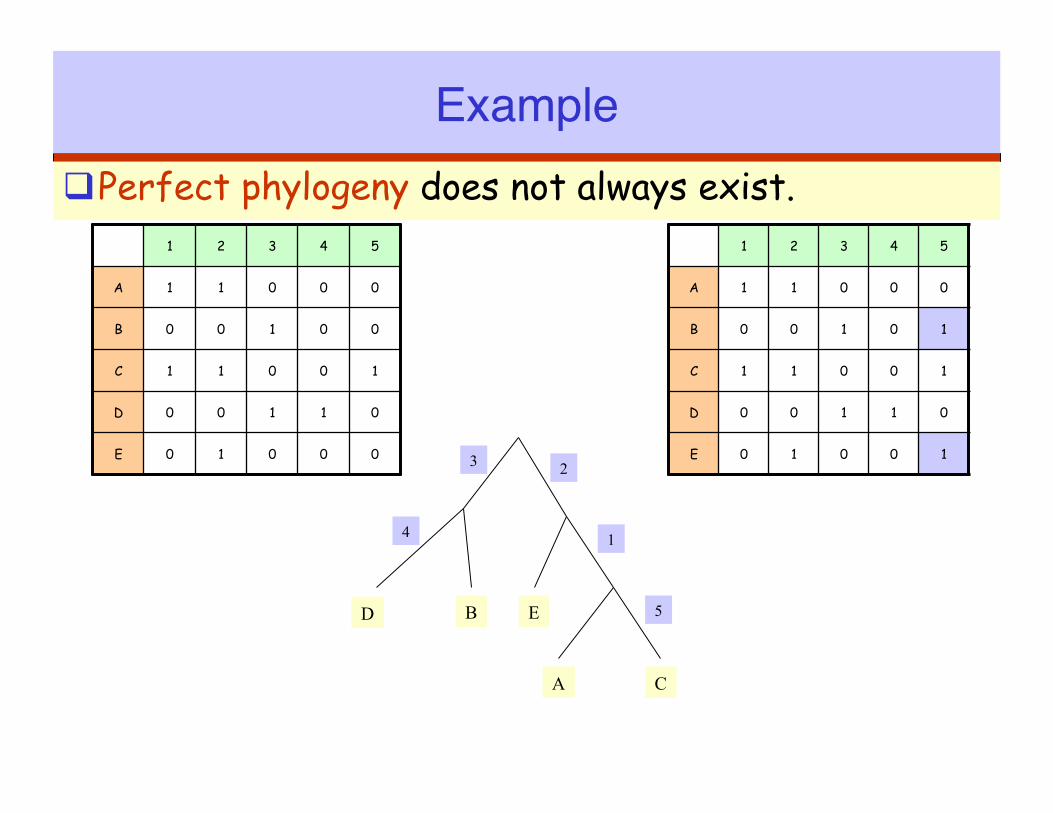
Example! Perfect phylogeny does not always exist.
1 2 3 4 5
A 1 1 0 0 0
B 0 0 1 0 1
C 1 1 0 0 1
D 0 0 1 1 0
E 0 1 0 0 1
1 2 3 4 5
A 1 1 0 0 0
B 0 0 1 0 0
C 1 1 0 0 1
D 0 0 1 1 0
E 0 1 0 0 0 3
4
2
1
5 D
A C
E B
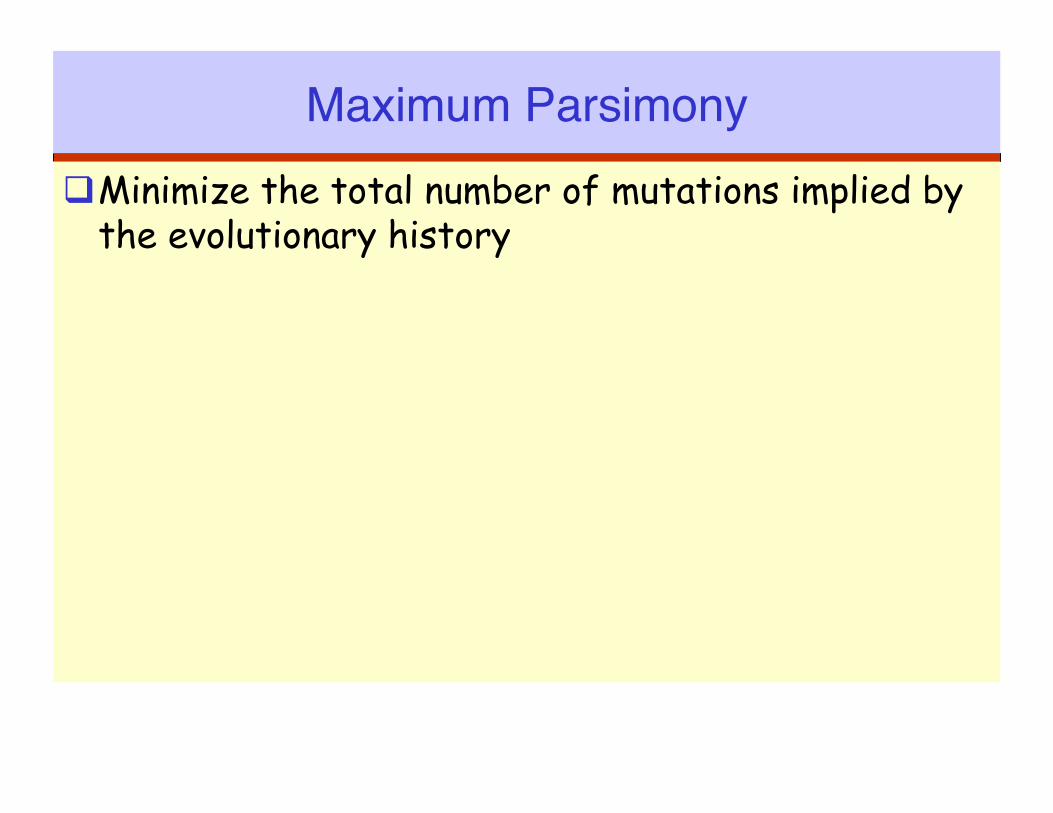
Maximum Parsimony! Minimize the total number of mutations implied by
the evolutionary history
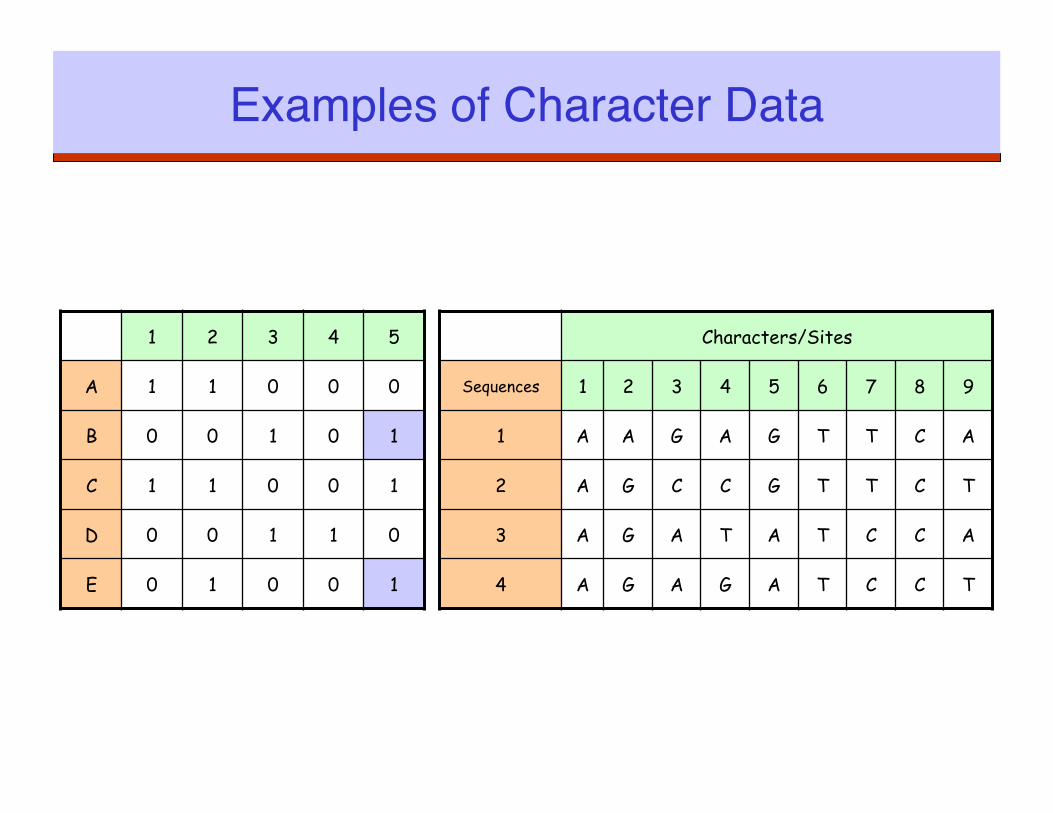
Examples of Character Data!
Characters/Sites
Sequences 1 2 3 4 5 6 7 8 9
1 A A G A G T T C A
2 A G C C G T T C T
3 A G A T A T C C A
4 A G A G A T C C T
1 2 3 4 5
A 1 1 0 0 0
B 0 0 1 0 1
C 1 1 0 0 1
D 0 0 1 1 0
E 0 1 0 0 1
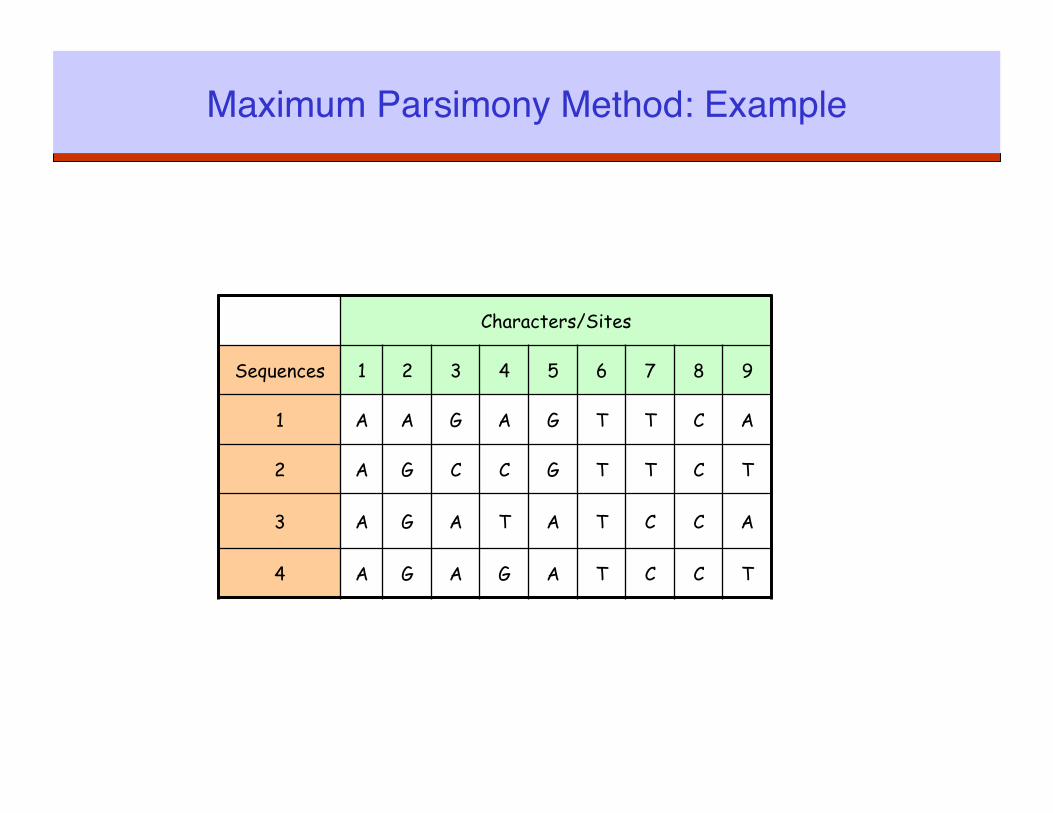
Maximum Parsimony Method: Example!
Characters/Sites
Sequences 1 2 3 4 5 6 7 8 9
1 A A G A G T T C A
2 A G C C G T T C T
3 A G A T A T C C A
4 A G A G A T C C T

Unrooted Trees on 4 Taxa!
A
D
C
B
A
D
B
C
A
B
C
D
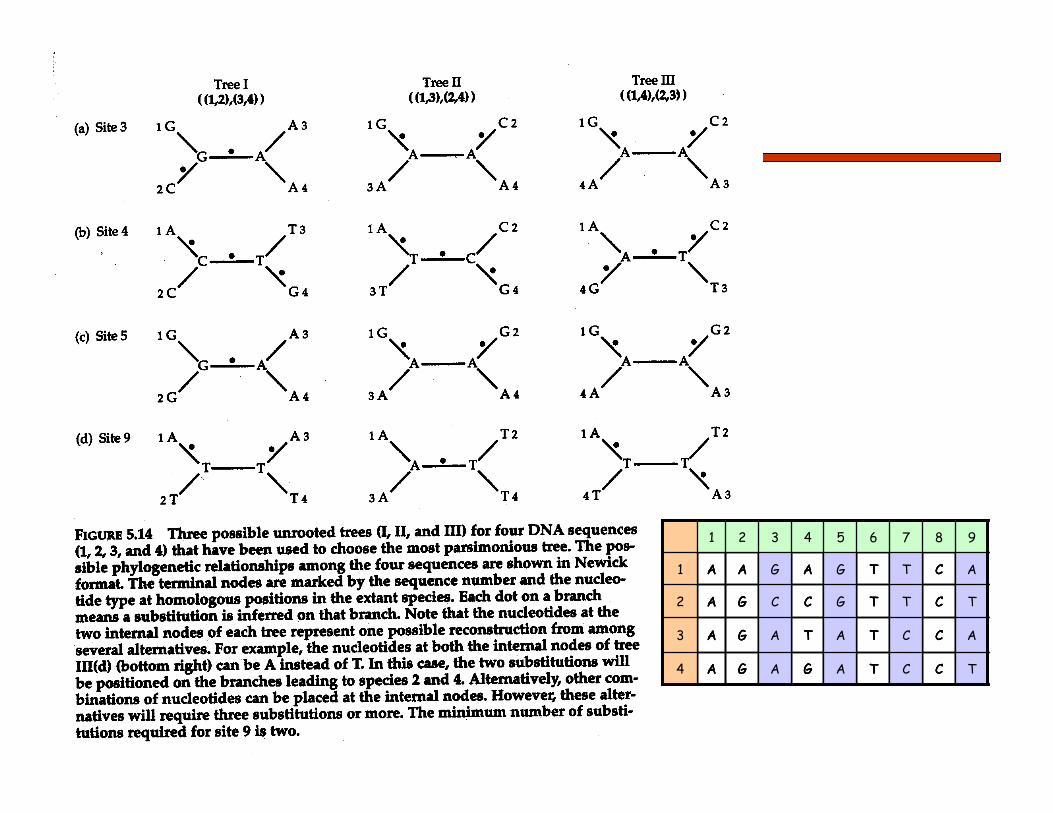
1 2 3 4 5 6 7 8 9
1 A A G A G T T C A
2 A G C C G T T C T
3 A G A T A T C C A
4 A G A G A T C C T
1 2 3 4 5 6 7 8 9
1 A A G A G T T C A
2 A G C C G T T C T
3 A G A T A T C C A
4 A G A G A T C C T
1 2 3 4 5 6 7 8 9
1 A A G A G T T C A
2 A G C C G T T C T
3 A G A T A T C C A
4 A G A G A T C C T
1 2 3 4 5 6 7 8 9
1 A A G A G T T C A
2 A G C C G T T C T
3 A G A T A T C C A
4 A G A G A T C C T
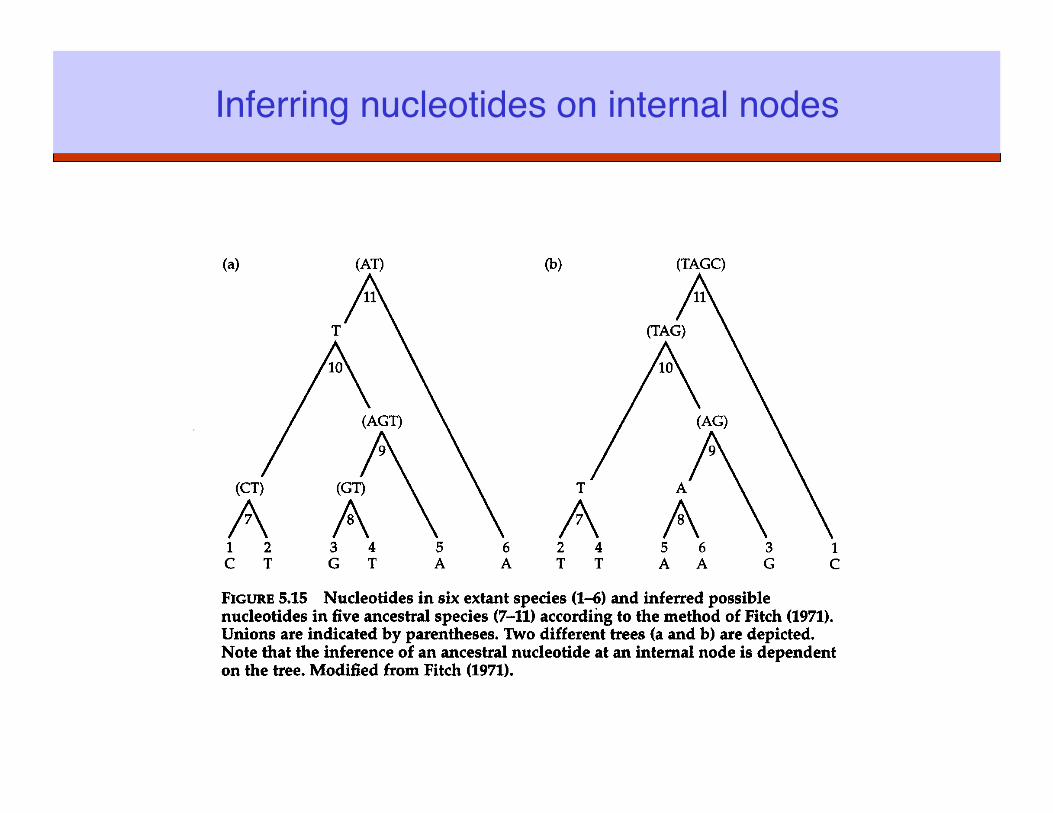
Inferring nucleotides on internal nodes!
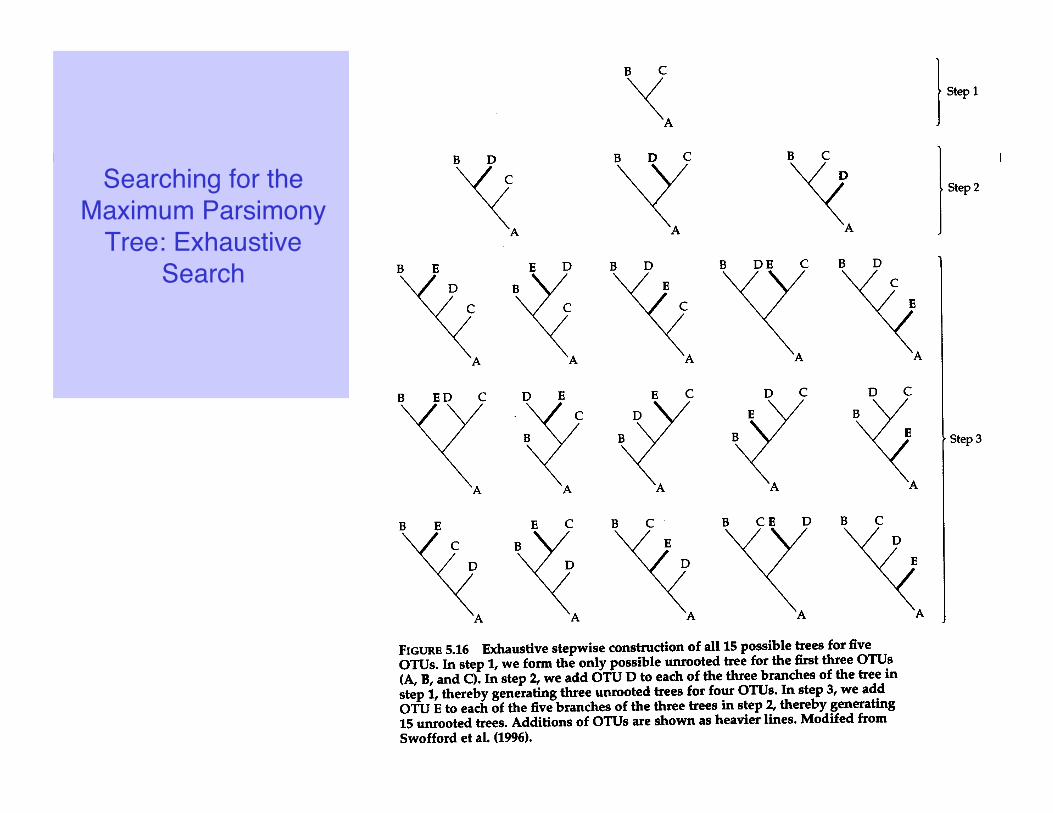
Searching for the Maximum Parsimony
Tree: Exhaustive Search!
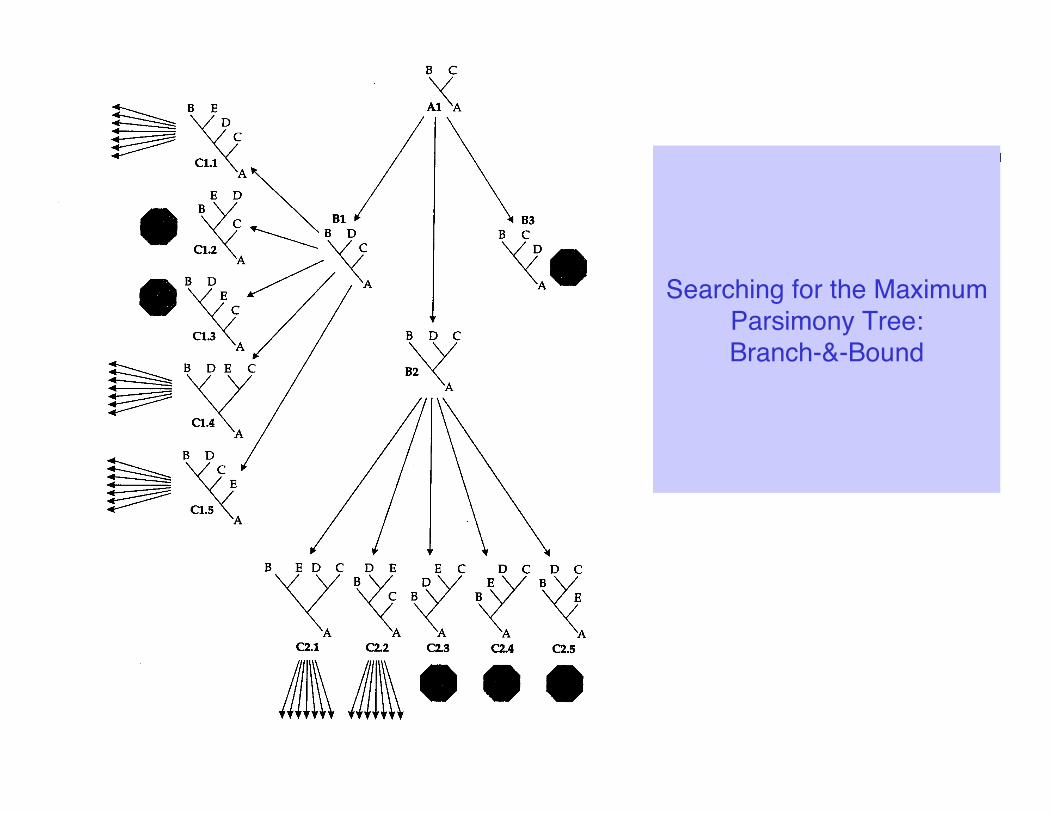
Searching for the Maximum Parsimony Tree: Branch-&-Bound!
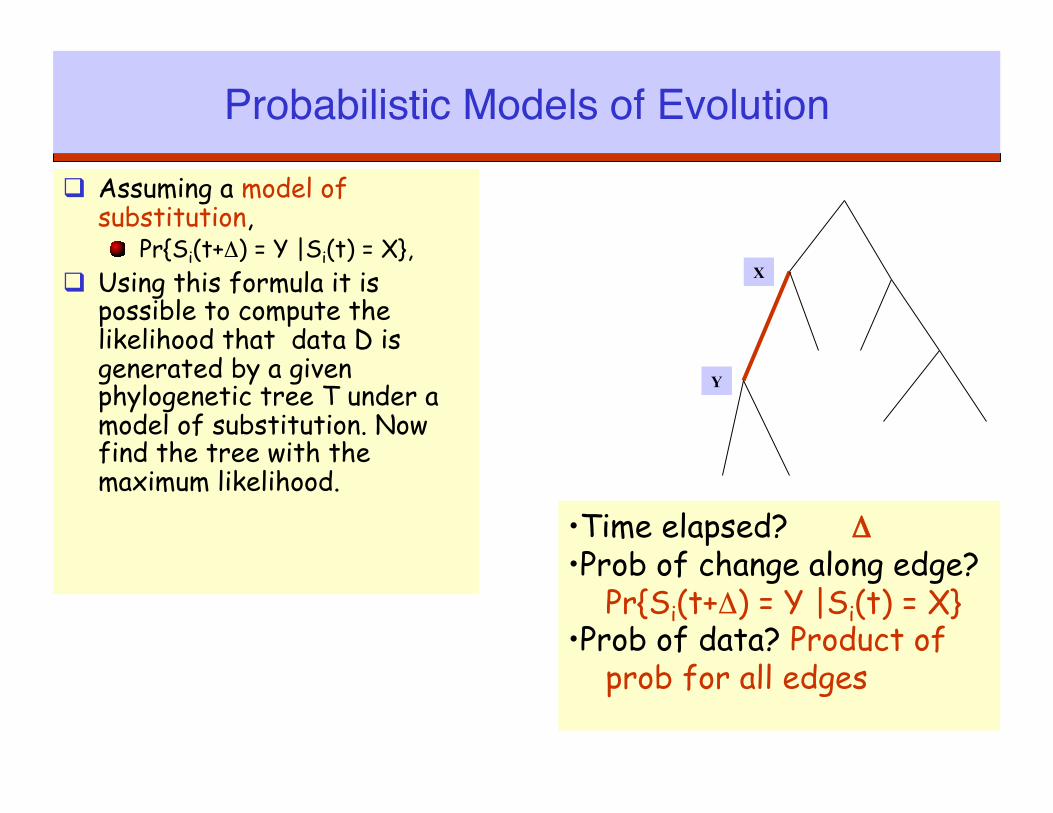
Probabilistic Models of Evolution!
Assuming a model of substitution, ! Pr{Si(t+Δ) = Y |Si(t) = X},
Using this formula it is possible to compute the likelihood that data D is generated by a given phylogenetic tree T under a model of substitution. Now find the tree with the maximum likelihood.
X
Y
• Time elapsed? Δ • Prob of change along edge? Pr{Si(t+Δ) = Y |Si(t) = X} • Prob of data? Product of prob for all edges
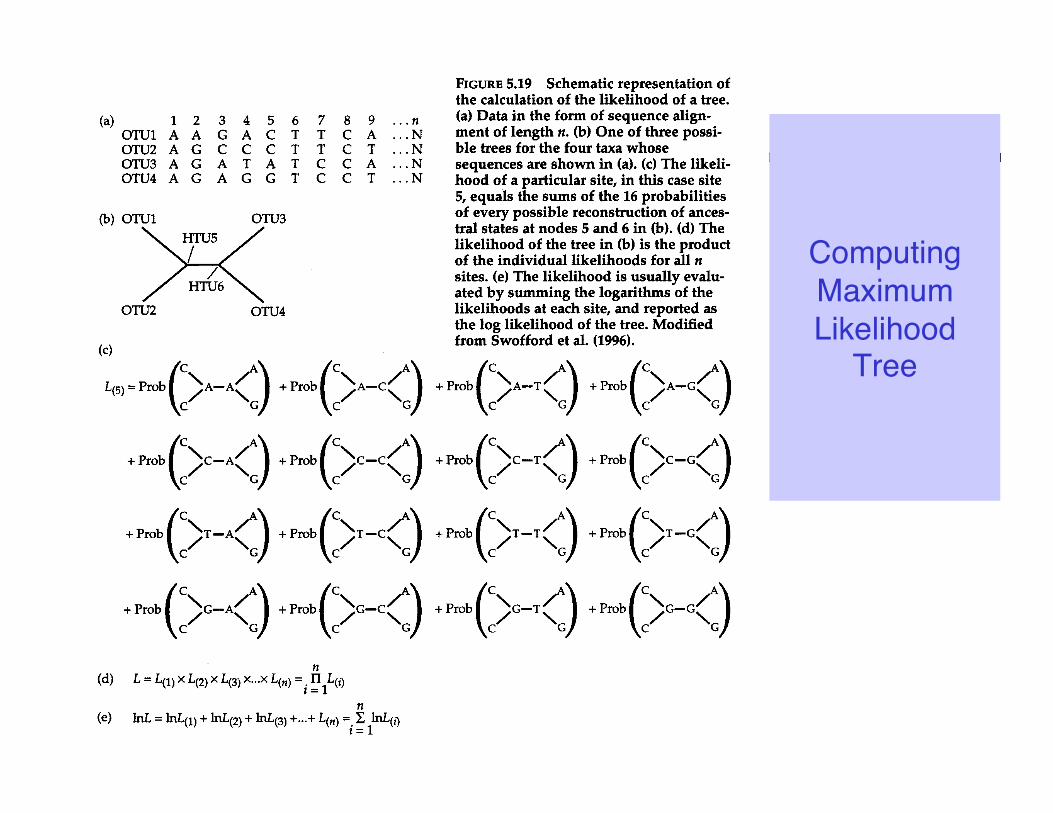
Computing Maximum Likelihood
Tree!


