45
GIS CLOUD USER GUIDE

Dc
GIS CLOUD USER GUIDE

Table of Contents
Introducing GIS Cloud ............................................................................................................................................1
Create an Account ...................................................................................................................................................1
Main Interface.........................................................................................................................................................2
Creating a New Map ...............................................................................................................................................8
Import & Export Data ...........................................................................................................................................10
Adding Layers .......................................................................................................................................................15
Creating and Editing Layers..................................................................................................................................16
Selecting Layers and Objects ................................................................................................................................21
GIS Analysis ........................................................................................................................................................28
Tools Tab..............................................................................................................................................................34
Sharing and Publishing.........................................................................................................................................39

1
Introducing GIS Cloud
What is GIS Cloud?
GIS Cloud is the first purely web based GIS powered by cloud computing that provides full desktop GIS features
enriched by the web. GIS Cloud offers easy and efficient visualization, analysis and exploration of geographic
information. The primary goals of the GIS Cloud platform is to simplify exchange of geographical information
between users and offer an easy way to analyze this information regardless of the location of its users. By using GIS
Cloud our users access the full power of desktop GIS, allowing for such activities as geospatial analysis, spatial
intelligence, the creation of customized mapping reports and publishing geographic analysis on the Web.
Create an Account
Go to giscloud.com and click on “Free Signup”, it will direct you to the page where you can create a new account.

2
Main User Interface
When you begin to use GIS Cloud you must first get acquainted with the user interface. It is a part of platform
which offers complete oversight of projects, as well as functionality for working with the geospatial data itself.
In this manual, we have placed a red number over each pictured interface; that number corresponds to the
instructions for each product feature.
1. Login and My Account – You need to log in using your User Name and Password to access Map Editor.
After that you will be able to use the application fully. After logging in, you will be able to modify your
user account.
2. Tool Ribbon – Here we offer complete access to the application's features: creating projects and maps,
adding layers as well as conducting your analysis and performing data management. The tabs above the
ribbon reveal additional tools. Tool Ribbon functions are described in the separate chapter Tool Ribbon.
3. Toolbar – Provides the tools needed for basic operations with maps. Toolbar functions are described in the
separate chapter Toolbar.
4. Project Name bar - Displays the project name as a link. You can send someone a link to the map by using
the address that the link points to, or you can refresh the map by clicking on the link.
5. Layer panel –A "table of contents" type of display for the active project.The layer panel offers the
following functionality:
6. Map Viewer – Map display of visible layers and cartographic features.
7. Layer Data Table – Table displaying all attribute records and fields of a selected dataset.
8. Info Table and Search tool - View info about selected feature and search for specific features.

3
For better viewing experience we've implemented an option to hide tool ribbon and layer panel. The red dots (on
picture below) mark positions of the sliders where you can toggle the ribbon, the layer panel and the info panel
(hidden by default) on and off.
Home Tab
The Home tab is a centralized place to access all maps you have access to - your own maps, maps someone has
shared with you, or public maps. The menu on the left (1) provides not only easy access to all of your maps, but easy
discovery of and access to new maps and data. You can browse available maps by directories, search for maps or just
go for the recently open maps. The gallery (2) provides easy access to all of the maps available to your user account,
whether the maps are created by you, shared with you or publicly visible.

4
Toolbar
The tools and their functions are:
1. Pan - Enables the user to interactively move the Map View position.
2. Zoom - Left click and drag a rectangular box on the map to define the desired view extend. Zooming can
also be achieved by a mouse scroll or by using the slider to the left.
3. Zoom to Full Map Extent
4. Select - Selects a single feature in an active layer. More about the Select tool can be found in the chapter
Selecting Layers and Objects.
5. Identify - Identifies an element on the map and shows its attribute information.
6. Area Selection - Clicking and dragging a rectangular box with the mouse creates a selected set of a
features from an active layer. More about the Select tool in the chapter "Selecting Layers and Objects".
7. Measuring Tool - Interactive display of distances on the Map View. Left clicking will allow distance
display over multiple vertices.
8. Print - Any created map can be printed.
9. Scale
10. Jump to Coordinates - Zoom to a set of coordinates – The current coordinates of
the mouse cursor are displayed. To define specific coordinates and have the view zoom to the specified
position, left click; enter coordinate information.
11. Number of Selected Objects on the Map
Tools Ribbon Overview
The Tool Ribbon provides you with clear view of all tools within their categories. Easy access to tools through the
ribbon allows you to use GIS Cloud more efficiently. The following is a brief overview of the tools on the ribbon; a
more detailed description of the tools will follow.

5
Map Tools - With a focus on the map, this is a clear way for users to reach map-related features.
Layer Tools - Provides all functionalities needed to work with layers and datasets.
Edit Tools - Tools used for editing layer settings, as well as adding or removing features from layers.
Select Tools - Select tools set allow operations to be performed on your layer, geographic area or feature of choice.
Analysis Tools - All spatial data included in a project can be analyzed using the following tools.

6
Tools - The tools menu gives access to data-related operations and access to several wizards.
Layers Panel
The Layers panel shows all of the layers of a selected project. The Layer panel also functions as a legend. The
following cartographic options are available:

7
1. Eye Icon - Toggles layer visibly on or off.
2. Slider for setting the transparency of the currently selected layer.
3. Adjust layer appearance on the map. Drag layers to set their display order.
4. Lock layer - Layers can't be edited.
5. Layer Panel Toolbar (from left to right):
Add Layer
Edit Layer
Create Folder
Delete Layer
Rename Layer
Zoom to Layer
6. Toggle Panel - Double click on the spot the arrow points to hide the Layer panel.
Info and Data Panel
On the Map Editor's main interface you can access the table overview of the selected feature's attribute data. This
information is available in two ways:
1. Info Panel - Use the Identify tool to select a feature. Attribute data is shown in the Info panel.
2. Data Panel - You can use this panel to see all the data within a layer. Select the layer and open the Data panel;
this gives you an easy access to the data and an understanding of what data in the table are visualized as objects on the
map. To do the latter you need to select a row in the table and it will be shown on the map.

8
Search Tools
Search tools enable you to search for attribute data in the tables. There is one on the right within the Info Panel (2).
You can select the layers you want to search from the layer list. There is another search tool on the ribbon as well (1).
Select the layer on the map (3) and search through it easily.
Creating a New Map
A map is created in the following way:
1. Select the Map tab.
2. Select New Map.
A map can be created from the Home tab as well by selecting Create New Map in the upper left corner. Map
settings are entered in the New Map form. Two types of settings are available - main map Information and Advanced
settings.

9
You can set following parameters:
1. Map name
2. Map Description
3. Map Copyright - Allows for text to appear in the lower right corner of the map.

10
4. Projection - Select change, select projection from the list. Alternately the projection can be defined by:
Searching for a projection by entering its EPSG number, or
Searching for a projection by using keywords
5. Map units - Select from Meter, Degree, Foot, etc.
6. Max zoom - Optional setting for scale dependency, limits the scale at which a layer is visible.
7. Background color - Define the background of the Map View.
All of this information can also be accessed and edited from the Map Properties tool.
Import & Export Data
Upload Data
You can upload various types of data such as:
1. Spatial Vector files: .shp, .mif, .mid, .tab, .kml, .gpx
2. Spatial Raster files: .tif, .tiff, .jpg, .gif
3. Image files: .jpg, .gif, .swf, .png
4. Excel 2003 and CSV: .csv and .xls
To upload your data to the Map Editor, first you have to open the File Manager by selecting the Upload Data
option in the Home tab/Map Gallery or clicking on the File Manager icon in the Tools tab.
In the File Manager select a directory to which you would like to upload your data and select the button.

11
Then, select browse to select files from your computer, click open and wait for the upload to finish.
Drag & Drop
Another way to upload your data, from your file system to the GIS Cloud, is to simply drag your spatial data from
your folders to the application running in your browser. With this option you can upload the same various types of
data as introduced before.

12
To be able to do that, first you have to log in with your account to the Map Editor application. If you drag and drop
your files to the map gallery (Home Tab), then you'll create a new map named after your data you've dropped.
However, if you drag and drop your files to the layers panel of an existing map you're currently viewing, then
you'll add additional layers (data) to that map (no new map will be created).
Make sure that you drag and drop all the files that are part of your data (for example, if you want to drop shapefiles
then you have to drag and drop all the files that are part of a particular shapefile).

13
Import CSV or XLS
If you have data geocoded with location coordinates you can upload it as an Excel table or CSV. This data can
then be visualized as a layer. See the sample data table below.
To perform data import, go to the Layer Tab and select the Import function.
Browse for the data table on your computer and upload it to GIS Cloud. Set the table parameters and select the
coordinate fields. When everything is set browse the output file for which the dataset needs to be created in PostGIS
database. The action is set by default for now. Now select Import and your data is ready to use.

14

15
Adding Layers
To add layers, first you have to open the Source Browser by selecting Add Layer option that can be found in the
Map tab and in the Layer tab or by selecting Add Layer button in the Layers panel.
Layers can be added from several sources: local computer/File System, PostGIS database, Web Map Service, Tile
Map Service (Open Street Maps, Google maps etc.), GIS Cloud Maps, Mobile Devices, through Arcmap extension
and/or via Mapbox.
Select source and the desired layers you wish to add and press Select to add layers.

16
Creating and Editing Layers
In addition to uploading data layers, you can also create layers yourself by following the steps listed below:
1. Select the Layer Tab.
2. Select Create.
Choose or enter the data (attributes) that the layer will have:
1. Table name - Enter the name of your new GIS data layer.
2. Geometry type - Select point, line or polygon as your feature type.
3. Projection - Select a new projection or select an existing one being used in the active map.
4. Overwrite if exists - You have the option to overwrite an existing data layer if it bears the same name as your
new data layer.
5. Copy Structure Form - You may define the structure of your data layers table by copying the attribute table
from another existing layer. This operation does not define point, line or polygon geometry.
6. Attributes - Enter the desired field names for your new data layer and define the field type:
String - Input any text
Real - Input numbers containing a decimal point
Integer - Input whole numbers
Point Layer
Add new point features to the layer by following these steps:

17
1. Selected the newly created dataset on the Layer Panel and select Add feature from ribbon on Edit Tab.
2. Add a point to the map; the layer is now displayed on the map.
3. Enter the attributes in the feature table form.
4. Choose save; the layer can be now modified by using edit tools.
A layer can be edited by following these steps:
1. Select a point layer on the Layer Panel.
2. Select the Edit feature from the ribbon (on the Edit Tab).
3. Select the layer displayed on the map.
4. Move point to the desired location.
5. Choose Save.
Polygon Layer
Polygon layers are created by choosing a created polygon d a t a s e t and then clicking Add Feature.

18
On the Layer panel select the created polygon and draw it the following way:
1. Select Add feature from toolbar.
2. Draw the polygon geometry with mouse clicks and line drags.
3. When you've vectorized a polygon press enter on your keyboard.
In the end you enter attributes and select Save. The polygon has been created.

19
GIS Cloud allows you to edit all feature types. Polygons are edited in the following way:
1. Initiate the edit mode by clicking on the Edit feature tool. Click on the feature you want to edit.
2. Vertices will appear; drag vertices as desired.
3. Select Save when finished (or Cancel if you don't wish to change the geometry).
Pseudo nodes appear between the polygon's vertices to allow greater freedom when changing polygon shapes.

20
Line Layer
Line layers are created by choosing a created line dataset and then clicking Add Feature. On the layer panel select
the created line and draw it in the following way:
1. Select Add feature from toolbar.
2. Draw line geometry with mouse clicks and line drags.
3. When you’ve vectorized a line press enter on your keyboard.
In the end you enter attributes and select Save. The line has been created. Lines are edited in the following way:
1. Initiate the edit mode by clicking on the Edit feature tool. Click on the feature you want to edit.

21
2. Vertices will appear; drag vertices as desired.
3. Select Save when finished (or Cancel if you don’t wish to change the geometry).
Selecting Layers and Objects
Any feature can be selected. Selected sets allow operations to be performed on your layer, geographic area or
feature of choice.
Select Layer and Identify Tool
An entire layer or a subset of features in a layer may be selected in the Map View. Enabling the select tool on the
Map View toolbar allows you to create selected sets:

22
1. The feature table for the selected set can be viewed in the Layer data table at the bottom of the map view. It
can be opened in the right corner of the bar.
2. The selected feature is highlighted
Using the Identify tool on the Map View toolbar enables you to see the attribute data of the selected layer. When
the tool is used the Info panel appears on the right side. The Info panel can be closed by double clicking on the spot
marked with 3 dots (shown by the arrow). You can toggle the Info panel as necessary. You can also search through
attribute data with the search tool.

23
Multiselect Methods
Multiple features may be selected at once. There are two methods for multiselection. The first method is the Select
Tool.
1. Click the select tool on the Map View toolbar.
2. Hold the CTRL button to select multiple features in a layer.
The second method is the Area Selection tool.
1. Select the layer in the layers panel on which you wish to do a multiselection.
2. Click the Area Select tool on the Map View toolbar.
3. Drag a box to define the area of selected features.
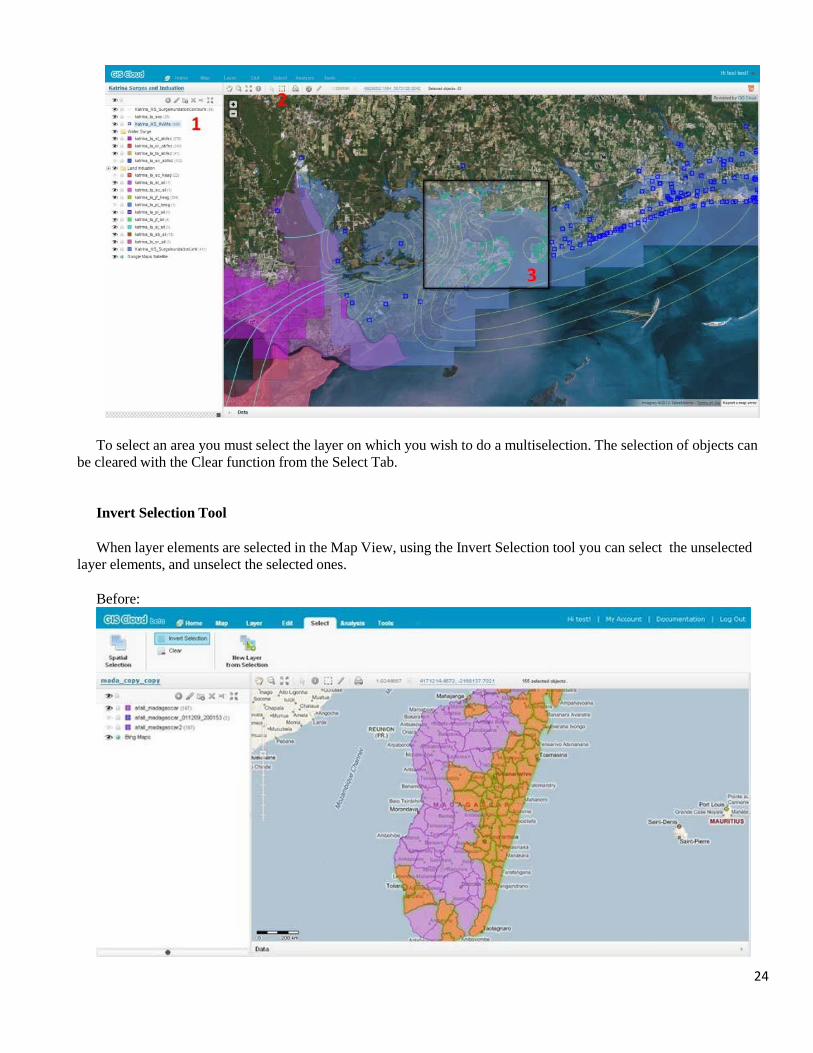
24
To select an area you must select the layer on which you wish to do a multiselection. The selection of objects can
be cleared with the Clear function from the Select Tab.
Invert Selection Tool
When layer elements are selected in the Map View, using the Invert Selection tool you can select the unselected
layer elements, and unselect the selected ones.
Before:

25
After:
Creating a New Layer from Selection
New layers may be created from selected sets:
1. Enable the Area Select tool on the Map View toolbar (or use CTRL + Select Tool)
2. Drag a box to define the area of selected features
3. On the ribbon, choose New layer selection
You have created a new layer. For more about layer editing see the Layer Editing section.
26
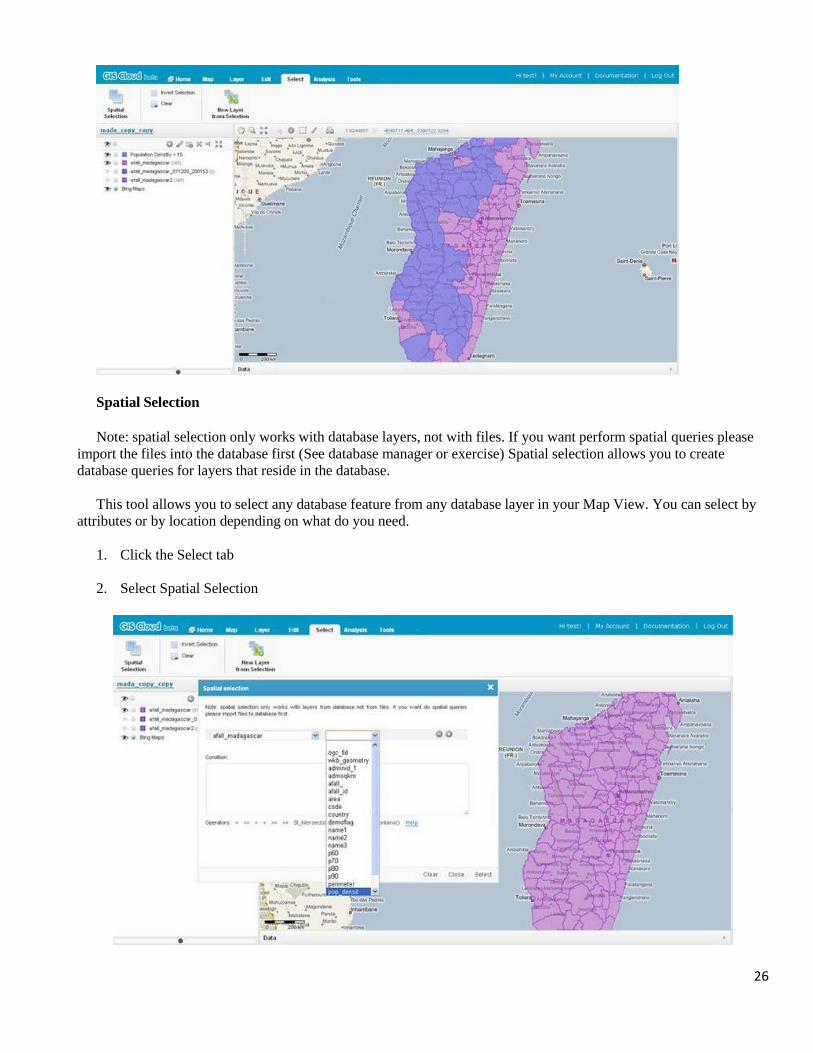
Spatial Selection
Note: spatial selection only works with database layers, not with files. If you want perform spatial queries please
import the files into the database first (See database manager or exercise) Spatial selection allows you to create
database queries for layers that reside in the database.
This tool allows you to select any database feature from any database layer in your Map View. You can select by
attributes or by location depending on what do you need.
1. Click the Select tab
2. Select Spatial Selection

27
Basic spatial selection is performed in the following way (use the pictures above and below for reference):
From the first dropdown (layers), select a layer. Now from the second one (columns) select the attribute you wish to
query. You can query with multiple layers/attributes by adding them with button.
In the Condition field enter the conditions for spatial selection. You can choose from the operators offered at the
bottom, or type them in yourself (the Help link leads to the list of PostGIS operators). To perform the selection click
Select.

28
GIS Analysis
All spatial data included in a project can be analyzed using the following tools:
1. Area analysis
2. Buffer analysis
3. Two Layer Comparison analysis
4. Hotspot analysis
5. Radius Coverage analysis
To access analysis tools go to the Analysis tab. You can perform Analysis only with layers added from a PostGIS data
source.
Area Analysis
Area analysis calculates the surface area of a selected object. To perform Area analysis, first use the Select tool to
select the objects. After selecting the features you're interested in, you need to define the units of measure. Select
Calculate for Selection to see the result.

29
Buffer Analysis
Buffer analysis creates a zone around a point, line or polygon. You can identify whether there are objects of interest
inside the zone or outside the zone and make conclusions based on this analysis. After selecting Buffer analysis
from the menu you need to set following options:
1. Analysis name
2. The layer to perform the analysis on
3. Define the buffer distance and the unit of measure
4. Choose whether you want to group (merge) the buffers
5. Define the symbology of the buffer polygon
See images below for a grouped geometry buffer on a point layer.

30
Two Layer Comparisons
Two Layer Comparison outputs an area calculation for the intersecting portions of two polygons:

31
1. Select the layers to compare
2. Select the attributes to be compared
3. Click Analysis
4. The analysis returns the area values of the two intersected areas.(4) Results can be exported as an .CSV file

32
Hotspot analysis
Hotspot analysis visualizes the density of points in a layer.
To perform the analysis you need to set following options:
1. The layer you wish to perform analysis with (point layers only)
2. The minimum distance between points taken into consideration to calculate density
Select Show hotspots to see the results.
Radius Coverage
Radius coverage allows you to select features within a specified distance from a defined point.

33
Radius coverage is performed in following way:
1. Select the Add feature tool from the form
2. Establish the center point of your analysis
3. Define the radius
4. Select Create Radius Layer

34
Tools Tab
The tools tab gives access to the following operations in the ribbon:
1. Work with files
2. Work with the database
3. Set spatial projection options
4. Merge two shapefiles into one
5. Geocode your data
File Manager
This tool is used to upload as well as arrange your files. More about working with the File
Manager can be found in the Import and Export Data section.

35
The file manager offers the following functionalities:
1. Address bar
2. File overview
3. Tools
Refresh current folder.
Select all folder elements.
Create new folder.
Duplicate selected elements.
Copy files or folders.
Move files or folders.
Rename files or folders.
Delete files or folders.
4. Upload files from local computer
5. Search files
Database Manager
To perform editing or data analysis, the layers you're working with must reside in the PostGIS
database. The Database Manager allows you to import layers into the database.
1. PostGIS connection - Enables PostGIS connections. For cases where the connection is not established
choose Connect.

36
2. Database overview - A detailed list of all the current databases.
3. Import - Tool for adding layers into a database.
4. Tools
5. Enable refreshing tables.
6. Select all database elements.
7. Unselect all database elements.
8. Rename table.
9. Export PostGIS layer as ESRI Shapefile, MapInfo file, KML and CSV file. See more in the Layer
Exporting section.
10. Duplicate database elements.
11. Truncate selected tables.
12. Delete selected tables.
13. Filter - Enables database search.
14. To import your data to PostGIS database you don't need to create a new database unless you have your own
PostGIS database you wish to connect to the GIS Cloud. In that case you can create a connection to your
database by clicking on New option. When creating or editing a connection you must set the connection
options. GIS Cloud can connect to a local or a remote database:
15. Connection name
16. Server - You need to enter the adress of the database you want to establish a connection with (for local
database set this to "localhost" or your IP adress).
17. Port - The default server port for PostGIS databases is 5432 but you can enter your own if you're using a
nonstandard port
18. Database name
19. Username
20. Password
21. SSL (Secure Socket Layer) - Set the desired level of connection security from the dropdown menu.
22. Scheme - By enabling this you choose to see only public schema tables.
23. Whether you've connected to a new database or you left the default database "GIS Cloud local" you can
simply import data by clicking on import button (more information in the tutorial - link below).

37
Projection Wizard
This tool enables you to add a projection or change an existing projection.
1. Browse to a source data layer, If the layer's projection has been detected, it will appear in the form.
2. If the projection has not been detected, you can specify it here.
3. Select projection (SRS - Spatial Reference System Identifiers) and click Select to add it.
4. Choose Assign an output SRS to correct the current projection. If you wish to transform the layer from an
existing projection to the newly selected one, choose Reproject/Transform to SRS on output.

38
Merge Wizard
The Merge Wizard enables you to merge several files into one. The only file formats currently supported for this
operation are ESRI Shapefiles and GeoTiff files. More file types will be added in the future. Browse to select the files
you wish to merge. Once you have added the desired files you will see them appear in the list. Before merging, you
need to select a name for the new file; this is the file into which the selected files are going to be merged. Select the
location of the new file by clicking Browse and using the File Manager.
Geocoder
With the Geocoder you can easily convert non-spatial location data into its matching spatial representation.
Geocoding allows users to translate an address into coordinates and vice versa.
For geocoding you will need an excel table or a csv table containing data you want to geocode and the address model
data that will be the basis for geocoding.

39
In the Search tab you can search through your address model data and position yourself to any searched address by
clicking on Show on the active map button.
In the Results tab you can see an overview of a geocoding process. Here you can find which addresses were geocoded
right and which weren’t. If you click on the Get error report button you will get a detailed report of all the addresses
that weren’t geocoded properly.
Sharing and Publishing
GIS Cloud has several options for sharing and publishing data. To share or publish data, first select the Map tab and
then click Share or Publish from the ribbon. These related sections follow:
• Map Sharing with other GIS Cloud users
• Setting Layer Permissions

40
• Embedding Maps into a Web Page
• Web Map Service (WMS)
Map Sharing
Collaborate from the Share panel:
1. Public- These maps are visible to everyone, whether they're registered or non- registered:
Click Publish to Public
The maps is now visible on the Home tab and is available to all GIS Cloud users, even prior to
logging into the GIS Cloud interface
2. Share with other GIS Cloud users - Collaborate with other GIS Cloud users
Provide the user name of another GIS Cloud user and the map you have published will appear in
that user's project panel
3. Permissions
Selecting edit in the box labeled Owner will allow the person you have shared your map with
complete editing privileges

41
Selecting view in the box labeled Owner will allow the person you have shared your map with only
viewing privileges
4. Permalink - The URL appearing in the permalink field allows you to share a direct link to your project from
any browser. The opens identical to yours with your current settings enabled. The target user must be logged
into GIS Cloud to access the link.
Set Layer Permissions
All layers are exportable by default. When you share your map with another GIS Cloud user you might not want to
allow that user to export your data as a Shapefile and to be able to download it. You have to change that layer's
permission setting to Not exportable. All you need to do is click on the link.

42
Embedding Maps into a Web Page
Choosing the embed tab on the Share and Publish panel allows you to easily extract code for the embedding of your
map in a 3rd party website. The following settings are available:
1. Define your preferred scripting platform:
GIS Cloud (Javascript)
Google Maps (Javascript)
2. Width X Height - Define the dimensions of the object
3. Choose your content display method
4. Options - Opt to include a toolbar, a Layer List (Legend) and/or Info Popups
5. Popup Preview – Examine a complete preview of your map prior to embedding
6. Code - Copy code into the part of the page where you want to show the map

43
There are some differences in the forms for each of the scripting platforms but in general the settings are the same. If
you experience any problems or issues with the maps, use Clear Tile Maps and then try again.


