49
GIS Data Models
GIS Data Models
GIS Data Models
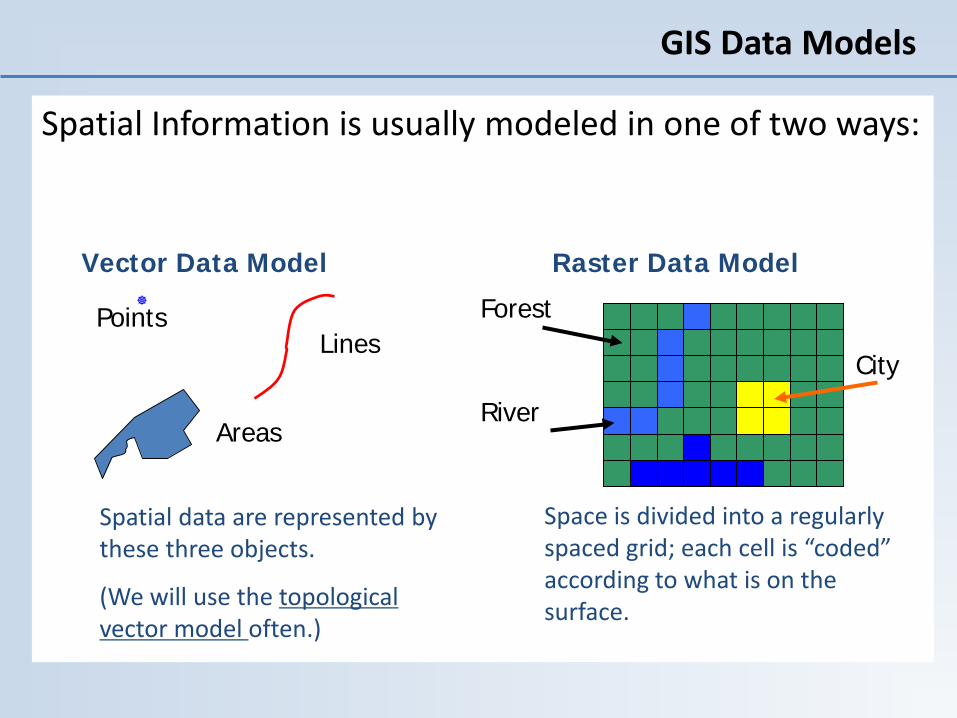
Spatial Information is usually modeled in one of two ways:
Vector Data Model
PointsLines
Areas
Spatial data are represented by these three objects.
(We will use the topological vector model often.)
Space is divided into a regularly spaced grid; each cell is “coded” according to what is on the surface.
Raster Data ModelForest
RiverCity
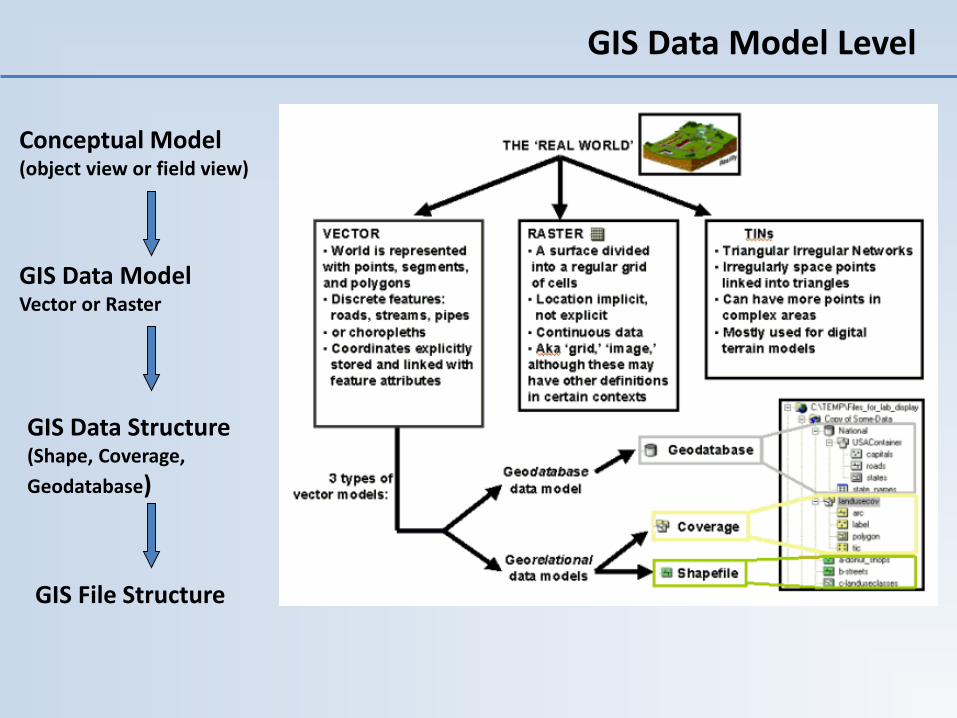
GIS Data Model Level
Conceptual Model (object view or field view)
GIS Data ModelVector or Raster
GIS Data Structure(Shape, Coverage, Geodatabase)
GIS File Structure

• The strategy chosen depends on whether one takes the field-view versus object-view of reality…
• Field-view: geographic phenomena that vary continuouslythroughout space. Examples: elevation, precipitation, etc.
• Object-view: an empty space ‘littered’ with discrete objects. Examples: roads, buildings, utilities, etc.
GIS Data Conceptual Model

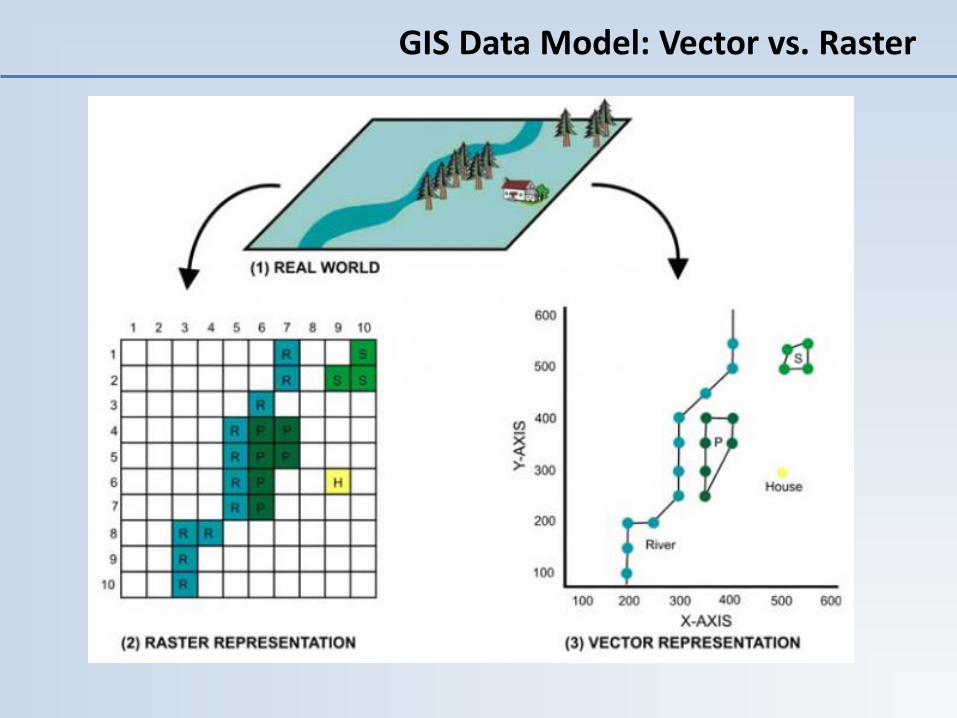
GIS Data Model: Vector vs. Raster
Raster model • Data is represented as a surface modeled by a matrix of values (pixels) • Useful for “continuous” data (iedata that varies continuously) such as satellite imagery, aerial photographs, surface functions such as elevation, pollution, population
Vector model• Data is represented using points, lines and polygons • Useful for data that has discrete boundaries, such as streets, maps, rivers
GIS Data Model: Vector vs. Raster
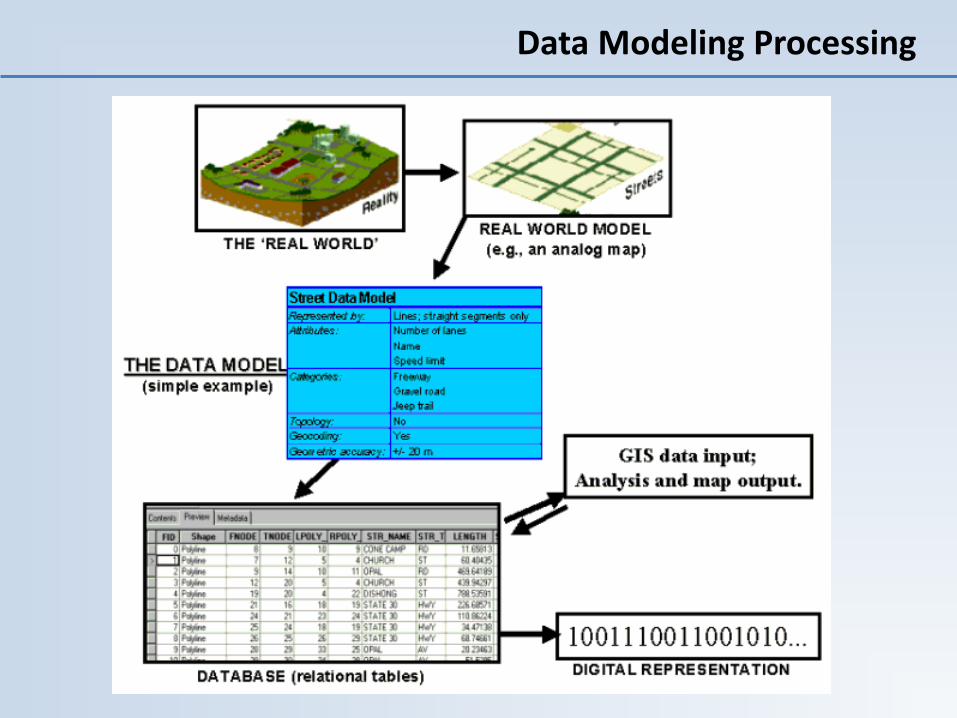
Data Modeling Processing
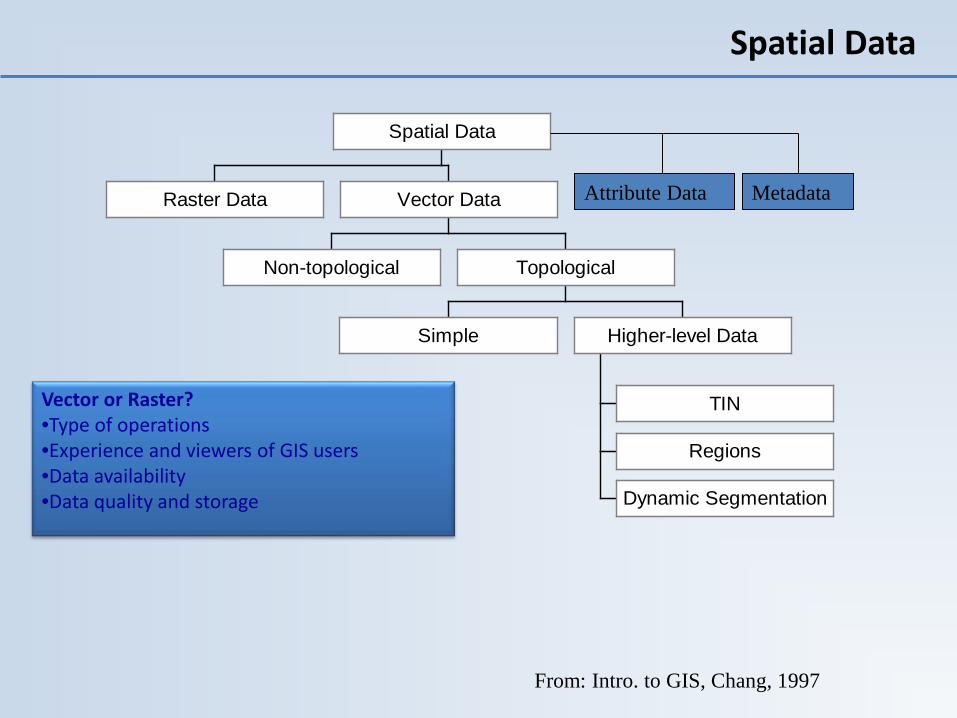
Spatial Data
Raster Data
Non-topological
Simple
TIN
Regions
Dynamic Segmentation
Higher-level Data
Topological
Vector Data
Spatial Data
From: Intro. to GIS, Chang, 1997
Attribute Data Metadata
Vector or Raster?•Type of operations•Experience and viewers of GIS users•Data availability•Data quality and storage
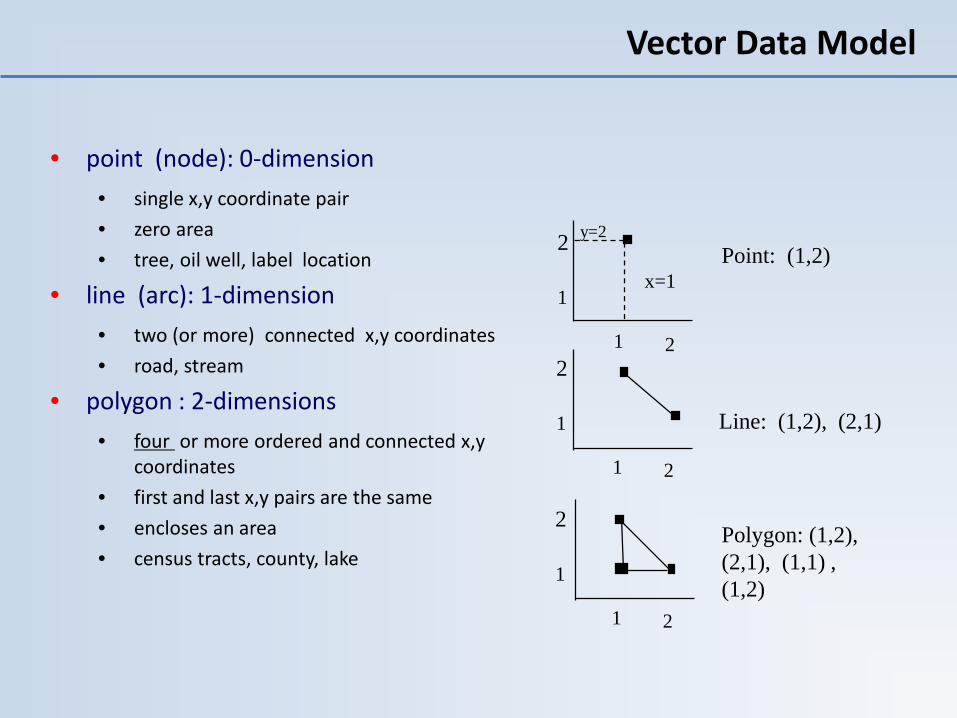
Vector Data Model
• point (node): 0-dimension• single x,y coordinate pair• zero area• tree, oil well, label location
• line (arc): 1-dimension• two (or more) connected x,y coordinates• road, stream
• polygon : 2-dimensions• four or more ordered and connected x,y
coordinates • first and last x,y pairs are the same• encloses an area• census tracts, county, lake
1
2
1 2
x=1Point: (1,2)
y=2
Line: (1,2), (2,1)1
2
1 2
1
2
1 2
Polygon: (1,2), (2,1), (1,1) , (1,2)

Two Common Vector Models
• Spaghetti model (non-topological)
• Topological model
B
A
D
C
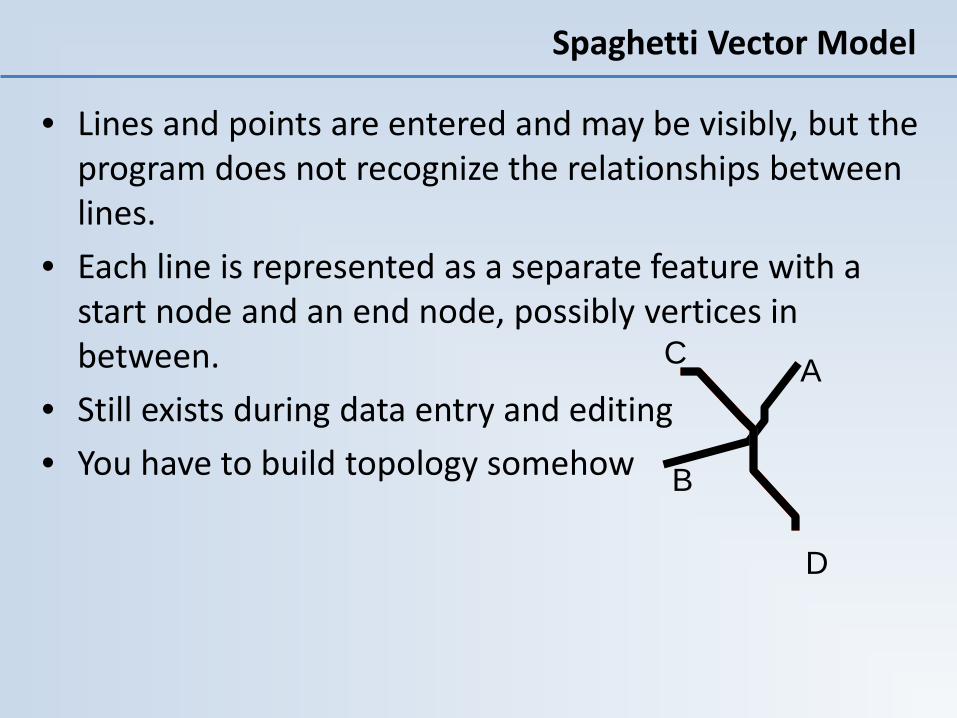
Spaghetti Vector Model
• Lines and points are entered and may be visibly, but the program does not recognize the relationships between lines.
• Each line is represented as a separate feature with a start node and an end node, possibly vertices in between.
• Still exists during data entry and editing• You have to build topology somehow B
A
D
C
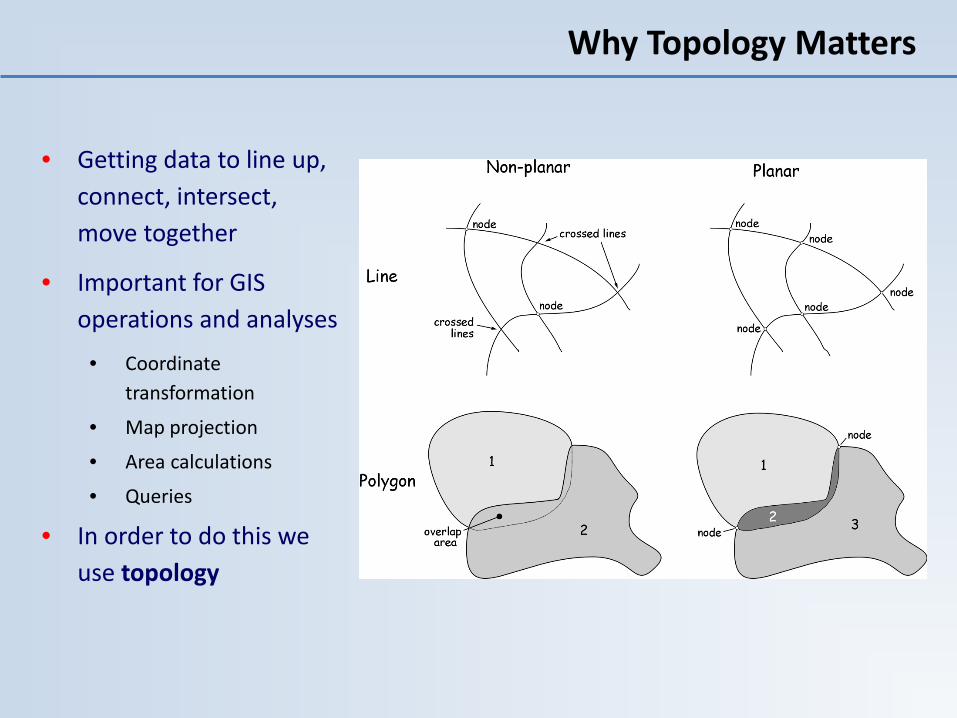
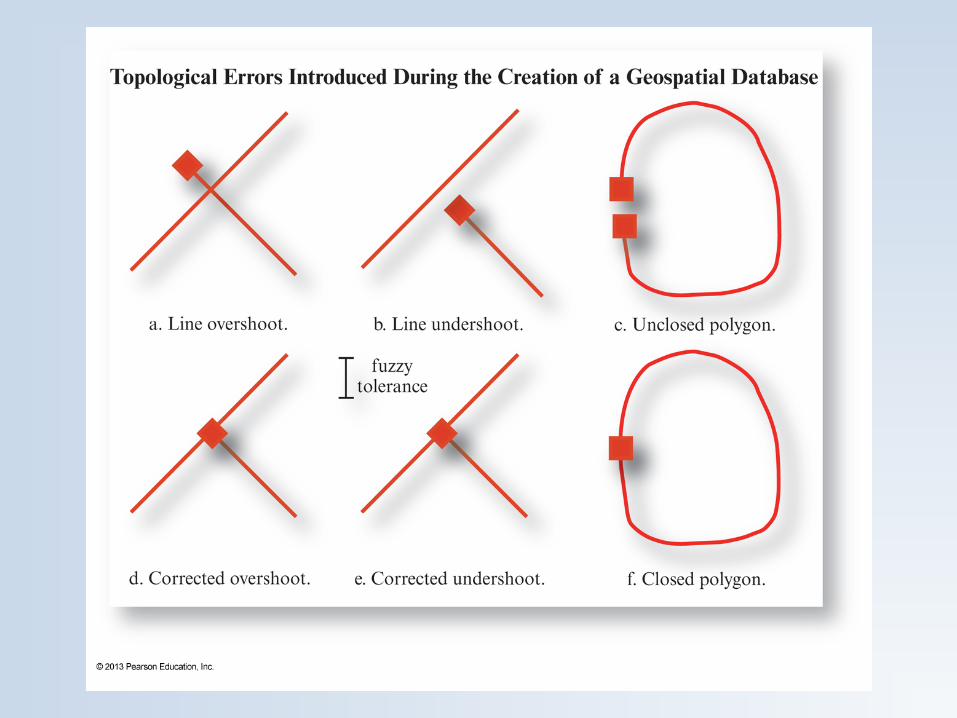
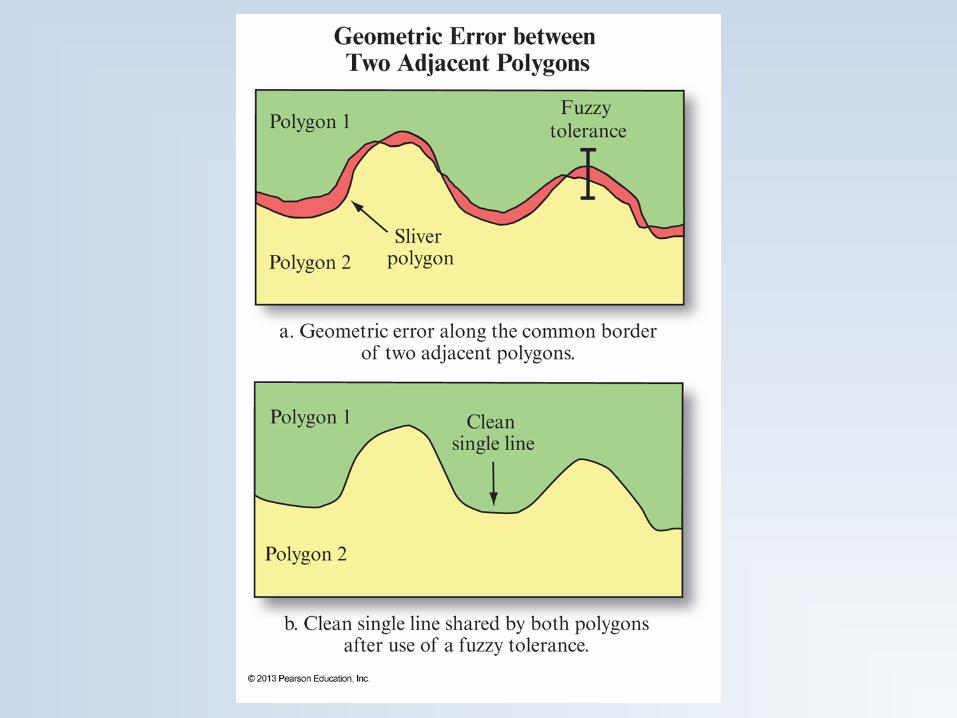
Why Topology Matters
• Getting data to line up, connect, intersect, move together
• Important for GIS operations and analyses
• Coordinate transformation
• Map projection
• Area calculations
• Queries
• In order to do this we use topology
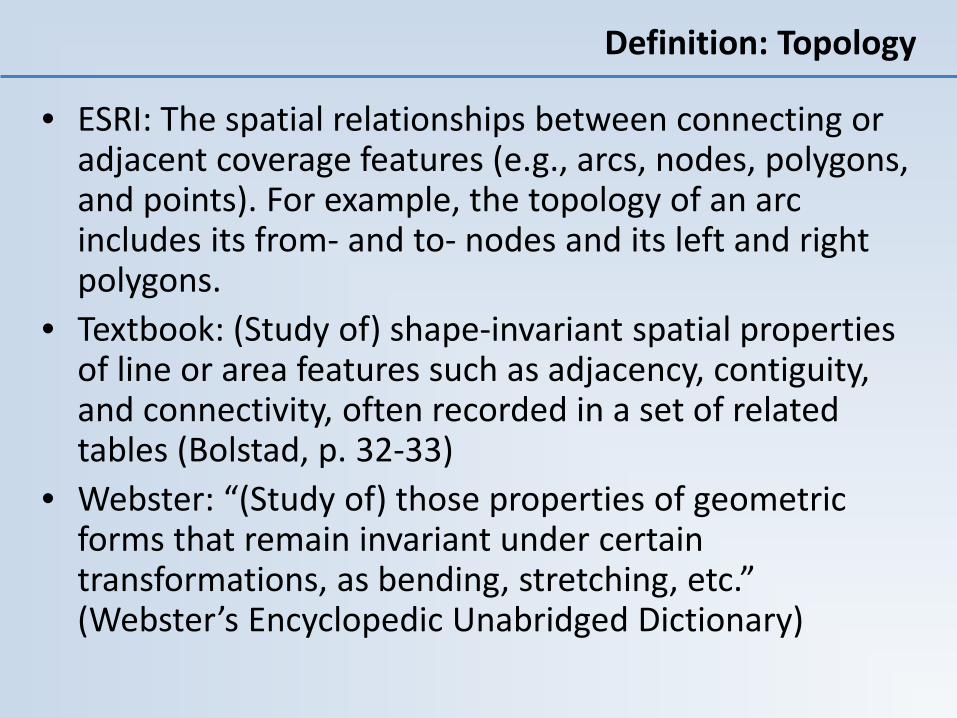
• ESRI: The spatial relationships between connecting or adjacent coverage features (e.g., arcs, nodes, polygons, and points). For example, the topology of an arc includes its from- and to- nodes and its left and right polygons.
• Textbook: (Study of) shape-invariant spatial properties of line or area features such as adjacency, contiguity, and connectivity, often recorded in a set of related tables (Bolstad, p. 32-33)
• Webster: “(Study of) those properties of geometric forms that remain invariant under certain transformations, as bending, stretching, etc.” (Webster’s Encyclopedic Unabridged Dictionary)
Definition: Topology
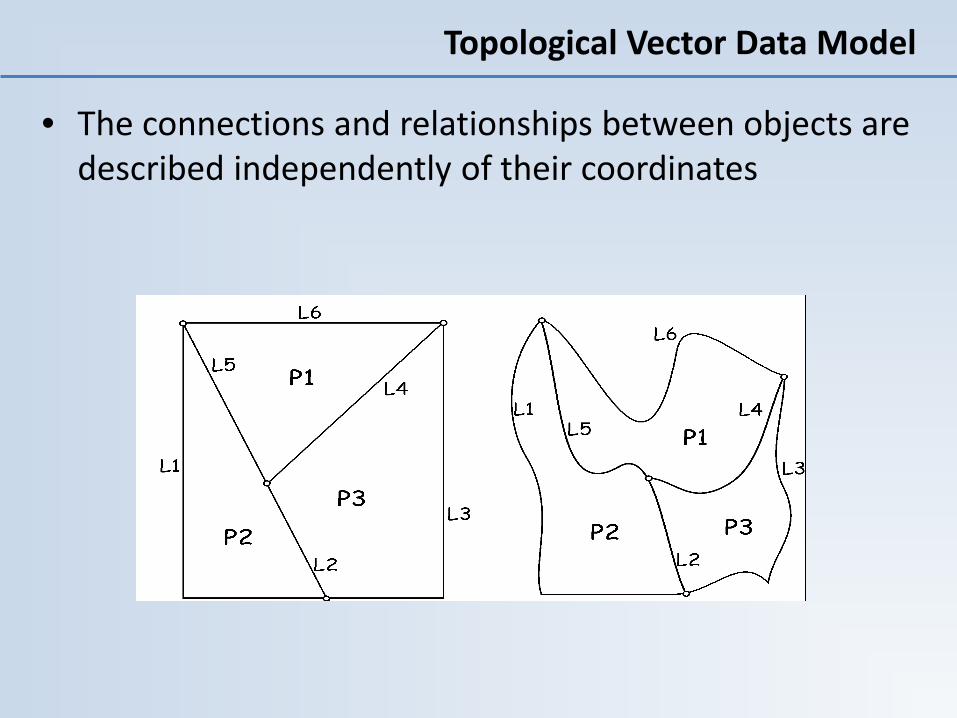
• The connections and relationships between objects are described independently of their coordinates
Topological Vector Data Model
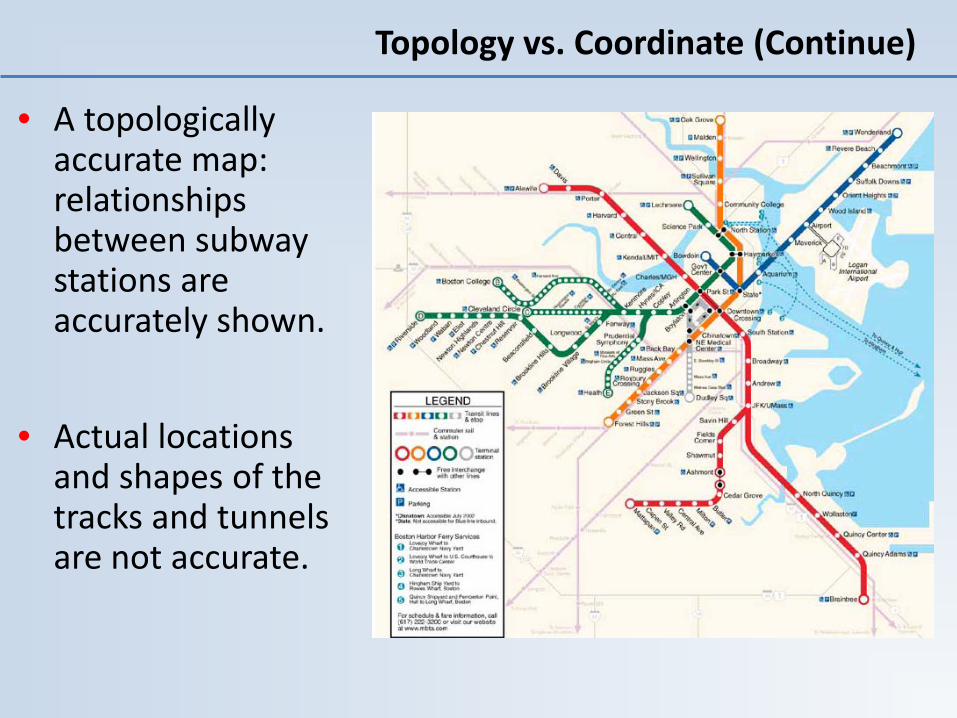
Topology vs. Coordinate (Continue)
• A topologically accurate map: relationships between subway stations are accurately shown.
• Actual locations and shapes of the tracks and tunnels are not accurate.
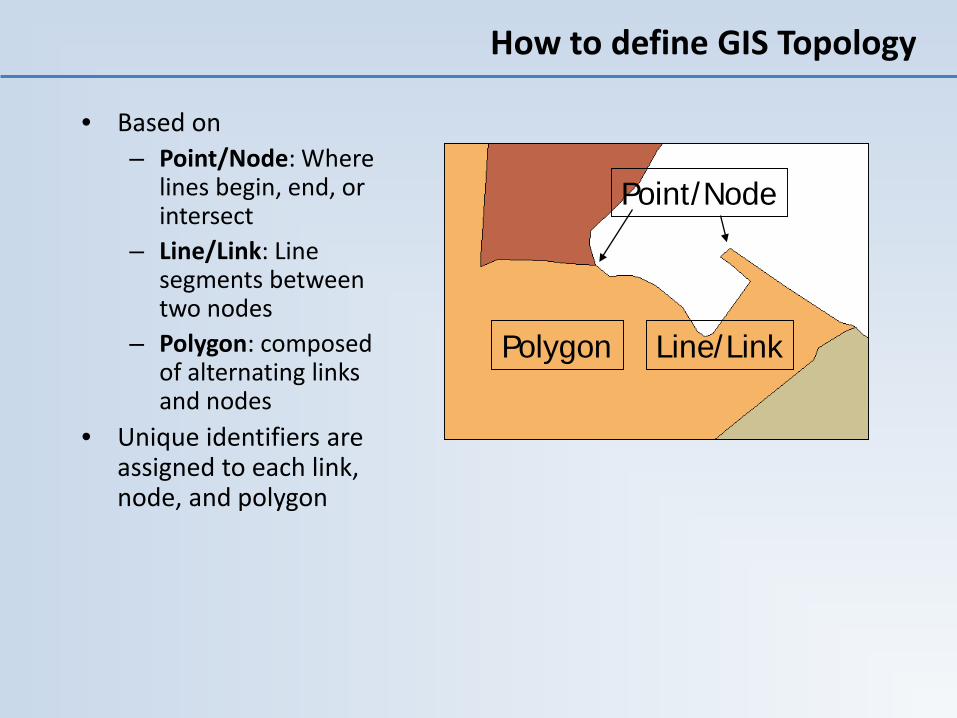
How to define GIS Topology
• Based on – Point/Node: Where
lines begin, end, or intersect
– Line/Link: Line segments between two nodes
– Polygon: composed of alternating links and nodes
• Unique identifiers are assigned to each link, node, and polygon
Point/Node
Polygon Line/Link
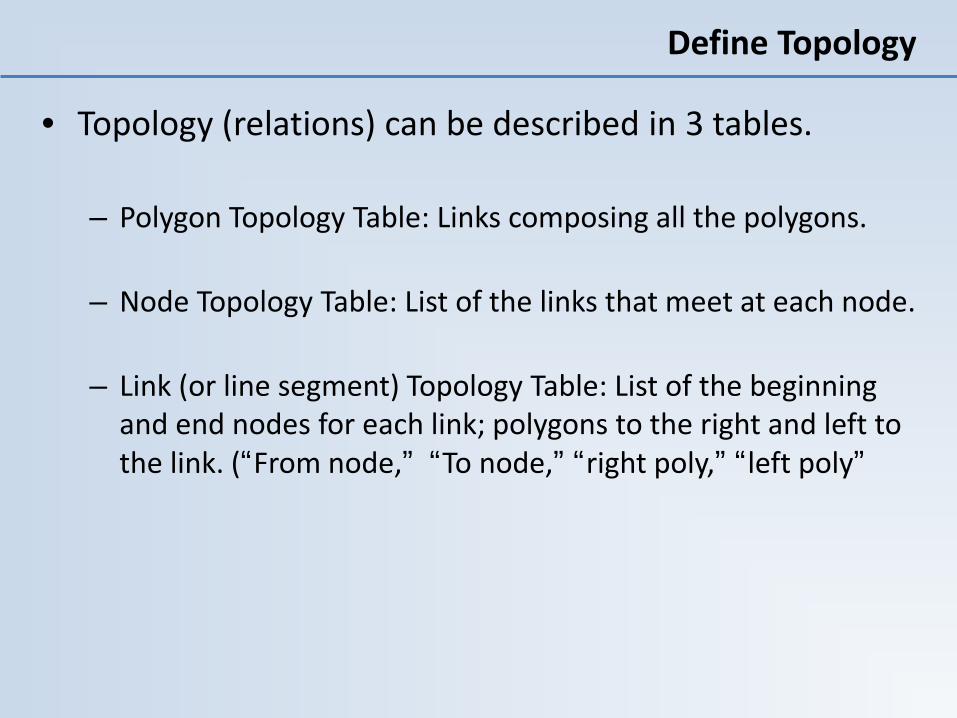
Define Topology
• Topology (relations) can be described in 3 tables.
– Polygon Topology Table: Links composing all the polygons.
– Node Topology Table: List of the links that meet at each node.
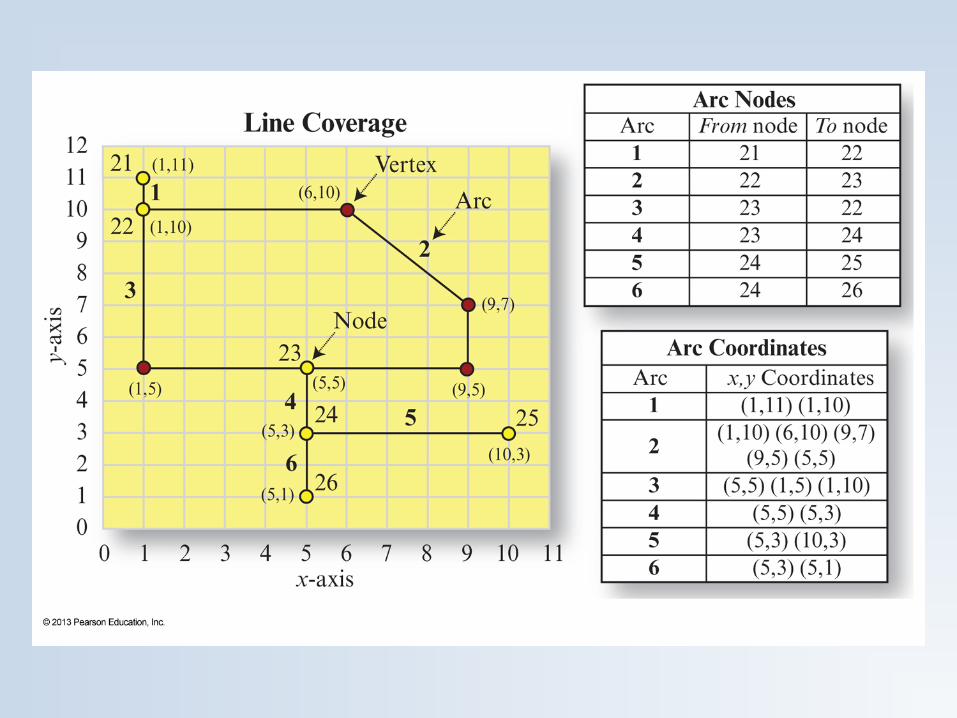
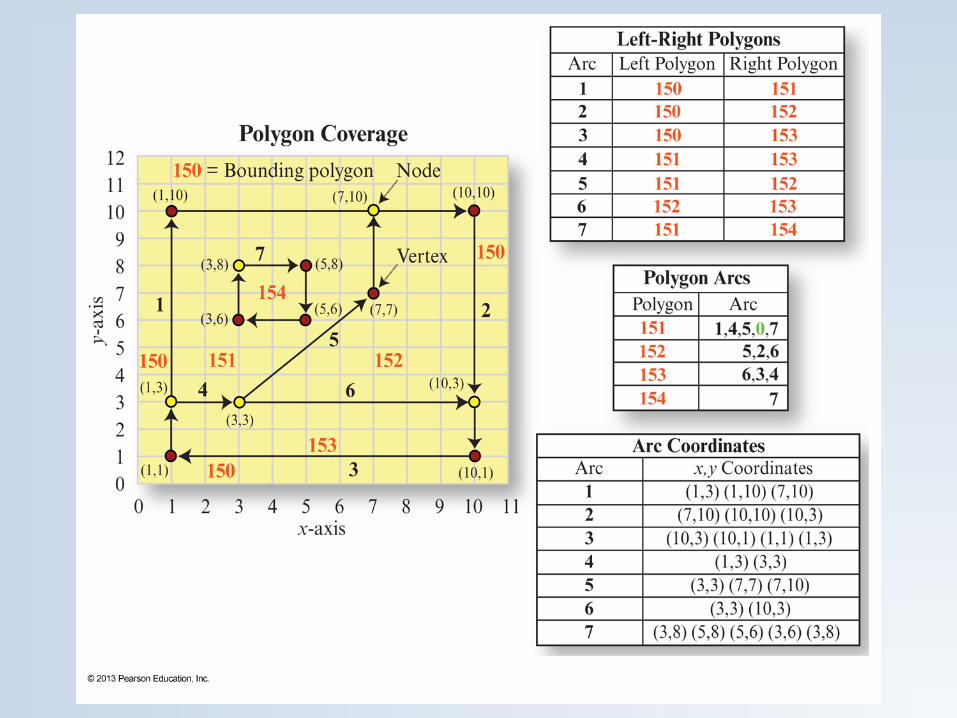
– Link (or line segment) Topology Table: List of the beginning and end nodes for each link; polygons to the right and left to the link. (“From node,” “To node,” “right poly,” “left poly”
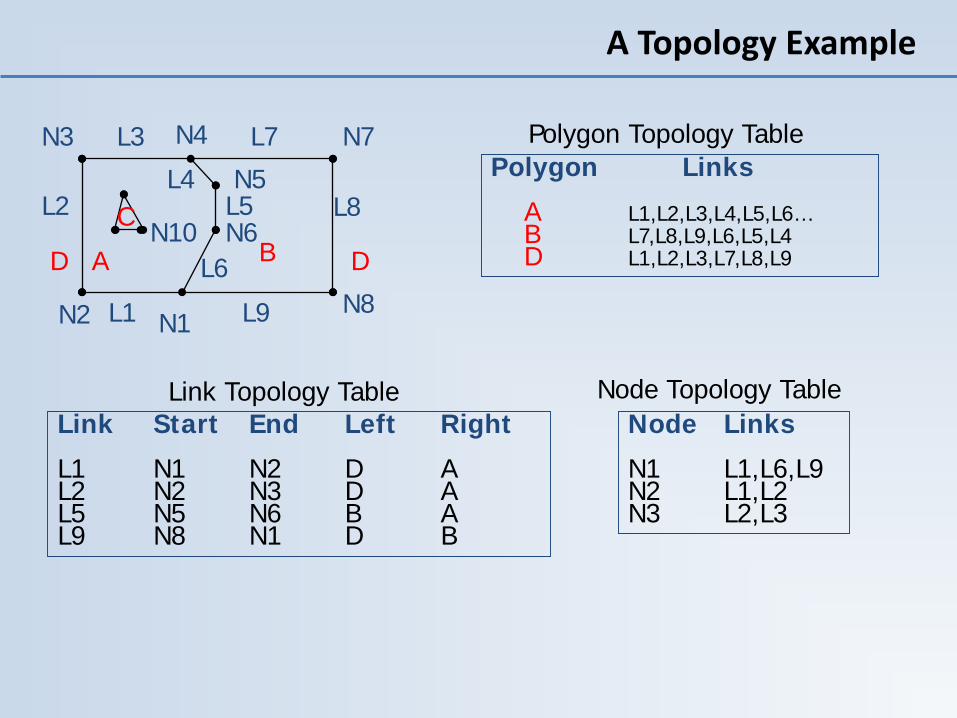
A Topology Example
Node Topology TableNode LinksN1 L1,L6,L9N2 L1,L2N3 L2,L3
Link Topology TableLink Start End Left RightL1 N1 N2 D AL2 N2 N3 D AL5 N5 N6 B AL9 N8 N1 D B
L1 N1
L3L4N4
L2
A BC
D D
Polygon Topology TablePolygon Links
A L1,L2,L3,L4,L5,L6…B L7,L8,L9,L6,L5,L4D L1,L2,L3,L7,L8,L9
L8
N3
N2
N5
N6
N7
N8
L5
L6
L7
L9
N10
Common Vector GIS Data Files
• Coverage (topological)• Shape File (non-topological)• GeoDatabase (topological)• MapInfo (topological)• TIN (topological)• CAD (non topology)
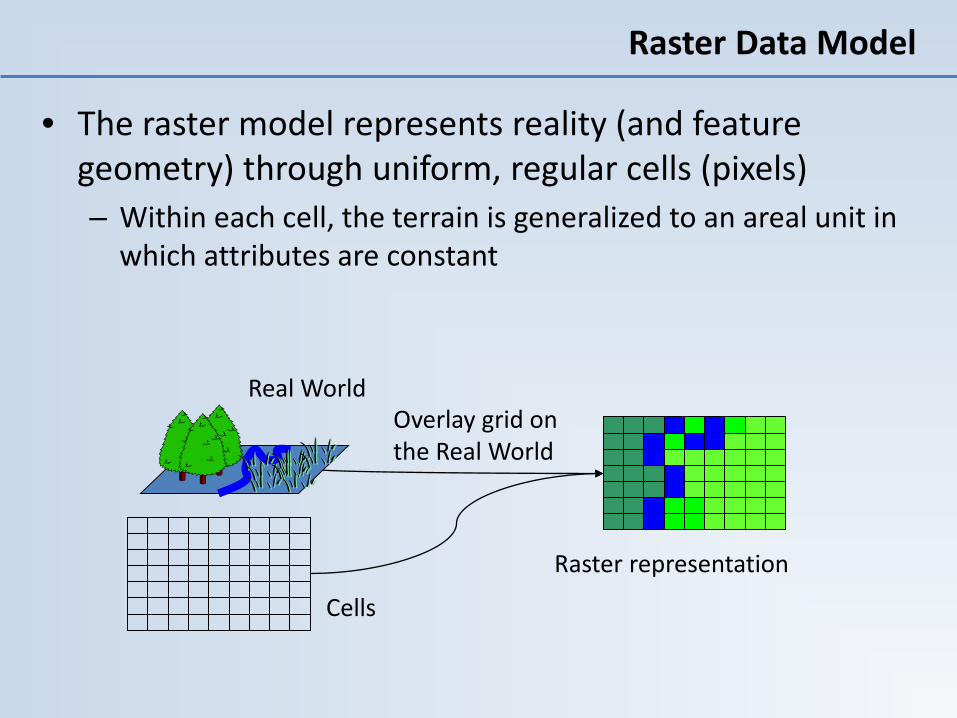
Raster Data Model
• The raster model represents reality (and feature geometry) through uniform, regular cells (pixels)– Within each cell, the terrain is generalized to an areal unit in
which attributes are constant
Raster representation
Real World
Cells
Overlay grid on the Real World
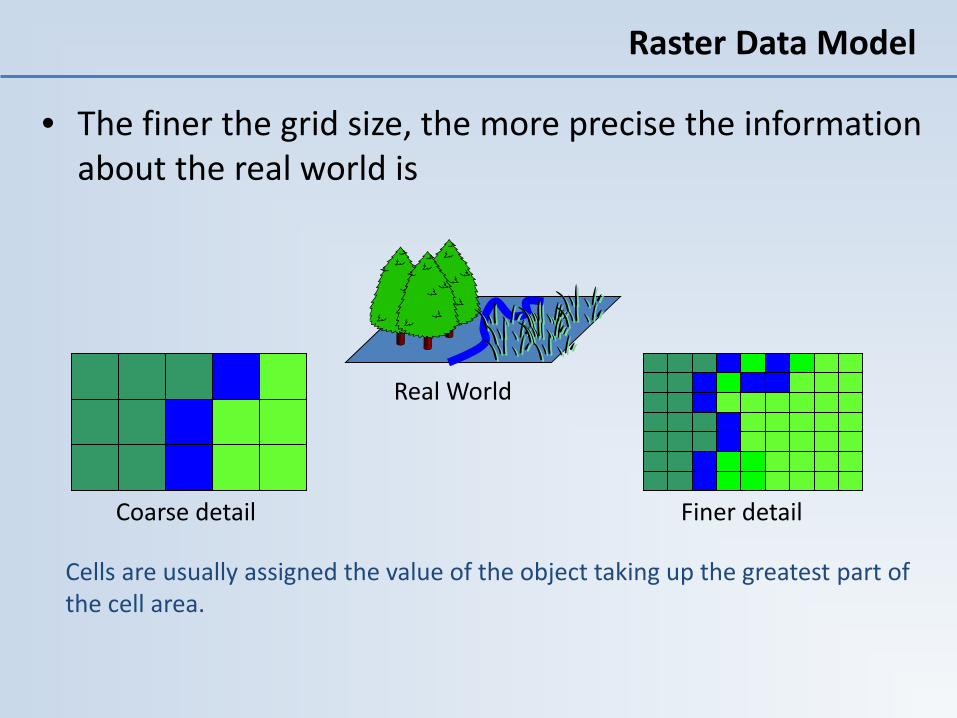
Raster Data Model
• The finer the grid size, the more precise the information about the real world is
Cells are usually assigned the value of the object taking up the greatest part of the cell area.
Real World
Finer detailCoarse detail
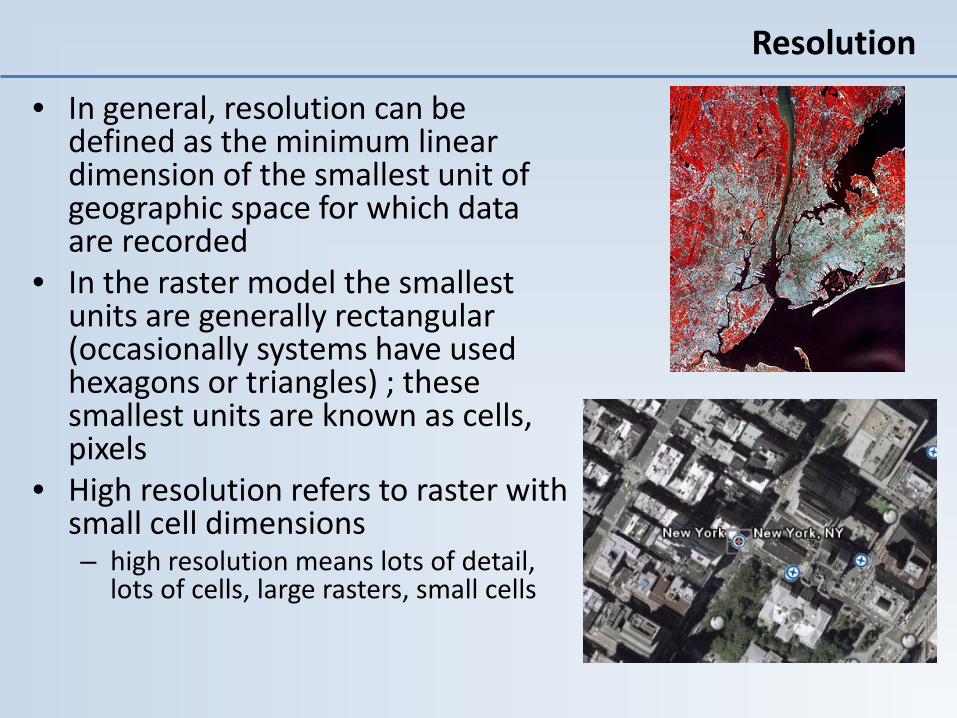
• In general, resolution can be defined as the minimum linear dimension of the smallest unit of geographic space for which data are recorded
• In the raster model the smallest units are generally rectangular (occasionally systems have used hexagons or triangles) ; these smallest units are known as cells, pixels
• High resolution refers to raster with small cell dimensions – high resolution means lots of detail,
lots of cells, large rasters, small cells
Resolution

Raster Cell Size
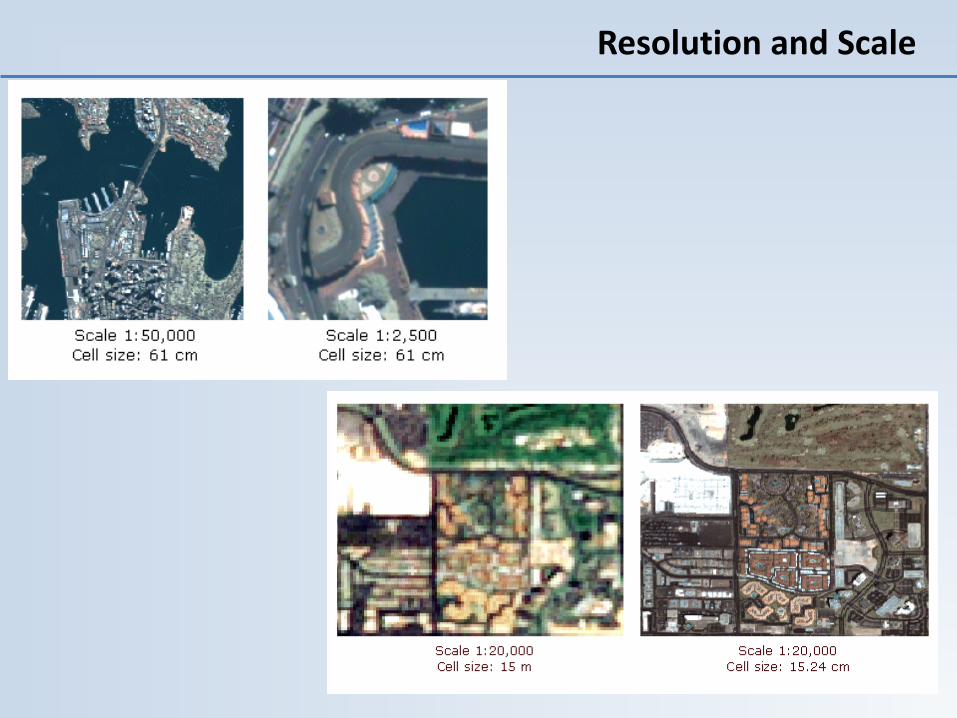
Resolution and Scale
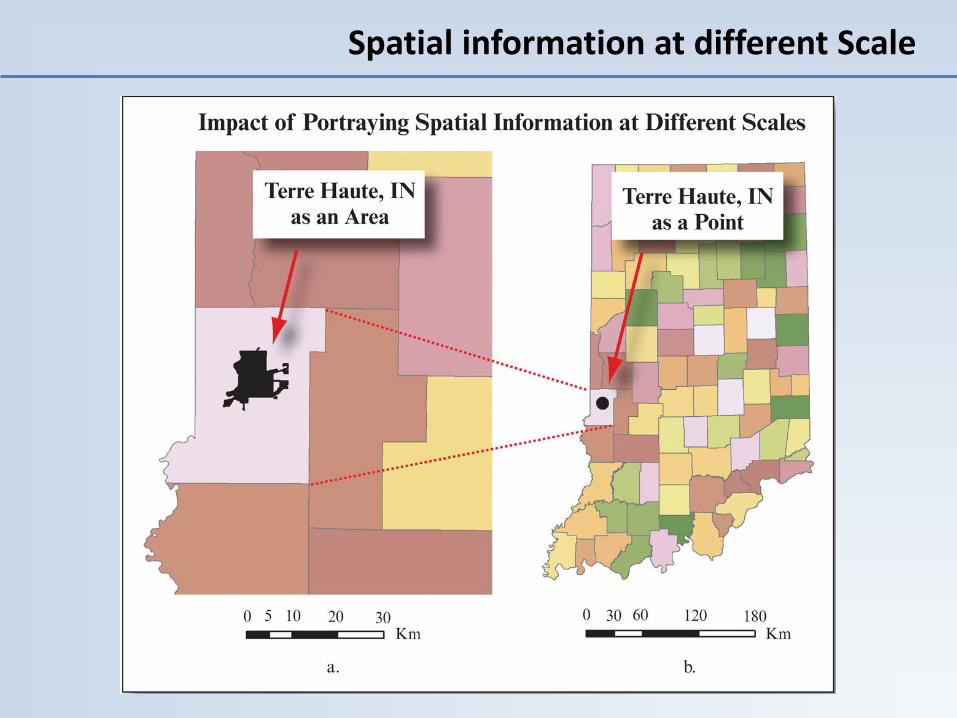
Spatial information at different Scale
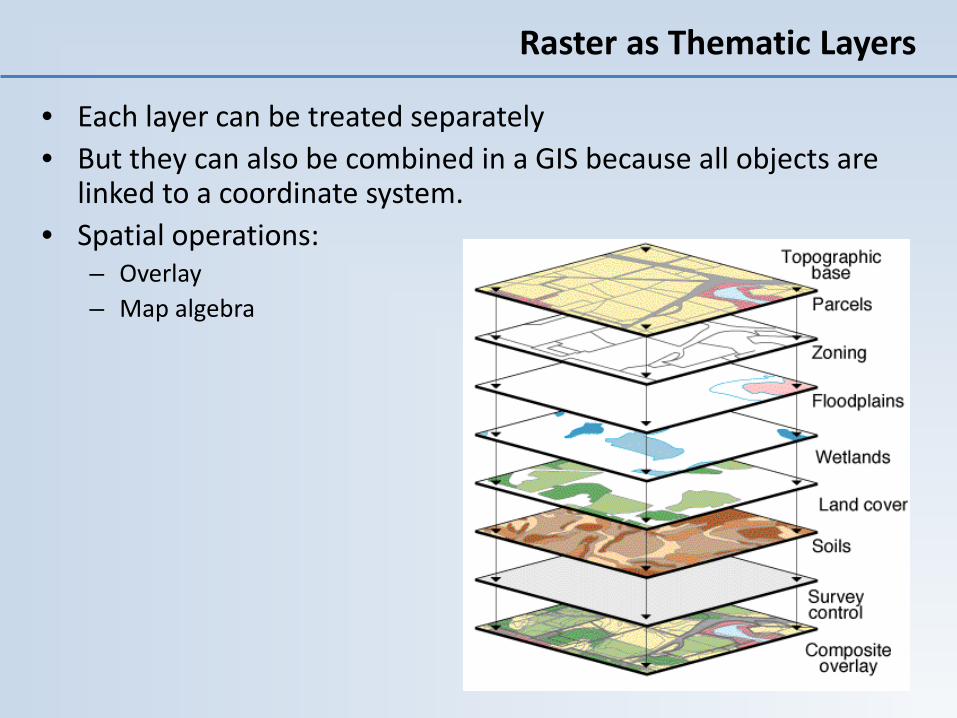
Raster as Thematic Layers
• Each layer can be treated separately• But they can also be combined in a GIS because all objects are
linked to a coordinate system.• Spatial operations:
– Overlay– Map algebra
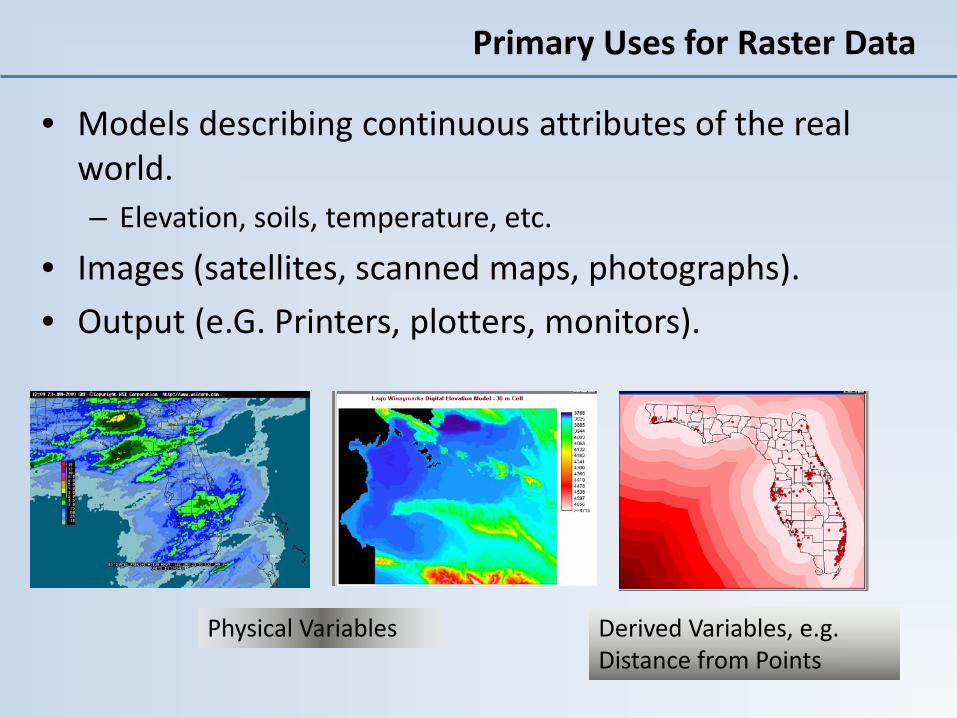
• Models describing continuous attributes of the real world.– Elevation, soils, temperature, etc.
• Images (satellites, scanned maps, photographs).• Output (e.G. Printers, plotters, monitors).
Primary Uses for Raster Data
Physical Variables Derived Variables, e.g. Distance from Points
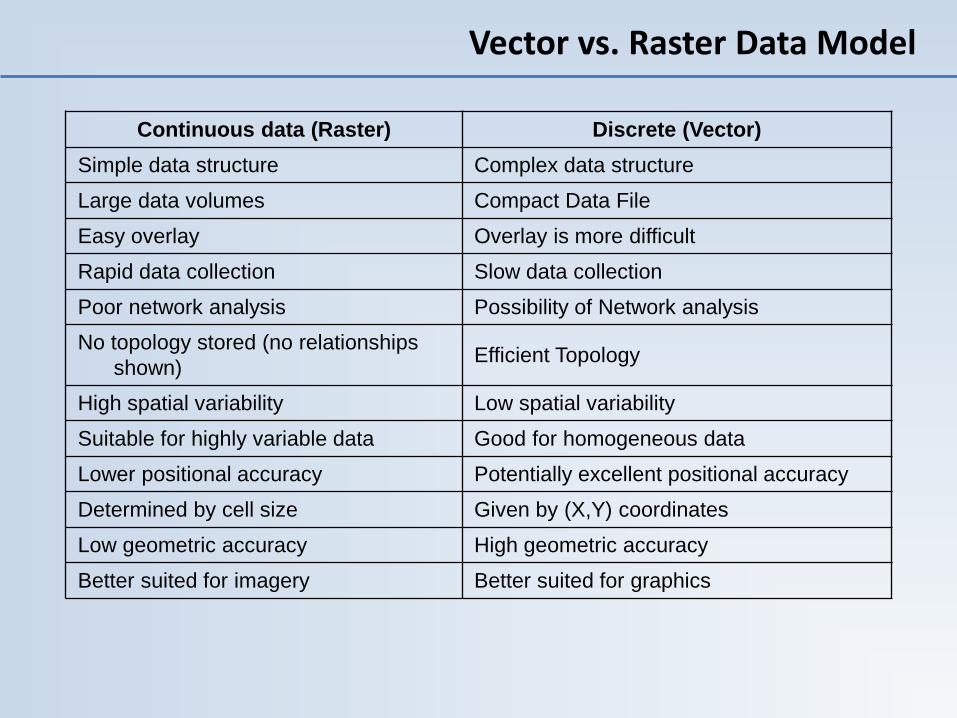
Vector vs. Raster Data Model
Continuous data (Raster) Discrete (Vector)Simple data structure Complex data structureLarge data volumes Compact Data FileEasy overlay Overlay is more difficultRapid data collection Slow data collectionPoor network analysis Possibility of Network analysisNo topology stored (no relationships
shown) Efficient Topology
High spatial variability Low spatial variabilitySuitable for highly variable data Good for homogeneous dataLower positional accuracy Potentially excellent positional accuracyDetermined by cell size Given by (X,Y) coordinatesLow geometric accuracy High geometric accuracyBetter suited for imagery Better suited for graphics
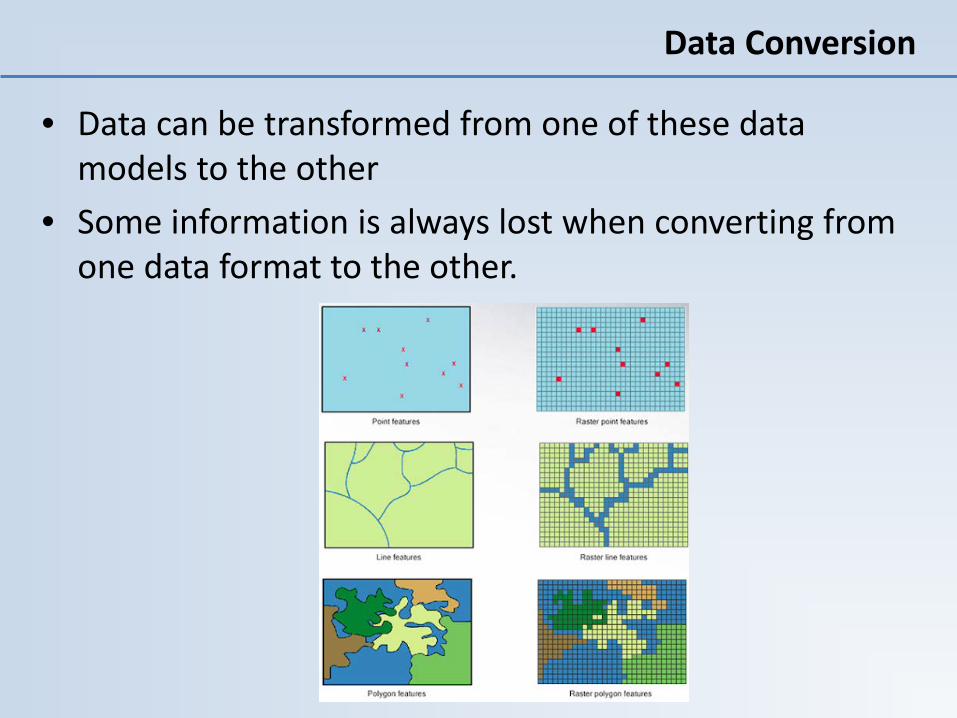
• Data can be transformed from one of these data models to the other
• Some information is always lost when converting from one data format to the other.
Data Conversion
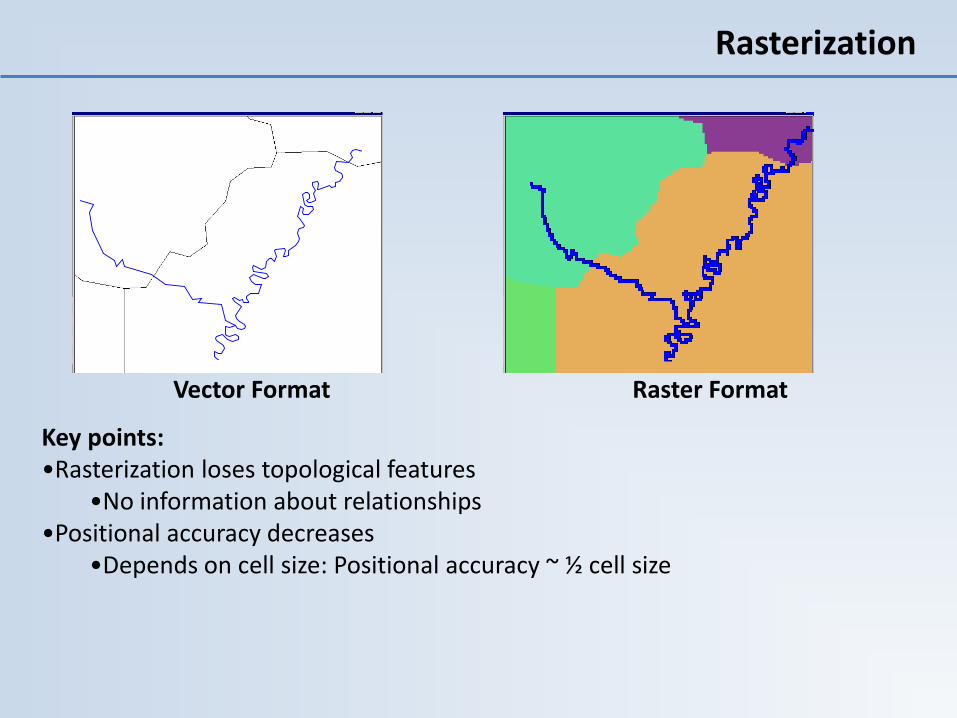
Rasterization
Key points:•Rasterization loses topological features
•No information about relationships•Positional accuracy decreases
•Depends on cell size: Positional accuracy ~ ½ cell size
Vector Format Raster Format

Vectorization
Key points:•Feature boundaries become jagged in the vector representation•Topology is created (relationships)
Raster Format Vector Format
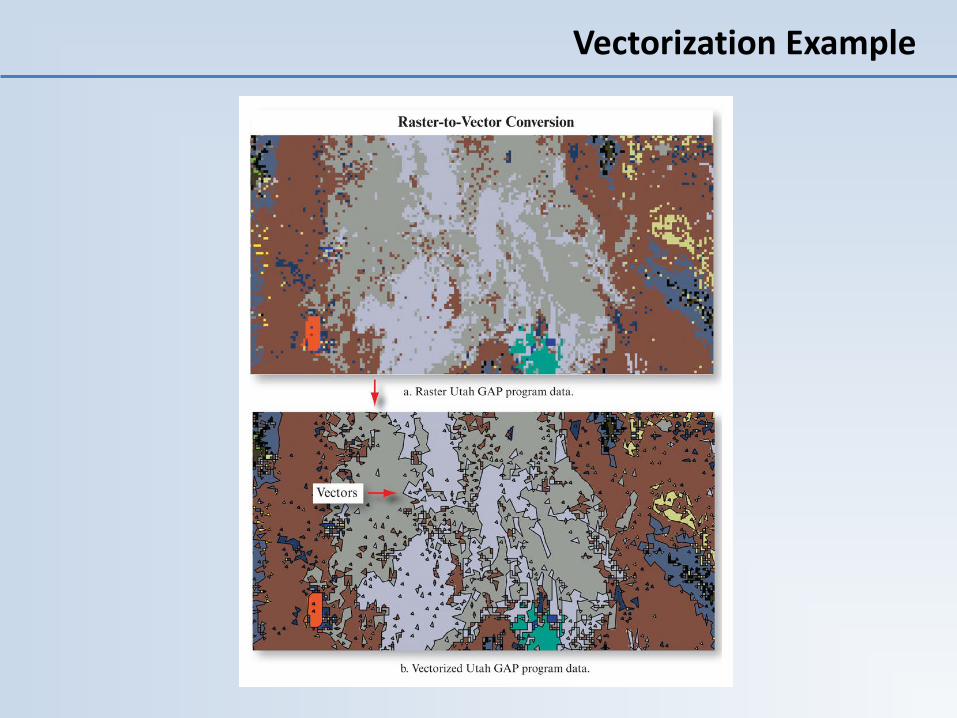
Vectorization Example
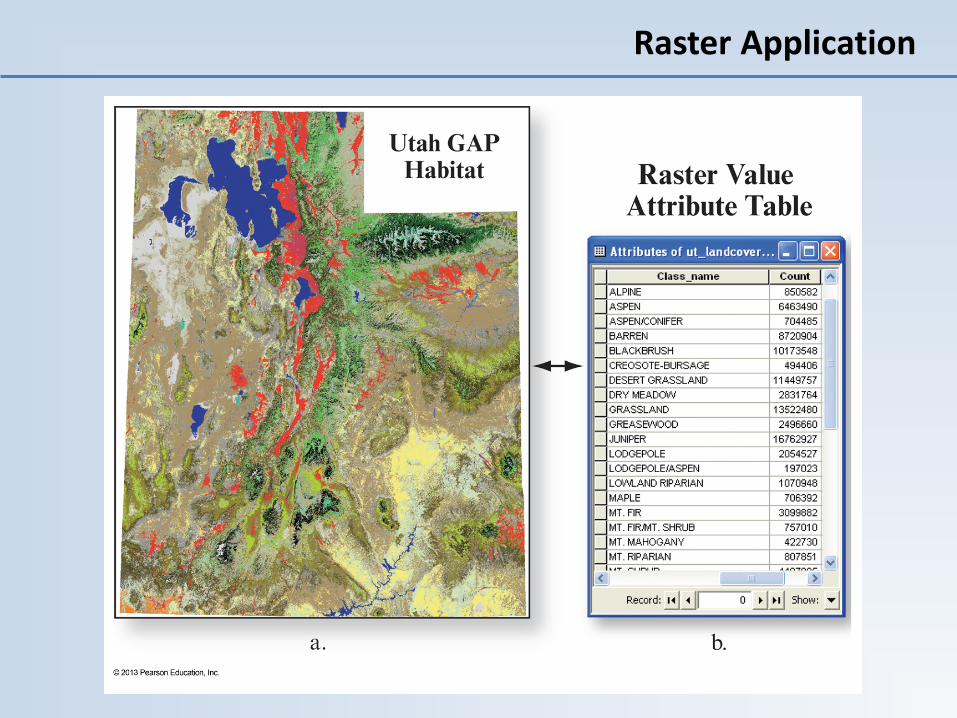
Raster Application
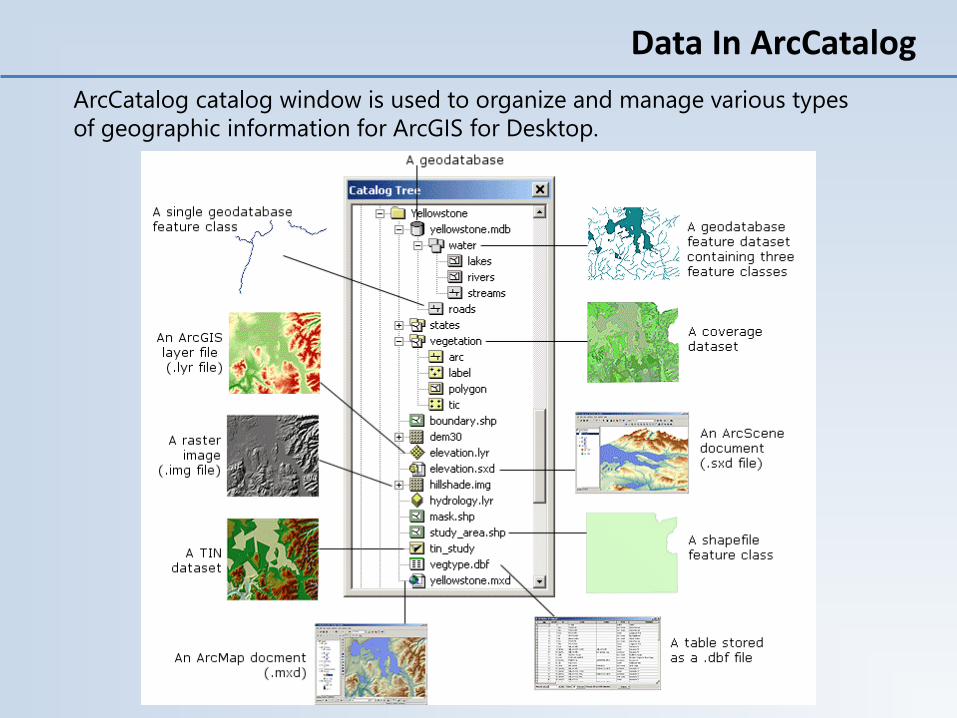
Data In ArcCatalogArcCatalog catalog window is used to organize and manage various types of geographic information for ArcGIS for Desktop.
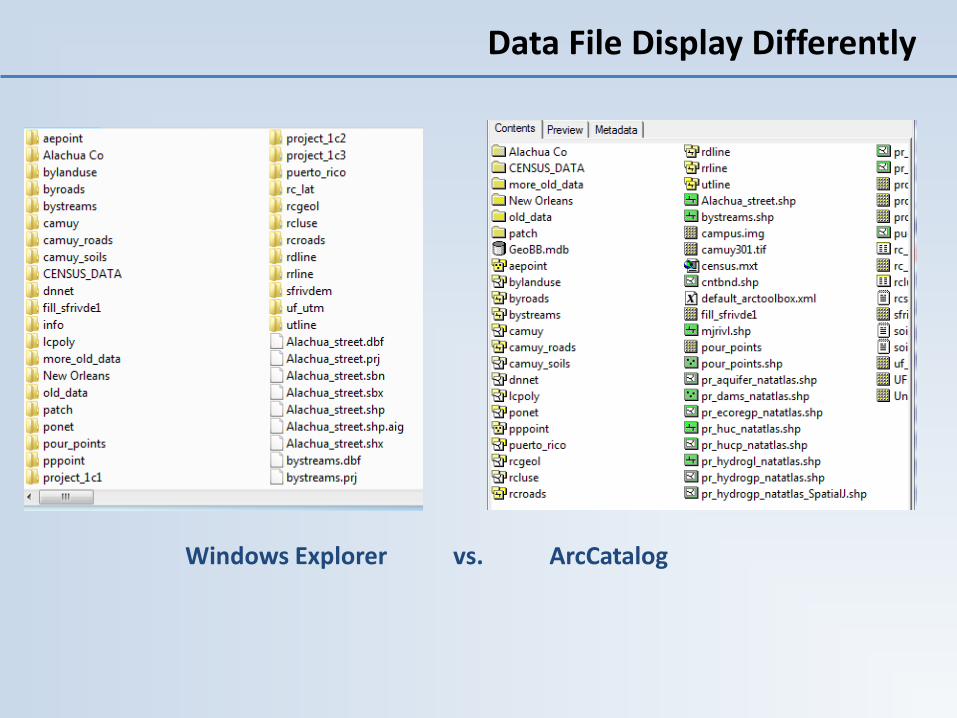
Data File Display Differently
Windows Explorer vs. ArcCatalog
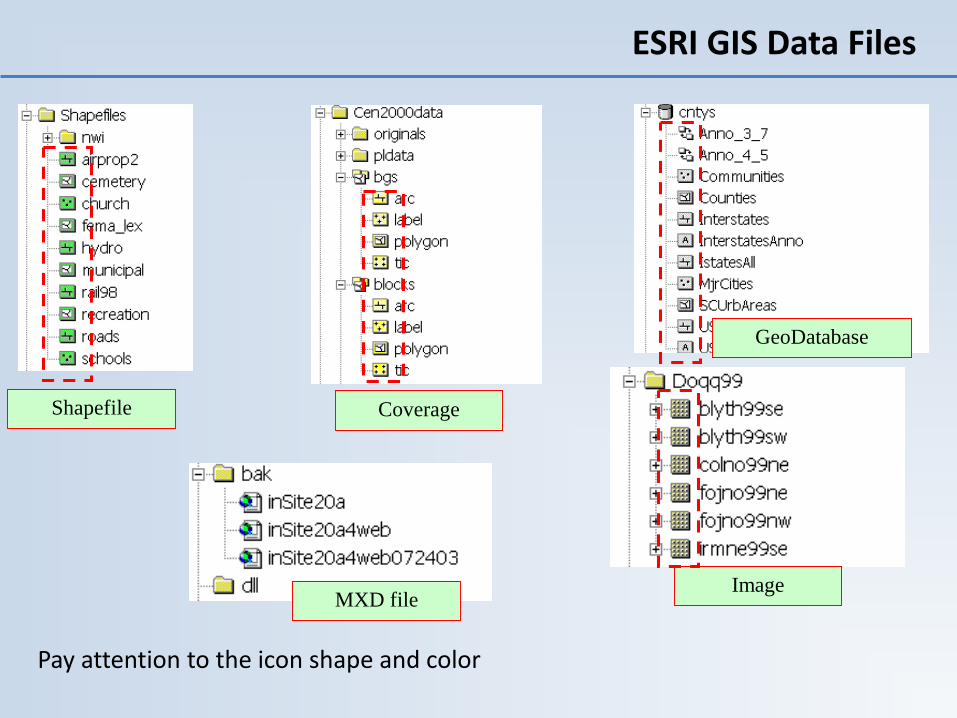
ESRI GIS Data Files
Shapefile Coverage
MXD file
GeoDatabase
Image
Pay attention to the icon shape and color
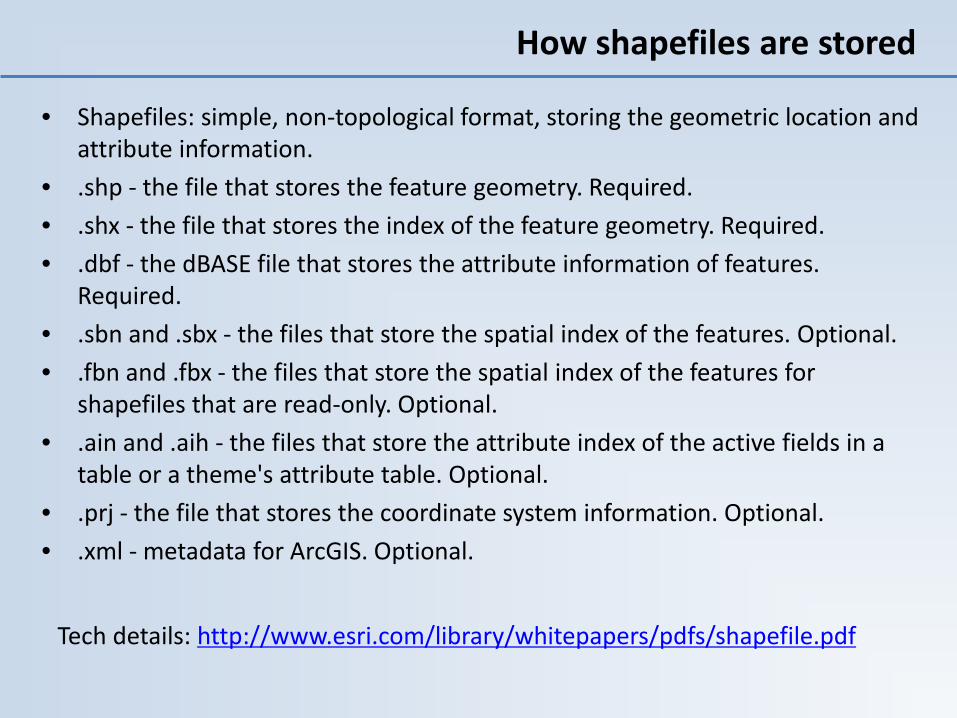
• Shapefiles: simple, non-topological format, storing the geometric location and attribute information.
• .shp - the file that stores the feature geometry. Required.• .shx - the file that stores the index of the feature geometry. Required.• .dbf - the dBASE file that stores the attribute information of features.
Required.• .sbn and .sbx - the files that store the spatial index of the features. Optional.• .fbn and .fbx - the files that store the spatial index of the features for
shapefiles that are read-only. Optional. • .ain and .aih - the files that store the attribute index of the active fields in a
table or a theme's attribute table. Optional.• .prj - the file that stores the coordinate system information. Optional.• .xml - metadata for ArcGIS. Optional.
How shapefiles are stored
Tech details: http://www.esri.com/library/whitepapers/pdfs/shapefile.pdf
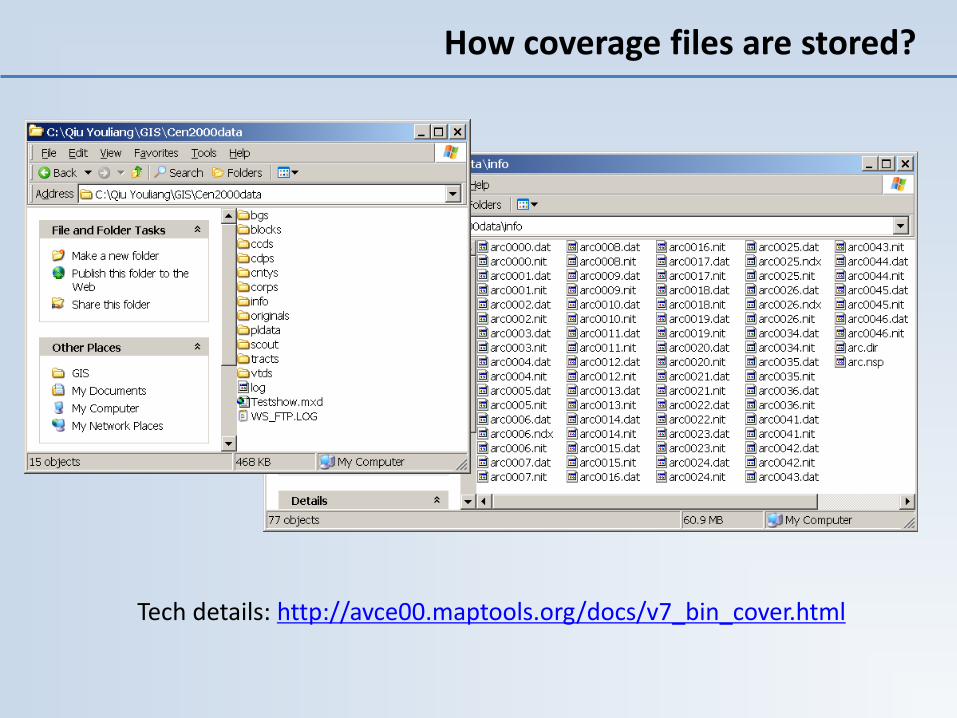
How coverage files are stored?
Tech details: http://avce00.maptools.org/docs/v7_bin_cover.html

• Database data sets (RDBMS data sources), rather than file-based data sets
• Supported by major RDBMS, such as DB2, SqlServer, Oracle, Microsoft Access (personal Geodatabase)
GeoDatabase
MXD File Format
• ArcMap Map Document file• It does not save your GIS data. Map document such as
symbology, layer name saved only.• Very important for your exercise: Relative Path vs. Full
Path
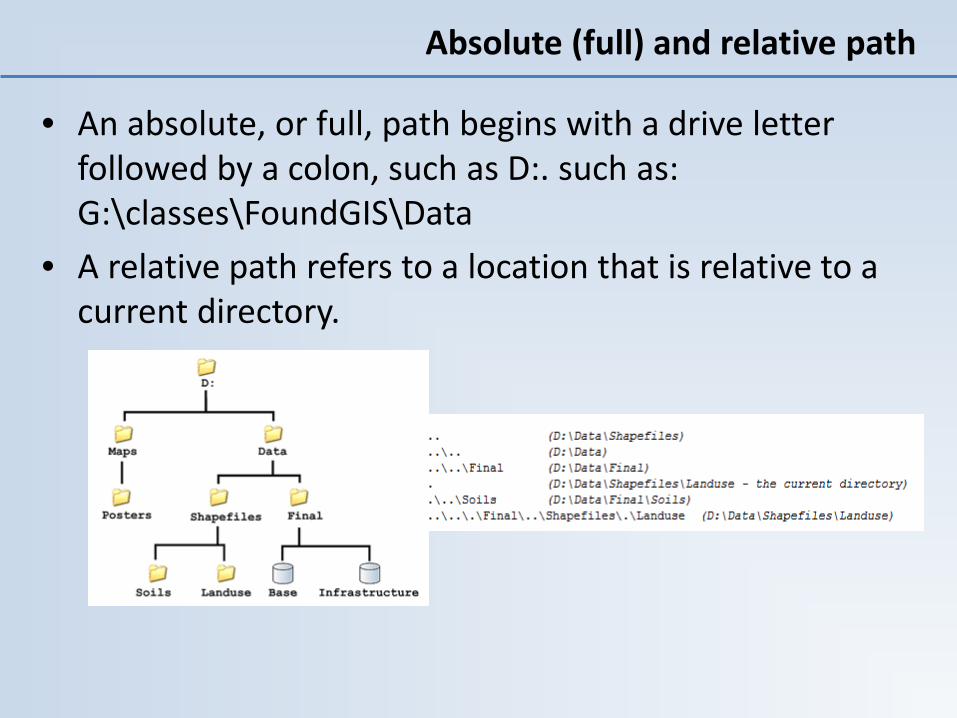
Absolute (full) and relative path
• An absolute, or full, path begins with a drive letter followed by a colon, such as D:. such as: G:\classes\FoundGIS\Data
• A relative path refers to a location that is relative to a current directory.
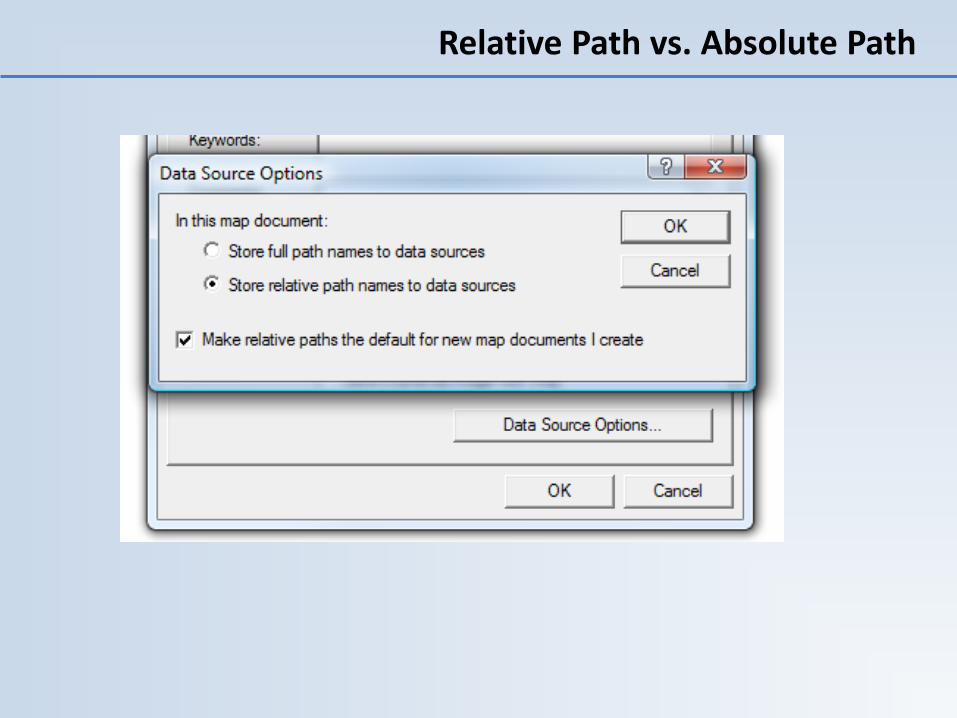
Relative Path vs. Absolute Path

Why use relative vs. absolute path?
• Using absolute pathnames: – You can move the document or toolbox anywhere on your
computer and the data will be found when you reopen the document or tool.
– On most personal computers, the location of data is usually constant. That is, you typically don't move your data around much on your personal computer. In such cases, absolute pathnames are preferred.
– You can reference data on other disk drives. • Using relative pathnames:
– When moving a map document or toolbox, the referenced data has to move as well.
– When delivering documents, toolboxes, and data to another user, relative pathnames should be used. Otherwise, the recipient's computer must have the same directory structure as yours.


