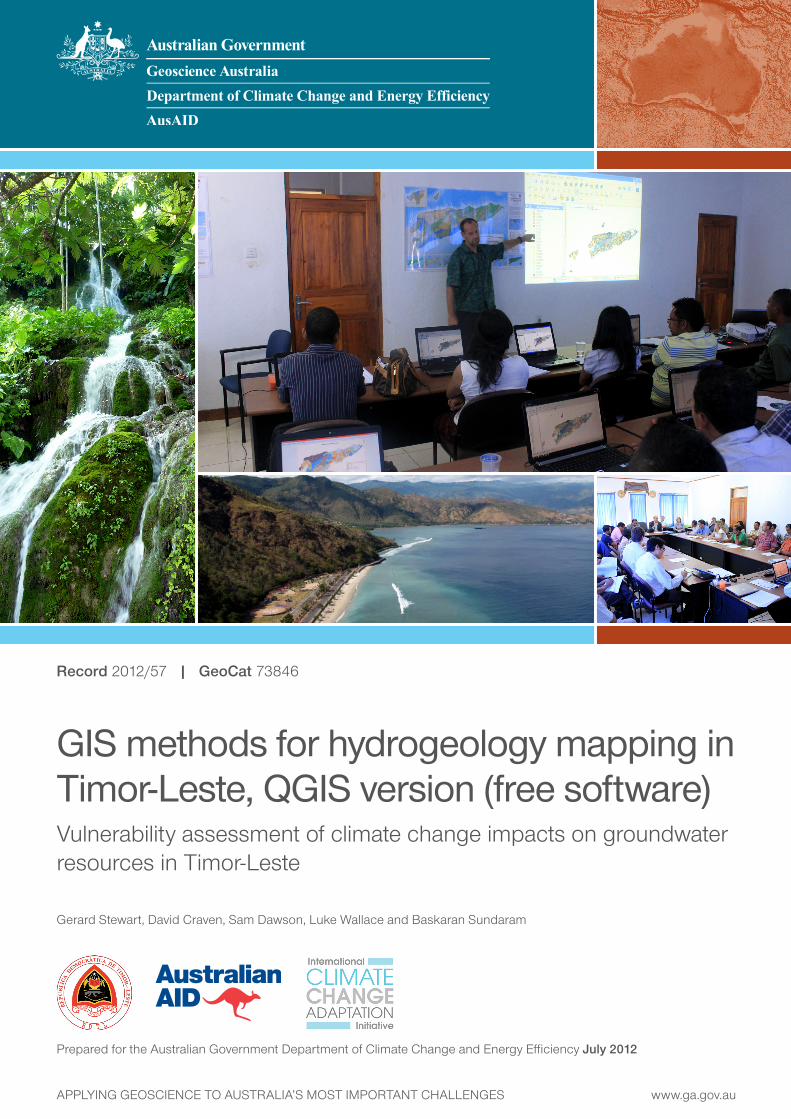
GIS methods for hydrogeology mapping in Timor-Leste, QGIS version (free software) Vulnerability assessment of climate change impacts on groundwater resources in Timor-Leste Gerard Stewart, David Craven, Sam Dawson, Luke Wallace and Baskaran Sundaram Record 2012/57 | GeoCat 73846 Prepared for the Australian Government Department of Climate Change and Energy Efficiency July 2012 APPLYING GEOSCIENCE TO AUSTRALIA’S MOST IMPORTANT CHALLENGES www.ga.gov.au
Transcript
GIS methods for hydrogeology mapping in Timor-Leste, QGIS version (free software) Vulnerability assessment of climate change impacts on groundwater resources in Timor-Leste
Gerard Stewart, David Craven, Sam Dawson, Luke Wallace and Baskaran Sundaram
Record 2012/57 | GeoCat 73846
Prepared for the Australian Government Department of Climate Change and Energy Efficiency July 2012
APPLYING GEOSCIENCE TO AUSTRALIA’S MOST IMPORTANT CHALLENGES www.ga.gov.au
GIS methods for hydrogeology mapping in Timor-Leste, QGIS version (free software) Vulnerability assessment of climate change impacts on groundwater resources in Timor-Leste PREPARED FOR THE AUSTRALIAN GOVERNMENT DEPARTMENT OF CLIMATE CHANGE AND ENERGY EFFICIENCY BY GEOSCIENCE AUSTRALIA July 2012 by Gerard Stewart1, David Craven2, Sam Dawson1, Luke Wallace1 and Baskaran Sundaram1.
1. Geoscience Australia
2. Timor-Leste GIS & Mapping Institute
Disclaimer: This report has been prepared by Geoscience Australia for the Australian Government, represented
y its Department of Climate Change and Energy Efficiency (DCCEE). Funding for the preparation
icence. To view a copy of this license, visit http://creativecommons.org/licenses/by/3.0/au/. The Department of Climate Change and Energy Efficiency asserts the right to be recognised as the copy right owner of the original material in the following manner:
bof the report was made available from the Pacific Adaptation Strategy Assistance Program, delivered
DCCEE.
e report includes the views and recommendations of third parties and does not necessarily reflect e views of the Australian Government, or indicate a commitment to a particular policy or course of tion.
While reasonable efforts have been made to ensure the accuracy, completeness and reliability of the aterial contained in this document, neither the Commonwealth nor Geoscience Australia warrant at the information contained in this report is free from errors or omissions. The Commonwealth d Geoscience Australia do not accept any form of liability, be it contractual, tortious or
otherwise, for the contents of this report or for any consequences arising from its use or any reliance aced upon it. The material in this document is provided for general information only, and on the derstanding that the Australian Government is not providing professional advice on a particular
matter. Before any action or decision is taken on the basis of this material the reader should obtain propriate independent professional advice.
Copyright notice:
Commonwealth of Australia 2012
is work is licensed under the Creative Commons Creative Commons Attribution 3.0 Australia L
GIS Methods for Hydrogeology Mapping in Timor-Leste
Table of Contents 1. Introduction.....................................................................................................................................1
2 Editing Geological and Hydrogeological attributes ......................................................................3 2.1 Creating and Populating a Field for Standard Geological Map Symbols ...................................3 2.2 Calculating Feature Geometry – Area and Perimeter ...............................................................13 2.3 Creating and Populating the Hydrogeological Potential Field..................................................20
3 Symbolizing Geological Characteristics.......................................................................................24 3.1 Symbolizing Geology with International Standard ColoUrs ....................................................24 3.2 Symbolizing Hydrogeology with International Standard ColoUrs ...........................................31
4 Spatial Analysis ..............................................................................................................................37 4.1 Calculating Areas of Hydrogeological Potential Classes..........................................................37 4.2 Exploring the Relationship between Hydrogeological Potential and Population Centres ........43
5 Metadata .........................................................................................................................................49 5.1 Installing the Metatools Plugin .................................................................................................49 5.2 Entering Metadata.....................................................................................................................53 Attachment I - Geology map Symbol Conversion Guide ...............................................................59 Attachment II - Standard RGB Values for Geology & Hydrogeology symbols.............................60
iii
GIS Methods for Hydrogeology Mapping in Timor-Leste
iv
GIS Methods for Hydrogeology Mapping in Timor-Leste
1. Introduction 1.1 PURPOSE
This document outlines some of the methods used by Geoscience AuGeology and Hydrogeology map of Timor-Leste. It is designed to be wledge-sharing
ool by eology teccies.
.2 BACKGROUND
the Geoscienc imor-Leste Groundwater numerous datasets from various government departments in Timor-Lgeology maps, however none of these maps had standard geological
cluding the one selected as a base for the hydrogeological map. Fu e map GA used did ot have any metadata attached to it, therefore there was no attributed creator. Despite several
unable to ascertain the makers of this map, and were therefore unable to consult colouring used when the map was created. It was decided that, for both ease of use
country, standard geological colouring should be applied to this
aders of this document are GIS users from DNGRA, SERN, BESIK and other
water resource management and g hnicians from Timor-Leste
1 In August 2010 e Australia T project team collected
este. These included several colours applied to them, rthermore, thin
nattempts we were them as to theand as an output to return to the map. The following details the methods used to apply standard colouring to the map. 1.3 AUDIENCE
he intended reTgovernment departments and stakeholder groups in Timor-Leste.
.4 USEFUL CONTACTS 1 David Craven – Geographic Information Specialist (TMap) Ph:+670-724-8195
erard Stewart – GIS Officer (Geoscience Australia) G
1
GIS Methods for Hydrogeology Mapping in Timor-Leste
2
The bes the instructional indicators of this GIS methods training manual.
ESCRIPTION EXAMPLE PURPOSE
1.5 CONVENTIONS USED
following table descri D
Bold text Click the Add Data button. Indication to click a button or tool, or gain readers attention to what is important.
Keyboard button Press the <Enter> button on your keyboard.
Indication to press the Enter keyon your keyboard.
D gia
Label used to visually indicate steps in the diagrams. A) B) C) etc indicate the order to complete a sequence of operations or procedures
ram labels A) Click here
1.6 NOTES Training data and directory The data required to complete the exercises described in this document include the following: ET_geol UTM describing characteristics of Timor-Leste’s geology and hydrogeology.
T_Towns UTM – a point shapefile defining the locations of Timor-Leste’s main settlements
oftware
This document provides instructions and guidance for users of Quantum GIS 1.7.2 software. The Operating software used was Microsoft Windows XP Professional Service Pack 3. All students will receive a CD containing copies of the software and the data used for the course.
– a polygon shapefile
E(District and Sub District capitals)
S
GIS Methods for Hydrogeology Mapping in Timor-Leste
2 Editing Geological and Hydrogeological attributes
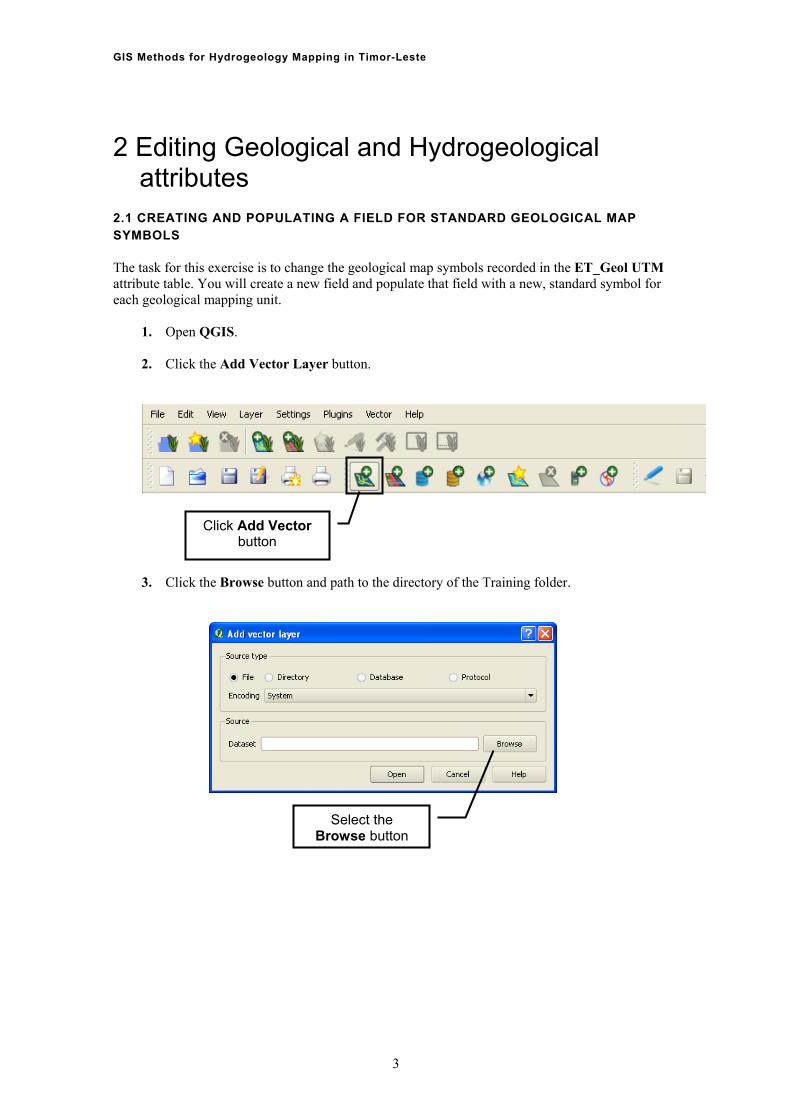
2.1 CREATING AND POPULATING A FIELD FOR STANDARD GEOLOGICAL MAP SYMBOLS The task for nge the geological map symbols recorded in the ET_Geol UTM attribute table. You will create a new field and populate that field with a new, standard symbol for each geological mapping unit.
1. Open QGIS. 2. d Vector Layer button.
this exercise is to cha
Click the Ad
3. Click the Browse button and path to the directory of the Training folder.
Click Add Vector button
Select the Browse button
3
GIS Methods for Hydrogeology Mapping in Timor-Leste
4. Select the Geology shape file (ET_Geol UTM.shp) and click Open.
A) Select the geology shape file
5. In the Add vector layer window, click Open.
B) Click Open
The geology file (ET_Geol UTM) is now displayed in the main window, it is also added as a layer in th Layers panel, left of the main window.
Click Open
e
ET_Geol UTM Layer
Layers Panel
4
GIS Methods for Hydrogeology Mapping in Timor-Leste
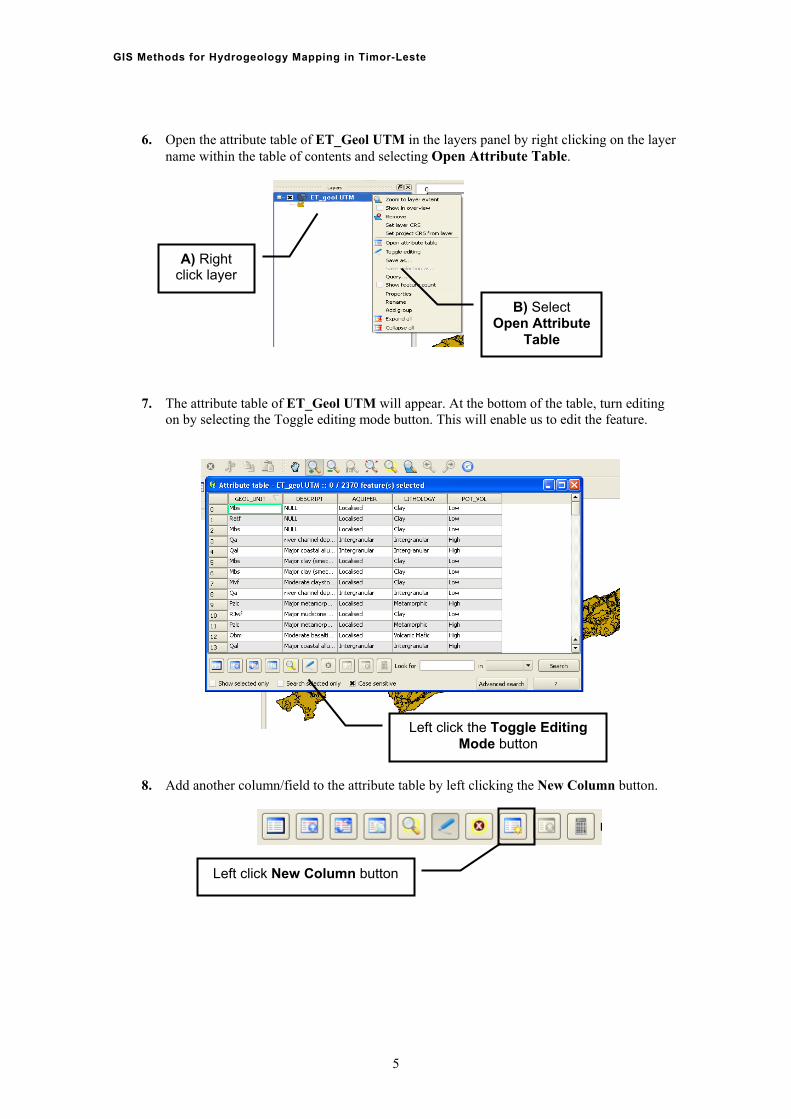
6. Open the attribute table of ET_Geol UTM in the layers panel by right clicking on the layer name within the table of contents and selecting Open Attribute Table.
Ac
) Right lick layer
7. The attribute table of ET_Geol UTM will appear. At the bottom of the ta rn editing
on by selecting the Toggle editing mode button. This will enable ature.
B) Select Open Attribute
Table
ble, tuus to edit the fe
Left click the Toggle Editing Mode button
8. Add another column/field to the attribute table by left clicking the New Column button.
Left click New Column button
5
GIS Methods for Hydrogeology Mapping in Timor-Leste
9. In the Add Attribute box, type Name: Map_Symbol, then under Type, use the drop down arrow and select Text (string) (this means that it will be text and not a number in the field. For the column Width type in 50.
B) Select drop down box and select Text
(string) A) Type in
Map_Symbol
10. Click O
D) Click OK
C) Type in 50 as the width for
the column
Note: Field names cannot have spaces, so we use _(underscores) for spaces.
K.
Resufield
lt: The Map_Symbol field appears as the last in the ibute table. At this stage, the
Map_S attr
ymbol value for all 2,370 features is ‘NULL’.
New Column
6
GIS Methods for Hydrogeology Mapping in Timor-Leste
In the attribute table, cli search button.
11. ck the Advanced
The Search query builder window appears with a list of the attribute table headings (Fields), some calculation buttons (Operators) and a textbox at the bottom into which are typed search expressions (SQL where clause).
Click Advanced search button
Attribute table headings (Fields)
Calculation buttons
(Operators)
12. In the list of attribute table headings (Fields) select the field you want to perform the operation on. In this case, we want to select features based on values in the geological unit field, so double click on Geol_Unit. The field name Geol_Unit will appear in the textbox.
13. Click the = button once. 14. Click the Sample button once.
A list of the unique values in the GEOL_UNIT field will appear in the right-hand window. This is the list of values from which you need to pick to select features meeting your search criteria. First, select all the features whose ge ogical code is defined as Edl.
15. Double click ‘Edl’.
Textbox (SQL where clause)
ol
7
GIS Methods for Hydrogeology Mapping in Timor-Leste
16. Click the OK button.
A) Double click GEOL_UNIT
D) Double click ‘Edl’
C) Click Sample button
B) lick = button once
C
The SQL where clause (or search expression) in the illustration above is asking Quantum to select all the features whose GEOL_UNIT value is Edl In this case, the notice at the top of the attribute table tells you that 13 features have GEOL_UNIT values of Edl (13/2370 features selected).
E) Click OK
The 13 features that match the search criteria are selected
8
GIS Methods for Hydrogeology Mapping in Timor-Leste
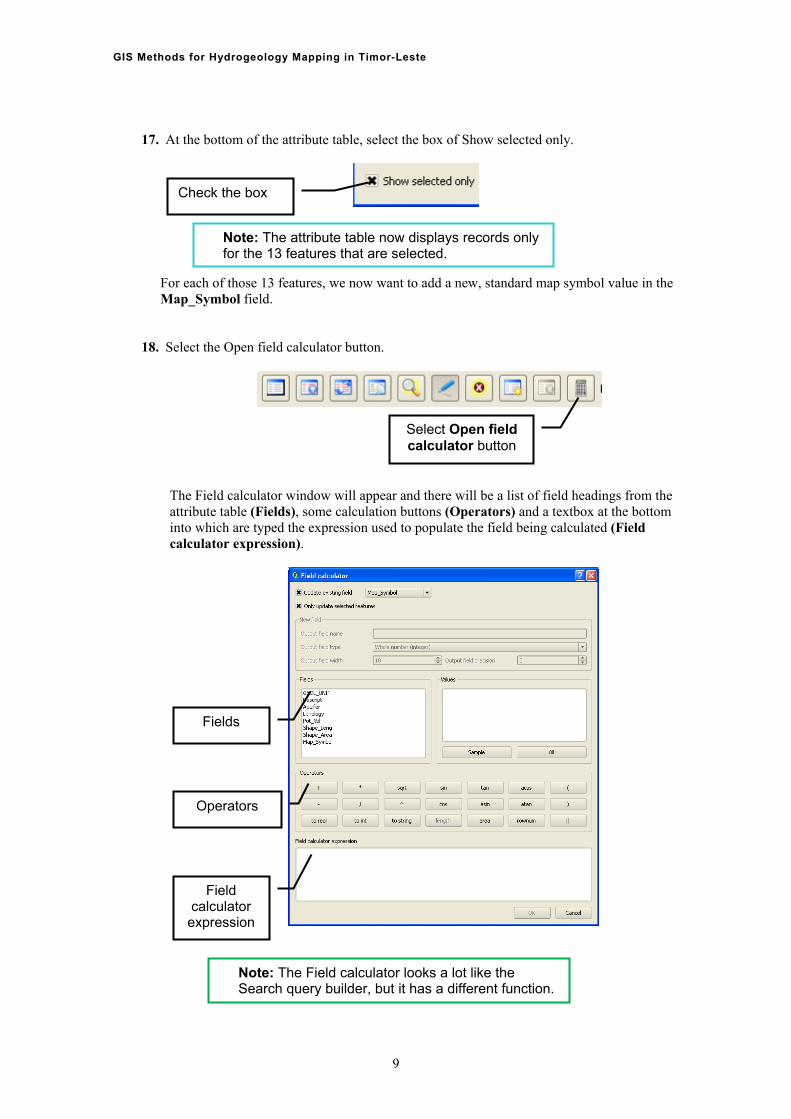
17. At the bottom of the attribute table, select the box of Show selected only.
Check the box
8. Select the Open field calculator button.
For each of those 13 features, we now want to add a new, standard map symbol value in theMap_Symbol field.
Note: The attribute table now displays records only for the 13 features that are selected.
1
Select Open field
calculator button
The Field calculator window will appear and there wil dings from the ields), some calculation buttons (Op at the bottom
ed the expression used to populate the field being calculated (Field ession).
l be a list of field heaerators) and a textboxattribute table (F
into which are typcalculator expr
Fields
Operators
Field calcu
exprelator ssion
Note: The Field calculator looks a lot like the Search query builder, but it has a different function.
9
GIS Methods for Hydrogeology Mapping in Timor-Leste
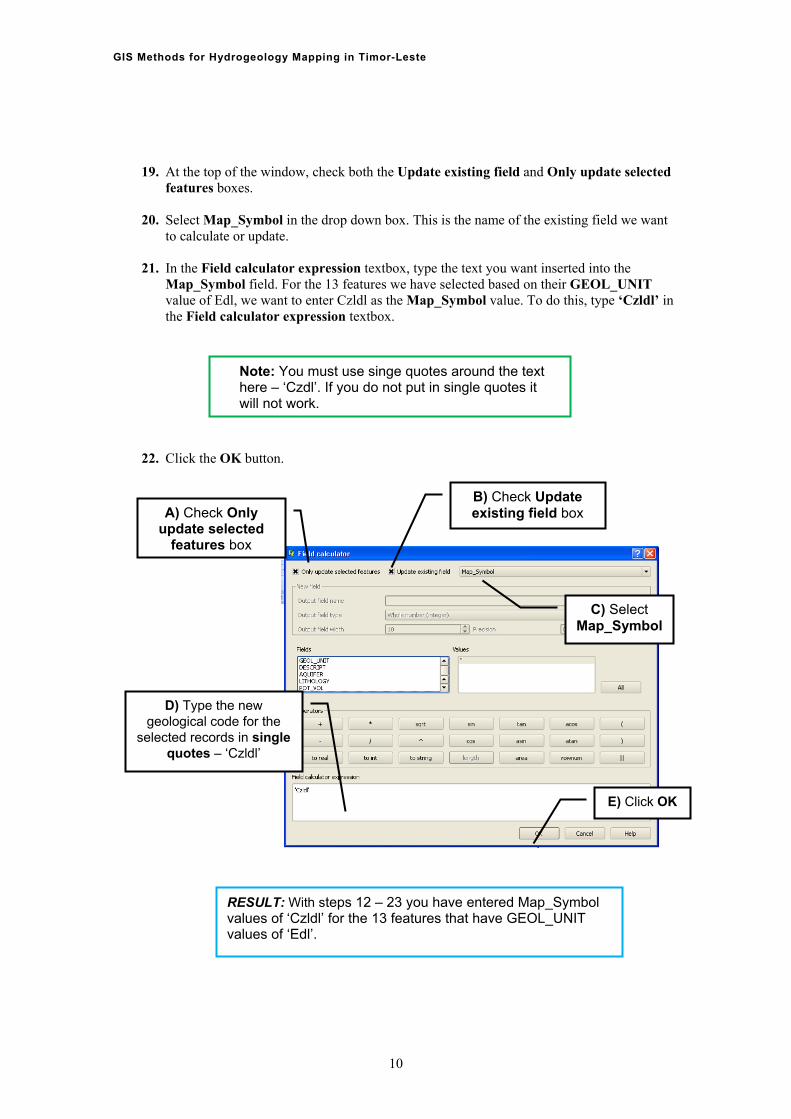
19. At the top of the window, check both the Update existing field and Only update selected features boxes.
20. Select Map_Symbol in the drop down box. This is the name of the existing field we want
to calculate or update.
21. In the Field calculator expression textbox, type the text you want inserted into the Map_Symbol field. For the 13 features we have selected based on their GEOL_UNIT value of Edl, we want to enter Czldl as the Map_Symbol value. To do this, type ‘Czldl’ in the Field calculator expression textbox.
22. Click the OK button.
Note: You must use singe quotes around the text here – ‘Czdl’. If you do not put in single quotes it will not work.
B) Check Uexisting fie
pdate ld box A) Check O
update selec b
nly ted
ox features
C) Select Map_Symbol
D) Type the ngeolog
selectedquo zldl’
ew ical code for the records in single tes – ‘C
E) Click OK
RESULT: With steps 12 – 23 you have entered Map_Symbol values of ‘Czldl’ for the 13 features that have GEOL_UNIT values of ‘Edl’.
10
GIS Methods for Hydrogeology Mapping in Timor-Leste
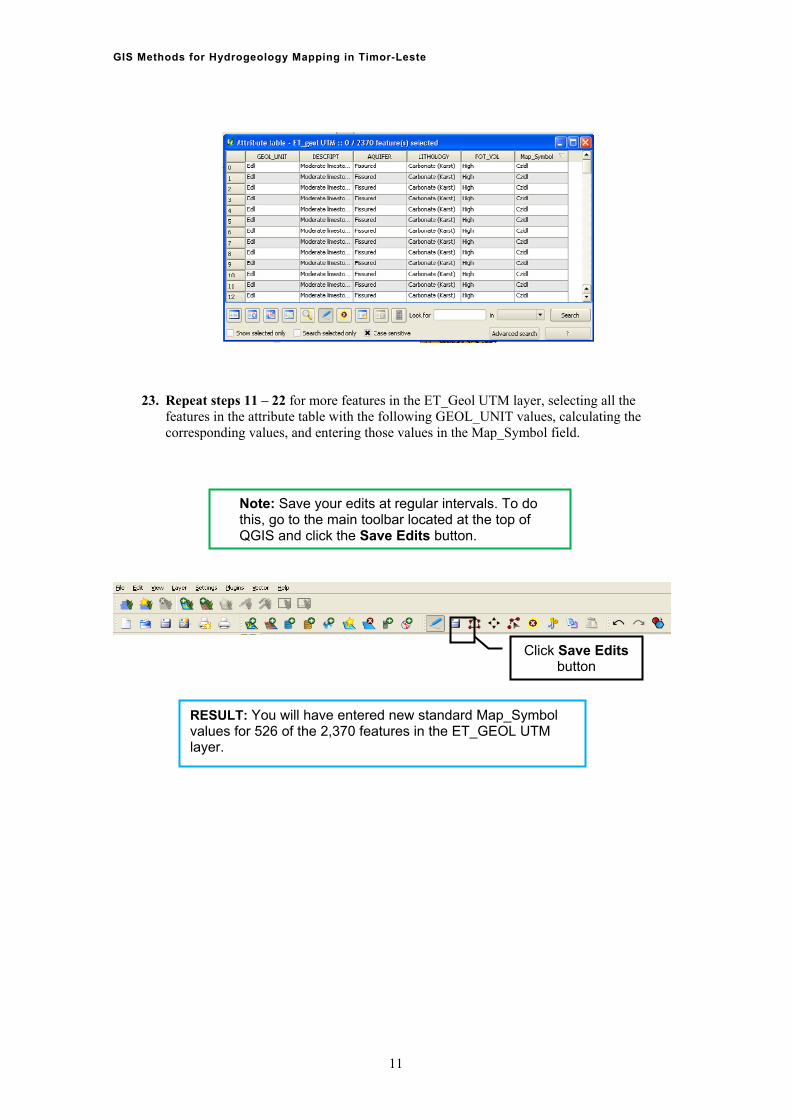
23. Repeat steps 11 – 22 for more features in the ET_Geol UTM layer, selecting all the features in the attribute table with the following GEOL_UNIT values, calculating the corresponding values, and entering those values in the Map_Symbol field.
Note: Save your edits at regular intervals. To do this, go to the main toolbar located at the top of QGIS and click the Save Edits button.
Click Save Edits button
RESULT: You will have entered new standard Map_Symbol values for 526 of the 2,370 features in the ET_GEOL UTM layer.
11
GIS Methods for Hydrogeology Mapping in Timor-Leste
12
Complete the task by calculating Map_Symbol values for the remaining 1,844 features by repeating steps 11-22 for each unique value in the GEOL_UNIT field. Refer to the table in Attachment I (p. 59) which shows corresponding Map_Symbols for all GEOL_UNIT symbols in the attribute table.
24. When you have finished calculating Map_Symbol values, save the changes by clicking the Save Edits button, and then close the editing session by clicking the Toggle Editing button.
A) Click Save Edits to save your work
B) Click Toggle Editing to end editing session
GIS Methods for Hydrogeology Mapping in Timor-Leste
2.2 CALCULATING FEATURE GEOMETRY – AREA AND PERIMETER The layer ET_geol UTM does not yet contain any feature geometry. To complete the exercise in
ection 3.1.1 d to know the area of each individual feature (geological unit) in the layer. In this exercis will calculate the geometry of all 2,370 polygons in ET_geol UTM, and you will enter to two new fields – Area and Perimeter. You will then create two more new fields in which you will convert the area values from square metres to Hectares and Square Kilometres.
1. If it’s not already running, open Quantum GIS and load ET_geol UTM
2. Clic ble button to open the ET_geol UTM attribute table.
S you will neee (2.2) you the data in
k the Open Attribute Ta
Click Open Attribute Table button
Note: The attribute table has 6 fields - GEOL_UNIT, DESCRIPT, AQUIFER, LITHOLOGY, POT_VAL and Map_Symbol, but it does not have an Area or Perimeter field.
13
GIS Methods for Hydrogeology Mapping in Timor-Leste
3. Close the attribute table, then, from the menu bar at the top of the main Quantum GIS window, select Vector – Geometry Tools – Export/Add geometry columns.
A) Select Vector
B) Select Geometry Tools
4. In the Export/Add geometry columns window, select ET_geol UTM from the drop down list 1 layer load efile.
C) Sgeometr
elect Export/Add y columns
as the Input Vector Layer (you have no choice because you currently have onlyed in the Layers panel). Then click Browse to enter the name of the output shap
A) Select ET_geol UTM
B) Click Browse
pe ET_geol
5. In the Save output shapefile window, ty UTM Geometry. Benew shapefile in the C:\Training folder. Then click Save.
careful to save the
A) Select C:\Training folder from dropdown list
C) Click Save
B) Type ET_geol UTM Geometry in File name
14
GIS Methods for Hydrogeology Mapping in Timor-Leste
6. C process t he T
7. To see y click ET_geol UTM Geometry in the Layers panel to make it the active layer, and then click the Open Attribute Table button. The Area and Perimeter fields appear at the right-hand side of the attribute table.
lick OK in the Export/Add geometry columns window and wait for Quantum to he data. Then answer Yes to the question “Would you like to add the new layer to tOC?” Then Close the Export/Add geometry columns window.
our results,
A) Click OK
B) Click
C) Click Close
Yes
Result: You have created a new layer which has added the populated Area and Perimeter fields to the original ET_geol UTM layer.
B) Click the Open Attribute Table button New feature
geometry fields
A) Select ET_geol UTM Geometry to make it the active layer
15
GIS Methods for Hydrogeology Mapping in Timor-Leste
on.
irst, remove the ET_geol UTM layer from the Layers panel as we will not be using it any more uring this course.
8. Right click ET_geol UTM in the Layers panel and select Remove.
We will convert the area data to hectares and square kilometres and we will reduce the level of precision to 1 decimal place, presenting our data in more familiar units and reducing false precisi
Note: The geometry parameters are reported in square metres for Area and metres for Perimeter. They are also reported to six decimal places, a very high level of precision that can be misleading in national ledatasets that are highly generalized, such as the Timor-Leste g
vel eological
dataset we are using here.
Fd
A) Right click ET_geol UTM B) Select Remove
layer
9. Open the attribute table for ET_geol UTM Geometry and activate editing mode by clicking the To e button. Click the Field calculator button. We will use the Field calcul ew fields, Hectares and Sq Km, and at the same time perform the calculations needed to popula hose fields.
ggle editing modator to create two n
te t
A) Clickediting mo
button
Toggle de
B) Click the Open field calculator
button
16
GIS Methods for Hydrogeology Mapping in Timor-Leste
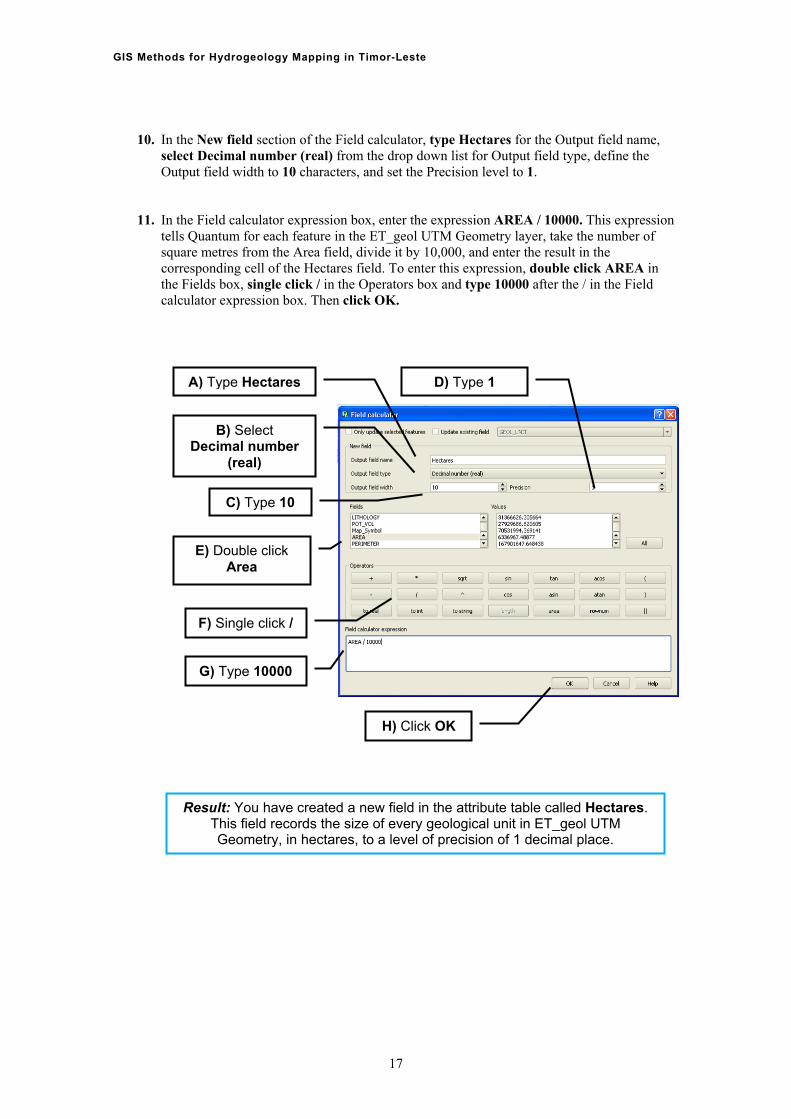
10. In the New field section of the Field calculator, type Hectares for the Output field name, select Decimal number (real) from the drop down list for Output field type, define tOutput field width to 10 characters, and set the Precision level to 1.
11. In the Field calculator expression box, enter the expression AREA / 10000. This expression tells Quantum for each feature in the ET_geol UTM Geometry layer, take the number of square metres from the Area field, divide it by 10,000, and enter the result in the corresponding cell of the Hectares field. To enter this expression, double click AREA in the Fields box, single click / in the Operators box and type 10000 after the / in the Field calculator expression box. Then click OK.
he
A) Type Hectares D)
Type 1
B) Select Decimal number
(real)
C) Type 10
E) Double click Area
F) Single click /
G) Type 10000
H) Click OK
Result: You have created a new field in the attribute table called Hectares. This field records the size of every geological unit in ET_geol UTM Geometry, in hectares, to a level of precision of 1 decimal place.
17
GIS Methods for Hydrogeology Mapping in Timor-Leste
Following the procedures outlined in Steps 9, 10 and 11, create another new field, this one recording the area of each square kilometres.
12. Open the attribute table for ET_geol UTM Geometry and activate editing mode by clicking the butt Click the Field calculator button.
geological unit in
Toggle editing mode on.
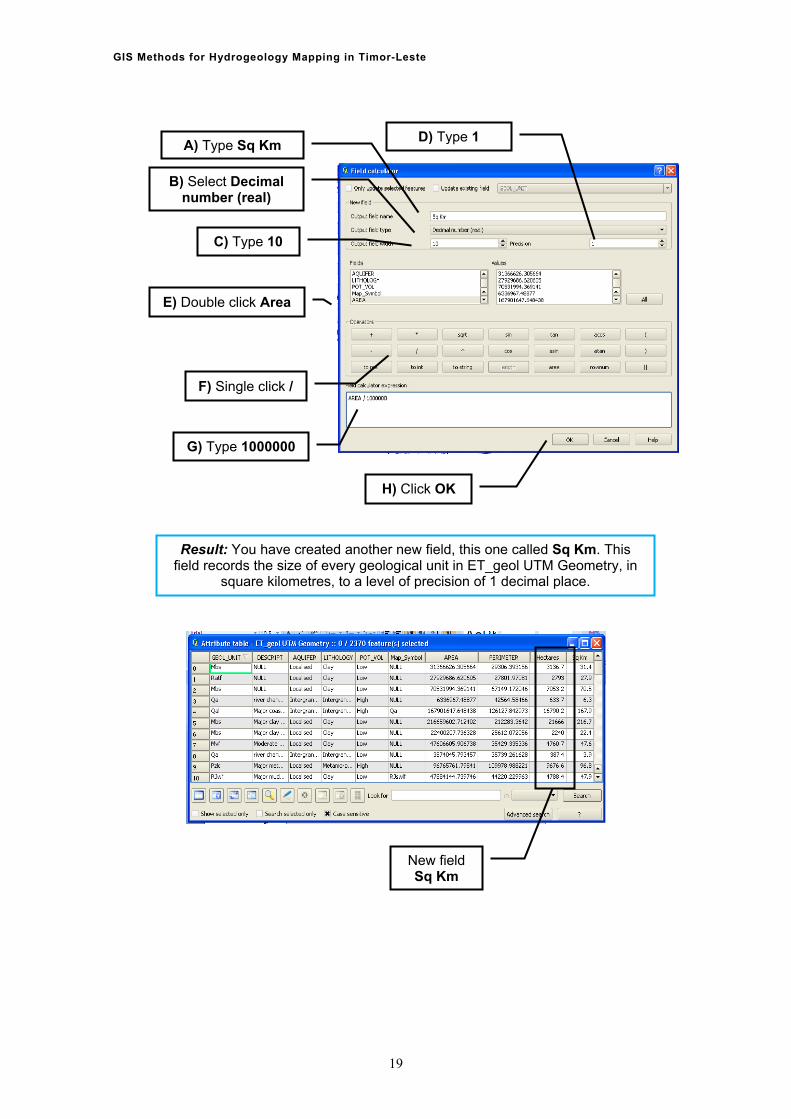
13. In the New field section of the Field calculator, type Sq Km for the O tput field name, select Decimal number (real) from the drop down list for Output field type, define the Output field width to 10 characters, and set the Precision level to 1.
14. In the Field calculator expression box, enter the ssion AREA / 1000000. This expression tells Quantum for each feature in l UTM Geometry layer, take the number of square metres from the Area field by 1,000,000, and enter the result in the corresponding cell of the Sq Km field. To enter this expression, double click AREA in the Fields box, single click / in the Operators box and type 1000000 after the / in the Field calculator expression box. Then click OK.
New field Hectares
B) C Open lick the field calculator
button
A) Click Toggle editing mode
button
u
expre
the ET_geo, divide it
18
GIS Methods for Hydrogeology Mapping in Timor-Leste
A) Type Sq Km D) Type 1
B) Select Decimal number (real)
C) Type 10
E) Double click Area
F) Single click /
G) Type 1000000
H) Click OK
Result: You have created another new field, this one called Sq Km. This field records the size of every geological unit in ET_geol UTM Geometry, in
square kilometres, to a level of precision of 1 decimal place.
New field Sq Km
19
GIS Methods for Hydrogeology Mapping in Timor-Leste
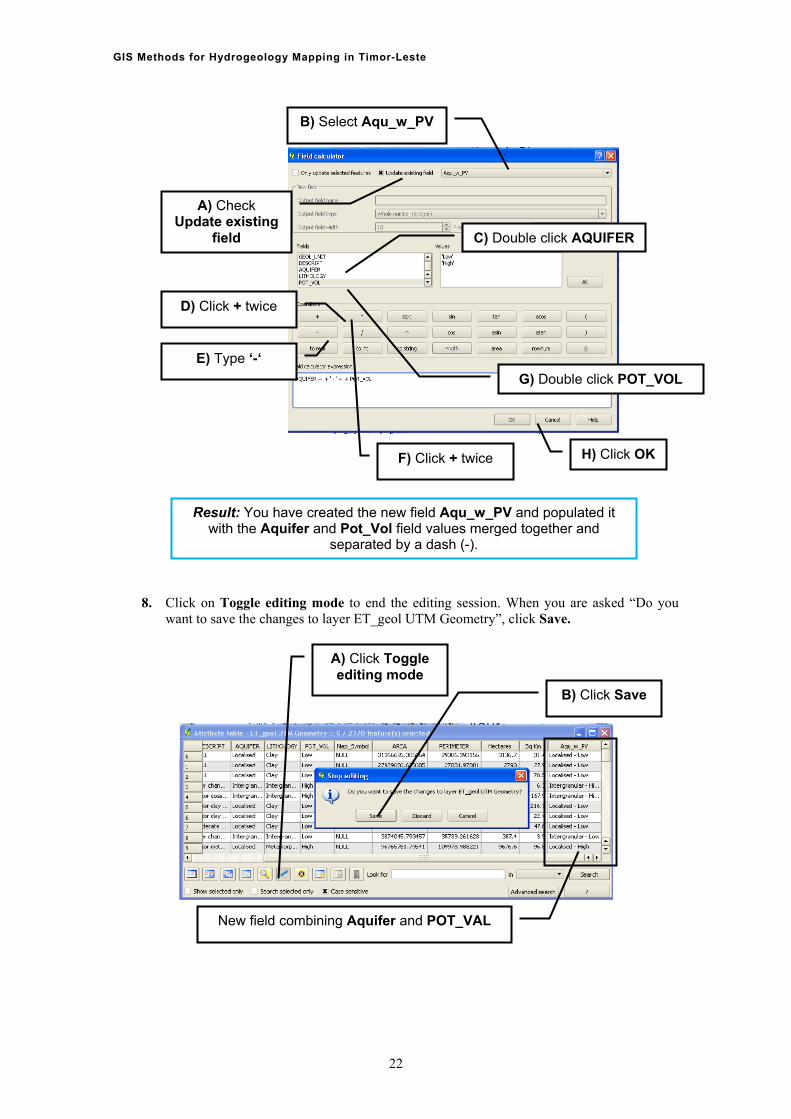
2.3 CREATING AND POPULATING THE HYDROGEOLOGICAL POTENTIAL FIELD One more change is needed in the attribute table before we are ready to start symbolizing the data
raphically. To allow us to symbolize hydrogeological potential effectively on a ap, we need to express both the type of aquifer and the potential volume of groundwater in a single
field d erge the values in the Aquifer field with the values in the Pot Vol (potential volume) f the results in a new field called Aqu_w_PV
1. Turn editing on by selecting the Toggle editing mode button.
and viewing it cartogm
. To o this we’ll mield, and record
2. Open the attribute table of ET_Geol UTM by right cl yer name within the table of contents and selecting Open Attribute Table.
Click on the Toggle editing ode button m
icking on the la
B) Select Open attribute table
A) Right click layer
. Add another column/field to the attribute table by selecting the New Column button. 3
Select New Column button
20
GIS Methods for Hydrogeology Mapping in Timor-Leste
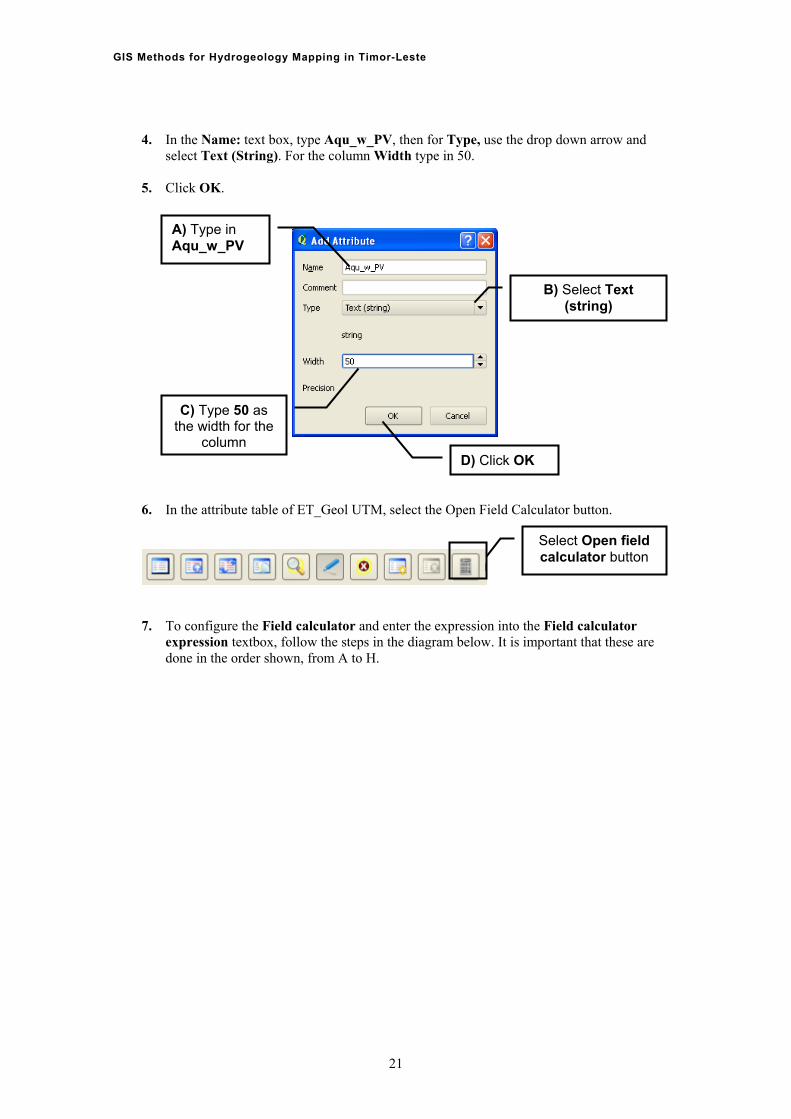
4. In the Name: text box, type Aqu_w_PV, then for Type, use the drop down arrow and select Text (String). For the column Width type in 50.
5. Click OK.
A) Type in _PV Aqu_w
B) Select Text (string)
6. In th
C) Type 50 as
column the width for the
D) Click OK
e attribute table of ET_Geol UTM, select the Open Field Calculator button.
Select Open field calculator button
7. To configure the Field calculator and enter the expression into the Field calculator expression textbox, follow the steps in the diagram below. It is important that these are done in the order shown, from
A to H.
21
GIS Methods for Hydrogeology Mapping in Timor-Leste
B) Select Aqu_w_PV
8. Click on Toggle editing mode to end the editing session. When you are asked “Do you want to save the changes to layer ET_geol UTM Geometry”, click Save.
New field combining Aquifer and POT_VAL
A) Check Update existing
field C) Double click AQUIFER
H) Click OK
D) Click + twice
E) Type ‘-‘
G) Dou OL ble click POT_V
F) Click + twice
Result: You have created the new field Aqu_w_PV and populated it with the Aquifer and Pot_Vol field values merged together and
separated by a dash (-).
A) Click Toggle editing mode
B) Click Save
22
GIS Methods for Hydrogeology Mapping in Timor-Leste
23
9. Click the Save Project button and save your project as C:\Training\Hydrogeology Mapping Exercises.qgs
A) Click Save Project B) Navigate to C:\Training folder
C) Type in File name Hydrogeology Mapping
Exercises.qgs
D) Click Save
You have now completed the modifications to the at hanges you made are necessary preparation for the next set of exercises mbolize different geological and hydrogeological characteristics on maps, and f r the spatial analysis exercises that follow.
tribute table. The c which you will sy in
o
GIS Methods for Hydrogeology Mapping in Timor-Leste
3 Symbolizing Geological Characteristics L STANDARD COLOURS
ssuming you have completed entering Map_Symbol data for all the features in the ET_geol UTM eometry layer, you will now display the data with the standard colours used for symbolizing eological units.
1. Start Quantum GIS and open C:\Training\Hydrogeology Mapping Exercises.qgs, the project file you saved at the end of the previous ex
3.1 SYMBOLIZING GEOLOGY WITH INTERNATIONA AGg
ercise.
2. Right click the ET_geol UTM Geometry layer in the table of contents and select Properties.
A) Click File
C) Select C:\Training\Hydrogeology
Mapping Exercises.qgs
B) Select Open Recent Projects
A) Right click the ET_geol UTM
Geometry layer B) Select Properties
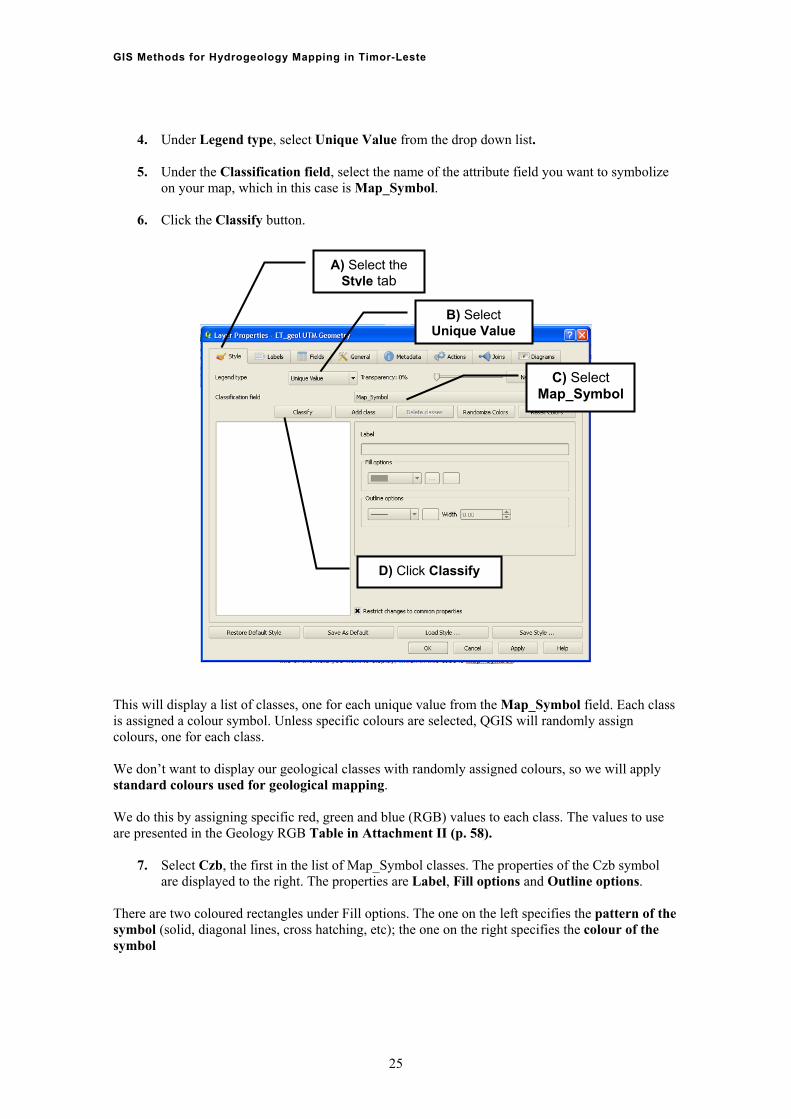
3. In the window that opens select the Style tab.
24
GIS Methods for Hydrogeology Mapping in Timor-Leste
4. Under Legend type, select Unique Value from the drop down list.
5. Under the Classification field, select the name of the attribute field you want to symbolize on your map, which in this case is Map_Symbol.
6. Click the Classify button.
A) Select the Style tab
B) Select Unique Value
This will display a list of classes, one for each unique value from the Map_Sym class is assigned a colour symbol. Unless specific colours are selected, QGIS will randcolours, one for each class. We don’t want to display ur geological classes with randomly assigned colo s, so we wtandard colours used for geological mapping.
e do this by assigning specific re ue (RGB) values to each class. T se
re presented in the Geology RGB Table in Attachment II (p. 58).
e properties of the Czb symbol are displayed to the right. The properties are Label, Fill options and Outline options.
There are two coloured rectangles under Fill options. The one on the left specifies the pattern of the symbol (solid, diagonal lines, cross hatching, etc); the one on the right specifies the colour of the symbol
bol field. Each omly assign
o ur ill apply s
W d, green and bl he values to ua
7. Select Czb, the first in the list of Map_Symbol classes. Th
C) Select ol Map_Symb
D) Click Classify
25
GIS Methods for Hydrogeology Mapping in Timor-Leste
8. Click the rectangle on the right to change the colour of the symbol for the Czb class.
A) Select Czb class
B) Click the coloured rectangle
The Select Colour window will appear.
A) Type 255
B) Type 110
9. Referring to the Geology RGB Table in Attachment II (p. 58), type in the Red, Green and
C) Type 10 D) Click OK
Blue values for the Czb class into the appropriate boxes.
10. Click OK.
26
GIS Methods for Hydrogeology Mapping in Timor-Leste
11. Repeat steps 7 to 10 for each geology class in the list. Click the Save Project button at regular and frequent intervals to save your work and ensure changes are not lost.
12. Click OK on the Layer Properties window.
Your map should look something like this.
Click Save Project to save your work
Once you have specified the RGB values of the standard symbols for all the geological classes, save the symbol properties in a Style File with a .qml extension as shown below. By applying a Style File, you will be able to automatically assign the standard symbols to your ET_geol UTM Geometry layer, thus avoiding the procedure of re-entering all the RGB values manually each time you load it.
27
GIS Methods for Hydrogeology Mapping in Timor-Leste
13. Right click ET_geol UTM Geometry in the layers panel and select Properties.
A) Right click layer
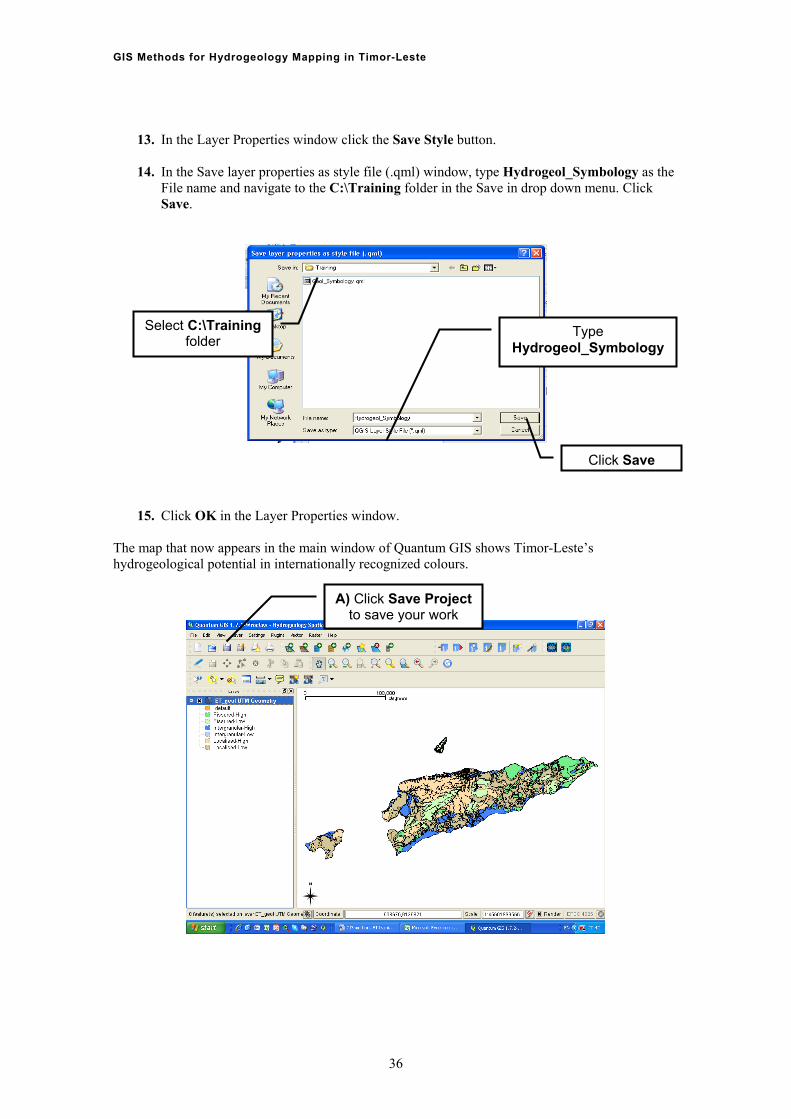
14. In the Layer Properties window click the Save Style button.
B) Select Properties
Click Save Style
28
GIS Methods for Hydrogeology Mapping in Timor-Leste
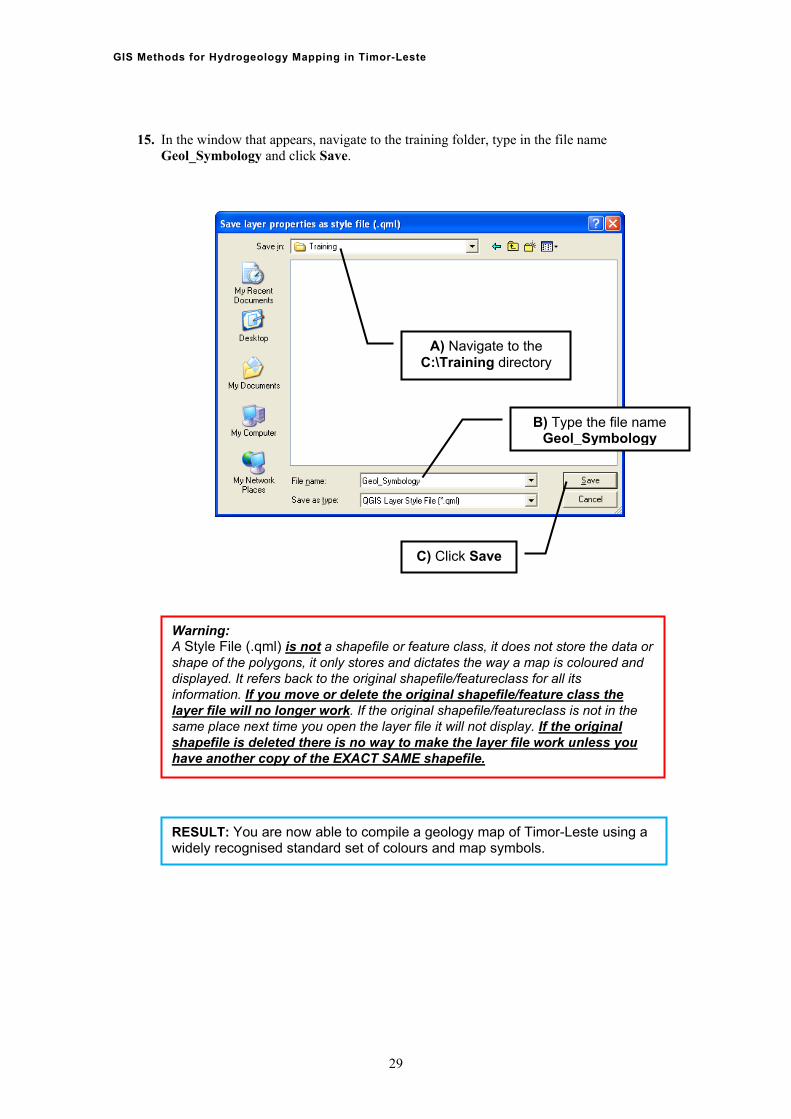
15. In the window that appears, navigate to the training folder, type in the file name Geol_Symbology and click Save.
A) Navigate to thC:\Training d
e irectory
B) Type the file name Geol_Symbology
C) Click Save
Warning: A Style File (.qml) is not a shapefile or feature class, it does not store the data or shape of the polygons, it only stores and dictates the way a map is coloured and displayed. It refers back to the original shapefile/featureclass for all its information. If you move or delete the original shapefile/feature class the layer file will no longer work . If the original shapefile/featureclass is not in the same place next time you open the layer file it will not display. If the original shapefile is deleted there is no way to make the layer file work unless you have another copy of the EXACT SAME shapefile.
RESULT: You are now able to compile a geology map of Timor-Leste using a widely recognised standard set of colours and map symbols.
29
GIS Methods for Hydrogeology Mapping in Timor-Leste
30
cross in the red box at top right. 16. Click the Save Project button to save your work and close Quantum GIS by clicking the
A) Click Save Project to save your work
B) Click here to close Quantum GIS
GIS Methods for Hydrogeology Mapping in Timor-Leste
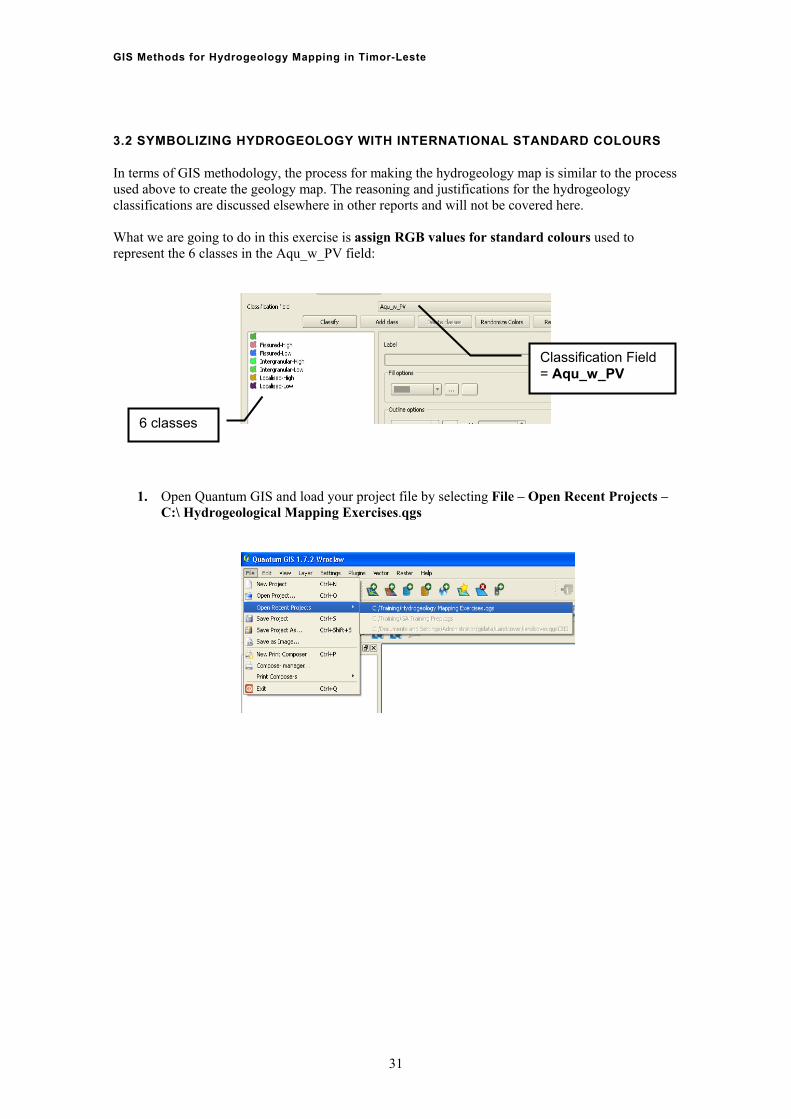
3.2 SYMBOLIZING HYDROGEOLOGY WITH INTERNATIONAL STANDARD COLOURS
In terms of GIS methodology, the process for making the hydrogeology map is similar to the process used above to create the geology map. The reasoning and justifications for the hydrogeology classifications are discussed elsewhere in other reports and will not be covered here. What we are in this exercise is assign RGB values for standard colours used to represent th the Aqu_w_PV field:
going to doe 6 classes in
Classification Field = Aqu_w_PV
6 classes
1. Open Quantum GIS and load your project file by selecting File – Open Recent Projects – C:\ Hydrogeological Mapping Exercises.qgs
31
GIS Methods for Hydrogeology Mapping in Timor-Leste
2. Right click ET_geol UTM Geometry in the Layers panel and select Properties.
A) Right Click layer
B) Select Properties
3. In the window that opens select the Style tab. 4. Select Unique Value as the Legend type.
5. Under the Classification Field there is a drop down menu. Select the title of the field you
want to classify, which in this case is Aqu_w_PV.
6. Click the Classify button. This will display the symbols assigned to the 6 unique classes of Aqu_w_PV.
A) SSt
elect the yle tab B) Select Unique
Value as Legend type
C) Select Aqu_w_PV as
Classification field
D) Click Classify
32
GIS Methods for Hydrogeology Mapping in Timor-Leste
The hydrological potential of each geological mapping unit is now displayed in a randomly assignecolour based on the 6 classes in the Aqu_w_PV field. You will now apply international sta
d ndard
olours by entering RGB values for each class from the Hydrogeology Symbol table in Attachment II (p. 60).
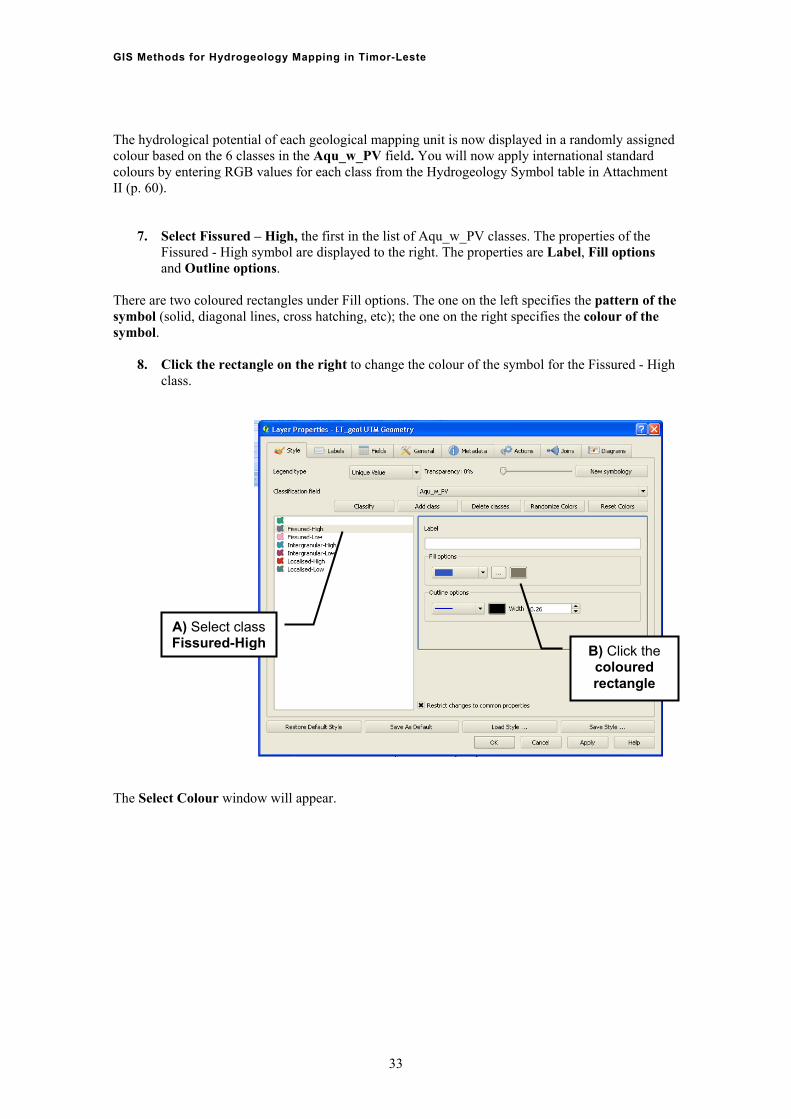
7. Select Fissured – High, the first in the list of Aqu_w_PV classes. The properties of the Fissured - High symbol are displayed to the right. The properties are Label, Fill options and Outline options.
There are two coloured rectangles under Fill options. The one on the left specifies the pattern of the symbol (solid, diagonal lines, cross hatching, etc); the one on the right specifies thesymbol.
8. Click the rectangle on the right to change the colour of the symbol for thclass.
c
colour of the
e Fissured - High
The Select Colour window will appear.
A) Select claFissured-Hi
ss gh
B) Click the coloured rectangle
33
GIS Methods for Hydrogeology Mapping in Timor-Leste
9. Referring to the Geology RGB Table in Attachment II (p. 58), type the Red, Green and Blue values for the Fissured - High class into the appropriate boxes. Click OK.
A) Type 117
B) Type 240
10. Repeat steps 7 to 9 for each hydrological potential class in the list. Click the Save Project button at regular and frequent intervals to save your work and ensure changes are not lost.
C) Type 140 D) Click OK
Click Save Project frequently and regularly
Click OK
34
GIS Methods for Hydrogeology Mapping in Timor-Leste
11. Click OK in the Layer Properties window.
RESULT: You are now able to compile a hydrogeological potential map of Timor-Leste using the internationally recognized set of colours
Just as you saved the international standard symbols you specified for the classes in youap, save the symbols you have just specified for the hydrogeolo
r geology gical potential classes. Again, you
o this by saving a Style File (.qml). 12. Double click on ET_geol UTM G rs panel. This is another way of
opening the Layer Properties window.
md
eometry in the Laye
A) Double click ET_geol UTM
Geometry
B) Click Save Style
35
GIS Methods for Hydrogeology Mapping in Timor-Leste
13. In the Layer Properties window
click the Save Style button.
14. In the Save layer properties as style file (.qml) window, type Hydrogeol_Symbology as the . Click
Save. File name and navigate to the C:\Training folder in the Save in drop down menu
15. Click O perties window. The map that now e main window of Quantum GIS shows Timor-Leste’s hydrogeologica ernati lly reco ized colours.
K in the Layer Pro
appears in thl potential in int ona gn
Select C:\Training folder
Type Hydrogeol_Symbology
Click Save
A) Click Save Project to save your work
36
GIS Methods for Hydrogeology Mapping in Timor-Leste
4 Spatial Analysis 4.1 CALCULATING AREAS OF HYDROGEOLOGICAL POTENTIAL CLASSES Objectives: Find the answers to the following questions by analysing your hydrTimor-Leste:
is the total land area of Timor-Leste? the area of each of the 6 hydrogeological potential classes? oportion of Timor-Leste’s total land area does each class represent?
Rec ers in this table:
Area (sq km) % Timor-Leste
ogeological data for
1) What2) What is 3) What pr
ord your answ
Fissured - High
Fissured - Low Intergranular - High Intergranular - Low
Localised - High
Localised - Low
Timor-Leste Create a new project for this exercise – do not open the project you saved your earlier work in.
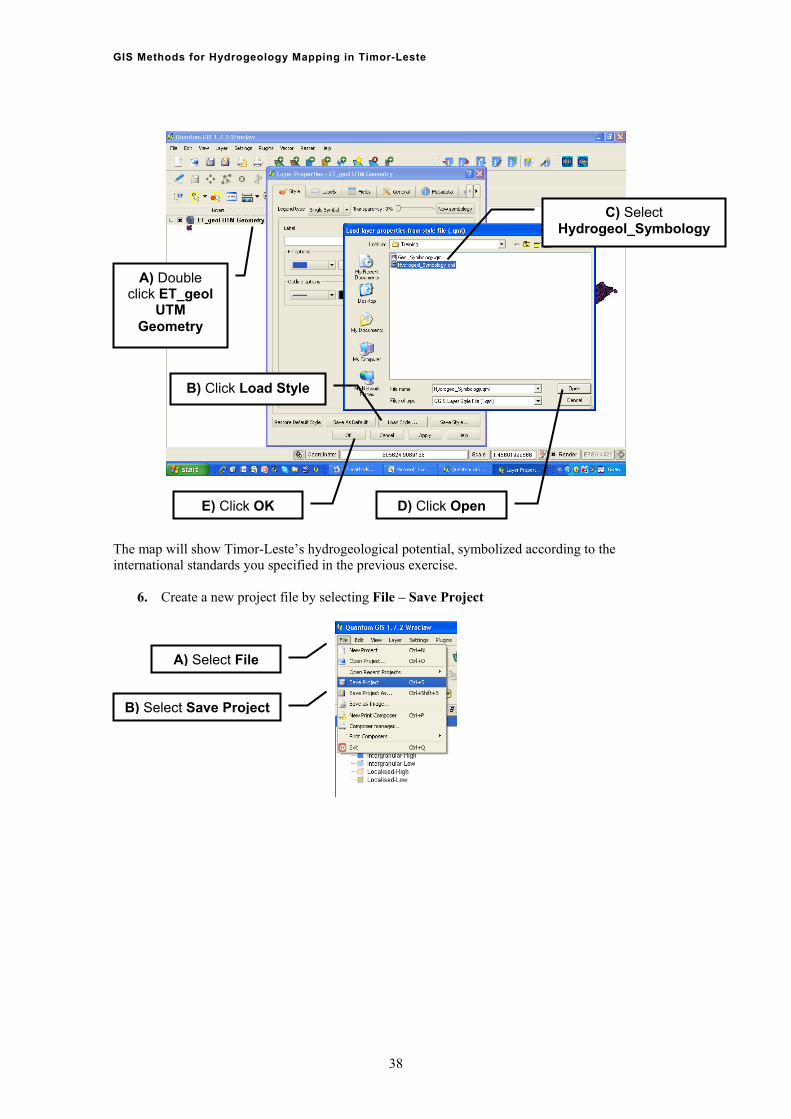
1. Start Quantum GIS and load the vector layer ET_geol UTM Geometry. You will notice the layer is represented with a single symbol – it is not classified yet.
2. Double click the name of the layer in the Layers panel to open the Layer Properties -
ET_geol UTM Geometry window.
3. Click Load Style in the Layer Properties box
4. Select C:\Hydrogeol_Symbology.qml from the Load Layer properties from style file window, then click Open
5. Click OK
37
GIS Methods for Hydrogeology Mapping in Timor-Leste
C) Select Hydrogeol_Symbology
A) Douclick ET
UTM Geometry
ble _geol
The ap will show Timor-Leste’s hydrogeological potential, symbolized acm
rnacording to the
e tional standards you sp
6. Create a new project file by selecting File – Save Project
int
ecified in the previous exercise.
B) Click Load Style
E) Click OK D) Click Open
A) Select File
B) Select Save Project
38
GIS Methods for Hydrogeology Mapping in Timor-Leste
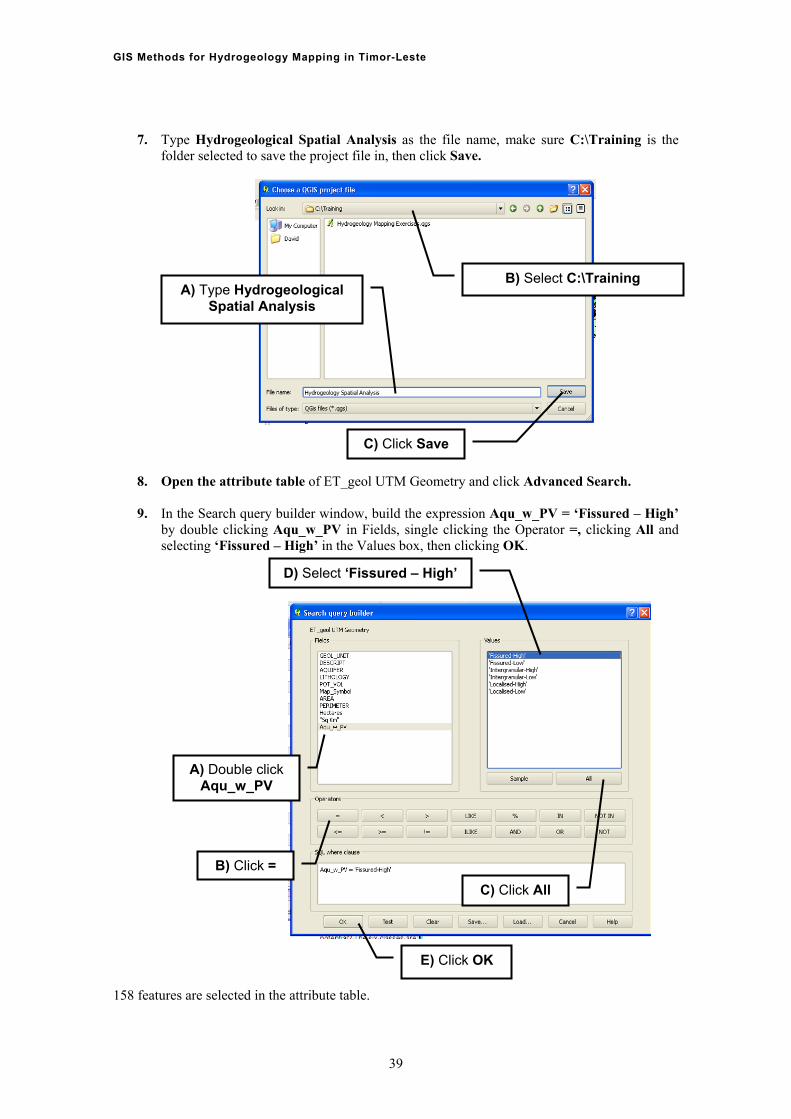
7. Type Hydrogeological Spatial Analysis as the file name, make sure C:\Training is the folder selected to save the project file in, then click Save.
B) Select C:\Training A) Type Hydrogeological
Spatial Analysis
8. Open the attribute table eol UTM Geometry and click Advanced Search.
9. In the Searc indow, build the expression Aqu_w_PV = ‘Fissured – High’ by double clicking Aqu_w_PV in Fields, single clicking the Operator =, clicking All and selecting ‘Fissured – High’ in the Values box, then clicking OK.
C) Click Save
of ET_g
h query builder w
A) Double click Aqu_w_PV
C) Click All
B) Click =
158 features are selected in the attribute table.
D) Select ‘Fissured – High’
E) Click OK
39
GIS Methods for Hydrogeology Mapping in Timor-Leste
10. In the attribute table, check Show selected only. The table now displays only the records for the 158 features that have Fissured – High values in their Aqu_w_PV fields.
B) Click to close attribute table
158 features selected
A) Check Show selected only
11. Close the attribute table to return to the main Quantum GIS window. Notice some polygons on the map are coloured yellow. These are the 158 features you just selected.
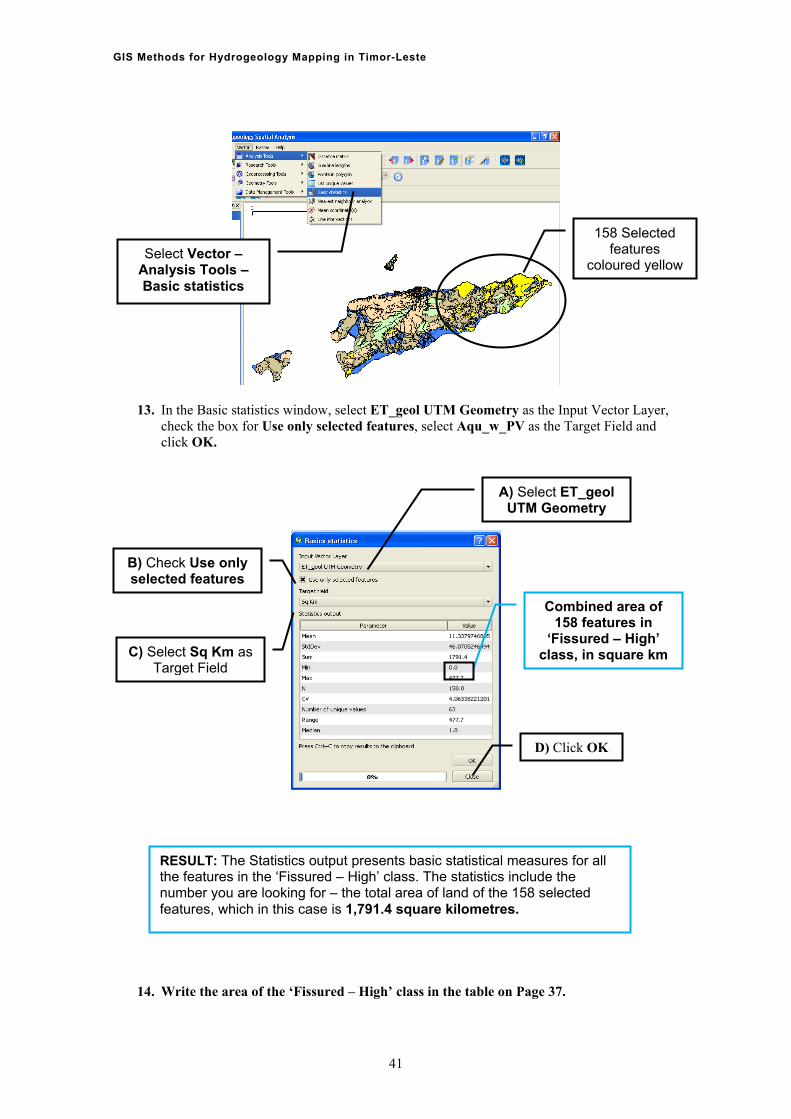
12. Select Vector – Analysis Tools – basic Statistics from the main m
All features selected in Fissured – High class
enu bar.
40
GIS Methods for Hydrogeology Mapping in Timor-Leste
13. In the Basic statistics window, select ET_geol UTM Geometry as the Input Vector Layer, d
check the box for Use only selected features, select Aqu_w_PV as the Target Field anclick OK.
14. Write the area of the ‘Fissured – High’ class in the table on Page 37.
SeAnaBasic s
lect Vector – lysis Tools –
tatistics
158 Selected features
coloured yellow
A) Select ET_geol UTM Geometry
B) Check Use only selected features
Combined area of 158 features in
‘Fissured – High’ class, in square kmC) Select Sq Km as
Target Field
D) Click OK
RESULT: The Statistics output presents basicthe features in the ‘Fissured – High’ class. Th
statistical measures for all e statistics include the
number you are looking for – the total area of land of the 158 selected features, which in this case is 1,791.4 square kilometres.
41
GIS Methods for Hydrogeology Mapping in Timor-Leste
42
ust he yellow highlights on your map will disappear and the
attribute table will report 0/2370 feature(s) selected
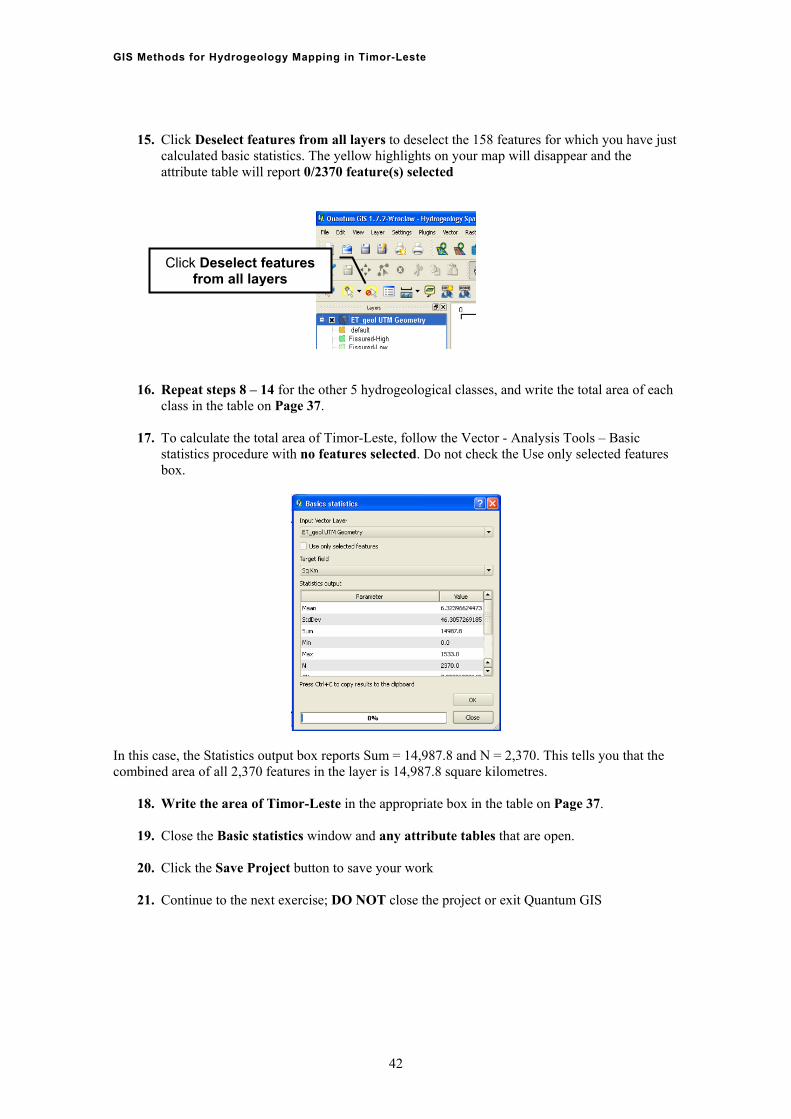
15. Click Deselect features from all layers to deselect the 158 features for which you have jcalculated basic statistics. T
Click Deselect features from all layers
16. Repeat steps 8 – 14 for the other 5 hydrogeological classes, and write the total area of eachclass in the table on Page 37.
s box.
17. To calculate the total area of Timor-Leste, follow the Vector - Analysis Tools – Basic statistics procedure with no features selected. Do not check the Use only selected feature
In this case, the Statistics output box reports Sum = 14,987.8 and N = 2,370. This tells you that the combined area of all 2,370 features in the layer is 14,987.8 square kilometres.
18. Write the area of Timor-Leste in the appropriate box in the table on Page 37.
. Close the Basic statistics window and any attribute tables that are open.
he project or exit Quantum GIS
19
20. Click the Save Project button to save your work
Continue to the next exercise; DO NOT close t21.
GIS Methods for Hydrogeology Mapping in Timor-Leste
4.2 EXPLORING THE RELATIONSHIP BETWEEN HYDROGEOLOGICAL POTENTIAL AND POPULATION CENTRES Objective: To examine the population distribution o e potential vailability of groundwater by answering questions su
What is the groundwater potential for Timor-Leste’s main centres of population? How many population centres are located in each o l classes? Which towns might be concerned that their groundwater resources may be inadequate to
meet future needs? For this exercise you will research spatial relationships between 2 layers of geographic data – ET_geol UTM Geometry (hydrogeological potential) and ET Tow .
1. ET_geol UTM Geometry is already loaded into Quantum GIS. Now load vector layer ET Towns UTM into the same project window. This layer is also stored in the C:\Training folder.
2. Change the symbol used for ET Towns UTM to red dots to make it easier to see them.
e map, but e’re going to make it easier to understand, analyse and report by performing two standard GIS verlay analys olygon and intersect.
Point-in-polygon will calculate how many population centres are located on each of the 2,370 geological mapping units. It will record the data in a new field in the attribute table for ET_geol UTM Geometry.
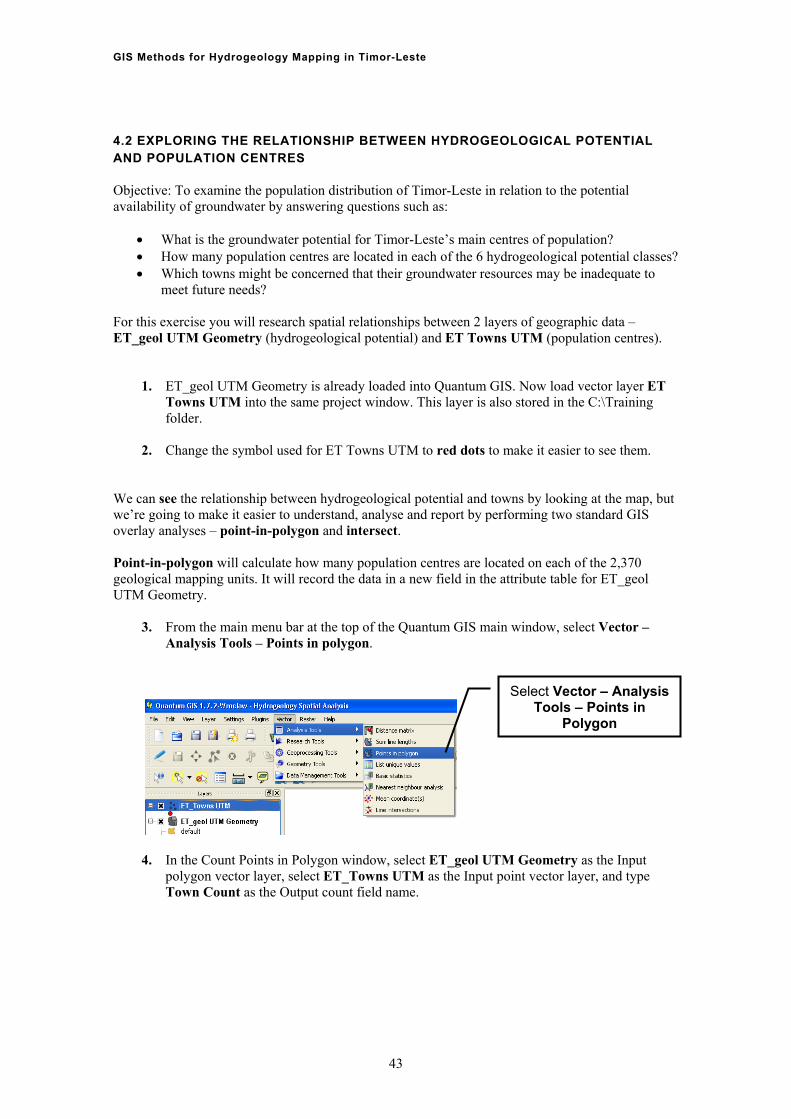
3. From the main menu bar at the top of the Quantum GIS main window, select Vector – Analysis Tools – Points in polygon.
f Timor-Leste in relation to thch as: a
f the 6 hydrogeological potentia
ns UTM (population centres)
e can see the relationship between hydrogeological potential and towns by looking at thW
wes – point-in-po
Select Vector – Analysis Tools – Points in
Polygon
4. In the Count Points in Polygon window, select ET_geol U M Geometry as the Input
polygon vector layer, select ET_Towns UTM as the Input point vector layer, and type
T
Town Count as the Output count field name.
43
GIS Methods for Hydrogeology Mapping in Timor-Leste
5. This procedure generates a new shapefile, so you need to specify a name for it. Browse to C:\Training and type in the Output Shapefile name Geology with town count
A) Select ET_geol TM GeometryU
B) Select ET_Towns UTM
C)
6. Answer Yes to the question, Would you like to add the new layer to the TOC?
7. Close the Count Points in Polygon window
8. The new layer, Geology with town count, will load into Quantum GIS and appear in the Layers panel. Select Geology with town count to make it the active layer, and then click the Open Attribute Table button. Scroll all the way to the right-hand side. The new field you just created is appended next to the Aqu_w_PV field.
Type Town Count
D) Browse to C:\Training Geology with
town count and type
E) Click OK
Yes Answer
Click Close
44
GIS Methods for Hydrogeology Mapping in Timor-Leste
9. Click on the field heading Town Count to sort the data based on the values in this fieldClick o
. nce to sort from low to high; click a second time to sort from high to low.
Observations and Interpretation:
Of the Ten geological mappin nits with 2 or more settlements on them, 8 have high
ured, 22 are intergranular and 20 are localized.
Intersect will determine which geological mapping unit each of the 69 towns is located on. It will then append the corresponding attribute values from ET_geol UTM G rd in the ET Towns UTM attribute table.
g upotential groundwater volume and 2 have low potential groundwater volume.
Of the total of 2,370 geological mapping units, 51 have towns on them. Of these 51 units, 27 have high potential groundwater volume and 24 have low potential volume.
Of the 51 geological mapping units with towns on them, 9 are fiss
eometry to each reco
B) Click Open Attribute Table
A) Select Geology with town count as active layer
C) Click field heading to sort records
45
GIS Methods for Hydrogeology Mapping in Timor-Leste
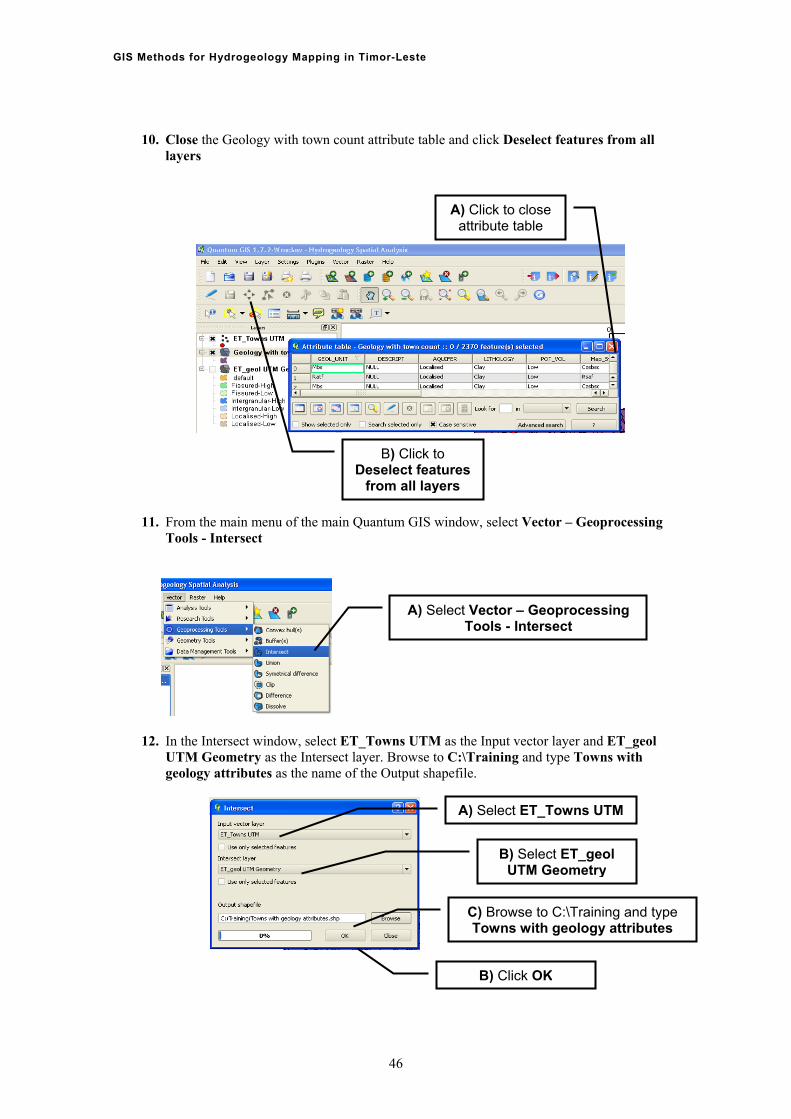
10. Close the Geology with town count attribute table and click Deselect features from all layers
A) Click to close attribute table
11. From the main menu of the main Quantum GIS window, select Vector –
B) Click to Deselect features
from all layers
Geoprocessing Tools - Intersect
A) Select Vector – Geoprocessing Tools - Intersect
12. In the Intersect window, select ET_Towns UTM as the Input vector layer and ET_geol
UTM Geometry as the Intersect layer. Browse to C:\Training and type Towns with geology attributes as the name of the Output shapefile.
A) Select ET_Towns UTM
B) Select ET_geol UTM Geometry
C) Browse to C:\TraininTowns with geology
g and type attributes
B) Click OK
46
GIS Methods for Hydrogeology Mapping in Timor-Leste
13. Answer Yes to the question, Would you like to add the new layer to the TOC? Then Close the Intersect window.
A) Answer Yes
B) Click Close
14. The new layer, Towns with geology attributes, will load into Quantum GIS and appear in the Layers panel. Select Towns with geology attributes to make it the active layer, and then click the Open Attribute Table button. Scroll all the way to the right-hand side. The new field you just created is appended next to the Aqu_w_PV field.
A) Select Towns with
geology attributes
B) Click Open Attribute Table
Example of geological attributes associated with Metinaro Kota
47
GIS Methods for Hydrogeology Mapping in Timor-Leste
48
pretation:
The new layer, Towns with geology attributes, has 69 features, representing Timor-Leste’s District and Sub District capitals. Attributes from the underlying geological mapping unit
untry’s at
lude such as
these might have cause to be concerned about meeting their requirements for water in the future.
n a way that makes them powerful sources of information for research,
This completes the spatial analysis. We will now switch our attention to metadata.
Observations and Inter
are appended to each town’s record in the attribute table. This means we can now easily access and learn about the hydrogeological characteristics of the land each of the comajor settlements sits on, directly from our GIS database. For example, we can see thMetinaro Kota is located on major coastal alluvial deposits (Qssf) and that it is on an intergranular aquifer with potential for high volumes of groundwater.
Of the 69 towns, 43 are on geological units with high potential groundwater volume and 26are on geological units with low potential groundwater volume.
Many of the largest towns in the country – Dili, Baucau, Maliana, Los Palos, Gleno, Suai and Aileu - are on geological units with high potential groundwater volumes.
Large towns that are on geological units with low potential groundwater volumes incViqueque, Manatuto, Ainaro, and Maubisse. As their populations expand, towns
Through spatial analyses you have created two new datasets that are informative, easy to access and manipulate, and structured ianalysis and reporting.
GIS Methods for Hydrogeology Mapping in Timor-Leste
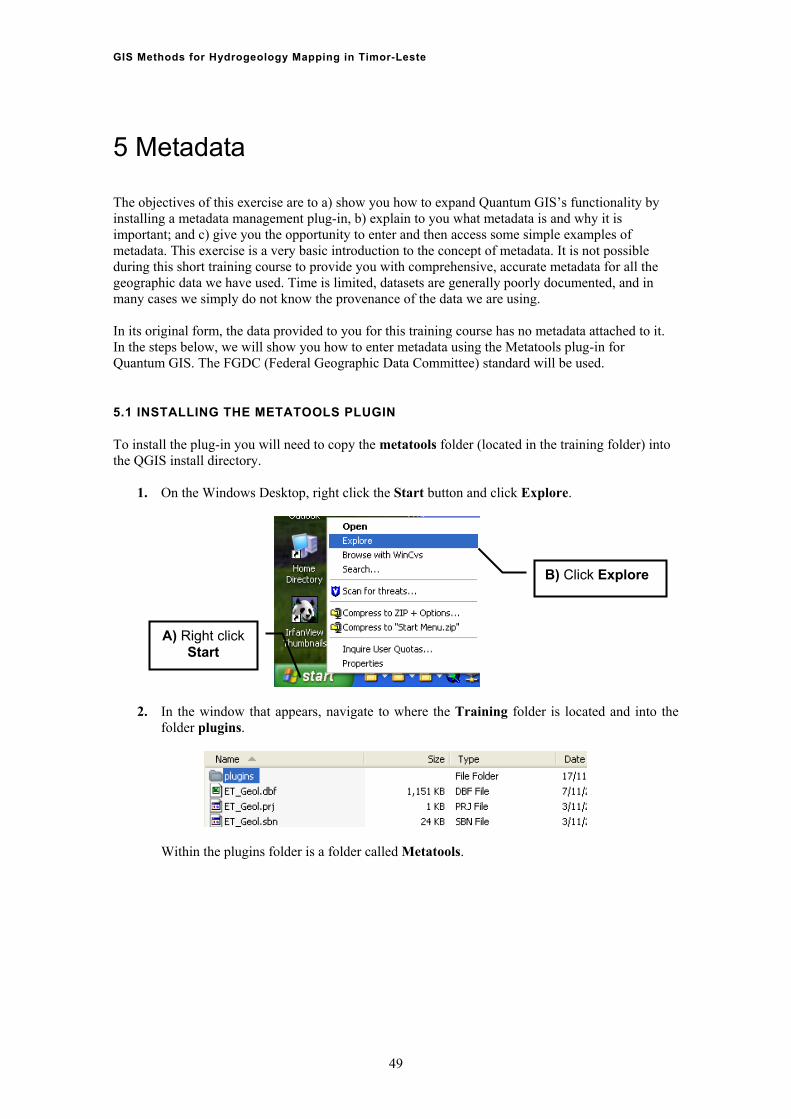
5 Metadata The objectives of this exercise are to a) show you how to expand Quantum GIS’s functionality by installing a metadata management plug-in, b) explain to you what metadata is and why it is important; and c) give you the opportunity to enter and then access some simple examples of metadata. This exercise is a very basic introduction to the concept of metadata. It is not possible during this to provide you with comprehensive, accurate metadata for all the geographic Time is limited, datasets are generally poorly documented, and in many cases we simply do not know the provenance of the data we are using. In its original form, the data provided to you for this training course has no d to it. In the steps below, we will show you how to enter metadata using the MetaQuantum GIS. The FGDC (Federal Geographic Data Committee) standard will be used. 5.1 INSTALLING THE METATOOLS PLUGIN
to copy the metatools folder (located in the training folder) into e
1.
short training course data we have used.
metadata attachetools plug-in for
To install the plug-in you will needth GIS install directory. Q
On the Windows Desktop, right click the Start button and click Explore.
B) Click Explore
A) Right click Start
2. In the window that appears, navigate to where the Training is located and into the
folder plugins. folder
Within the plugins folder is a folder called Metatools.
49
GIS Methods for Hydrogeology Mapping in Timor-Leste
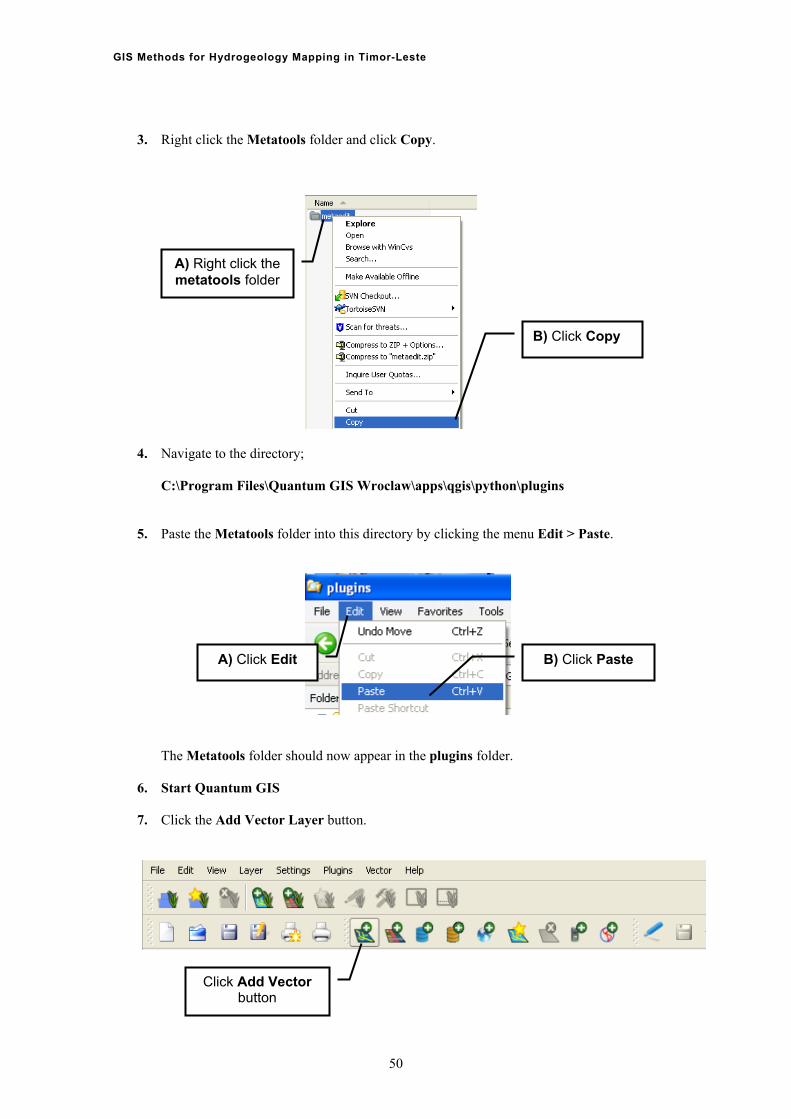
3. Right click the Metatools folder and click Copy.
GIS Methods for Hydrogeology Mapping in Timor-Leste
8. Click the Browse button and navigate to the C:\Training folder.
Select the Browse button
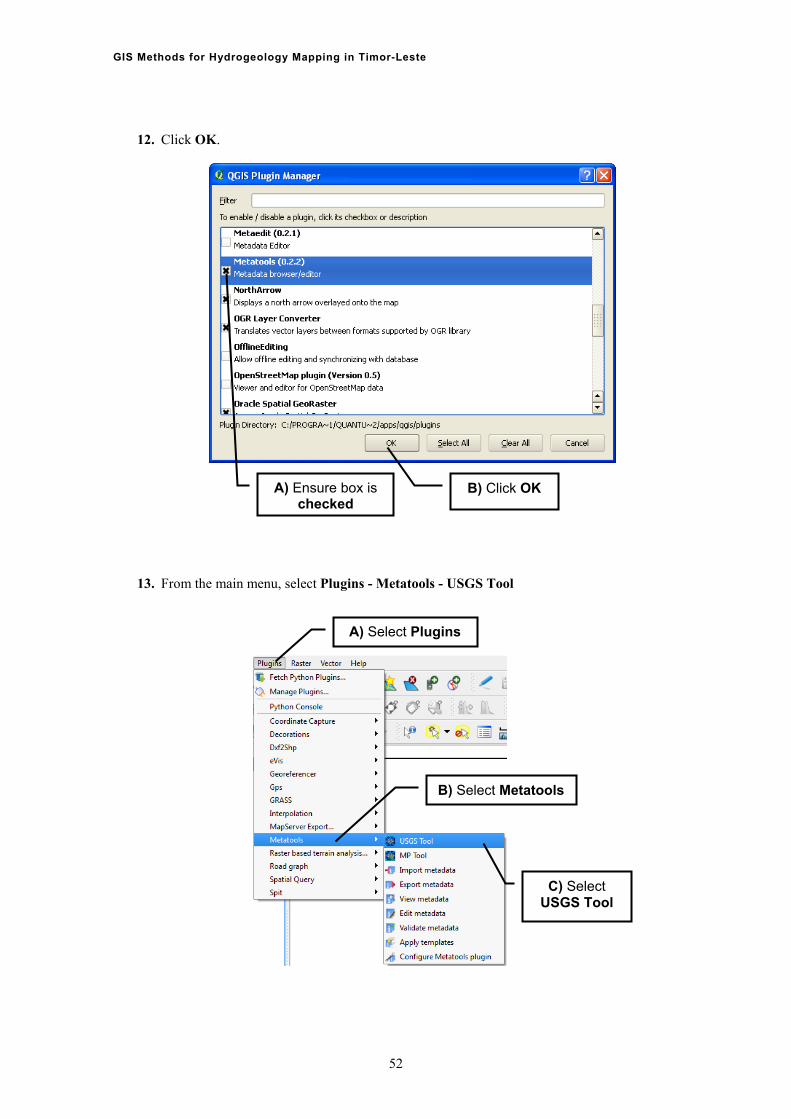
9. Select the geology shape file (ET_geol UTM Geometry.shp) and click Open. 10. From the main menu, select Plugins - Manage Plugins …
A) Select Plugins B) Select Manage
11. In the QGIS Plugin Manager window, check the box next to Metatools (0.2.2).
Plugins …
51
GIS Methods for Hydrogeology Mapping in Timor-Leste
12. Click OK.
A) Ensure box is
checkedB) Click OK
13. From the main menu, select Plugins - Metatools - USGS Tool
A) Select Plugins
B) Select Metatools
C) Select USGS Tool
52
GIS Methods for Hydrogeology Mapping in Timor-Leste
5.2 ENTERING METADATA The USGS window will appear. Here is where we will enter our metadata.
The left hand panel contains the different metadata elements or categories. To populate an element, simply select it and type in the information in the right hand panel. For this training exercise we will update the elements;
Abstract Purpose Use_constraints Contact_person Contact_organization Address_type City State_or_Province Postal_Code Contact_Voice_Telephone
53
GIS Methods for Hydrogeology Mapping in Timor-Leste
Elements
Text area to enter the metadata information
1. Click on the Abstract Element. 2. In the right hand panel type in the following text.
54
GIS Methods for Hydrogeology Mapping in Timor-Leste
Abstract Text
Geology dataset of the whole of Timor-Leste - made from d maps for the mainland
merging the re-interprete
(ETGeo_stcol), Atauro (geology_Atauro), Oecussi (geology_Oecussi) and the South East corner (geology_SEcorner). Currently used as the main geology map in the GA impacts of climate change in East Timor project.
3. Click on the Purpose Element.
4. In the right hand panel type in the followin
g text.
5. Click on the Use Constraints element.
A) Select the Abstract element
B) Type in Abstract text
Purpose Text taset was used as part of the
Groundwater training for DNGRA as well as other Timor-
This particular da
Leste departments.
B) Type in Purpose text
A) Select the Purpose element
55
GIS Methods for Hydrogeology Mapping in Timor-Leste
6. In the right hand panel type in the following text.
Use CoThis dat
nstraints Text aset belongs to the Timor Leste government, it was
ndwater Group in order to do a mapping project in 2010/11. Although there
restrictions given by the Timor Leste government on he department which it came from
should be recognised when using this data. This data should only be used if absolutely necessary and an attempt should be made to contact the relevant Timor Leste government department to confirm use (translator will probably be needed
given to the GA Grougroundwater were nothe use of this data, t
).
B) Type in the Use Constrains text
7. Click on the Contact Person element.
8. In the right hand panel type in your name as the contact person.
A) Select the Use Constraints element
B) Type in your name in the right panel
9. Click on the Contact_Organization element.
A) Select the Contact_Person
element
56
GIS Methods for Hydrogeology Mapping in Timor-Leste
10. In the right hand panel type in the name of your organization. 11. Continue this process for the last 5 elements;
Address type City State_or_Province Postal_Code Contact_Voice_Telephone
12. Once you have entered the information for the above elements, in the top left hand corner click the menu File > Save to save your metadata.
Type in the information for the
last 5 elements
A) Click File
B) Click Save
57
GIS Methods for Hydrogeology Mapping in Timor-Leste
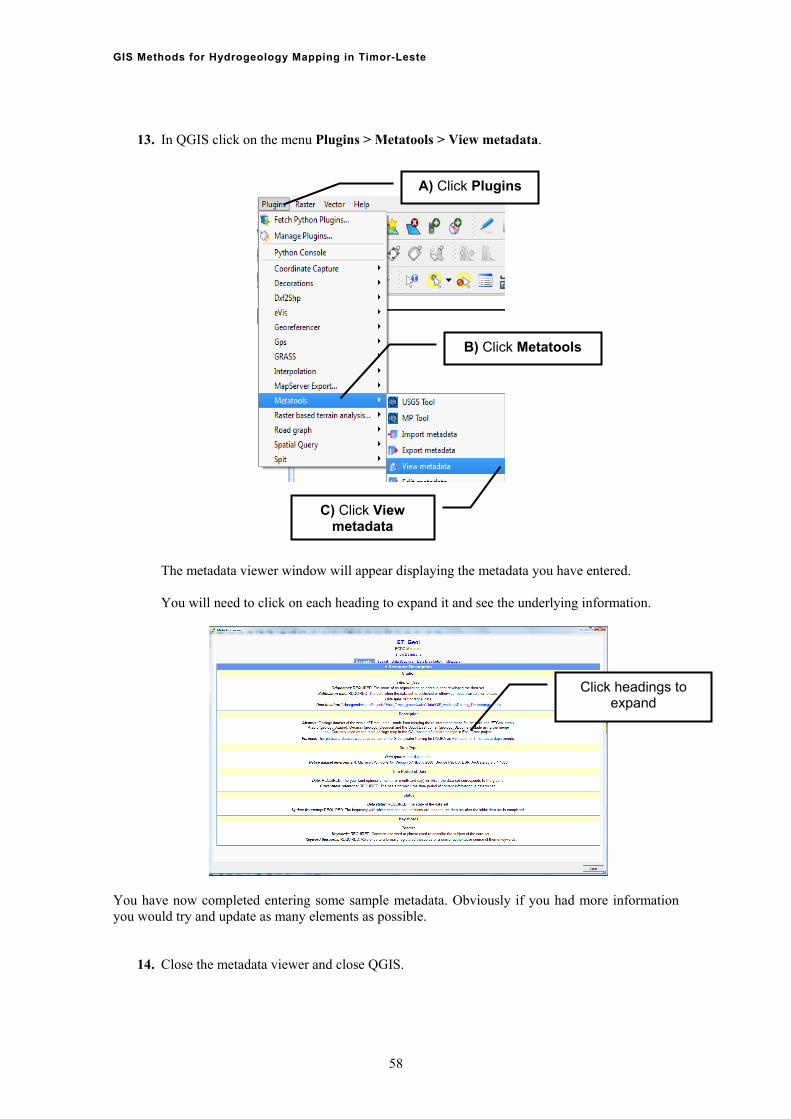
13. In QGIS click on the menu Plugins > Metatools > View metadata.
A) Click Plugins
B) Click Me ols tato
C) Click V metadata
iew
The metad ndow will appear displ metadata ntered.
You will n ick on each heading expa nd see the und ing information.
ata viewer wi aying the you have e
eed to cl to nd it a erly
Click headings to expand
You have now completed entering some sample metadata. Obviously if you had more information
ou would try and update as many elements as possible.
14. Close the metadata viewer and close QGIS.
y
58
GIS Methods for Hydrogeology Mapping in Timor-Leste
ATTACHMENT I - GEOLOGY MAP SYMBOL CONVERSION GUIDE
AP_SYMBOL ORIGINAL GEOL UNIT M
MAP_SYMBOL ORIGINAL GEOL_UNIT
Czb Qvba
Czbbf Obm
Czbmf T
Ptm Palf>as alf
Py alf alf P
mm
Czf Qvd
Czf2 T
Py atf atf P
Py cf cf P
ed
Czlal 1
Py zlc lc P
a
Czlbl P
Py alf>qs salf P
bl
Czlcl Mcl
Czldl E
Qa Qal
Qa2 Qt
dl
Czllgl M
Qdc Qb
lgl
Czlpl P
Qs Qa
pl
Czs W
Czsag P
Qssf Psuf
Qt Ql
lag
Czsbsc Mbs
Czsdc P
RJb RJlb>v
RJ Jwf>s ewlf R
ldc
Czssbc P
RJl RJlb>l
lsc
Czsvf Mvf
KCzssf K
RJl2 RJlb>lb
RJls RJlb
Tsf
Klbl K
RJ Jwf>hp rwlf R
bl
Kswbf K
RJs RJcb
wf
Pe U
RJ Jwf swlf R
b
Pealf P
RJszwlf Shear
alf>v
PJewlf R
RJ Jwf>p twlf R
Jwf>s
Plmf P
Rlaf Raf
mf
Pmalf P
Rsaf Ratf
alf>m
PRbmf RT mv
PRlmf TRPm
Ptalf Palf>a
59
GIS Methods for Hydrogeology Mapping in Timor-Leste
60
22BATTACHMENT II - STANDARD RGB VALUES FOR GEOLOGY & HYDROGEOLOGY SYMBOLS