GIS NEWS GIS News Summer 2013 FINDING RECENTLY SOLD HOUSES IN YOUR NEIGHBORHOOD GIS 101 In the early 2000’s, the Dakota County Assessing Services Department was looking for a way for the public to more easily find Comparable Sales information through the County’s GIS Property Information website (formerly called the Dakota County Real Estate Inquiry). The Office of GIS worked closely with the Assessing Services Department to help provide this information through the application. Since then, the County has updated its Property Information website to take advantage of new technology, and the same is true of the Comparable Sales Information web page. It can now be accessed from any web page through hyperlinking, but it is most commonly accessed from the Dakota County Property Information Search web page. How Does It Work? In order to produce comparable sales information, a query was developed to find properties that have sold on the open market that are similar to - and lie within a certain radius distance to - a particular subject property. The radius from the selected parcel is automatically incremented to a distance where an adequate number of comparable sales properties are found. (Note that the criteria for this query are subject to change at any time and are determined by the Assessing Services Department). When a tax parcel has been selected you will see tax information displayed on the right side of the map. Simply click on Comparable Properties (this is a hyperlink with the selected property as a subject) and a new web page will open (note popup blockers must be turned off!). A map is displayed showing the subject (Green Dot) and similar properties (Red Dots) that have recently sold within the search radius displayed at the top of the map. You have the ability to change the search radius to display information for a larger area if you would like. This map is interactive and can be panned and zoomed by you. If you hover over a point on the map a popup is displayed with a picture and some sales information for that tax parcel. At the bottom of the map is a list of all the comparable sales found, including key building and parcel information. This list is sortable, so you can display information in the list by date of sale, year built, number of bedrooms, etc. As you move the cursor along this list the row that the cursor is currently Property Information tab with Comparable Properties and other property detail links over will highlight, the Dot on the map corresponding to that row will turn yellow and a popup window will display, as it did when the cursor was moved on the map. If you would like to see additional details about the tax parcel simply click on the row in the table or click on the Dot in the map and another window will open displaying the Dakota County Property Card (another page that can be hyperlinked). This information is in a PDF format and can be saved to your computer. Dakota County Comparable Sales Information – New and Improved! by Kent Tupper, Dakota County Office of GIS
Transcript
GIS NEWS
GIS News
Summer 2013
FINDING RECENTLY SOLD HOUSES IN YOUR NEIGHBORHOOD GIS 101
In the early 2000’s, the Dakota County Assessing Services Department was looking for a way for the public to more easily find Comparable Sales information through the County’s GIS Property Information website (formerly called the Dakota County Real Estate Inquiry). The Office of GIS worked closely with the Assessing Services Department to help provide this information through the application.
Since then, the County has updated its Property Information website to take advantage of new technology, and the same is true of the Comparable Sales Information web page. It can now be accessed from any web page through hyperlinking, but it is most commonly accessed from the Dakota County Property Information Search web page.
How Does It Work? In order to produce comparable sales information, a query was developed to find properties that have sold on the open market that are similar to - and lie within a certain radius distance to - a particular subject property. The radius from the selected parcel is automatically incremented to a distance where an adequate number of comparable sales properties are found. (Note that the
criteria for this query are subject to change at any time and are determined by the Assessing Services Department).
When a tax parcel has been selected you will see tax information displayed on the right side of the map. Simply click on Comparable Properties (this is a hyperlink with the selected property as a subject) and a new web page will open (note popup blockers must be turned off!).
A map is displayed showing the subject (Green Dot) and similar properties (Red Dots) that have recently sold within the search radius displayed at the top of the map. You have the ability to change the search radius to display information for a larger area if you would like. This map is interactive and can be panned and zoomed by you. If you hover over a point on the map a popup is displayed with a picture and some sales information for that tax parcel.
At the bottom of the map is a list of all the comparable sales found, including key building and parcel information. This list is sortable, so you can display information in the list by date of sale, year built, number of bedrooms, etc. As you move the cursor along this list the row that the cursor is currently
Property Information tab with Comparable Properties and other property detail links
over will highlight, the Dot on the map corresponding to that row will turn yellow and a popup window will display, as it did when the cursor was moved on the map.
If you would like to see additional details about the tax parcel simply click on the row in the table or click on the Dot in the map and another window will open displaying the Dakota County Property Card (another page that can be hyperlinked). This information is in a PDF format and can be saved to your computer.
Dakota County Comparable Sales Information – New and Improved! by Kent Tupper, Dakota County Office of GIS
What’s Next? The Dakota County Office of GIS is dedicated to giving our citizens and local government easy access to tax information utilizing GIS technologies, and designing them to be easily and efficiently integrated into many different applications and uses. We will continue to update this web page as technology advances, so stay tuned!
Property Card
GIS NEWS
GIS News
Summer 2013
GREENWAYS PROVIDE, IMPROVE AND CONNECT DEPARTMENT SPOTLIGHT
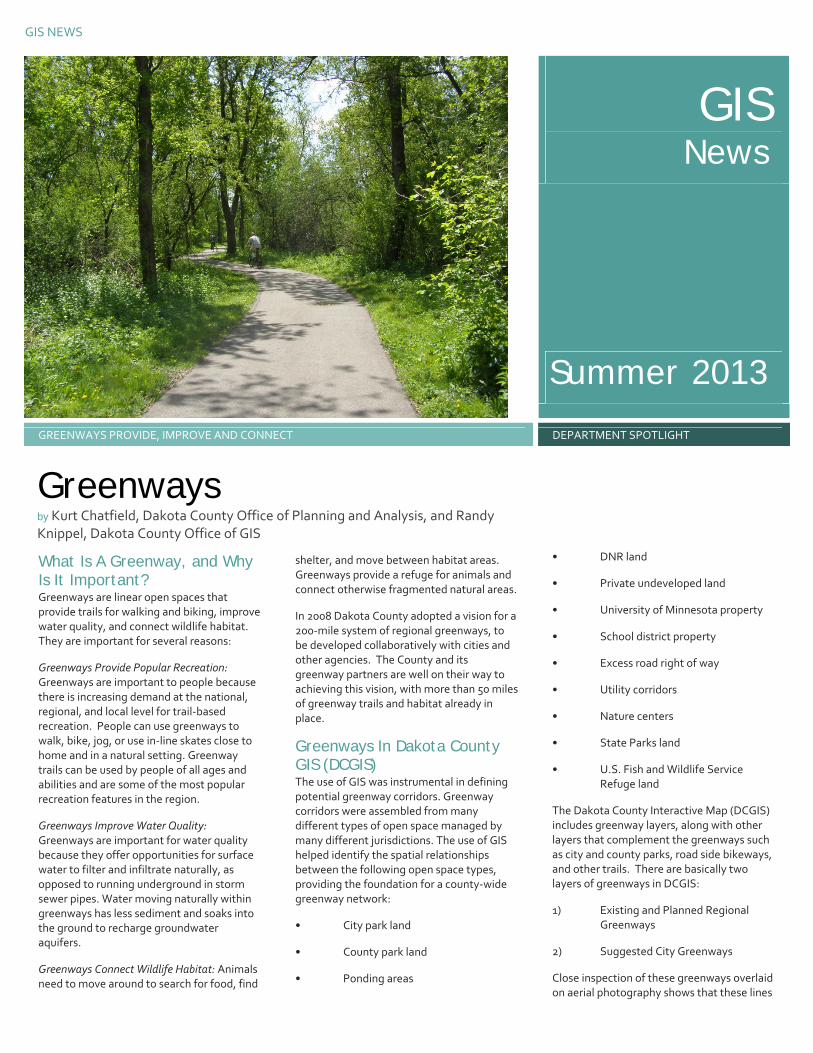
What Is A Greenway, and Why Is It Important? Greenways are linear open spaces that provide trails for walking and biking, improve water quality, and connect wildlife habitat. They are important for several reasons:
Greenways Provide Popular Recreation: Greenways are important to people because there is increasing demand at the national, regional, and local level for trail‐based recreation. People can use greenways to walk, bike, jog, or use in‐line skates close to home and in a natural setting. Greenway trails can be used by people of all ages and abilities and are some of the most popular recreation features in the region.
Greenways Improve Water Quality: Greenways are important for water quality because they offer opportunities for surface water to filter and infiltrate naturally, as opposed to running underground in storm sewer pipes. Water moving naturally within greenways has less sediment and soaks into the ground to recharge groundwater aquifers.
Greenways Connect Wildlife Habitat: Animals need to move around to search for food, find
shelter, and move between habitat areas. Greenways provide a refuge for animals and connect otherwise fragmented natural areas.
In 2008 Dakota County adopted a vision for a 200‐mile system of regional greenways, to be developed collaboratively with cities and other agencies. The County and its greenway partners are well on their way to achieving this vision, with more than 50 miles of greenway trails and habitat already in place.
Greenways In Dakota County GIS (DCGIS) The use of GIS was instrumental in defining potential greenway corridors. Greenway corridors were assembled from many different types of open space managed by many different jurisdictions. The use of GIS helped identify the spatial relationships between the following open space types, providing the foundation for a county‐wide greenway network:
• City park land
• County park land
• Ponding areas
• DNR land
• Private undeveloped land
• University of Minnesota property
• School district property
• Excess road right of way
• Utility corridors
• Nature centers
• State Parks land
• U.S. Fish and Wildlife Service Refuge land
The Dakota County Interactive Map (DCGIS) includes greenway layers, along with other layers that complement the greenways such as city and county parks, road side bikeways, and other trails. There are basically two layers of greenways in DCGIS:
1) Existing and Planned Regional Greenways
2) Suggested City Greenways
Close inspection of these greenways overlaid on aerial photography shows that these lines
Greenways by Kurt Chatfield, Dakota County Office of Planning and Analysis, and Randy Knippel, Dakota County Office of GIS
GIS NEWS 2
form a network representing logical connections between the existing features. Zooming in further, it becomes apparent that the lines connect open areas of undeveloped land. Turning on the parcel layer and identifying ownership of the parcels shows the undeveloped land is primarily owned by the county, city, or school district. At times, it follows a public right of way, or falls within an established utility easement. Although some segments cross private land, it is easy to see how acquiring these additional segments could provide the necessary linkage to the rest of the system.
DCGIS provides opportunities to raise awareness of the potential for collaboration among multiple public agencies by visualizing connections among their respective GIS layers. Analysis of those
layers across the county allows overall strategies to develop, linking the individual layers to form a network. In this case, it helps maximize the use of land investments in the community by showing how they can become interconnected for varying uses.
This same concept applies to a wide variety of public business investments and business processes. Modeling features that support your business processes in GIS and sharing them through DCGIS is a great way to build awareness of those features, to help others discover how they may be related to other business processes, and to illustrate how additional collaboration can maximize their value to the community.
Parks and Trails Parks, Trails & Suggested Greenways
GIS NEWS
GIS News
Summer 2013
EXCITING NEW FEATURES DESKTOP GIS
Need a reason to upgrade to ArcGIS for Desktop 10.1? Well, according to ESRI, there’s a whole laundry list of new features and improved tools, stuff that’s probably pretty cool. But it’s hard to reap the benefits of something if you aren’t aware of what all that cool new stuff is. I have perused the 10.1 ‘what’s new’ documentation and picked out a few delicious little nuggets to share, things that made me think “Yay!” and “Finally!” These are my top picks.
Change Existing Field Names At 10.1, you are finally given the ability to change existing field names! Really! And it’s as easy as setting a field alias. If you need to change a field name, you just type in a new one. No more need to add a field with the desired name, copy your field values to the new field, and then delete the old field. This capability is available through ArcCatalog and only applies to geodatabase tables and feature classes (sorry shapefile users). You simply need to go to the Fields tab of the table or the feature class Properties and type in the new name. That’s it. It won’t work with geodatabases that are older than 10.0, however.
Key Numbering This one is really cool. It’s a huge time saver and will increase the readability of the map, too. When attempting to label features that are clustered too close together to label, the key numbering option automatically numbers the features on the map and creates a key with the feature labels. It
works with auto labeling, so you don’t have to convert to annotation and spend a lot of time manipulating text. You will need to be using the Maplex labeling engine to take advantage of this enhancement. Key numbering is included as a fitting strategy under the label placement properties. Multiple styles can also be created for use on different types of features.
Key Numbering
Dynamic Legends There are a few new legend enhancements worth noting, too. You are now able to automatically include feature counts in the legend, without having to type them in as part of the description. Plus, the legend can be configured to show only features visible in the current extent. As you change the scale of your map, items for features no longer visible on the map will be removed from the legend. Likewise, items will be added to the legend for features that weren’t previously
Feature Counts in Legend
visible. In either case, feature counts are recalculated. These options are found on the Items tab of the Legend Properties.
Additionally, dynamic legends enable you to constrain the legend frame to a fixed size. This means the legend will stay the same size on the map. The stuff in the legend will shrink and grow to fit, instead of the legend itself shrinking and growing. No more adjusting the size and placement of the legend on your layout as the map changes. The layout will remain nicely aligned. The fixed legend size option is set on the Layout tab of the Legend Properties.
For a complete list of the new features and tools to be found in ArcGIS for Desktop 10.1, see http://resources.arcgis.com/en/help/pdf/whats_new_in_arcgis.pdf .
‘What’s New in 10.1?’ – Mary’s Picks by Mary Hagerman, Dakota County Office of GIS
If you are a user of ArcGIS for Desktop and you haven’t looked into using the Maplex labeling engine, you should consider doing so. Maplex is a very powerful and helpful tool that allows the user to create very nice cartographic products and reduce the time spent moving labels or annotation on maps around by hand. Even better, what used to be included only at the ArcInfo license level with ArcMap is now included with all license levels (Basic, Standard and Advanced) at the ArcGIS 10.1 release!
What’s New in 10.1?
Several new features were released with the 10.1 version of the Maplex label engine. Detailed information, tutorials, examples and tips can be found on Esri’s website, where they have numerous sources of helpful information including blog posts, “best practices” and proceedings from Technical Workshops on labeling from the 2012 International User Conference. Two of the most exciting Maplex features are the “Key Numbering” and “Straddle Lines” features, and those are what we will focus on here.
Figure 1. A street map without Key Numbering
Key Numbering
Key numbering allows a user to automatically generate a numbered list of labels for areas where the density of features to be labeled is too great to allow for the appropriate number of labels to appear. A good example of this is when labeling street segments.
Maplex will automatically generate a numbered list of street names and then label
Figure 2. The same area using Key Numbering
the street segments with the corresponding number from the list. This can very useful on a small scale map, or in areas of high density streets.
You can see in Figure 2 how utilizing Key Numbering with Maplex results in more streets being identified. Where segments of streets are either too short or too densely packed to be labeled, they are given a number. Maplex then generates a corresponding numbered list where ever white space is available on the map and
Harnessing the Power of Maplex in ArcMap by Todd Lusk, Dakota County Office of GIS
GIS NEWS 2
labels the street segments with the appropriate numbers.
Straddle Lines
Another new feature added to Maplex at ArcGIS 10.1 is the ability to have labels “straddle” lines. This feature is another useful method for fitting in labels when the density of features is too high to display all of the labels, or a feature length is too short to adequately display a longer label. A good example of when this can occur is on street.labels.
As you can see, the label engine does a much better job of fitting labels onto the streets because it is able to utilize more of the available space by “stacking” the labels.
The “straddle lines” option also gives the user the chance to customize how the labels are stacked. There are options for what type of character the line can be broken on (for example, a “special” character, a space, a period, etc.). It can also be configured to specify minimum and maximum lengths of text.
Overall, Maplex is a very powerful and valuable tool. While we only covered a couple of specific topics here, there are many more options available and many more ways the labeling engine can be configured.
Because Maplex is now available at all license levels of ArcGIS, there’s no excuse to not use it! Doing so will make your maps looks nicer, help you be more productive and save you time when it comes to labeling your cartographic products.
Figure 3. Labels before enabling Line Straddling. Figure 4. Labels after enabling Line Straddling