Page 1 :: Geodemographic Analysis of Internet non-use in Leeds Cobain Schofield Geodemographic Analysis of Internet non-use in Leeds Project Brief A Leeds based IT training company is organising an internet training campaign for people who haven’t used the internet before at a local school. The campaign involves the delivery of 5,000 advertisement leaflets to local residents. The project specification states: 1. Identify the top five schools within Leeds that would make the most appropriate locations to run an internet training course for people who have never used the internet before. 2. Identify a ranked list of the top 10 Output Areas (OA) to target a leafleting campaign for 400 leaflets. 3. Identify a range of Output Areas to target the remaining 4,600 leaflets Selecting the top 5 schools Locations of all schools in Leeds were obtained from the Department for Education [1] . The dataset contained a list of all schools past and present, so schools which are either closed, duplicates (ie: primary and secondary schools on the same site) or merged with other schools, were omitted from the dataset leaving 296 schools on unique sites left for analysis. Figure 1 :: Map of Leeds showing OAC Super Groups and ward boundaries, overlaid with locations of all 296 presently open schools and their catchment areas
Transcript
Page 1 :: Geodemographic Analysis of Internet non-use in Leeds Cobain Schofield
Geodemographic Analysis of Internet non-use in Leeds
Project Brief
A Leeds based IT training company is organising an internet training campaign for people who haven’t
used the internet before at a local school. The campaign involves the delivery of 5,000 advertisement
leaflets to local residents. The project specification states:
1. Identify the top five schools within Leeds that would make the most appropriate locations to run an
internet training course for people who have never used the internet before.
2. Identify a ranked list of the top 10 Output Areas (OA) to target a leafleting campaign for 400 leaflets.
3. Identify a range of Output Areas to target the remaining 4,600 leaflets
Selecting the top 5 schools
Locations of all schools in Leeds were obtained from the Department for Education [1]. The dataset
contained a list of all schools past and present, so schools which are either closed, duplicates (ie: primary
and secondary schools on the same site) or merged with other schools, were omitted from the dataset
leaving 296 schools on unique sites left for analysis.
Figure 1 :: Map of Leeds showing OAC Super Groups and ward boundaries, overlaid with locations of all
296 presently open schools and their catchment areas
Page 2 :: Geodemographic Analysis of Internet non-use in Leeds Cobain Schofield
According to the Project Brief, the top 5 schools within Leeds needed to be identified. In order to do this,
catchment boundaries were drawn according to the client’s criteria:
“People using a school predominantly reside within a Euclidean distance approximating a ten minute walk”
Based on this criterion, the average walking speed of 3mph can be used to estimate a radius around each
51775 9850 Multicultural Metropolitans: Renting Young Families
4 Shakespeare Primary School
54377 9726 Multicultural Metropolitans: Commuters with Young Families
5 Bankside Primary School
52994 9656 Ethnicity Central: Established Renting Families
1 2 3
4 5
0m 1608m 3216m
Page 7 :: Geodemographic Analysis of Internet non-use in Leeds Cobain Schofield
Leaflet Distribution Areas
Top 10 Output Areas
Item 2 of the Project Brief states:
“Identify a ranked list of the top 10 Output Areas (OA) to target a leafleting campaign for 400 leaflets”
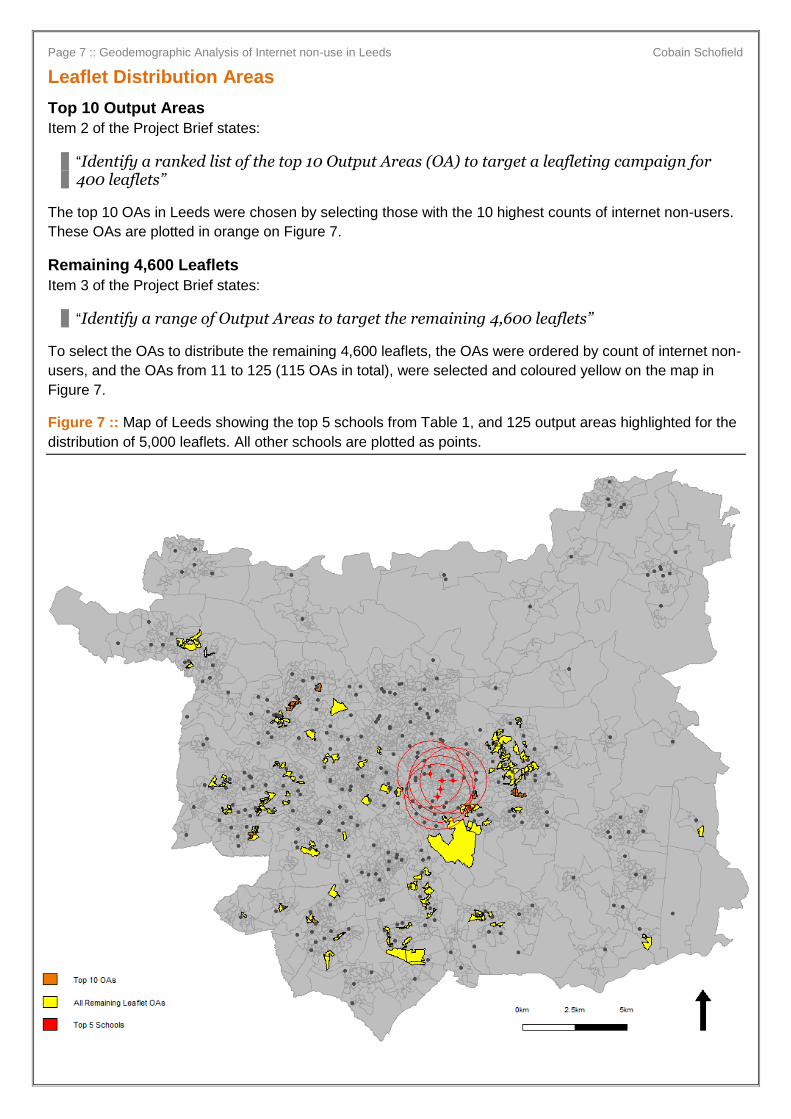
The top 10 OAs in Leeds were chosen by selecting those with the 10 highest counts of internet non-users.
These OAs are plotted in orange on Figure 7.
Remaining 4,600 Leaflets
Item 3 of the Project Brief states:
“Identify a range of Output Areas to target the remaining 4,600 leaflets”
To select the OAs to distribute the remaining 4,600 leaflets, the OAs were ordered by count of internet non-
users, and the OAs from 11 to 125 (115 OAs in total), were selected and coloured yellow on the map in
Figure 7.
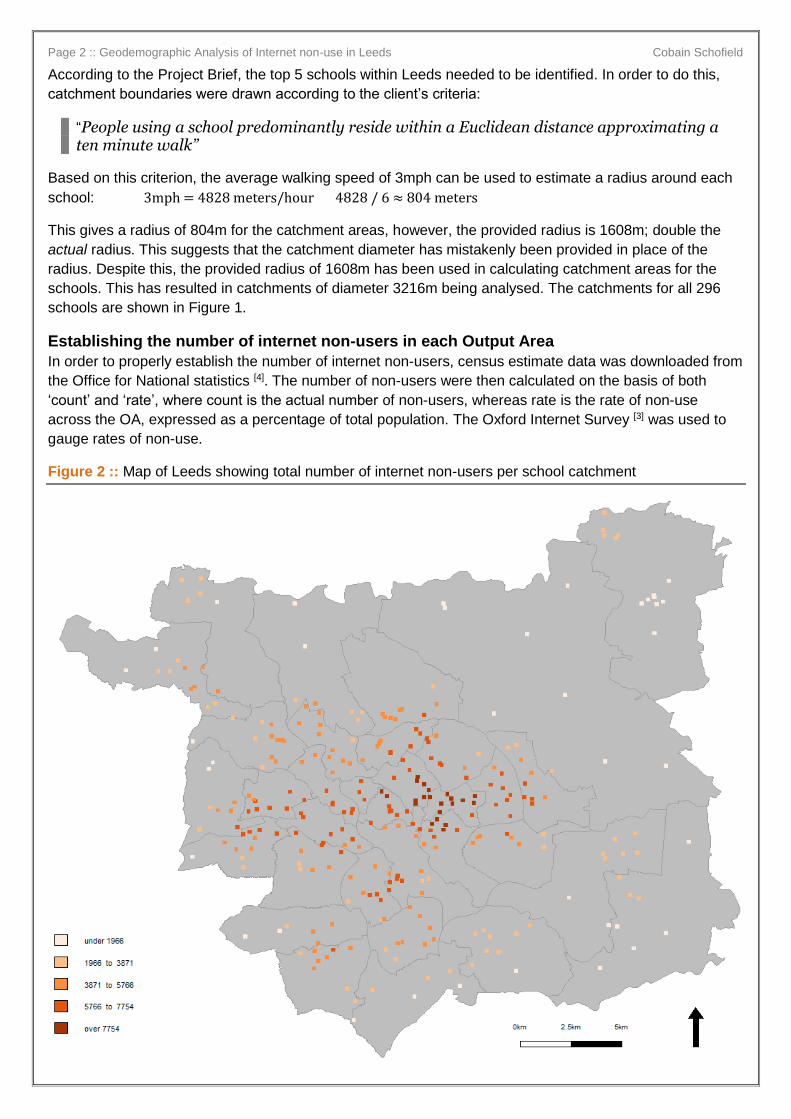
Figure 7 :: Map of Leeds showing the top 5 schools from Table 1, and 125 output areas highlighted for the
distribution of 5,000 leaflets. All other schools are plotted as points.
Page 8 :: Geodemographic Analysis of Internet non-use in Leeds Cobain Schofield
Figure 7 shows a massive spatial distribution of proposed OAs to target leaflets. There are actually only 7
recommended OAs falling within or partially within the catchments of any of the schools, as shown in Figure
8 below. This shows that most people receiving leaflets will not benefit from a local venue for the training
sessions.
Figure 8 :: A map of the top 5 school catchment areas with leaflet distribution OAs overlaid
To overcome this issue, Figure 9 shows the OA non-user count for OAs which fall within the 5 school
catchments only. This means that leaflet distribution is much more targeted and a lot more effective to both
the client and the internet non-users who are interested in the course because they all fall within the
catchments of potential course venues.
Table 2 details the breakdown of the OAs. In the combined catchment of the 5 schools, there are 295 OAs.
Of these, 125 OAs will be targeted with leaflets.
Top 10 OAs for Leaflet Distribution
Based on the data in Table 2, it is logical to choose the 2x OAs with non-user counts exceeding 179, and
the next 8x highest OAs from the 91 to 179 count category. These top 10 OAs have been plotted into
Figure 10 in yellow.
Table 2 :: Total number of non-users per OA within the combined catchment of Figure 9
Internet non-user count OA count
38 to 56 216
56 to 71 48
91 to 179 29
179 + 2
Page 9 :: Geodemographic Analysis of Internet non-use in Leeds Cobain Schofield
Remaining 4,600 Leaflets
The remaining leaflets should be distributed in the same way as the top 10, taking the next 115 OAs with
the highest remaining counts. This means that the remaining 21x OAs from the 91 to 179 category are
included, along with all 48x from the 56 to 71 category, and the 46x highest OAs from the 38 to 56
category, to give a total to 115x OAs to distribute the remaining leaflets to. These OAs have been plotted
onto Figure 10 in blue.
Figure 9 :: Clipped map of the combined top 5 school catchment areas with OAs coloured by non-user
count per OA
Page 10 :: Geodemographic Analysis of Internet non-use in Leeds Cobain Schofield
Figure 10 :: Top 10 OAs and 115 OAs for remaining 4,600 leaflets plotted over map from Figure 9
Data Sources
All maps are based on Edina Census Geography [2] shape files and utilise data from the Office for National
Statistics 2013 census estimates [4].
1 School Location Data: HM Government Department for Education “Download all data” http://www.education.gov.uk/edubase/home.xhtml
2 Leeds Shape Files (mapping): Edina “Census Geography” http://census.edina.ac.uk/
3 Oxford Internet Survey: University of Oxford “Cultures of the Internet: The Internet in Britain” http://oxis.oii.ox.ac.uk/wp-content/uploads/2014/11/OxIS-2013.pdf
4 Output Area Census Data: HM Government Office for National Statistics “Census Output Area Estimates in the Yorkshire and Humber region of England, Mid-2013” http://www.ons.gov.uk