39
GIS1: Overview of GIS and Visualization with Maps Treg Christopher For NR25
| Date post: | 25-Dec-2015 |
| Category: |
Documents |
| Upload: | norman-doyle |
| View: | 222 times |
| Download: | 2 times |

GIS1: Overview of GIS and Visualization with Maps
Treg ChristopherFor NR25

Outline
• GIS Introduction• Applications in Natural
Resources• Data Types: Raster vs
Vector• Map Elements and
Composition• Web-based Maps
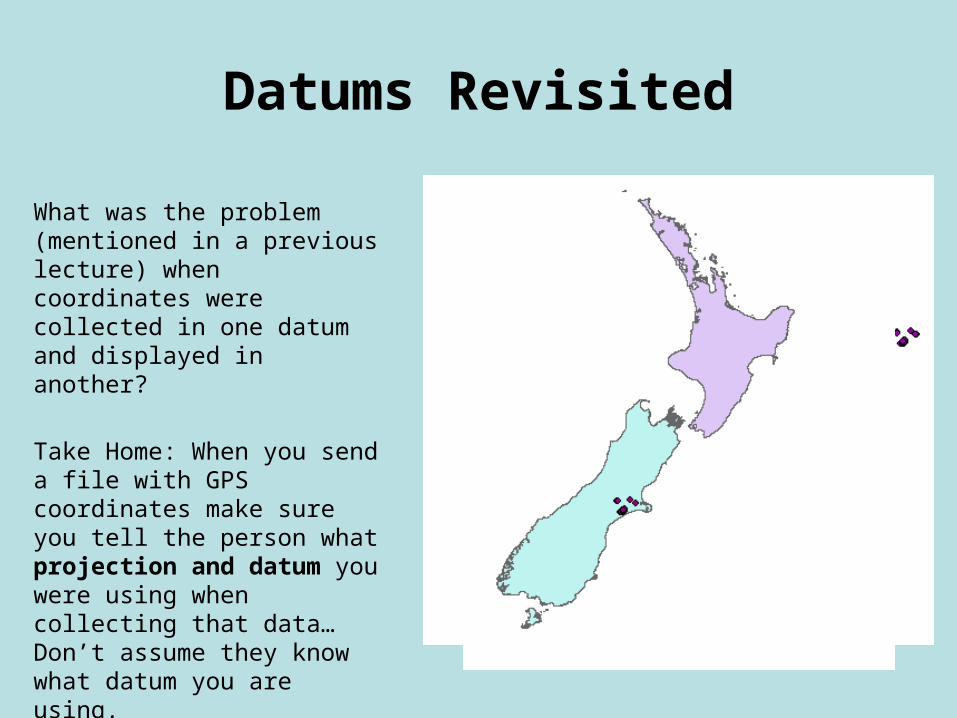
Datums Revisited
What was the problem (mentioned in a previous lecture) when coordinates were collected in one datum and displayed in another?
Take Home: When you send a file with GPS coordinates make sure you tell the person what projection and datum you were using when collecting that data…Don’t assume they know what datum you are using.
What is GIS?
Geographic Information Systems
(or Science?)
– Geography is information about the earth's surface, the objects found on it and the relationship between these objects.
– GIS is a technology that manages, analyzes, and disseminates geographic knowledge.
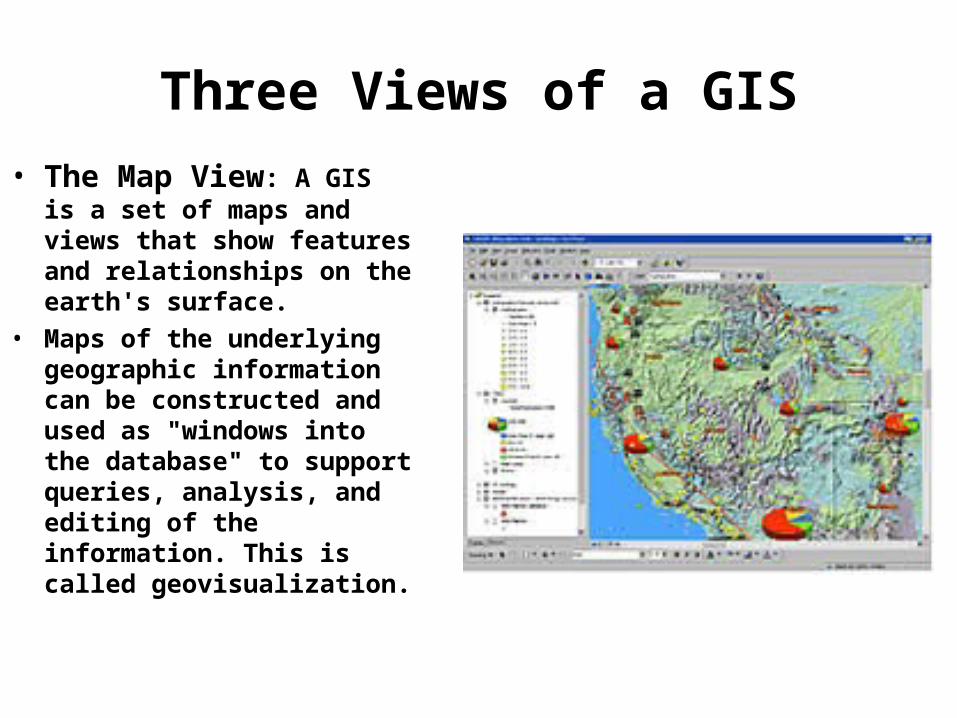
Three Views of a GIS
• The Map View: A GIS is a set of maps and views that show features and relationships on the earth's surface.
• Maps of the underlying geographic information can be constructed and used as "windows into the database" to support queries, analysis, and editing of the information. This is called geovisualization.

Three Views of a GIS
• The Database View: A GIS is a unique kind of database of the world—a geographic database (geodatabase). It is an "Information System for Geography."
• All information in a GIS is linked to a spatial reference. Other databases may contain locational information (such as street addresses, or zip codes), but a GIS database uses geo-references as the primary means of storing and accessing information.
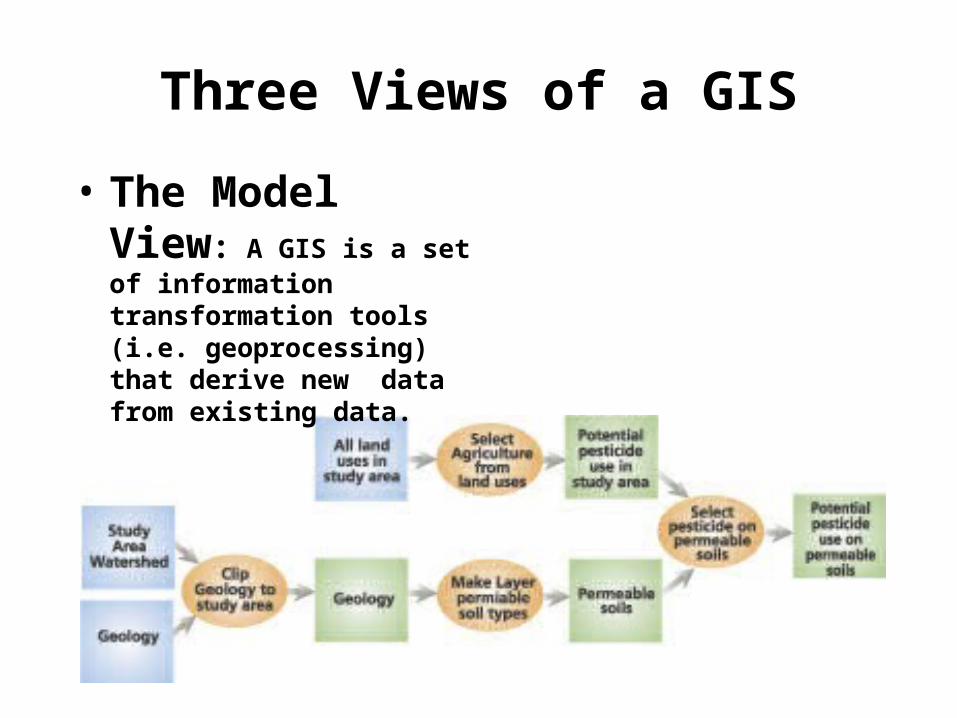
Three Views of a GIS
• The Model View: A GIS is a set of information transformation tools (i.e. geoprocessing) that derive new data from existing data.
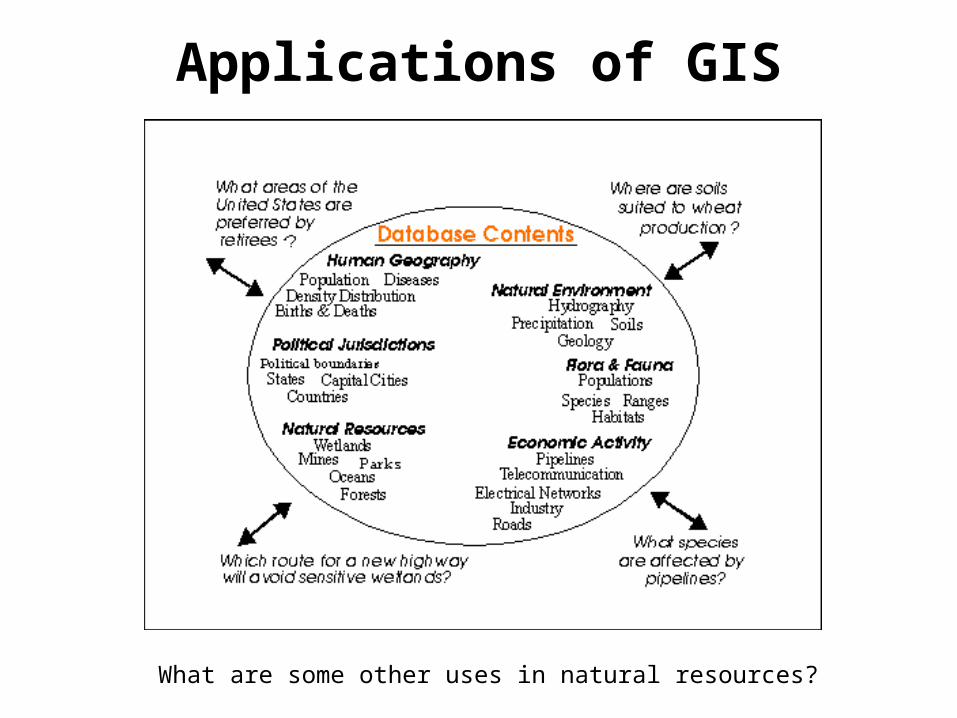
Applications of GIS
What are some other uses in natural resources?
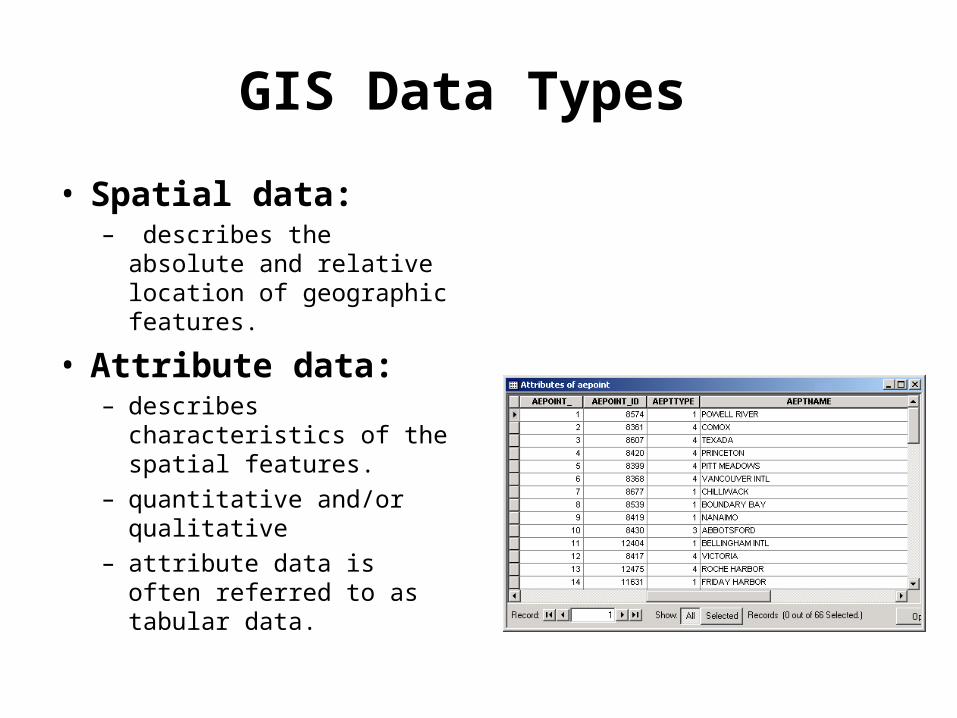
GIS Data Types
• Spatial data:– describes the absolute
and relative location of geographic features.
• Attribute data:– describes characteristics of
the spatial features.– quantitative and/or
qualitative– attribute data is often
referred to as tabular data.
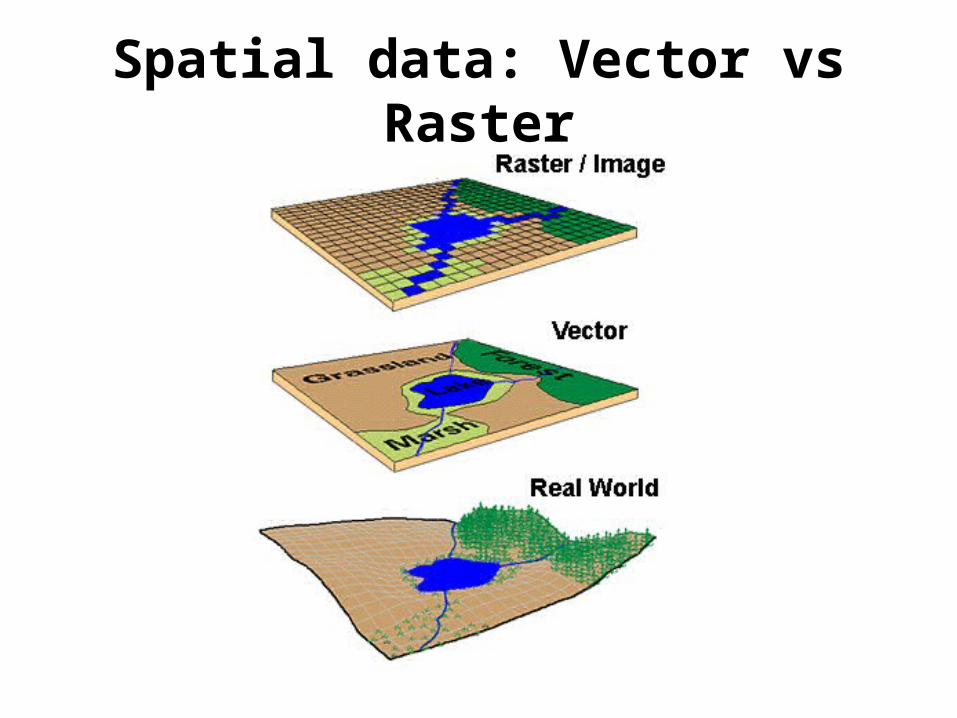
Spatial data: Vector vs Raster

Vector Types
-Points-Lines (Arcs)-Polygons
Polygons

Vector Resolution
• Smallest feature that is:– Discerned/Detected– Measured/Stored– Displayed
• Known as Minimum Mapping Unit (MMU)– Expressed in area unit not distance (e.g. 4 acres, 4
ha)
• Relationship to scale:– A 1,000ha MMU on a 1:24,000 map will not show
much besides one big blob (this size MMU would be better suited to national or global mapping)

Raster
• There are many types of raster data you may be familiar with:– grids (ArcGIS & ArcInfo
specific) – graphical images (TIFF,
JPEG, BMP, GIF, etc.) – USGS DEM (Digital
Elevation Model) – remotely-sensed images
(Landsat, SPOT, AVIRIS, AVHRR, Imagine IMG, digital orthophotos)

Georeferencing
• Georeferenced from one corner
• Much faster processing time than vector because of the simple georeferencing
• Cell size is constant• Each cell contains a
single value

Raster and resolution
• A cell must store a value. This requires more storage space than vector data
• The space needed is related to cell size (resolution).
• Geometric relationship between cell size and #cells in an area

• Three differently scaled views of an ArcInfo format elevation grid, showing cell outlines and elevation values.

Raster to Vector Data
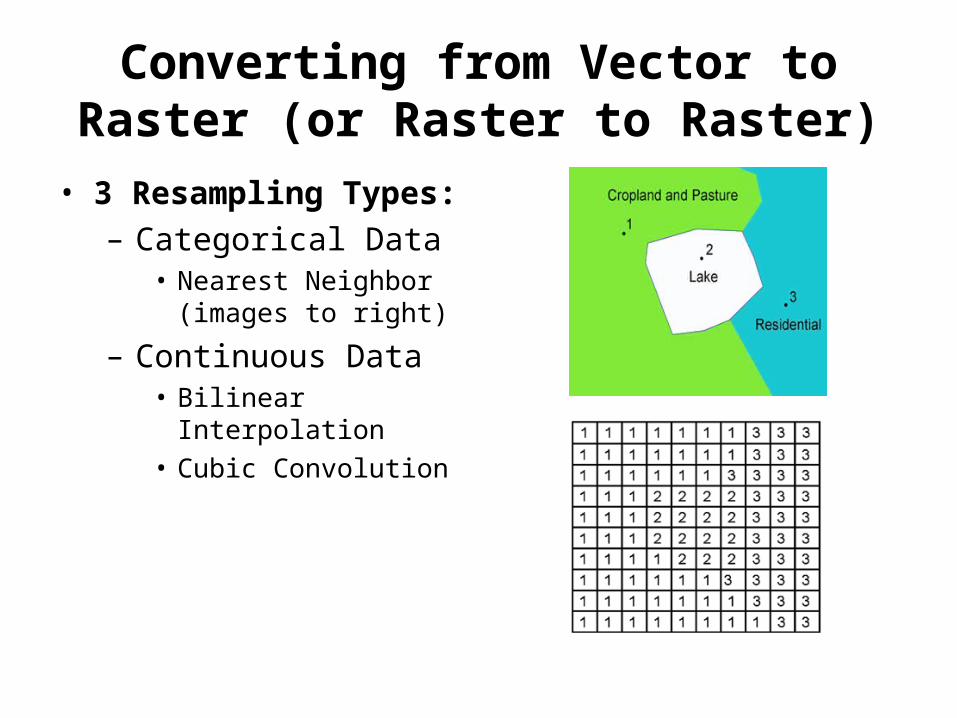
Converting from Vector to Raster (or Raster to Raster)
• 3 Resampling Types:– Categorical Data
• Nearest Neighbor (images to right)
– Continuous Data• Bilinear Interpolation • Cubic Convolution
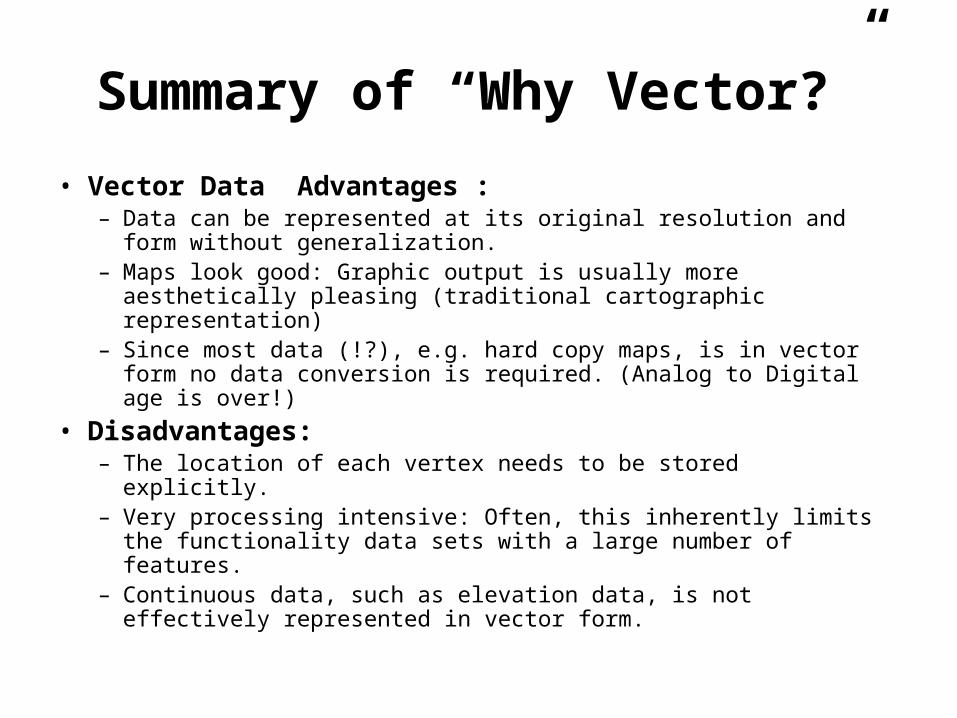
Summary of “Why Vector?”
• Vector Data Advantages : – Data can be represented at its original resolution and form
without generalization. – Maps look good: Graphic output is usually more aesthetically
pleasing (traditional cartographic representation)– Since most data (!?), e.g. hard copy maps, is in vector form no
data conversion is required. (Analog to Digital age is over!)
• Disadvantages: – The location of each vertex needs to be stored explicitly. – Very processing intensive: Often, this inherently limits the
functionality data sets with a large number of features. – Continuous data, such as elevation data, is not effectively
represented in vector form.
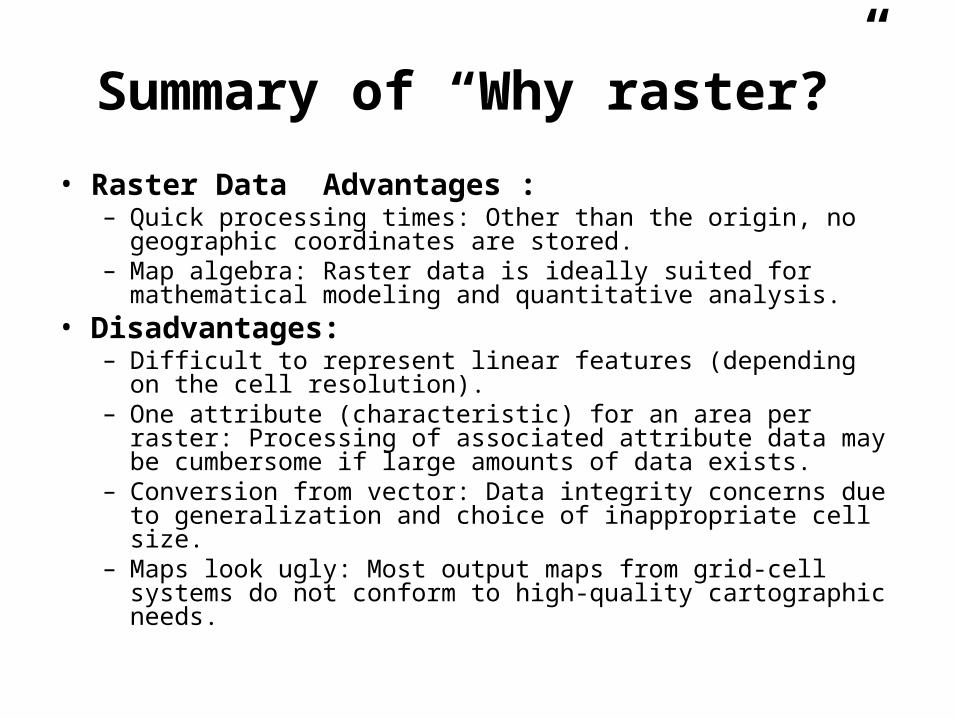
Summary of “Why raster?”
• Raster Data Advantages : – Quick processing times: Other than the origin, no geographic
coordinates are stored. – Map algebra: Raster data is ideally suited for mathematical
modeling and quantitative analysis. • Disadvantages:
– Difficult to represent linear features (depending on the cell resolution).
– One attribute (characteristic) for an area per raster: Processing of associated attribute data may be cumbersome if large amounts of data exists.
– Conversion from vector: Data integrity concerns due to generalization and choice of inappropriate cell size.
– Maps look ugly: Most output maps from grid-cell systems do not conform to high-quality cartographic needs.
Maps
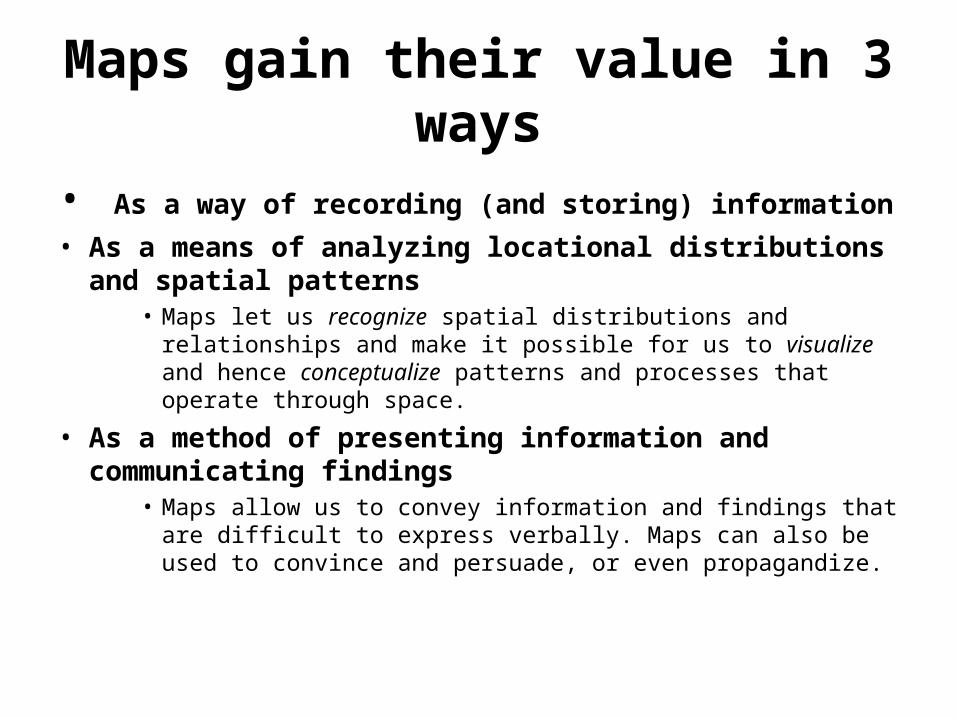
Maps gain their value in 3 ways
• As a way of recording (and storing) information
• As a means of analyzing locational distributions and spatial patterns
• Maps let us recognize spatial distributions and relationships and make it possible for us to visualize and hence conceptualize patterns and processes that operate through space.
• As a method of presenting information and communicating findings
• Maps allow us to convey information and findings that are difficult to express verbally. Maps can also be used to convince and persuade, or even propagandize.
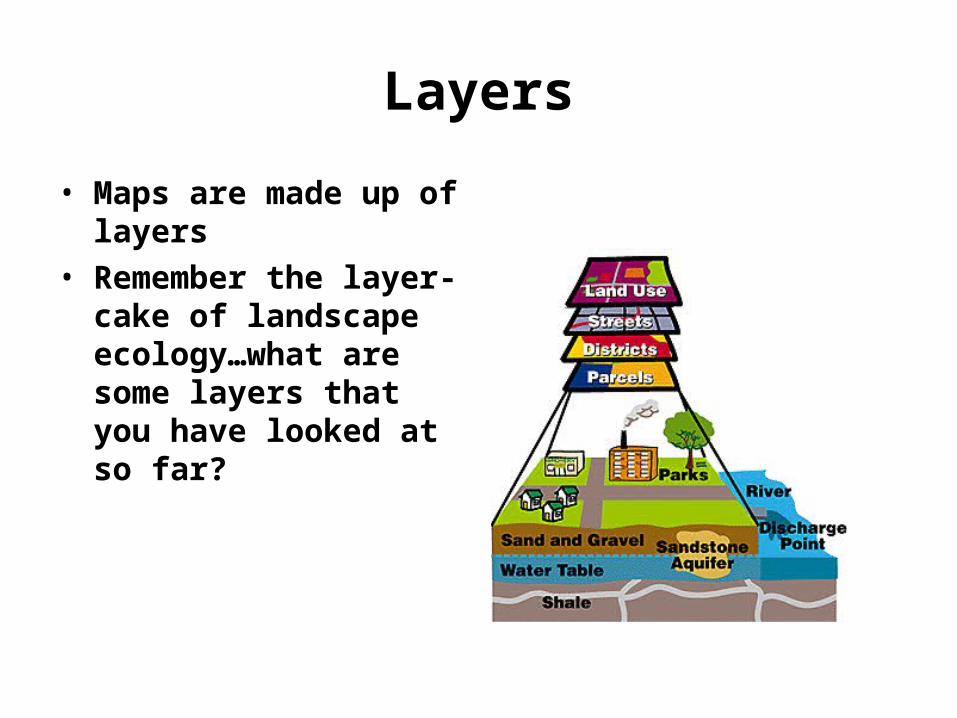
Layers
• Maps are made up of layers
• Remember the layer-cake of landscape ecology…what are some layers that you have looked at so far?

Layer ExamplesWhich layers are raster and which are vector?
USGS DLG of rivers.
USGS DLG of contour lines (hypsography)
USGS digital elevation model (DEM)
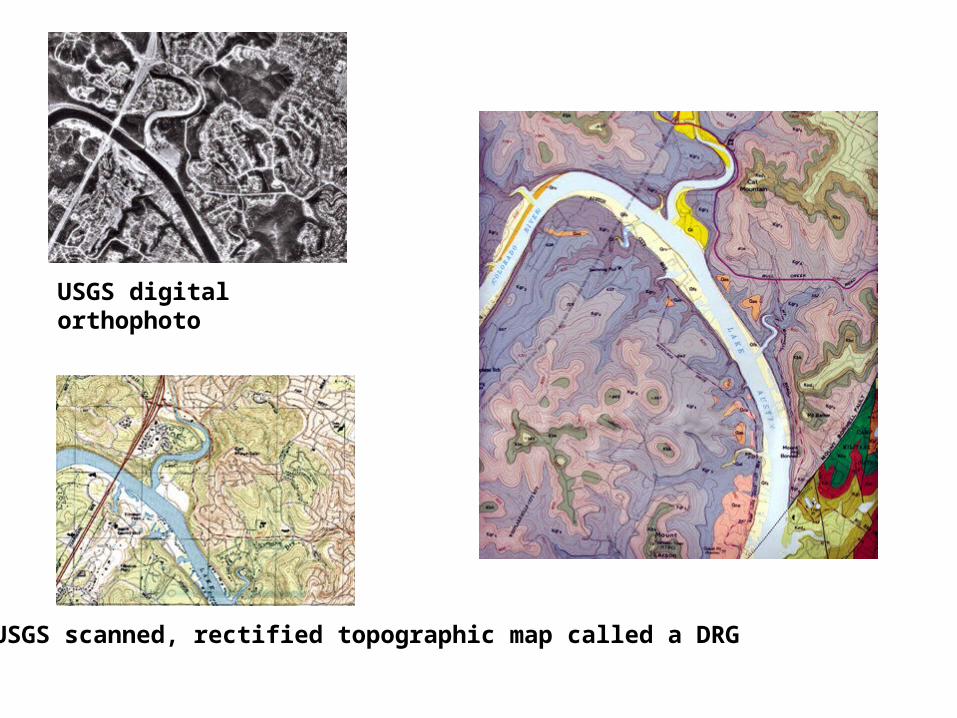
USGS scanned, rectified topographic map called a DRG
USGS digital orthophoto

Landsat 7 satellite image from which land cover information can be derived.
Part of a census data file containing address information.
Part of a hydrologic data report indicating the discharge and amount of river flow recorded by a particular streamgage that has a known location.
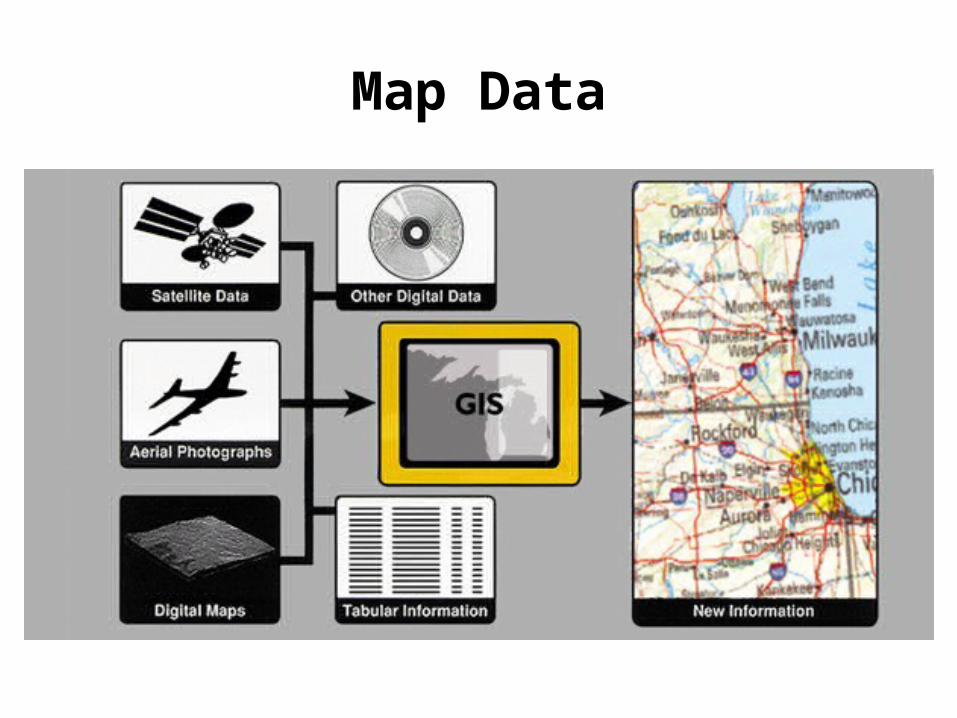
Map Data
What Is a Good Map?
• If cartography is a form of communication, the measure of a good map is how well it conveys information to its readers to enlighten, convince, or persuade.
• To ask "what is a good map?" is to ask how well it communicates with its audience.
• This means that one always begins a project by considering the message to be conveyed and the audience to be addressed. This raises a series of questions that must be addresses at the start of a project:
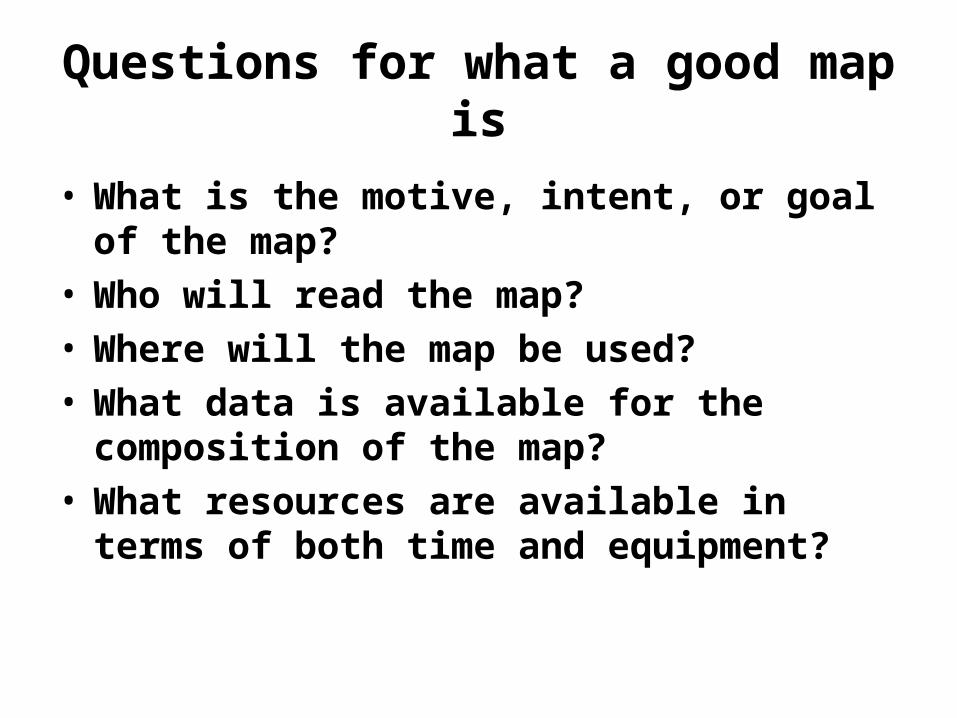
Questions for what a good map is
• What is the motive, intent, or goal of the map?
• Who will read the map? • Where will the map be used? • What data is available for the composition of
the map? • What resources are available in terms of both
time and equipment?

Elements of a Typical Map

Other Map Elements:-Inset Map-Neatlines-Tics (Lat-Long&UTM)-Magnetic North-Comprehensive Metadata -Date -Projection info -Acquisition info
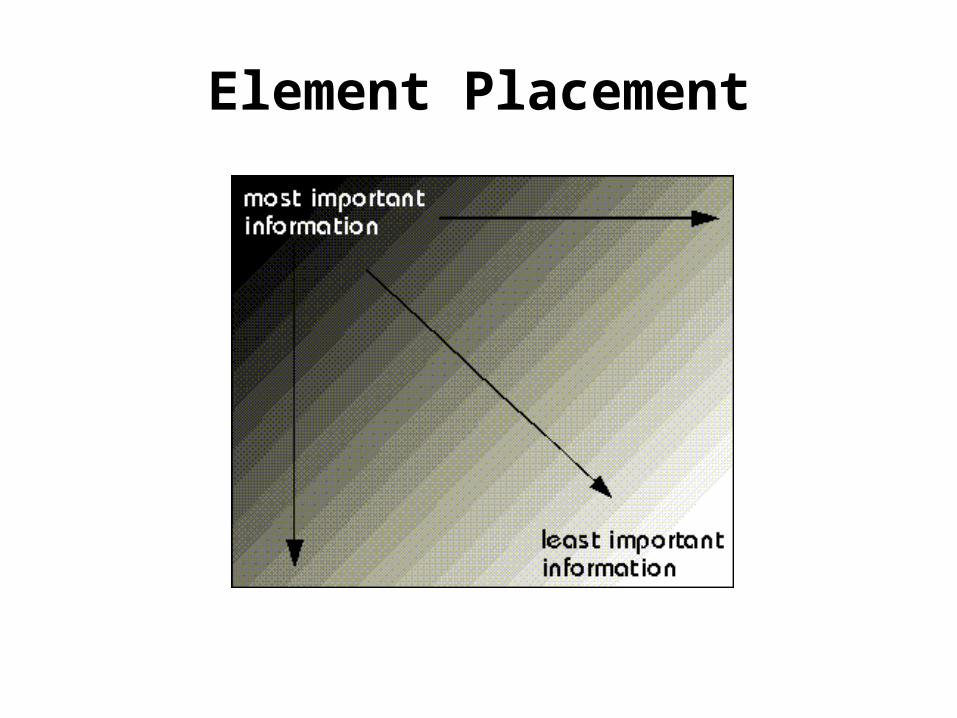
Element Placement
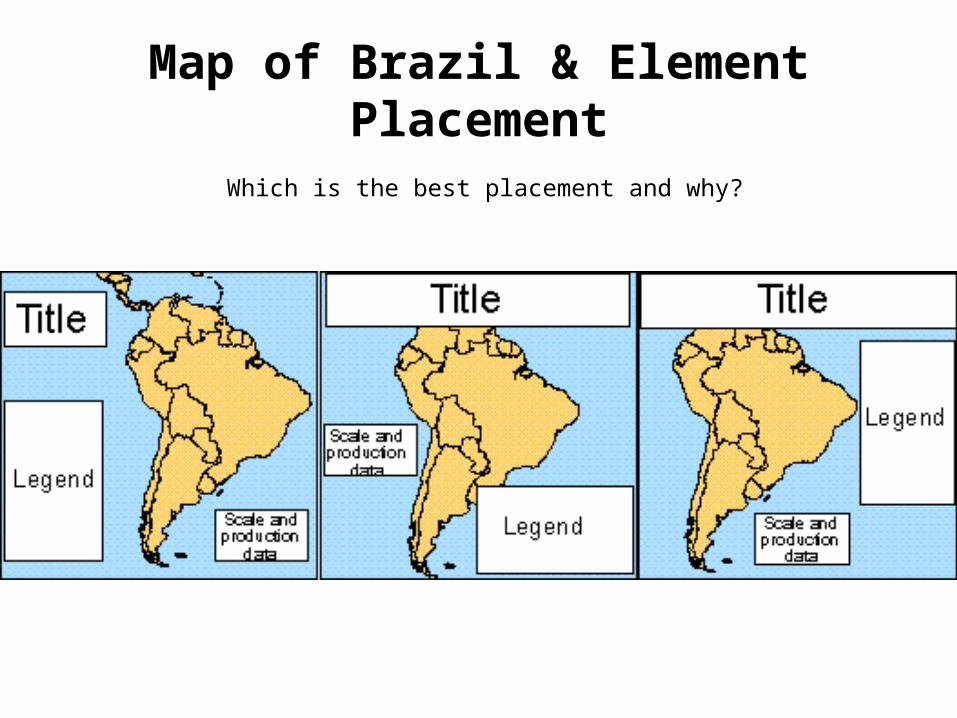
Map of Brazil & Element Placement
Which is the best placement and why?
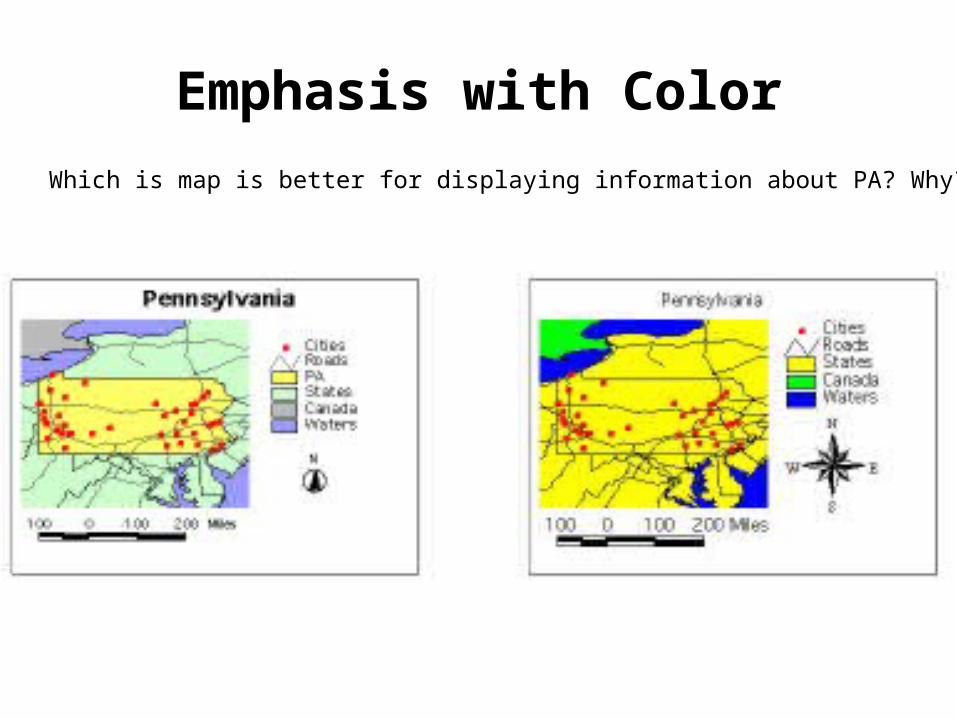
Emphasis with Color
Which is map is better for displaying information about PA? Why?

Cartographic Scale (again)
• The display scale influences two things about a map – The amount of detail. The map must not be overwhelmed with
detail, and become too crowded. – The size and placement of text and symbols. These must be
sized to be readable at the display scale, and placed so that they do not overlap each other.
• Scale and Printing a map– Scale is set at time of printing– If take a large paper map (e.g. USGS Quad), reduce it so it’s
printed on an 8.5x11” , the scale (bar and text) will no longer be accurate
Web-based Mapping Examples
• ArcIMS– Takes a map from ArcMap and distributes it through
the web– More than just an image, it is allows for user
interaction with the data– Examples at:– http://ecovalue.uvm.edu/ArcIMS/Website/riw_natcom/– http://ecovalue.uvm.edu/ArcIMS/Website/vt_evp2/
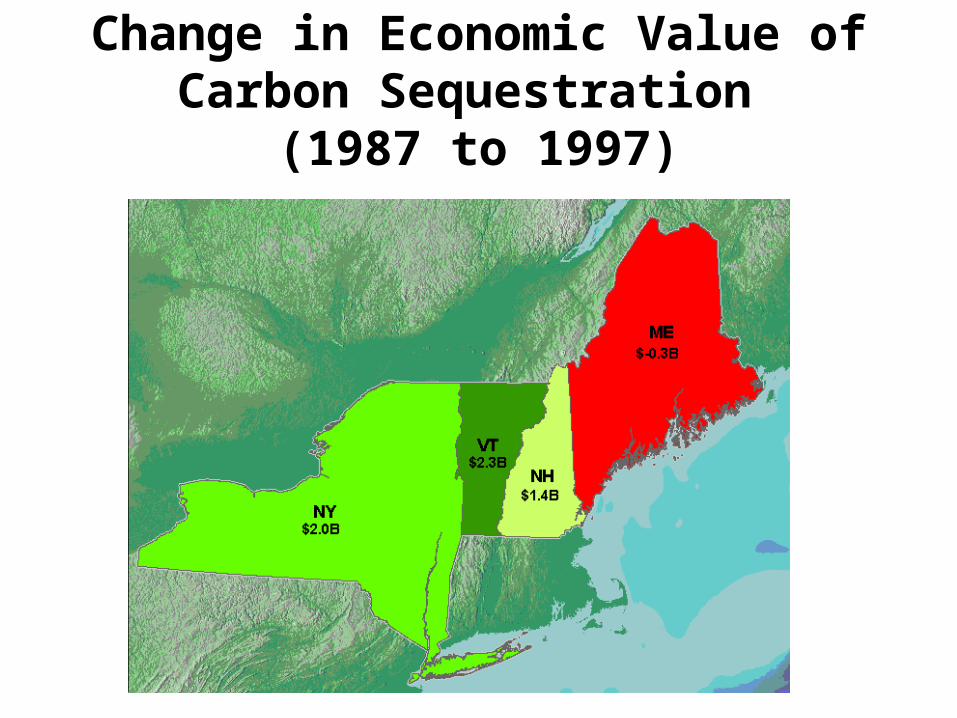
Change in Economic Value of Carbon Sequestration
(1987 to 1997)
End
• GIS?............Geeks In Shorts

Review Questions
• List and describe the 3 views of GIS• List 2 types of data used in a GIS • Describe the advantages/disadvantages of Vector
and Raster data• Give some examples of Vector and Raster Layers• List at least 6 elements of a map• Distinguish between good and bad element
placement• Describe 2 map factors that are affected by scale


