30
AtmoSpheres in a test tube Giuseppe Galletta Università di Padova

AtmoSpheres in a test tube
Giuseppe GallettaUniversità di Padova
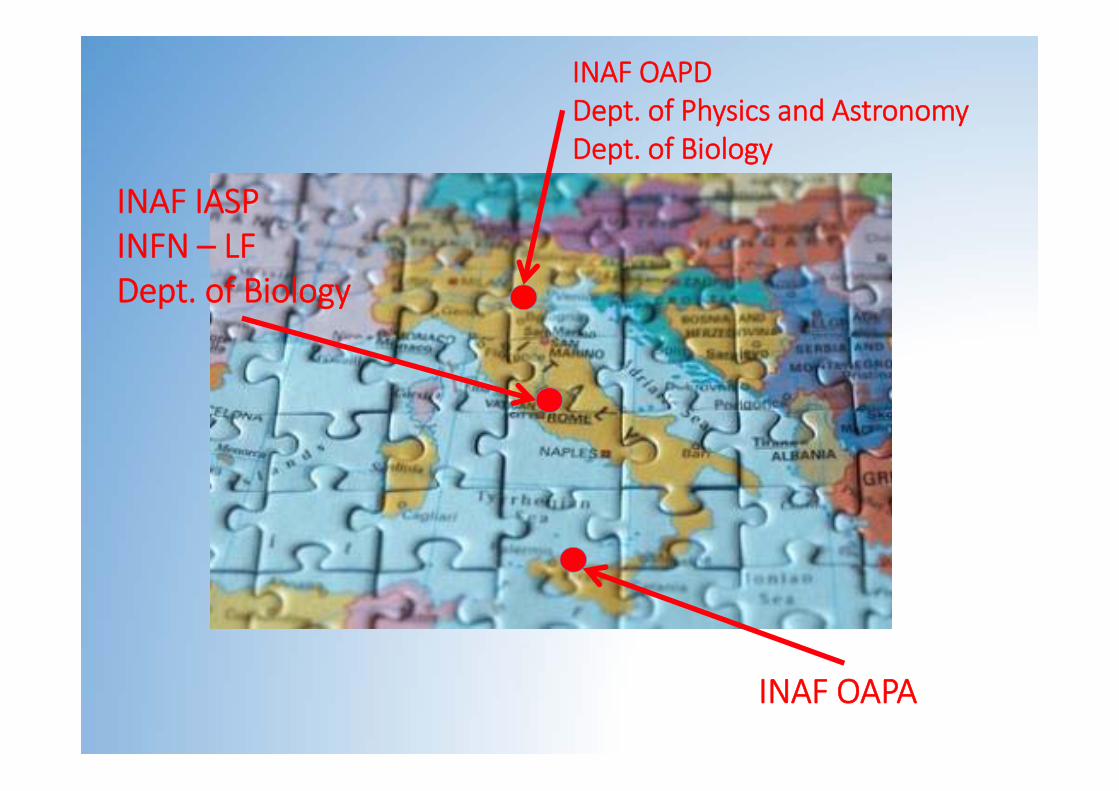
INAF OAPDDept. of Physics and AstronomyDept. of Biology
INAF IASPINFN – LFDept. of Biology
INAF OAPA
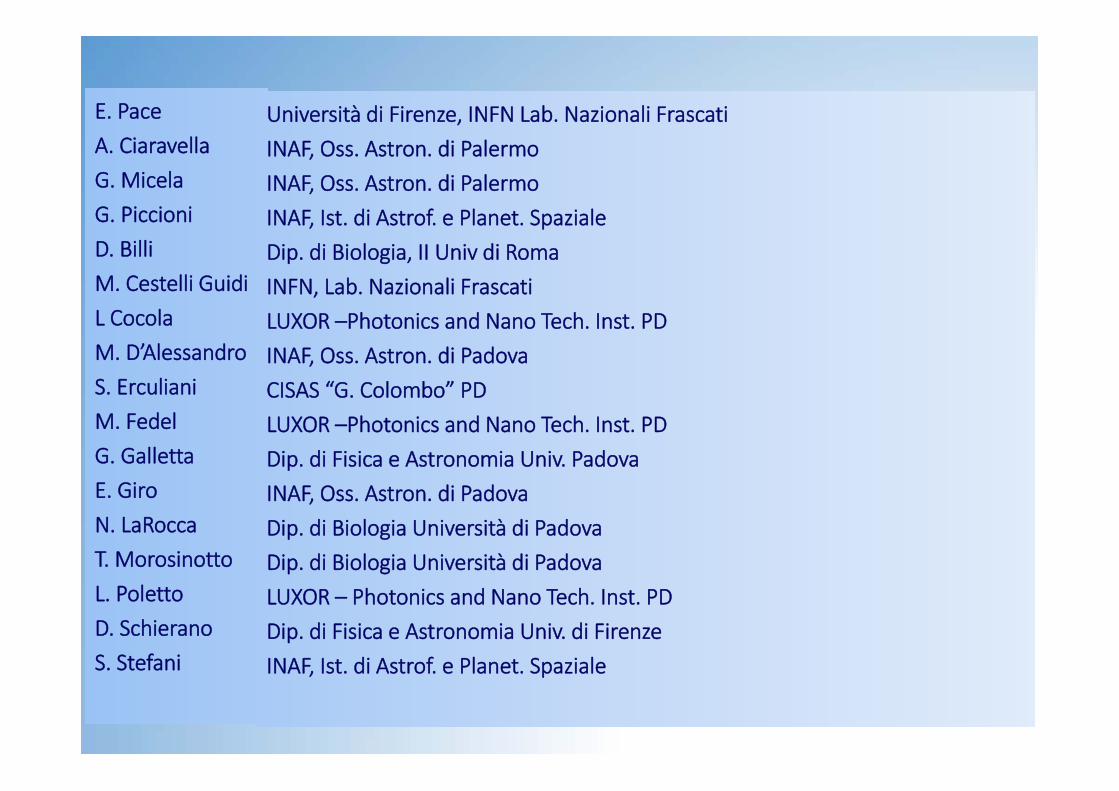
E. PaceA. CiaravellaG. MicelaG. PiccioniD. BilliM. Cestelli GuidiL CocolaM. D’AlessandroS. ErculianiM. FedelG. GallettaE. GiroN. LaRoccaT. MorosinottoL. PolettoD. SchieranoS. Stefani
Università di Firenze, INFN Lab. Nazionali FrascatiINAF, Oss. Astron. di PalermoINAF, Oss. Astron. di PalermoINAF, Ist. di Astrof. e Planet. SpazialeDip. di Biologia, II Univ di RomaINFN, Lab. Nazionali FrascatiLUXOR –Photonics and Nano Tech. Inst. PDINAF, Oss. Astron. di PadovaCISAS “G. Colombo” PDLUXOR –Photonics and Nano Tech. Inst. PDDip. di Fisica e Astronomia Univ. PadovaINAF, Oss. Astron. di PadovaDip. di Biologia Università di PadovaDip. di Biologia Università di PadovaLUXOR – Photonics and Nano Tech. Inst. PDDip. di Fisica e Astronomia Univ. di FirenzeINAF, Ist. di Astrof. e Planet. Spaziale


EARTHS and SUPER EARTHS
GIANT PLANETSHOT Jupiters
HOT Neptunes13 Sept 2015:1956 Planets1239 Systems488 Multiple Systems
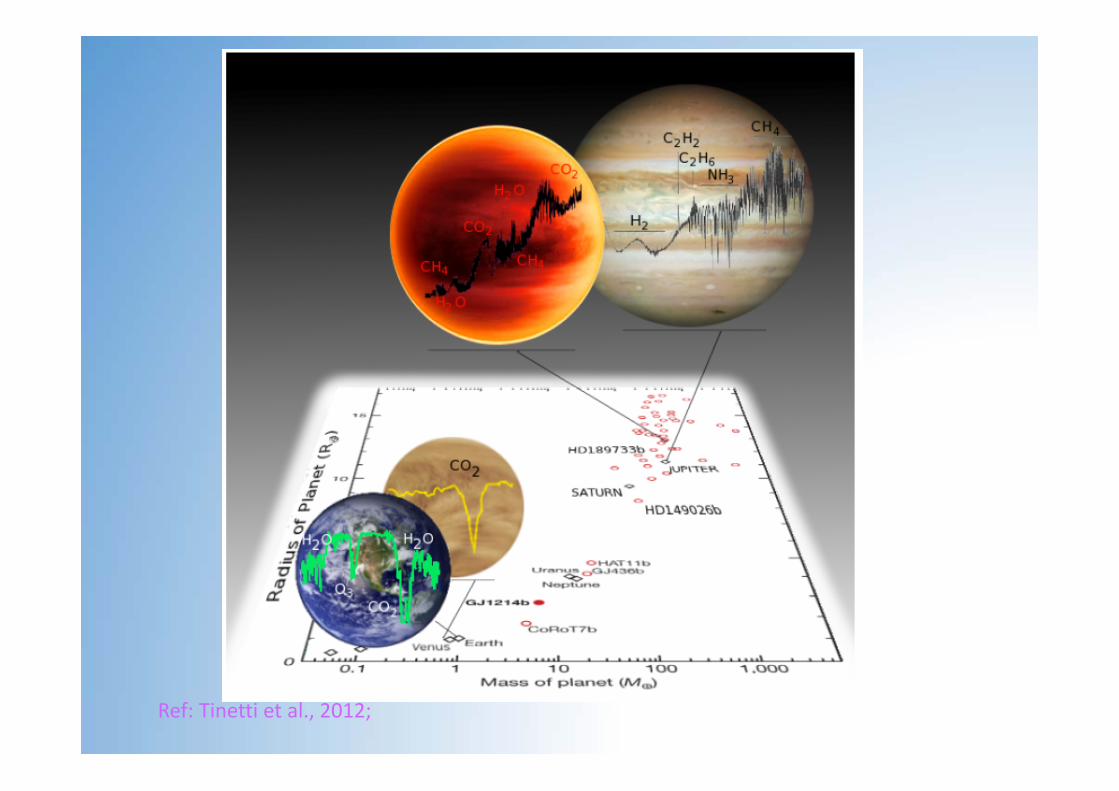
Ref: Tinetti et al., 2012;
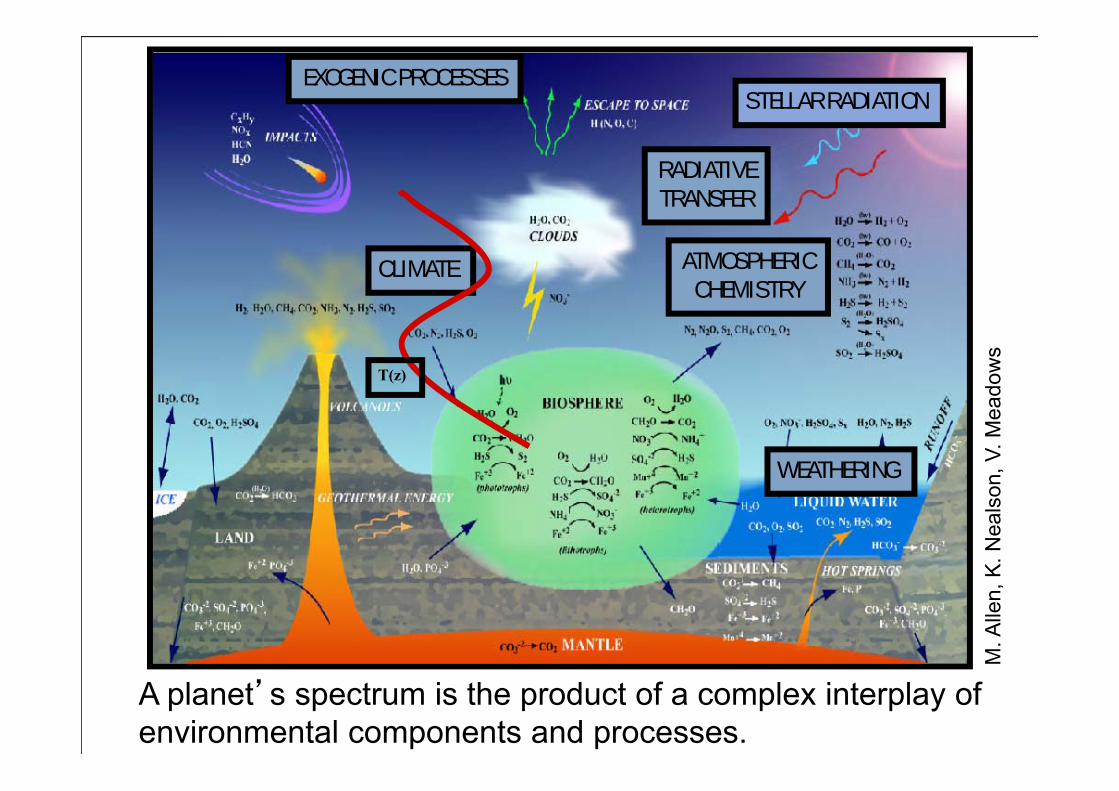
CLIMATE ATMOSPHERICCHEMISTRY
RADIATIVETRANSFER
WEATHERING
EXOGENIC PROCESSES
T(z)
STELLAR RADIATION
A planet’s spectrum is the product of a complex interplay of environmental components and processes.
M. A
llen,
K. N
eals
on, V
. Mea
dow
s
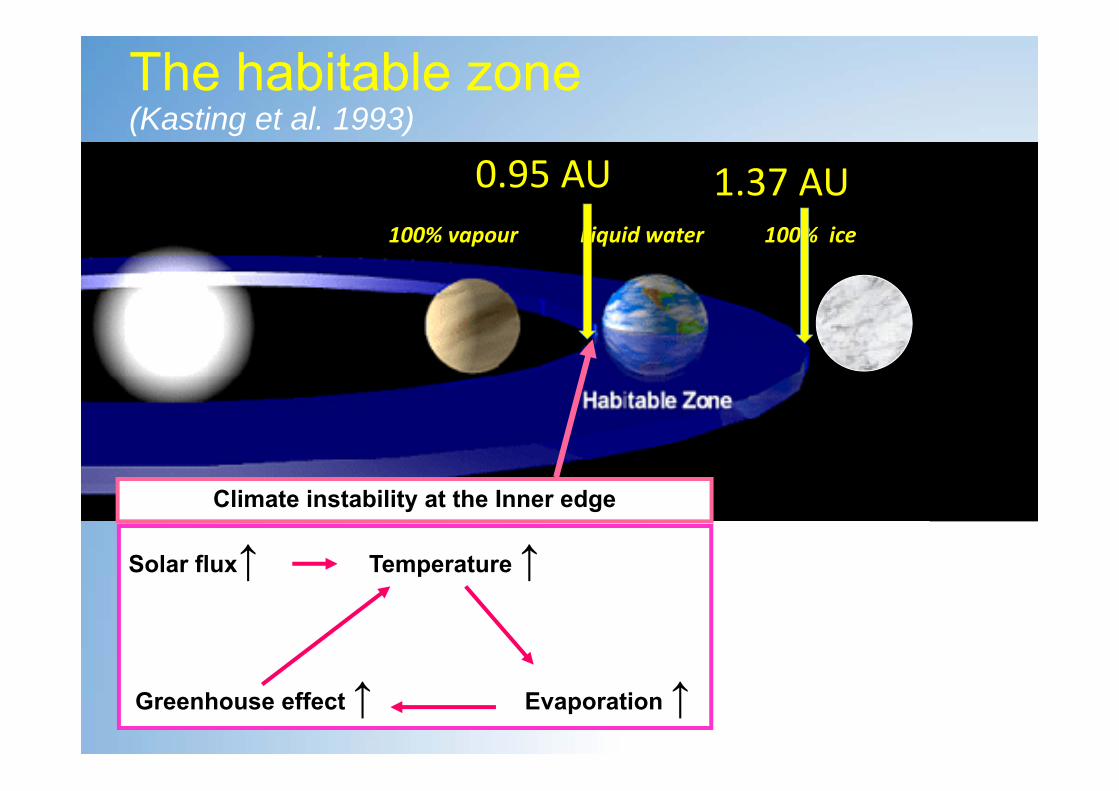
The habitable zone(Kasting et al. 1993)
100% vapour Liquid water 100% ice
Solar flux↑ Temperature ↑
Greenhouse effect ↑ Evaporation ↑
Climate instability at the Inner edge
0.95 AU 1.37 AU

The habitable zone(Kasting et al. 1993)
100% vapour Liquid water 100% ice
Solar flux↑ Temperature ↓
Albedo↑ Ice and snow ↑
Climate instability at the Outer edge
0.95 AU 1.37 AU

HZ for the other stars
Inner limit: water photoionization, H loss
Outer: CO2clouds, star light reflection
The HZ limits around the other stars of different spectral type are given by:
Rapid Evolution
Corotation

Characterizing Extrasolar Planets. Deduce from observations:
• Astronomical Biosignatures- photometric, spectral or temporal features
indicative of life.
• Environmental Characteristics• host star, placement in solar system,
moons, other planets• Photometric properties and variability• Remote‐sensing spectroscopic
analysis• the presence of an atmosphere and its
chemical composition• albedo, thermal emissivity,
temperature• atmospheric structure (T(z), P(z))• trace gas mixing ratios • temporal variations, phase and• seasonal variations
Integrate Ligth from earth, reflected by the dark side of the moon: Chlorophill, O2, O3, H2O.

Rapid identification of the planet Determination of the orbit, no M sin(i) ambiguity Characterization of the planet
albedo, temperature, chemical composition => test of atmospheric models, of evolutionary
models Access to a new (separation, age) domain
Planets around young stars Larger separations (P > few years)
Access to all types of stars Early type stars Active stars
But … difficult !
Direct Imaging of Exo‐Planets
AbSciCon – Chicago – 2015
HR 87991.5 Msun, 130 light years from Earth.

Crossfield 2015
Transmission and occultation spectroscopy

Seager & Deming 2010

To Simulate Planetary Atmosphere in laboratory in order to:
‐ Produce Data base of Spectra at different P and T conditions
‐ Study the possible modification to rocky planetsatmospheres due to biota
‐ Study the interaction between radiation and Atmosphere
Atmosphere In A Test Tube
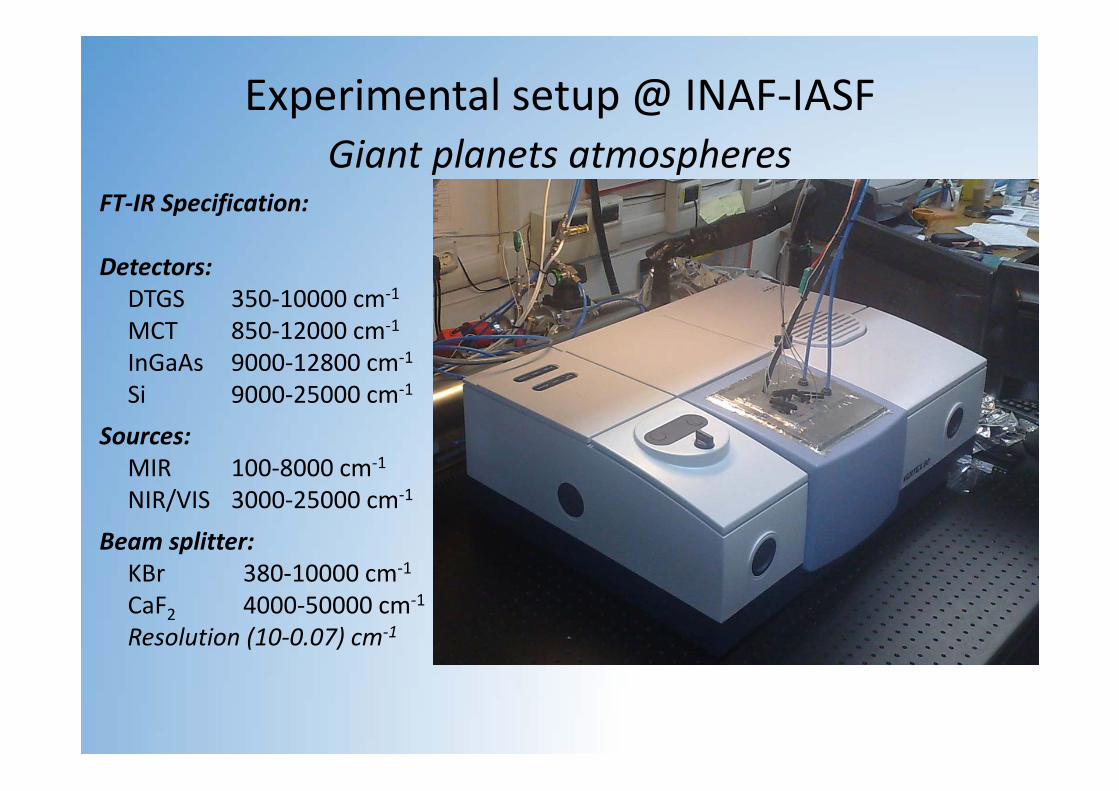
Experimental setup @ INAF‐IASF Giant planets atmospheres
FT‐IR Specification:
Detectors:DTGS 350‐10000 cm‐1
MCT 850‐12000 cm‐1
InGaAs 9000‐12800 cm‐1
Si 9000‐25000 cm‐1
Sources:MIR 100‐8000 cm‐1
NIR/VIS 3000‐25000 cm‐1
Beam splitter:KBr 380‐10000 cm‐1
CaF2 4000‐50000 cm‐1
Resolution (10‐0.07) cm‐1

Optical parameters Pressure up to 300 Bar Temperature up to 310°C Optical path: l ≈ 2 cm
High Pressure High Temperature Gas cell
Giant planets atmospheres

Multi pass gas cell @ intermediate pressure and high temperature
Optical Layout Max path length: 30 mP.L. variable from 2.5 to 30 mPressureFrom 1 to 10 barTemperatureFrom 200 to 400K
Giant planets atmospheres

Quartz mirrors with a HR coating (99,97 %)have been glued on a quartz tube with severalholes.
Quartz mirrors with a HR coating (99,97 %)have been glued on a quartz tube with severalholes.
A CRD time of about 17 ms corresponds with an optical path of about 5 km.
Giant planets atmospheresCavity Ring Down (CRD) Cell

A synchrotron facility operating with syncrotron and standard sources in the Infrared and UV‐VIS energy range is open to external users.
• Extended IR range (from Far-IR to NIR-VIS)• Chemical microimaging of materials • Real time study of photoageing processes• Exo-biosphere's evolution and biosignature characterization• High temperature (1200°C) / high pressure (20GPa) setup
INFN DaFne‐Ligh synchrotron facility
FPA detector for chemical imaging Long path gas cellSinbad IR beamline(1 mm – 0.5m)

SOURCE branchline in a 1000‐class cleanroom
VUV monochromatic radiation source (120-250 nm)
UV-VIS monochromatic radiation source (180-650 nm)
UV-VIS radiation source (200-650 nm)
• Large optical systems (up to 4 m) surface characterization• UV photoageing of optical components and materials• Detector calibration• Photobiology and exobiology experiments
INFN

Pumping SystemGas Line
ControlSystem
Cold Finger
IR Spectrometer
Needle ValveGas Inlet
Mass Spectrometer
UV Source ( HI Lyα )
LIFE @ INAF OAPA(Light Irradiation Facility for Exochemistry)

AIMS: Study the metabolism, vitality and gaseous production of photosynthetic bacteriawhen forced to live in a different environment, mimicing an earth‐like planet orbiting
around the HZ of an M type star.
INAF OAPD‐ Padua Dept. Physics & Astronomy: Rocky Planets atmosphere modification caused by biota
MINI-LISAambientsimulator
Peltier cell

Step Zero: ‐conception of an M starlight
simulator‐Choice of bacteria‐Incubator build‐up
First step: Irradiation of the samples with solar light
in terrestrial conditions‐ Analysis of gaseous abundances in the
cells
Second step: ‐Irradiation of the samples with M star
radiation,‐Analysis of gaseous abundances in the
cells
Third step: ‐Irradiation of the samples withM star radiation at terrestrialpressure,temperature and
extrasolar planetgaseous mixture,
‐Analysis of gaseousabundances in the cells.
Ancillary science:Plants on M star planets
Timeline of the experiment

The Illuminator
LED Decks
25 Wavelengths (0.36 – 0.94 µm) 275 LEDs450 W dissipationPC Controlled

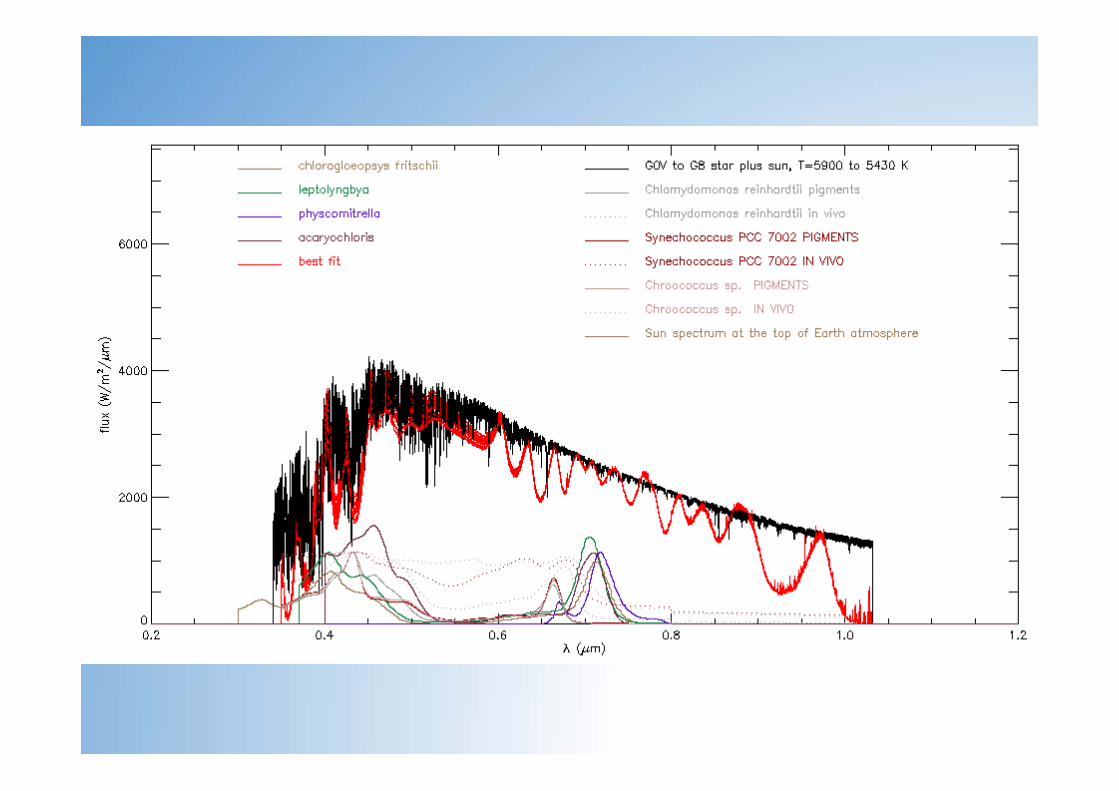
Green bump Red edge variated depending on the organism type, biomass, hydratation and leaf thickness and carbon content
Kiang et al., 2007a
Reflecting edge for M star planets
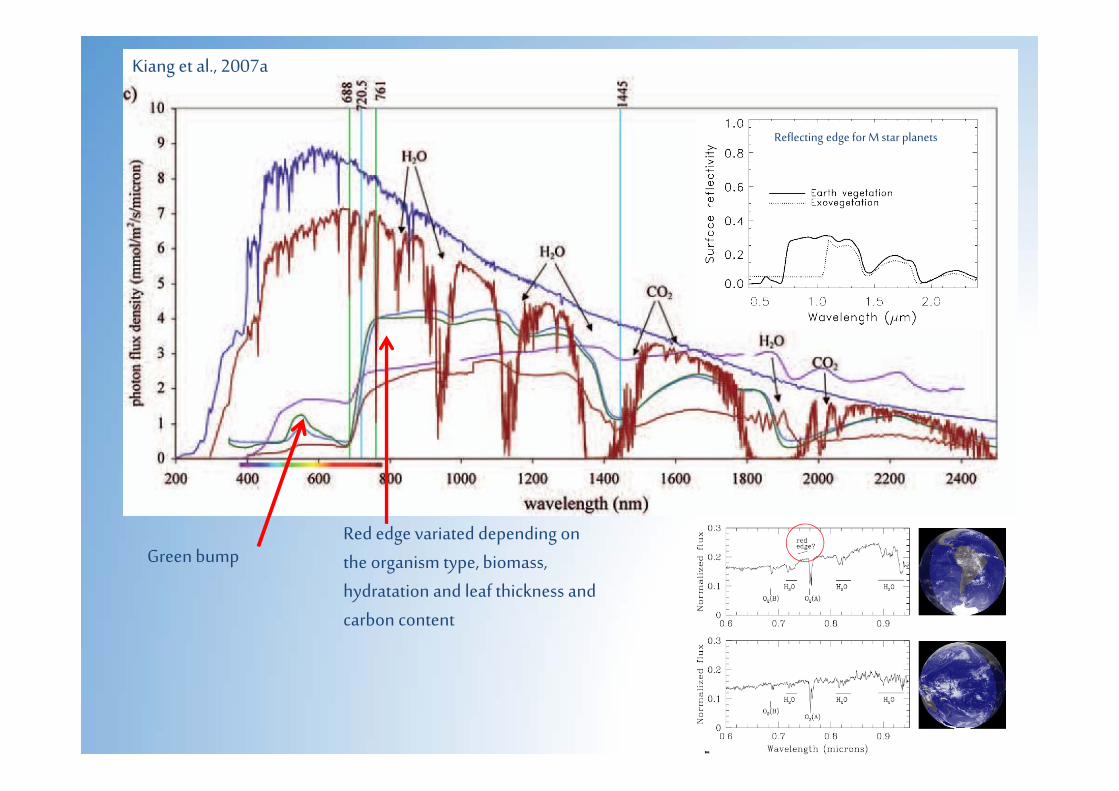
Green bump Red edge variated depending on the organism type, biomass, hydratation and leaf thickness and carbon content
Kiang et al., 2007a
Reflecting edge for M star planets