Page 1
Glacial geomorphology and Late Quaternary glacial History of Hornstrandir, NW Iceland
Ivar Hole
Geology
Supervisor: Anders Schomacker, IGBCo-supervisor: Skafti Brynjólfsson, IGB
Lena Håkansson, IGB
Department of Geology and Mineral Resources Engineering
Submission date: May 2015
Norwegian University of Science and Technology
Page 3
iii
Abstract
The Late Quaternary glacial history of Hornstrandir, NW Iceland, have been investigated. The
area is of special interest because it’s almost unstudied. Several researchers have proposed
that ice free plateaux and nunataks existed in Iceland during the Last Glacial Maximum
(LGM) and Hornstrandir has been considered a likely candidate for such conditions.
Methods such as geomorphological mapping, sediment descriptions of coastal sections and
sampling of material for radiocarbon dating, tephra and cosmogenic exposure dating have
been applied. Detailed geomorphological maps of the area are also presented. Landforms such
as terminal and lateral moraines, hummocky moraines, flutes, rock glaciers, rivers and lakes
have been mapped by detailed field investigations and by visual interpretation of
orthorectified aerial photographs.
Cosmogenic exposure dating has demonstrated that the entire Hornstrandir was covered by
ice during the LGM. Cold based ice that preserved the periglacial surface beneath, was
situated on the upland plateaux. Coastal sections have shown that cirque glaciers in
Hornstrandir coalesced to form valley glaciers that flowed northwards towards the shelf
break. The plateaux didn’t deglaciate until 18 – 14 kyr BP. During the Bølling Interstadial,
sea level stood at least 5 – 9 m above the present. By Younger Dryas time, cirque glaciers in
Hornstrandir once again formed glaciers that at least reached out to the present coast.
Terminal moraines have been used to estimate that the total glaciated area at some point
during deglaciation was 44 km2. The Saksunarvatn tephra (erupted 10180 ± 60 cal. yr BP) has
been sampled at two locations, indicating that most of Hornstrandir was ice-free at Preboreal
time. Neoglaciation on Hornstrandir is reflected in raised beaches yielding ages between
~2100 – 1300 cal. yr BP. During the Little Ice Age (LIA) cirque glaciers reached their
Holocene maximum. The total glaciated area during the LIA has been estimated to 8.2 km2.
Page 4
iv
Sammendrag (Norwegian summary)
Den Sen-Kvartære glasiasjonshistorien til Hornstrandir på NV Island, har blitt undersøkt.
Veldig lite kvartærgeologisk arbeid er blitt gjort i området så Hornstrandir er derfor av
spesiell interesse. Under den siste istids maksimum har det blitt foreslått at flere områder på
Island var isfrie og Hornstrandir har blitt foreslått som en sannsynlig kandidat for slike
forhold.
Hornstrandir har blitt undersøkt gjennom geomorfologisk kartlegging, logging av
sedimentære snitt, prøvetaking av tefra, organsik materiale og steinprøver for kosmogen
nuklid datering. Detaljerte geomorfologiske kart har også blitt produsert. Landformer som
rand- og sidemorener, dødislandskap, fluter, steinbreer, elver og innsjøer er kartlagt gjennom
feltarbeid og tolkning av flybilder.
Kosmogene nuklid dateringer har antydet at hele Hornstrandir sannsynligvis var dekket av is
under siste istids maksimum, hvor kald is dekket de høytliggende platåene. Sedimentære snitt
ved kysten har vist at botnbreene på Hornstrandir dannet dalbreer som beveget seg nordover
mot kontinentalsokkelen. Platåene ble først isfrie for 18000 – 14000 år siden. I løpet av
perioden Bølling Interstadial stod havnivået 5 -9 m høyere enn i dag. Ved Yngre Dryas tid,
dannet botnbreer igjen dalbreer som i hvert fall nådde ut til dagens kyst. Randmorener er blitt
brukt til å estimere at det totale isdekte området under deglasiasjonen etter Yngre Dryas var
44 km2. Asken “Saksunarvatn tefra” er funnet ved to lokaliteter og indikerer at det meste av
Hornstrandir var isfritt i Preboreal tid. På Hornstrandir er den Neoglasiale perioden
representert ved strandvoller, datert ~2100 – 1300 år gamle. I løpet av den lille istid vokste
botnbreene til sitt Holocene maksimum. På Hornstrandir er det blitt estimert at 8.2 km2 var
isdekt under den lille istid.
Page 5
v
Preface
This thesis is written as a part of my Master of Science (M.Sc.) degree in Geology at the
Department of Geology and Mineral Resources Engineering at the Norwegian University of
Science and Technology (NTNU).
I would like express my gratitude to my advisor Anders Schomacker for letting me do this
project and for all the valuable help and feedback I have received, both during fieldwork and
in the writing process for the thesis. A special thanks to my co-advisor Skafti Brynjólfsson for
great discussions and help throughout the project. Jón Bjarni Friðriksson is thanked for great
field assistance and discussions during our time in Hornstrandir.
I would also like to thank my fellow students at NTNU and UNIS, for making the last five
years of study a great experience.
Lastly, I would like to thank my family for all their support. A special thanks to Nils Hole for
read-throughs and for generally showing a great interest in this project.
Page 7
vii
Table of contents
Abstract .................................................................................................................................. iii
Sammendrag (Norwegian summary) ..................................................................................... iv
Preface .................................................................................................................................... v
Table of contents .................................................................................................................. vii
List of figures ......................................................................................................................... ix
List of tables .......................................................................................................................... xi
1. Introduction ........................................................................................................................ 1
1.2 Study area ...................................................................................................................... 2
1.3 The Quaternary ............................................................................................................. 7
1.4 The Quaternary geology of Iceland .............................................................................. 9
1.5 Previous research at Hornstrandir and Vestfirðir ........................................................ 12
2. Methods ............................................................................................................................ 16
2.1 Fieldwork .................................................................................................................... 16
2.2 Geomorphological mapping ........................................................................................ 16
2.3 Coastal section logging ............................................................................................... 17
2.4 Tephrochronology ....................................................................................................... 17
2.5 Radiocarbon dating ..................................................................................................... 18
2.6 Cosmogenic exposure dating (36Cl) ............................................................................ 19
3. Results .............................................................................................................................. 21
3.1 Mapped landforms ...................................................................................................... 21
3.2 Hlöðuvík ..................................................................................................................... 31
3.3 Kjaransvík ................................................................................................................... 32
3.4 Hælavík ....................................................................................................................... 33
Page 8
viii
3.5 Coastal sections – sediment descriptions .................................................................... 38
3.6 14C dating .................................................................................................................... 52
3.7 Tephra analyses ........................................................................................................... 54
3.8 Cosmogenic exposure dating (36Cl) ............................................................................ 59
4. Discussion: Late Quaternary glacial history of Hornstrandir ........................................... 60
4.1 Late glacial maximum (LGM) .................................................................................... 60
4.2 The Bølling Interstadial .............................................................................................. 65
4.3 Younger Dryas (YD) ................................................................................................... 66
4.4 Preboreal ..................................................................................................................... 68
4.5 Neoglacial period ........................................................................................................ 70
4.6 Little Ice Age (LIA) .................................................................................................... 71
5. Conclusions ................................................................................................................... 73
6. References ..................................................................................................................... 76
7. Appendix
Page 9
ix
List of figures
Fig. 1.1: Figure of the study area on Hornstrandir ..................................................................... 2
Fig. 1.2: An overview map showing the bedrock geology in Hornstrandir. .............................. 4
Fig. 1.3: Present day oceanographic setting in the north Atlantic region. ................................. 5
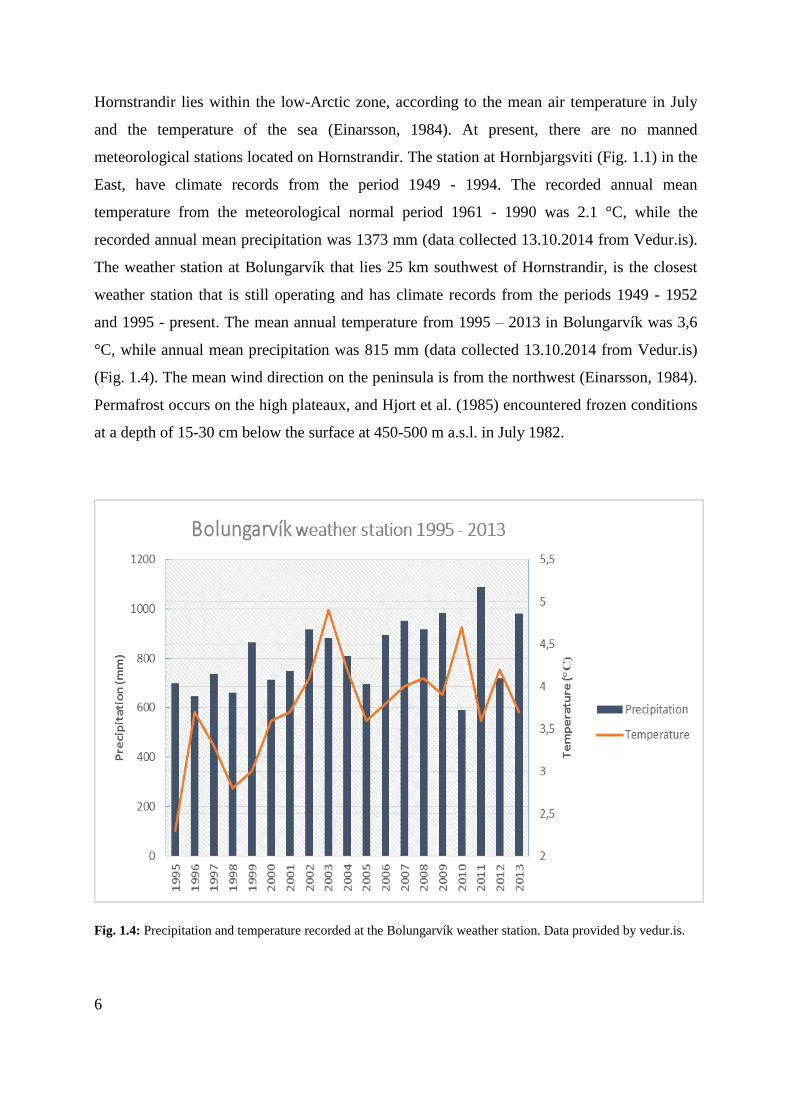
Fig. 1.4: Precipitation and temperature recorded at the Bolungarvík weather station. .............. 6
Fig. 1.5: Time scale of the Quaternary period. .......................................................................... 7
Fig. 1.6: Marine isotope records ................................................................................................ 8
Fig. 1.7A: Inferred LGM B: YD C: Preboreal ice extent in Iceland. ...................................... 11
Fig. 1.8: Summary of the conclusions made by Hjort et al. (1985). ........................................ 13
Fig. 1.9: A series of maps that presents possible ice sheet configurations on Vestfirðir ........ 15
Fig. 3.1: An overview map of the geomorphology at Hornstrandir......................................... 26
Fig. 3.2: Overview map of the geomorphology at the north-western part of Hornstrandir. .... 27
Fig. 3.3: Overview map of the geomorphology at the north-eastern part of Hornstrandir. ..... 28
Fig. 3.4: Overview map of the geomorphology at the south-western part of Hornstrandir. .... 29
Fig. 3.5: Overview map of the geomorphology at the south-eastern part of Hornstrandir. ..... 30
Fig. 3.6: A glacial geomorphology map of Hlöðuvík. ............................................................. 32
Fig. 3.7: A glacial geomorphology map of Kjaransvík. .......................................................... 33
Fig. 3.8: A glacial geomorphology map of Hælavík. .............................................................. 34
Fig. 3.9A: Estimated glacier extent on Hornstrandir during Preboreal time. B: LIA glacier
extent on Hornstrandir. ............................................................................................................. 35
Fig. 3.10A: Moraines in Fljótavík. B: Fluted surface located within the LIA moraines in
cirque 3 in Hlöðuvík. C: Raised beaches in Fljótavík. D: Hummocky moraines in Hlöðuvík.
E: Erratic boulder sitting on a diamict surface upon the plateau. F: Rock glacier in
Mannadalur. .............................................................................................................................. 36
Page 10
x
Fig. 3.11A: Old moraine located in cirque 1 in Kjaransvík. B: Raised beach in Hlöðuvík. ... 37
Fig. 3.12: Legend for the seven coastal sections ..................................................................... 38
Fig. 3.13: Positions of the seven coastal secteion logged at Hornstrandir. .............................. 39
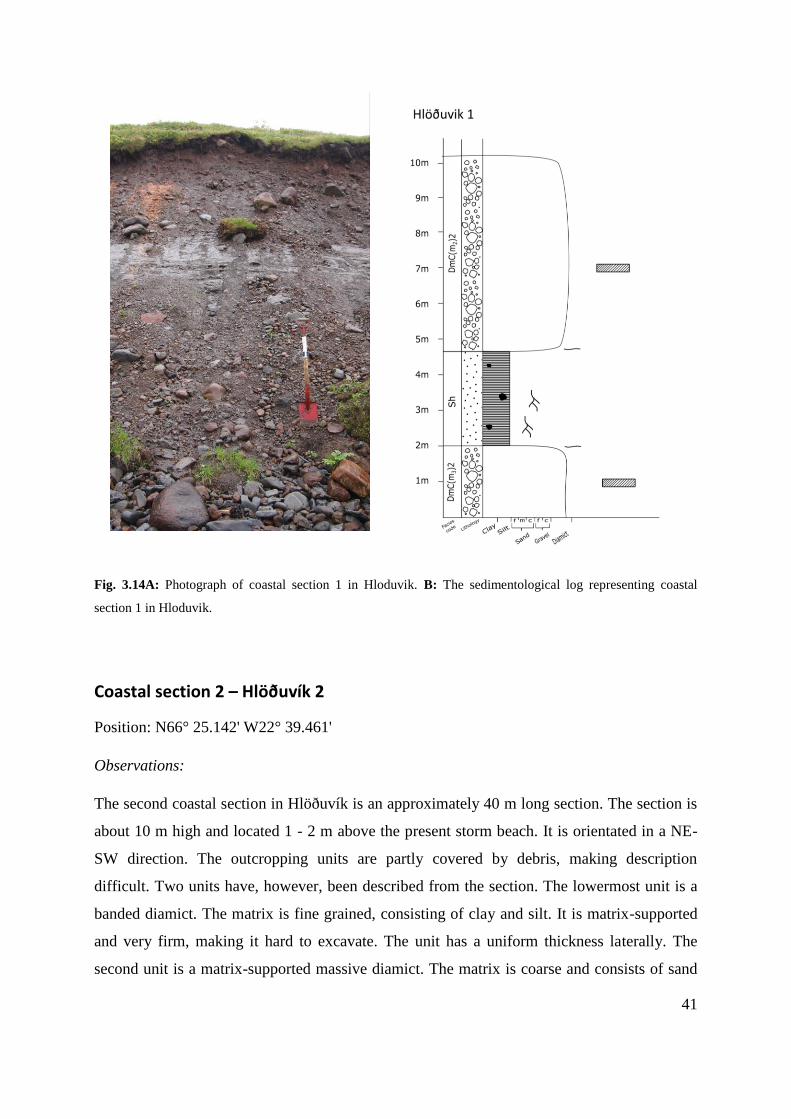
Fig. 3.14A: Photograph of coastal section 1 in Hloduvik. B: The sedimentological log
representing coastal section 1 in Hloduvik. ............................................................................. 41
Fig. 3.15A: Photograph of coastal section 2 in Hlöðuvík. B: The sedimentological log
representing coastal section 2 in Hlöðuvík. ............................................................................. 42
Fig. 3.16A: Photograph of coastal section 3 in Kjaransvík. B: The sedimentological log
representing coastal section 3 in Kjaransvík. ........................................................................... 44
Fig. 3.17A: Photograph of coastal section 4 in Kjaransvík. B: The sedimentological log
representing coastal section 4 in Kjaransvík. ........................................................................... 46
Fig. 3.18A: Photograph of coastal section 5 in Hælavík. B: The sedimentological log
representing coastal section 4 in Hælavík. ............................................................................... 47
Fig. 3. 19A: Photograph of coastal section 6 in Hælavík (Photo: Skafti Brynjólfsson). B: The
sedimentological log representing coastal section 6 in Hælavík. ............................................. 49
Fig. 3.20A: Photograph of coastal section 7 in Hælavík. B: The sedimentological log
representing coastal section 7 in Hælavík. ............................................................................... 51
Fig. 3.21A: Photograph of water escape structures in the lowermost till in Hælavík. B:
Photograph of the Hælavik tephra ............................................................................................ 52
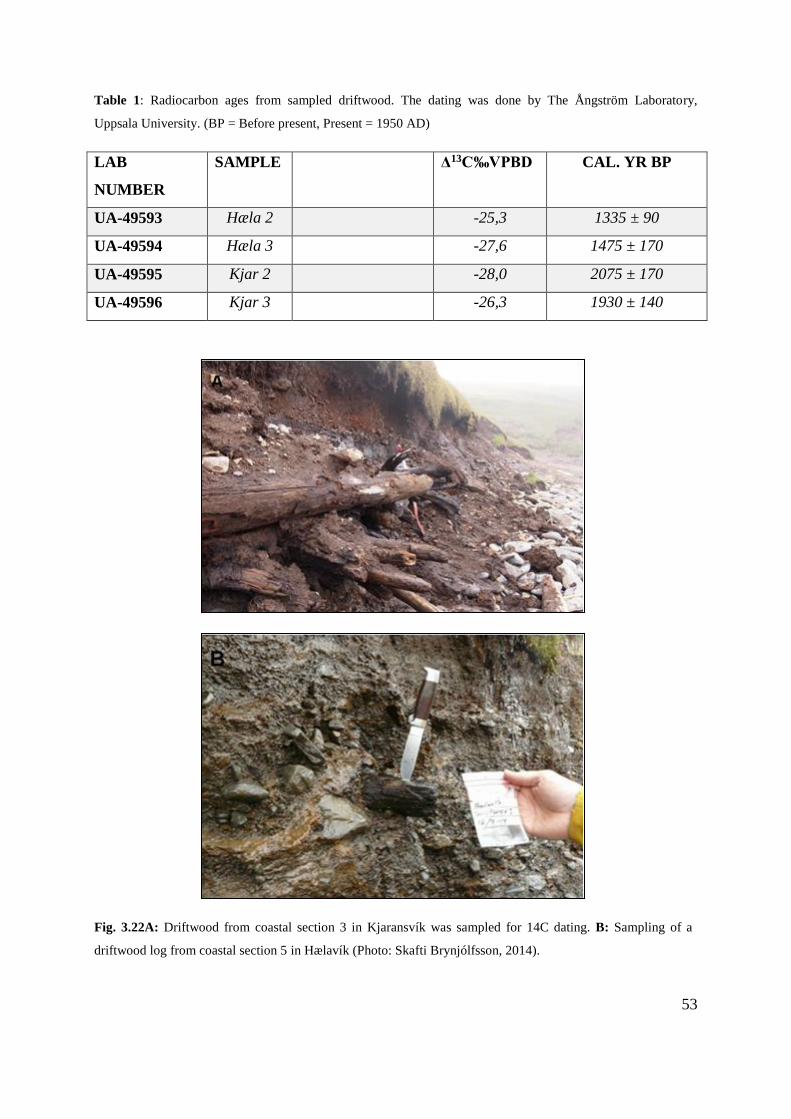
Fig. 3.22A: Driftwood from coastal section 3 in Kjaransvík was sampled for 14C dating. B:
Sampling of a driftwood log from coastal section 5 in Hælavík .............................................. 53
Fig. 3.23: Map presenting the locations where tephras and rock samples for cosmogenic
exposure dating were sampled. ................................................................................................ 54
Fig. 3.24: Plot showing a comparison of the geochemical composition between the tephra
found in Hælavík and Saksunarvatn tephra from other studies................................................ 55
Fig. 3.25: Plot showing a comparison of the geochemical composition between the tephra
found in Hlöðuvík and tephra from other studies..................................................................... 56
Page 11
xi
Fig. 3.26: Plot showing a comparison of the geochemical composition between the tephra
found in Kjaransvík and tephra from other studies. ................................................................. 57
Fig. 3.27A: Picture of the tephra sampled at Kjaransvík. B: Picture of the tephra sampled at
Hælavík. ................................................................................................................................... 57
Fig. 3.28: Photo of sampling rock samples for cosmogenic exposure dating from
Fannalágarfjall .......................................................................................................................... 59
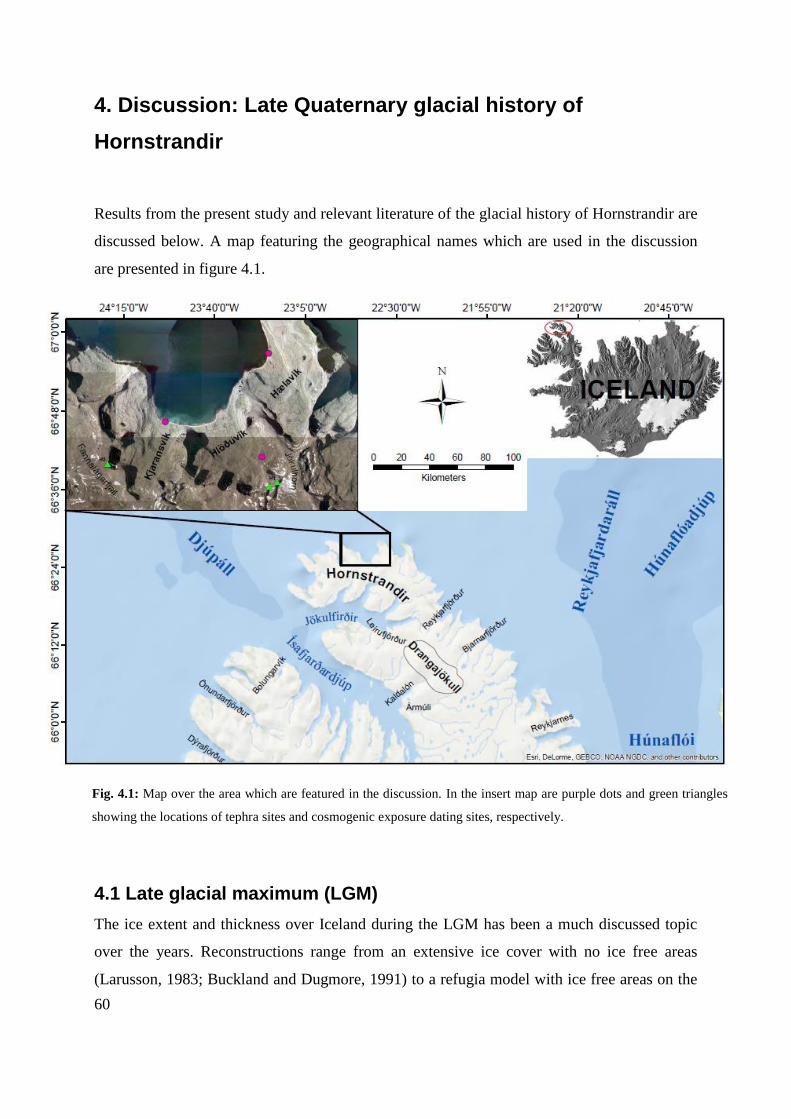
Fig. 4.1: Map over the area which are featured in the discussion. ........................................... 60
Fig. 4.2: Glacial troughs located outside the coast of Hornstrandir......................................... 62
Fig. 4.3: Ice cover on Hornstrandir during the LGM.. ............................................................. 65
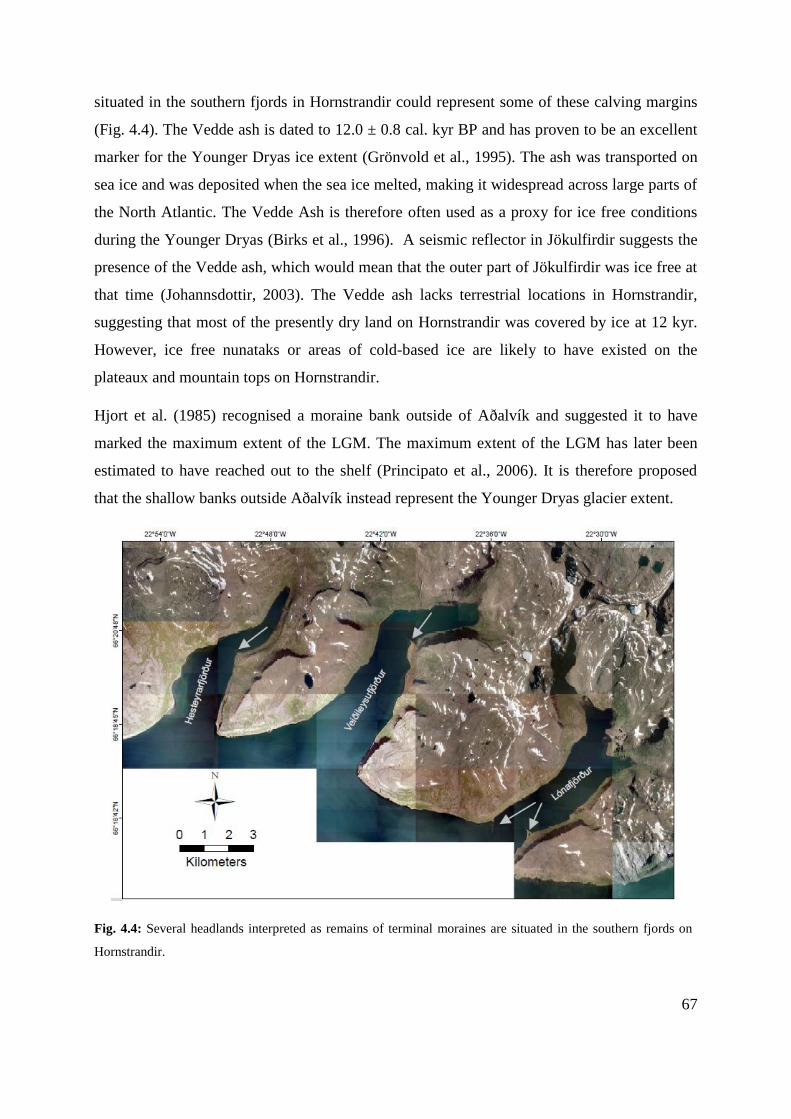
Fig. 4.4: Terminal moraines situated in the southern fjords on Hornstrandir. ......................... 67
Fig. 4.5: Distribution of the Saksunarvatn Ash and rhyolitic Hekla Ash ................................ 68
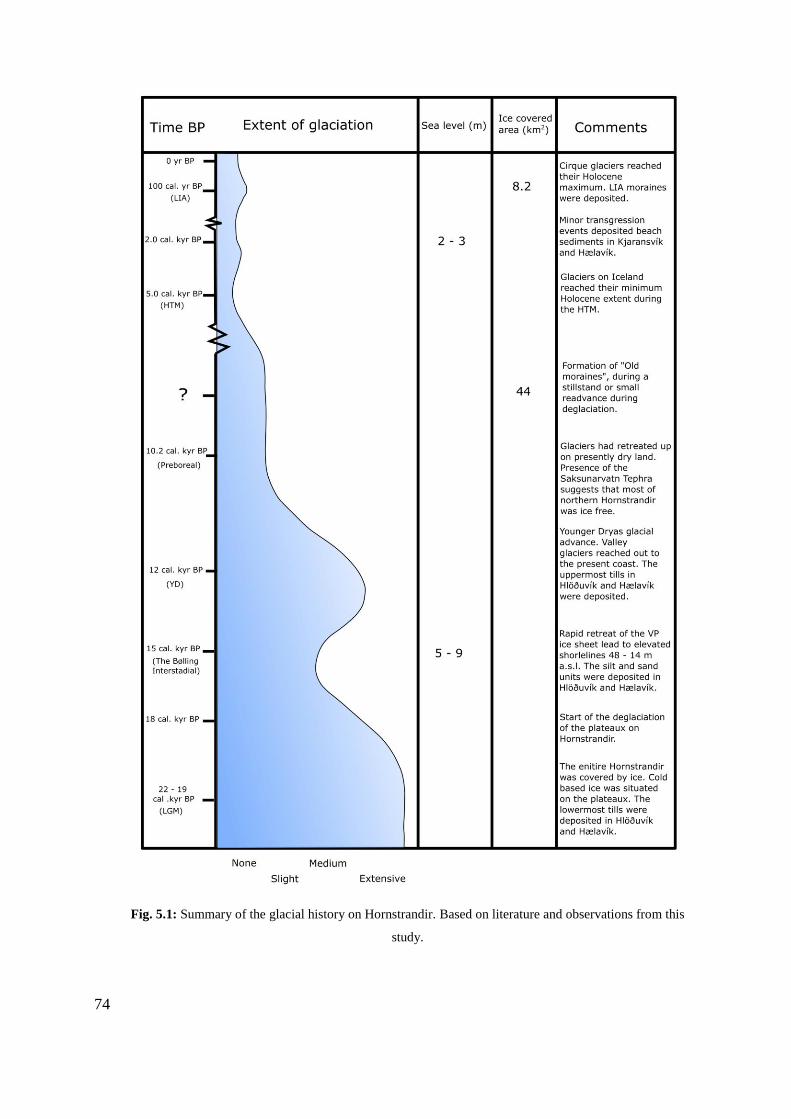
Fig. 5.1: Summary of the glacial history on Hornstrandir. Based on literature and observations
from this study. ......................................................................................................................... 74
List of tables
Table 1: Radiocarbon ages from sampled driftwood. .............................................................. 53
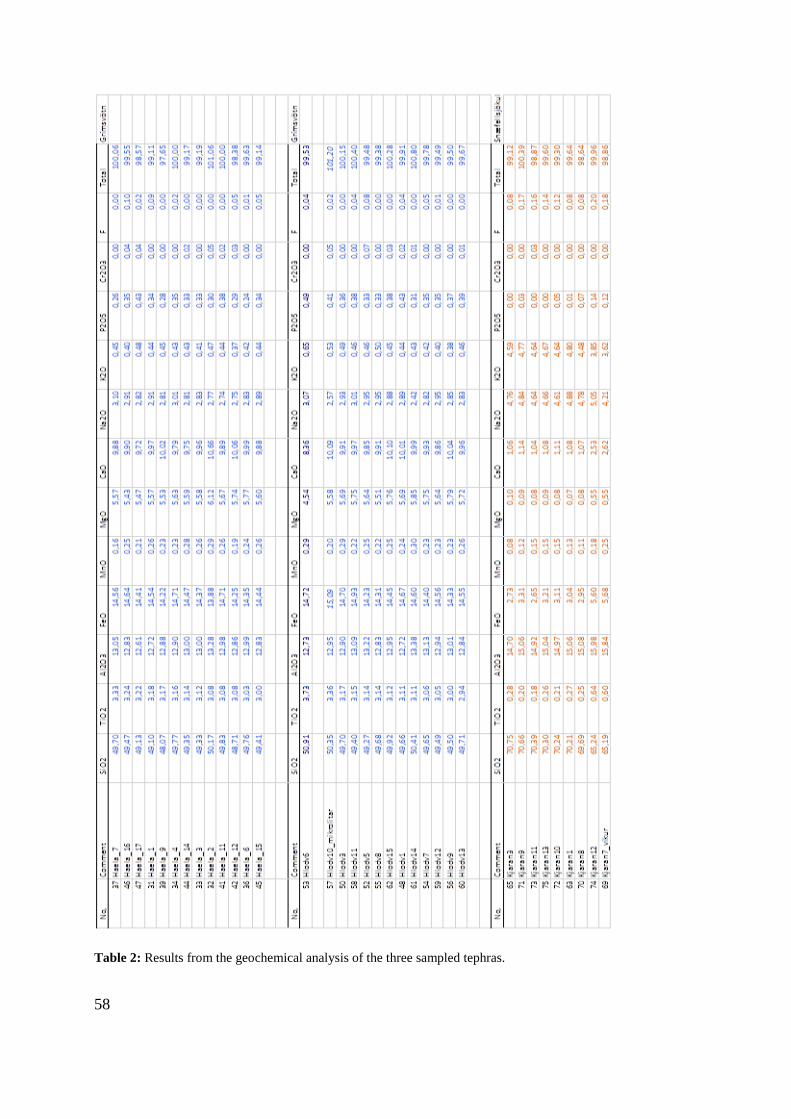
Table 2: Results from the geochemical analysis of the three sampled tephras. ...................... 58
Table 3: 36Cl cosmogenic surface exposure dates ................................................................... 59
Page 13
1
1. Introduction
Hornstrandir is located at the northernmost part of the Vestfirðir peninsula in Iceland. The
area is of special interest because it’s Quaternary and glacial geology is almost unstudied.
There is an ongoing discussion on whether or not some areas in Iceland remained ice-free
during the last glaciation. Hornstrandir has been considered a likely candidate for such ice-
free conditions and perhaps hosting a flora that managed to survive the glaciation. The Little
Ice Age extent of cirque glaciers is also a topic that is under constant discussion.
The aim of this thesis is to improve the glacial history of the area. Appropriate methods such
as geomorphological mapping, sediment descriptions of coastal sections and sampling of
material for radiocarbon, tephra and cosmogenic exposure dating have been applied.
Another key purpose to this project is to present detailed geomorphological maps from
Hornstrandir. These have been produced by detailed field investigations and by visual
interpretation of orthorectified aerial photographs.
The thesis is divided into seven main chapters. Chapter 1 presents the study area and
introduces the previous work that has been conducted in the region. Chapter 2 presents the
different methods that have been applied for the thesis. Chapter 3 presents the results that
have been obtained during fieldwork, remote sensing, dating of erratic boulders and bedrock
and geochemical analysis of tephras and 14C material. Chapter 4 combines the relevant
literature and the results to interpret the Late Quaternary glacial history of Hornstrandir.
Chapter 5 sums up the conclusions made in the previous chapter, while chapter 6 and 7
presents the reference list and appendix for the thesis.
Page 14
2
1.2 Study area
The study area encompasses the Hornstrandir nature reserve, which is the northernmost part
of the Vestfirðir peninsula in Iceland. The region covers a total area of 580 km2 and is
connected to the rest of Vestfirðir by an approximately 6 km thick neck. The residents at
Hornstrandir made their living by hunting, fishing and agriculture until the area was
abandoned in the mid-1900s. Today the area is used for recreation and tourism, mostly during
the summer. There are no roads leading up to the nature reserve so the only way to
Hornstrandir is by boat. The nature reserve was established in 1975. A figure of Hornstrandir,
with the general topography and the most important geographical names used in the text is
shown in Figure 1.1.
Fig. 1.1: The study area is situated at the northernmost part of the Vestfirðir peninsula in Iceland. The main
geographical names are presented on aerial photographs provided by The Icelandic Institute of Natural History.
Page 15
3
1.2.1 General geomorphology
The most striking features of Hornstrandir are its short and wide valleys. Examples are
Hlöðuvík, Hælavík and Kjaransvík. The valleys in Hornstrandir contain several cirques that
occur either alone or as composite ones. They are usually situated in the head of the valleys
and most of the cirques are facing in a north-easterly direction. The altitude of cirque floors is
usually between 200-300 m a.s.l. and the height of the headwall varies between 150-300 m.
Fourteen of the cirques in Hornstrandir still contain small cirque glaciers or remnants of ice.
Most of the cirques containing glaciers are situated at the east side of the peninsula. The
valleys often end as broad coastal lowlands. Another striking feature of Hornstrandir is the
step-like topography, caused by the Neogene flood basalts that the bedrock consists of. At
least eight fjords are carved into Hornstrandir. The fjords on the northern coast are broad and
short, while the fjords on the southern coast are long and narrow with lengths varying
between 7 and 9 km. The fjords lead to an upland plateau between 400 and 700 m a.s.l.
Around Aðalvik in the west, the plateau surface lies around 400 m a.s.l. It rises towards the
east and at Hornvík mountain tops reach up to 700 m a.s.l. The shelf around Hornstrandir is
no deeper than 100 m, and the 50 m depth curve lies about 5 km off the coast in the west and
northwest.
1.2.2 Bedrock geology
In a geological context, Iceland is a young landmass. Three main geological bedrock
formations occur in Iceland. The oldest is the Tertiary Basalt formation which was formed in
the Neogene. Next is the Grey Basalt formation which was formed in the Pliocene and early
Pleistocene, while the Moberg formation was formed in the late Pleistocene and Holocene.
The bedrock in Hornstrandir is mainly composed of Neogene flood basalts with thin
interbedded sedimentary layers, while some of the mountain tops and plateau surfaces in the
east consist of acid extrusives (Fig. 1.2). The bedrock is part of a basalt area, which was
formed by intensive volcanic activity at the start of sea floor spreading in the north Atlantic
(Einarsson, 1973). Basaltic magma has low viscosity and often flows long distances from the
eruption site (Einarsson and Douglas, 1994). The study area is located at least 250 km from
the active rift zones in Iceland, so there are currently no active volcanoes on Hornstrandir
(Flóvenz and Saemundsson, 1993).
Page 16
4
Fig. 1.2: An overview map showing the bedrock geology in Hornstrandir.
1.2.3 Surface deposits
There are only a few references on the surface deposits in Hornstrandir to be found in the
literature. The first observations were made by Thoroddsen during the summers of 1886 and
1887. He recognised that the landscape had been glacially sculpted and observed both glacial
striae and glacial deposits at numerous localities. Kjartansson (1969) observed raised beaches
in Hornvík and on the eastern flank of Kögur (Fig. 3.2). He also mapped outcrops of till in
Hælavík and Hlöduvík and saw that alluvial and aeolian deposits covered most of the
Hornstrandir lowlands. The Hjort et al. (1985) expeditions recorded that the upper plateau was
covered with mature block fields consisting of local bedrock. The plateaux showed no signs
of being covered by active glaciers. They also noted that the valleys and coastal uplands were
covered with Late Weichselian and early Holocene tills. The lower parts of Hælavík and
Hlöduvík contained well developed hummocky topography, while seven cirques in Hlöduvik,
Hælavík and Hornvík showed clear signs of having been glaciated recently (in the Little Ice
Page 17
5
Age; LIA). The cirques had one to several fresh looking moraines in front of them and the
area behind was also looking freshly deglaciated with a sparse vegetation cover (Hjort et al.,
1985).
1.2.4 Climate
The climate of Iceland is classified as cool, temperate maritime (Einarsson, 1984). Iceland’s
location in the middle of the North Atlantic makes it very sensitive to oceanographic changes,
which strongly affect the climate on Iceland. The Norwegian Atlantic Current passes to the
south on its course northwards. One of its branches, the “warm” Irminger Current, circles the
west side of Iceland. Meanwhile, a branch of the cold East Greenland current flows in a
southerly direction through the Denmark Strait West of Iceland. The transition zone between
these two currents is defined as the polar front and its position affects precipitation and
temperature patterns on Iceland (Fig. 1.3) (Malmberg, 1985; Andrews et al., 2000).
Fig. 1.3: Present day oceanographic setting in the north Atlantic region. Black and grey arrows marks warm and
cold ocean currents, respectively (Andrews et al., 2000).
Page 18
6
Hornstrandir lies within the low-Arctic zone, according to the mean air temperature in July
and the temperature of the sea (Einarsson, 1984). At present, there are no manned
meteorological stations located on Hornstrandir. The station at Hornbjargsviti (Fig. 1.1) in the
East, have climate records from the period 1949 - 1994. The recorded annual mean
temperature from the meteorological normal period 1961 - 1990 was 2.1 °C, while the
recorded annual mean precipitation was 1373 mm (data collected 13.10.2014 from Vedur.is).
The weather station at Bolungarvík that lies 25 km southwest of Hornstrandir, is the closest
weather station that is still operating and has climate records from the periods 1949 - 1952
and 1995 - present. The mean annual temperature from 1995 – 2013 in Bolungarvík was 3,6
°C, while annual mean precipitation was 815 mm (data collected 13.10.2014 from Vedur.is)
(Fig. 1.4). The mean wind direction on the peninsula is from the northwest (Einarsson, 1984).
Permafrost occurs on the high plateaux, and Hjort et al. (1985) encountered frozen conditions
at a depth of 15-30 cm below the surface at 450-500 m a.s.l. in July 1982.
Fig. 1.4: Precipitation and temperature recorded at the Bolungarvík weather station. Data provided by vedur.is.
Page 19
7
1.3 The Quaternary
On a million year timescale, Earth has switched between periods with extensive ice cover
(icehouse conditions) and periods with little or no ice cover (greenhouse conditions) (Frakes
et al., 2005). Currently the Earth is in an icehouse state, due to the large ice sheets in the polar
regions. The start of this icehouse period began around 34 million years ago with the onset of
a large Antarctic ice sheet (Barrett, 1996; Anderson et al., 2002). Glaciations in the northern
hemisphere began around 3.2 Ma (Zachos et al., 2001), but it was at the start of the
Quaternary period that the northern hemisphere underwent a cyclic growth of continental size
ice sheets (Benn and Evans, 2010).
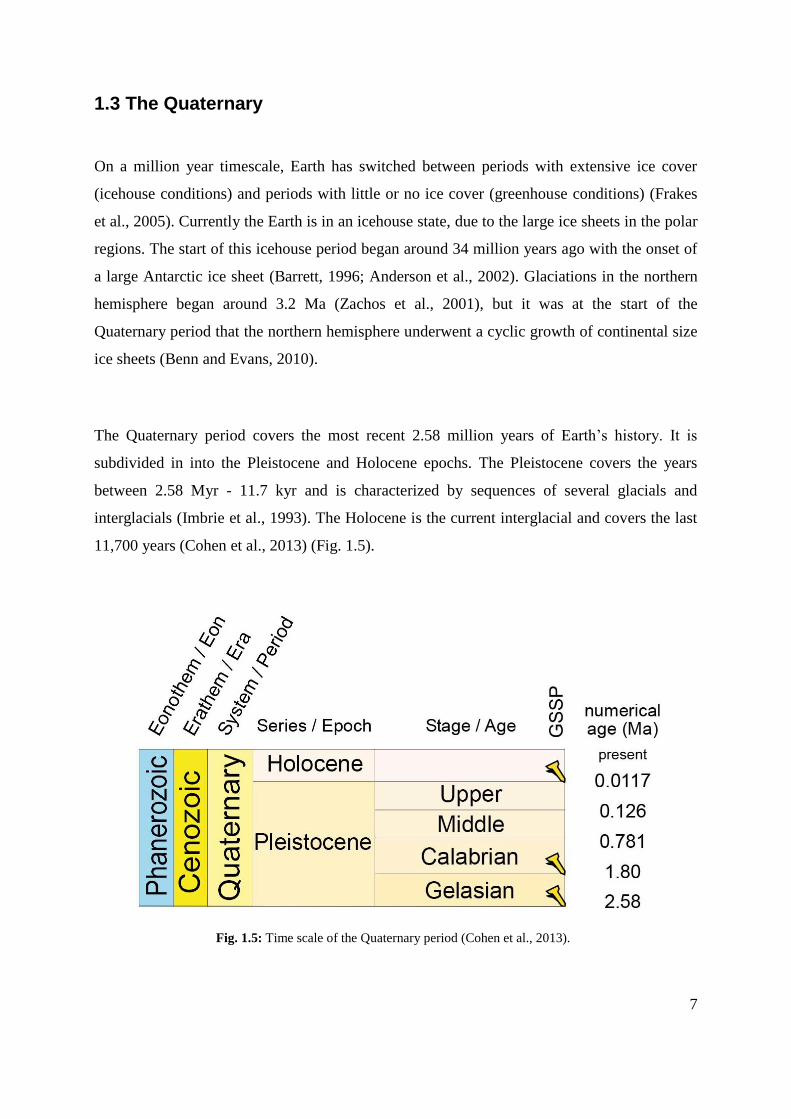
The Quaternary period covers the most recent 2.58 million years of Earth’s history. It is
subdivided in into the Pleistocene and Holocene epochs. The Pleistocene covers the years
between 2.58 Myr - 11.7 kyr and is characterized by sequences of several glacials and
interglacials (Imbrie et al., 1993). The Holocene is the current interglacial and covers the last
11,700 years (Cohen et al., 2013) (Fig. 1.5).
Fig. 1.5: Time scale of the Quaternary period (Cohen et al., 2013).
Page 20
8
The sequence of glacial and interglacial periods is strongly linked to cyclical changes in the
Earth’s orbit round the sun. Three orbital cycles have been identified. The eccentricity refers
to Earth’s orbit around the sun. The orbit is becoming more or less elliptical on a cycle of
about 100,000 years. The obliquity refers to the Earth’s axis. It is relative to the orbital plane
and fluctuates over a 41,000-year cycle. The direction of tilt of the Earth’s axis is also relative
to the distant stars and undergoes a 23,000-year cycle (precession). Taken together, these
cycles cause variations in the amount of solar radiation which is received by the Earth. These
mechanisms are the fundamental inputs to the Earth’s climate system (Hays et al., 1976;
Imbrie et al., 1993).
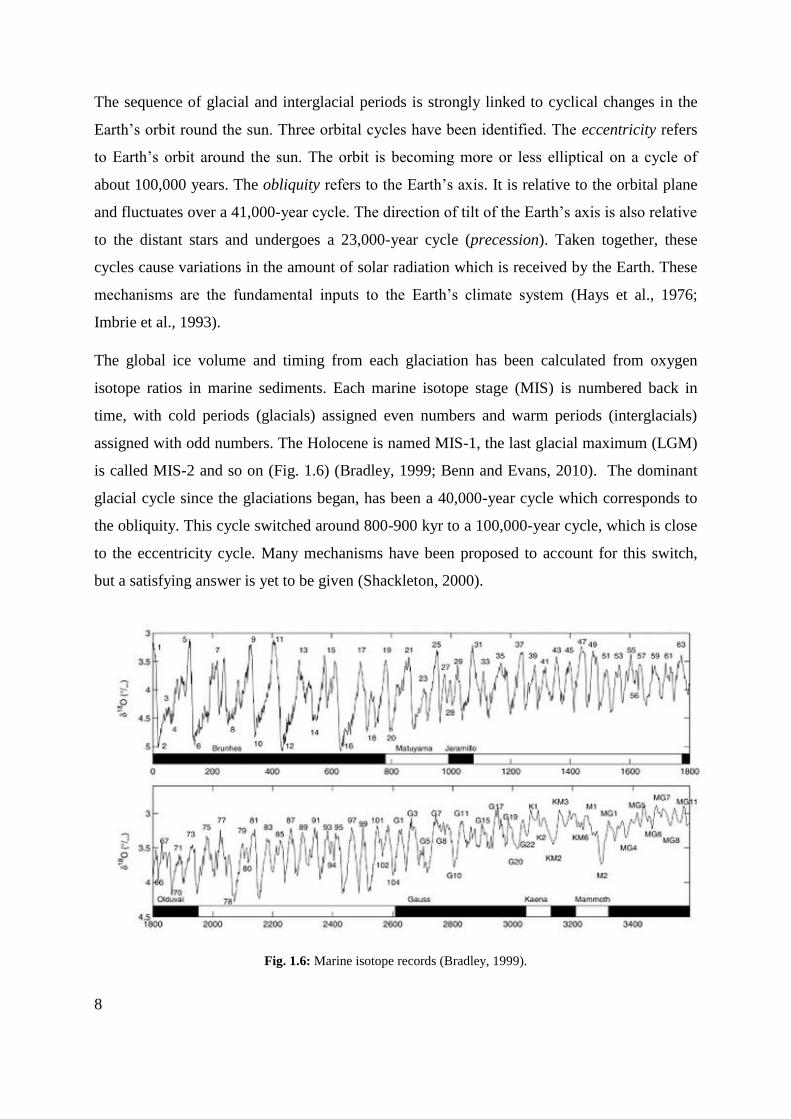
The global ice volume and timing from each glaciation has been calculated from oxygen
isotope ratios in marine sediments. Each marine isotope stage (MIS) is numbered back in
time, with cold periods (glacials) assigned even numbers and warm periods (interglacials)
assigned with odd numbers. The Holocene is named MIS-1, the last glacial maximum (LGM)
is called MIS-2 and so on (Fig. 1.6) (Bradley, 1999; Benn and Evans, 2010). The dominant
glacial cycle since the glaciations began, has been a 40,000-year cycle which corresponds to
the obliquity. This cycle switched around 800-900 kyr to a 100,000-year cycle, which is close
to the eccentricity cycle. Many mechanisms have been proposed to account for this switch,
but a satisfying answer is yet to be given (Shackleton, 2000).
Fig. 1.6: Marine isotope records (Bradley, 1999).
Page 21
9
1.4 The Quaternary geology of Iceland
Pliocene to Late Quaternary glaciations
Stratigraphic and sedimentological studies indicate that Iceland has experienced over 20
glaciations during the last 4-5 Myr (Aronson and Sæmundsson, 1975; Watkins and Walker,
1977; Geirsdóttir et al., 2006). Direct terrestrial evidence lacks for most Quaternary
glaciations, but Iceland’s position on the Mid-Atlantic Ocean Ridge and on top of a hot spot,
means that Weichselian strata in Iceland, not only are preserved in glaciogenic and non-
glaciogenic sedimentary formations, but also in subaerial and subglacial bedrock formations.
The glacial history of Iceland is therefore, obtained from data collected from sedimentary
sequences on land, from offshore sediment cores, as well as from the lava-pile of Iceland
(Norðdahl and Pétursson, 2005; Geirsdóttir et al., 2007). The number of glacial cycles that are
recorded on Iceland, is also in reasonable agreement with the number of glaciations that are
retrieved from the delta 18-O record from deep-sea sediments (Geirsdottir et al., 2009).
Precise dating of each glacial cycle is difficult, but numerous K–Ar dates from lava flows
provide a reliable overall time frame and allow correlation between glacial deposits in
different parts in Iceland (Aronson and Saemundsson, 1975; Watkins and Walker, 1977).
Based on sporadic outcrops of glacial deposits within deeply eroded Pliocene rock sequences,
it is believed the initial glaciation of Iceland occurred between 5 and 3 Ma (Geirsdóttir and
Eiriksson, 1994; Helgason and Duncan, 2001). These glaciations however, are interpreted as
representing local glacier activity rather than a regional ice-sheet glaciation, since none of
these glacial deposits are traceable over long distances (Geirsdottir et al., 2009). The first
progressively advancing ice sheet in Iceland dates back to ca. 2.9 Myr, but the associated
deposits suggests that the glaciation was restricted to the highlands (Watkins and Walker,
1977). By 1.5 Myr approximately seven near full-scale glacial-interglacial cycles are found in
Eastern Iceland. Glacial deposits are lying on striated lava flows but underlying fluvial and
lacustrine sediments capped by younger lava flows (Geirsdóttir et al., 2007). The glacial
stratigraphy of Iceland from 1.5 Myr to the last glaciation is fragmentary, apart from the
Tjörnes section in Northern Iceland that contains nine stratigraphically separated glacial
Page 22
10
deposits. Studies from this section suggest an increase in the intensity of glaciation after 1
Myr when the 100 kyr ice-volume cycle developed (Geirsdóttir and Eiriksson, 1994).
The last glacial maximum (LGM)
Several different reconstructions of the Icelandic ice-sheet during the last glacial have been
proposed. Theories range from extensive glaciation with no ice-free areas (Larusson, 1983;
Buckland and Dugmore, 1991) to a refugia model with ice-free areas where vascular plants
could survive glaciation (Hoppe, 1982; Einarsson and Albertsson, 1988; Ingólfsson, 1991).
During the LGM, ice streams and outlet glaciers from ice divides in central Iceland terminated
at or close to the shelf edge (Spagnolo and Clark, 2009). The extent of the LGM ice sheet on
Iceland is shown in Fig. 1.7a (Kaldal and Víkingsson, 1991; Principato et al., 2006). Evidence
suggests that the Vestfirðir Peninsula in NW Iceland may have supported a dynamically
independent ice cap with valley glaciers or ice streams originating within an ice-divide near
the centre of the peninsula (Hoppe, 1982; Hjort et al., 1985; Andrews et al., 2002b; Principato
et al., 2006; Principato and Johnson, 2009). It has also been hypothesized that small ice-free
areas may have existed along the coastal mountains, particularly in the northwest, north and
east (Ingolfsson, 1991; Andrews et al., 2000). Deglaciation of the LGM ice sheet began by 15
cal. kyr BP and was rapid but step-like. The first indication of regional advance or halt in
deglaciation are found from late Allerød and early Younger Dryas time (Norðdahl and
Pétursson, 2005). During the Younger Dryas (YD), the ice sheet extended across coastal sites
that had been ice-free since the initial deglaciation (Fig. 1.7b). The recession of the YD ice
sheet was stepwise and is reflected in series of terminal moraines in the highlands (Ingólfsson
et al., 2010).
Holocene
The first glacier advance or still-stand of the Holocene time occurred in the early Preboreal
around 9.8-9.6 kyr BP (Fig. 1.7c). The event is called the Buði stage (Hjartarson and
Ingólfsson, 1988; Ingolfsson, 1991). This advance probably terminated around 7.8 kyr BP and
the following glacier distribution is the one that is present on Iceland today (Kaldal and
Page 23
11
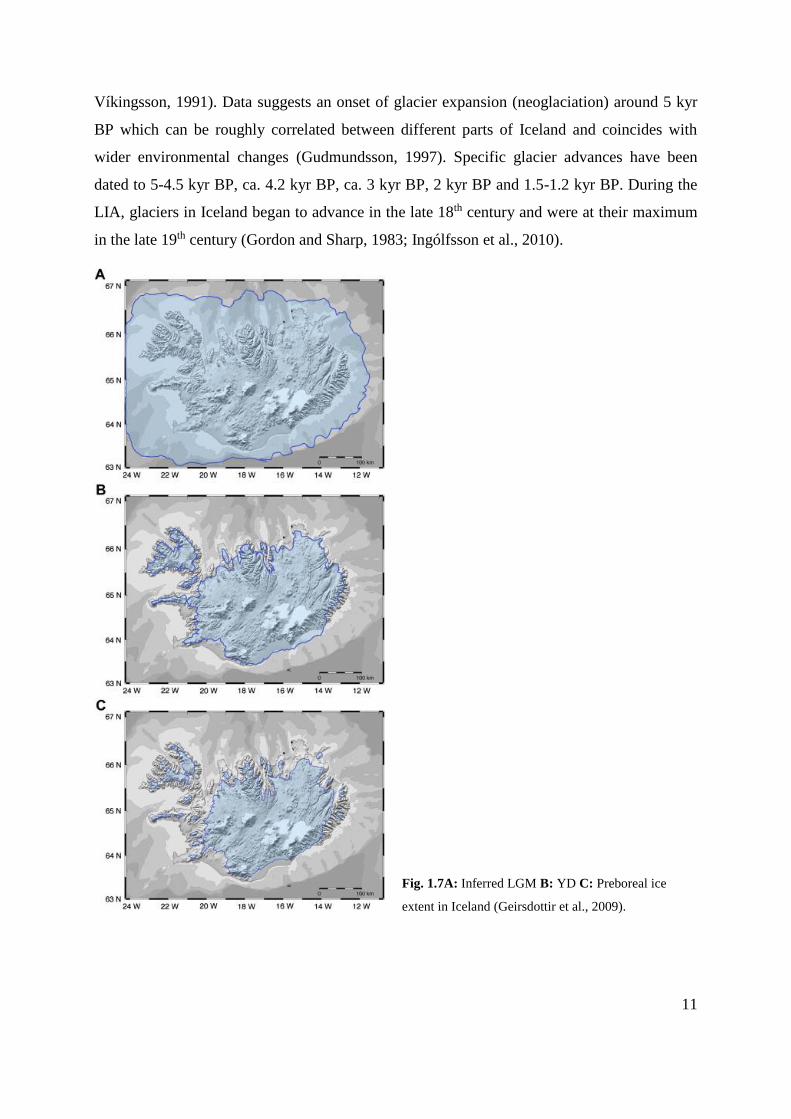
Víkingsson, 1991). Data suggests an onset of glacier expansion (neoglaciation) around 5 kyr
BP which can be roughly correlated between different parts of Iceland and coincides with
wider environmental changes (Gudmundsson, 1997). Specific glacier advances have been
dated to 5-4.5 kyr BP, ca. 4.2 kyr BP, ca. 3 kyr BP, 2 kyr BP and 1.5-1.2 kyr BP. During the
LIA, glaciers in Iceland began to advance in the late 18th century and were at their maximum
in the late 19th century (Gordon and Sharp, 1983; Ingólfsson et al., 2010).
Fig. 1.7A: Inferred LGM B: YD C: Preboreal ice
extent in Iceland (Geirsdottir et al., 2009).
Page 24
12
1.5 Previous research at Hornstrandir and Vestfirðir
Little is known about the glacial history on Hornstrandir and the area is therefore of special
interest because it is almost unstudied. A reconnaissance study was done in the early 1980’s
by Hjort et al. (1985), but since then little work have been done in the area. Before the Hjort
et al. expeditions, only scattered references from Hornstrandir can be found in the literature.
The earliest studies from Hornstrandir were done in 1886 and 1887. The Icelandic geologist
Thorvaldur Thoroddsen recognised that the whole landscape of the Vestfirðir peninsula was
characterized by glacial erosion. He concluded that during the last glacial, the area had been
covered by an extensive ice cap, which was independent from the main Icelandic ice-sheet.
The ice cap however, could not have reached further than out to the valleys and fjords, due to
the absence of submarine valleys on the shallow banks of the Hornstrandir coast (Thoroddsen,
1982a; 1982b). Thorarinsson (1937) later modified Thoroddsens view and suggested that
during the last glacial, the whole Vestfirðir peninsula was characterised by small ice fields on
the plateaux between the fjords, while the central area was covered by a large continuous ice
cap. Outlet glaciers flowed from the central highlands through the fjords, gradually leaving
more space for local glaciers and nunataks (Thorarinsson, 1937).
In the reconnaissance study done by Hjort et al. (1985), the authors studied coastal sections
and air-photographs of the area, along with re-examination of available data in the geological
literature. The authors recognised that the high plateaux showed no signs of having been
covered by active glaciers. By using the plateaux surfaces as an upper limit for actively
eroding glaciers, they concluded that during the maximum glaciation, glaciers in Hornstrandir
could not have reached more than 6-10 km off the present coast. The logged coastal sections
showed that during the last deglaciation in Hælavík and Aðalvík, there was an early retreat on
to presently dry land, followed by a renewed glacial advance and then a final deglaciation. By
that time the sea stood 26-27 m higher than today, before a regression to or below the present
sea level. A summary of the study is shown in Fig. 1.8.
Page 25
13
Fig. 1.8: Summary of the conclusions made by Hjort et al. (1985).
Unlike Hornstrandir, the Vestfirðir peninsula has been the subject to extensive research during
the last decade. It has been proposed that Vestfirðir was covered by an independent ice sheet
during the last glacial. The glacial history of Vestfirðir is therefore of interest when looking at
the glaciation history at Hornstrandir.
Marine cores from Djúpáll have suggested that Vestfirðir was covered by ice during the LGM
(Fig. 1.9a) (Andrews et al., 2000; Geirsdóttir et al., 2002; Andrews et al., 2002b). Cosmogenic
surface exposure dating of boulders, has shown that the coastal uplands on eastern Vestfirðir
were ice free by approximately 20 kyr, while deglaciation of the fjords and valleys occurred
after the coastal uplands during the Bølling Interstadial and is dated to 14.6 cal. kyr BP (Fig.
1.9b) (Principato et al., 2006). This leaves the question whether ice-free area, such as
nunataks, could have hosted refugia for vascular plants surviving glaciation. Coastal mountain
Page 26
14
areas, such as Vestfirðir and Hornstrandir have been considered likely candidates (Hoppe,
1982; Hjort et al., 1985; Einarsson and Albertsson, 1988; Ingolfsson, 1991; Rundgren and
Ingólfsson, 1999). Other theories suggest a more extensive ice cover model with no ice-free
areas, where colonization occurred during the earliest Holocene on ice rafts and in flood
debris, from a rapidly decaying Scandinavian ice sheet (Buckland and Dugmore, 1991).
It is also commonly assumed that two independent ice sheets were present on Iceland during
the LGM, with one covering Vestfirðir and the other covering mainland Iceland. This
hypothesis is based on several observations on Vestfirðir such as raised marine beaches,
glacial erosion patterns and geomorphological features (Hansom and Briggs, 1991; Principato
et al., 2006; Principato and Johnson, 2009). Hjort et al. 1985 argued for a restricted LGM ice
sheet over Vestfirðir, with an ice margin terminating ca 6 km off the northern Hornstrandir
coastline. Alternative hypotheses suggest that the mainland and Vestfirðir ice sheets coalesced
into one single ice sheet, which encompassed the whole of Iceland (Andrews et al., 2000;
Andrews et al., 2002b; Andrews and Helgadottir, 2003). On Vestfirðir, substantial ice streams
are thought to have flowed north and south from Gláma and west from Drangajökull through
Ísafjarðardjup (Ingólfsson and Norddahl, 2001; Roberts et al., 2007) (Fig. 1.9a).
Exact reconstructions of the Younger Dryas ice sheet configuration on Vestfirðir have been
difficult to make. However, studies based on surface exposure dating and marine cores have
suggested a configuration as shown in Fig. 1.9c. The outermost moraine in Kaldalón has been
dated to 11.7 kyr BP and the formation of the moraine corresponds to a stillstand or readvance
during the Younger Dryas (Principato et al., 2006). The occurrence of the Vedde ash has
proven as excellent marker for the Younger Dryas and is dated to 12 cal. kyr BP (Grönvold et
al., 1995). Although the Vedde ash is abundant in marine cores, it is yet to be found in
terrestrial sites on Vestfirðir, which leads to the conclusion that a large portion of eastern
Vestfirðir was ice-covered during the Younger Dryas (Principato et al., 2006).
The Preboreal ice margin is constrained by the presence of the Saksunarvatn Ash and is dated
to 10.2 kyr BP (Grönvold et al., 1995). The Saksunarvatn ash provides an important link
Page 27
15
between marine and terrestrial records, because it is present in both environments. Its
presence supports deglaciation on most of eastern Vestfirðir by Preboreal time (Fig. 1.9d)
(Andrews et al., 2002b).
At most localities in Iceland, LIA advances were the most extensive during the Holocene
(Ingolfssón et al., 2010). At Hornstrandir, Hjort et al. (1985) recorded that 7-10 cirques in
Hlöðuvík, Hælavík and Hornvík showed clear signs of having been glaciated recently.
Glaciers in Hlöðuvík and Hælavík reached 150 m below the altitude of their floors, while
glaciers in Hornvík reached 50 m below the cirque floor. They also estimated that the total
glaciated area on northern and western Hornstrandir during the Little Ice Age was 8-10 km2.
Lichenometric studies showed that the maximum LIA extent was reached around AD 1860
(Hjort et al., 1985).
Fig. 1.9: A series of maps that presents possible ice sheet configurations on Vestfirðir during
A: Last Glacial Maximim, B: Bølling Interstadial, C: Younger Dryas, D: Preboreal
(Geirsdóttir et al., 2002).
Page 28
16
2. Methods
2.1 Fieldwork
During two weeks in July 2014, fieldwork was carried out at Hornstrandir. Valleys, mountain
plateaux, cirques and coastal lowlands were manually surveyed. Landforms and sediments
were described, interpreted and classified according to genesis. The locations of landforms,
sediments and coastal sections were recorded with a Garmin GPSMAP 62sc, with a horizontal
accuracy of c. ±3 m. Seven coastal sections were described and logged. At various sites,
tephra samples and organic material for radiocarbon dating were taken, for further analysis.
For logging coastal sections, a folding ruler and measuring tape were used to measure heights.
Shovels and scrapers were used to clean the sections. On the plateaux were rock samples of
bedrock and erratic boulders taken for cosmogenic surface exposure dating.
2.2 Geomorphological mapping
The Geographical Information System (GIS), ESRI ArcMap 10.2, was used to manually
digitize all the landforms and features that were examined in the field. Due to limitations in
fieldwork time, the whole study area could not be surveyed manually. Coastal sections and
valleys in Hlöðuvík, Hælavík and Kjaransvík have been surveyed in detail. The rest of the
Hornstrandir has been mapped by visual interpretation of orthorectified aerial photographs in
ArcMap 10.2. The aerial photographs have been provided by The Icelandic Institute of
Natural History and have a 0.5-m size and date from 2005 and 2006. A Digital Elevation
Model (DEM) with 20 m ground resolution from 2011 has also been used. The
ISN93/WGS84 has been used as a reference system. Terminal and lateral moraines, flutes,
raised beaches, hummocky moraines, rivers and lakes were mapped. Polygons have been
drawn to represent different sediments and surfaces, while polylines have been used to
represent streamlined features such as e.g. rivers and flutings. Other morphological features
such as landslides, debris flows, solifluctation patterns and vegetation cover were not mapped.
Page 29
17
2.3 Coastal section logging
Coastal sections were logged at seven different locations in Hornstrandir (Fig. 3.12).
Valuable information on Quaternary environments can be gained by studying glacial
sediments. Sediment descriptions are used to make interpretations about the depositional
environment based on sediment properties such as lithology, texture, bedding, sedimentary
structures and palaeo-current data. The distinctive properties of many glacial sediments allow
interferences to be made about former glacier types, the mode of sediment deposition, ice-
flow directions and the sources of sediment supply. Sedimentary sequences also reflect
sediment accumulation over time and therefore environmental change can be obtained with
both temporal and spatial aspects. Fossils can also occur abundantly in Quaternary strata and
these fossils makes for excellent climatic proxies (Lowe and Walker, 1997).
Quaternary sediments are usually unconsolidated and are divided in two main groups:
inorganic (clastic) deposits and biogenic sediments. The clastic sediments consist of mineral
particles ranging in size from very fine clays to large boulders. Biogenic sediments consists of
remains of plants and animals (Hubbard and Glasser, 2005).
Graphic data charts for the presentation of glacial stratigraphy are widely used in the literature
and many forms of data charts have been developed. For this project the data chart presented
by Krueger and Kjaer (1999) has been used. The legend used for the sedimentological logs is
shown in figure 3.13.
2.4 Tephrochronology
Tephra samples were taken from coastal sections in Kjaransvík and Hælavík. The samples
were later made into polished thin sections at NTNU. The geochemistry of the tephra samples
was analysed at the University of Copenhagen, Denmark. A JEOL Super probe JSL 8200 with
an acceleration voltage of 15 kV, a 10-nA beam current and a beam diameter of 7µm were
used. In addition to natural and synthetic minerals, glass standards (K22_ ATHO and
K15_KL2) were used as standards.
Many of the volcanic systems in Iceland have chemical characteristics (fingerprints) that
allow their products to be distinguished from other volcanic systems. By analysing the tephra
Page 30
18
samples, it is therefore possible to pinpoint the exact volcanic system responsible for the
tephra (Larsen and Eiriksson, 2008).
During a volcanic eruption, large amounts of ash are ejected into the atmosphere. These
materials are often spread over large areas downwind of the volcanic source. The tephra will
rapidly accumulate and form a thin ash cover in places like lakes, on peat surfaces, on river
terraces, on the sea bed and in glacier ice. Acid ash beds often stand out as distinctive light-
coloured horizons in sedimentary sequences, while basaltic tephra are black or dark-coloured.
They are usually found in sediment cores or in coastal sections (Einarsson and Douglas,
1994). On the geological timescale, volcanic eruptions is essentially an instantaneous event
and the tephra layers provide distinctive and often widespread isochronous marker horizons.
These horizons offer a valuable basis for inter-site correlation (Walker, 2005). The age of the
tephra can be dated by radiocarbon dating of organic material associated with the ash layer, or
by K-Ar dating, fission track, luminescence or ESR dating of the tephra itself (Lowe and
Walker 1997).
2.5 Radiocarbon dating
Organic material was sampled from driftwood, found in coastal sections in Kjaransvík and
Hælavík. The samples were dried and submitted for radiocarbon dating at the Ångström
Laboratory, Uppsala University. The 14C ages of the driftwood samples were calibrated with
IntCal09 according to Reimer et al. (2013).
Radiocarbon dating gives an absolute age of organic material by using the radioactive isotope
14C. Organic material is usually abundant in lacustrine, marine, glacial and soil sections and
this makes radiocarbon dating an excellent tool for dating Quaternary stratigraphy. Although
the method only spans over a small portion of the Quaternary, it is one of the most widely
used dating techniques. 12C, 13C and 14C is the three forms of carbon, where 12C and 13C are
stable isotopes and 14C is unstable. 12C is by far the most abundant and comprises around
98.9% of all naturally occurring carbon. 13C forms around 1.1% and 14C forms about 1000
ppm. All living organisms absorb carbon through photosynthesis or breathing and the ratio of
the different carbon isotopes in living organisms and the atmosphere is always the same. In
other words, levels of 14C in living plants and animals are the same as in the atmosphere.
Page 31
19
However, when an organism dies, it gets isolated from its 14C source. Since 14C is a
radioactive isotope it will decay to 14N and the amount of 14C will decrease over time. The
decay rate is known. By measuring the amount of 14C in dead organisms, it is therefore
possible to calculate the age to the organism. The half-life of a 14C atom is 5730 years. This
means that the dating method spans approximately over the last 45,000 years (Libby, 1955;
Lowe and Walker, 1997; Walker, 2005). Two approaches are used to measure the amount of
14C in a sample; conventional radiocarbon dating and accelerator mass spectrometry (AMS).
The conventional method counts beta particle emissions from 14C atoms over a period of time
in order to determine the rate of emissions and hence the activity of the sample. AMS counts
the actual number of 14C atoms in a sample of material (Bowman, 1990). The samples from
Hornstrandir were analysed by AMS.
2.6 Cosmogenic exposure dating (36Cl)
Three rock samples from erratic boulders were taken on the plateaux on Hornstrandir, for
cosmogenic exposure dating purposes (Fig 3.23). The samples were prepared and dated at the
PRIME-Lab, Purude University in USA.
In Quaternary science, cosmogenic exposure dating has been used to determine exposure ages
of rock surfaces. The Earth’s surface is constantly bombarded by cosmic rays (high-energy
charged particles). When these particles collides with atoms within a rock mineral, they can
dislodge protons from the atom, thus creating an isotope or a different element. These
dislodged isotopes are absorbed within the mineral and the concentration of the accumulated
isotopes are directly related to the time the rock sample has been exposed for cosmic rays
(Walker, 2005). For the rock samples from Hornstrandir are Chlorine-36 (36Cl) nuclides used
to date the surface exposure age.
A number of assumptions underlie cosmogenic exposure dating. Firstly, it is assumed that the
rock sample being dated doesn’t contain any cosmogenic isotopes from previous exposure.
Second, it is assumed that the surface has not been eroded significantly since the time of
initial exposure. Carefully field sampling can to some extent sort this, but it remains a source
of uncertainty. Shielding from cosmic radiation, by either snow, soils or sediments can also
underestimate the exposure age of a sample. All of these assumptions generate uncertainties
Page 32
20
in the cosmogenic exposure ages. At present, the uncertainties are in the range of 10 – 20%.
However, improved understanding of the factors contributing to cosmogenic nuclide
production rates mean that the total uncertainty in exposure ages is continually improving
(Gosse and Phillips, 2001).
Page 33
21
3. Results
3.1 Mapped landforms
Several glacial and periglacial landforms have been mapped in the Hornstrandir area, by field
observations and extensive interpretation of orthorectified aerial photos. Figure 3.1 provides
an overview of the different locations that have been mapped. Figs 3.2, 3.3, 3.4 and 3.5
presents the distribution of the landforms that are mapped in Hornstrandir. Firstly, the
different glacial and periglacial landforms that have been mapped are presented and examples
are given from Hornstrandir. Then the geomorphology in Hlöðuvík, Kjaransvík and Hælavík
are described. Separate maps have been made from these locations (Figs 3.6, 3.7 and 3.8).
Moraines:
Ice-marginal moraines are ridges formed by the deposition or deformation of sediments at the
margin of an advancing or stationary glacier. The outermost moraine, which marks the limit
of a glacier advance, is known as a terminal moraine. Younger moraines formed within a
terminal moraine, which are formed by minor readvances or stillstands, during an overall
glacier recession are called recessional moraines. Terminal and recessional moraines may be
subdivided into frontal and lateral components (Benn and Evans, 2010).
The moraines at Hornstrandir have been mapped in two different colour classes. LIA moraines
(brown colour) are moraines which are interpreted to have been formed from the LIA until
present. The LIA moraines appear as curved ridges in front of cirque glaciers or recently
glaciated cirques. They are less vegetated than older ones and they generally look more fresh.
The outermost LIA moraines indicate the maximum extent of the glaciers during Little Ice
Age. The zones within the moraines are interpreted as the LIA subglacial surface. This
surface consists of basal till with little or no vegetation, and is sometime fluted. Most LIA
moraines are found at an elevation between 300 – 400 m a.s.l. LIA moraines in Hlöðuvík are
situated at a height of 280 – 300 m. Figure 3.9B presents a reconstruction of the glacier extent
on Hornstrandir during the LIA. The extent of LIA glaciers have been drawn to the outermost
LIA moraines. In glaciated cirques without any moraines, only the present glacier ice is
Page 34
22
mapped. It has been estimated that 21 cirques were glaciated during the LIA. Together, the
total glaciated area during the LIA has been calculated to 8.2 km2. Hjort et al. (1985)
calculated the total LIA glacier extent to be 8 – 10 km2, which fits well the estimate from the
present study.
Moraines that are interpreted older than the LIA are mapped as Old moraines (black colour).
The moraines in Hornstrandir mainly occur as end moraines in front of cirques. Their length
ranges from 30 – 500 m. They look more weathered than LIA moraines, are wider and have
more rounded shapes (Fig. 3.11A). The outermost Old moraines in several valleys have been
used to create a map, estimating the glaciated area on Hornstrandir at some point during
deglaciation of the Vestfirðir ice sheet (Fig. 3.9A). The total glaciated area, indicated from the
Old moraines have been estimated to 44 km2. The age of these moraines are discussed in
chapter 4.
Presently are fourteen of the cirques still containing small cirque glaciers or remnants of ice.
Most of the moraines are situated in front of cirques that face in a W-SW direction. These
cirques face the lee side of the main wind direction (The main wind direction is E, NE
according to Einarsson, 1976) and are therefore more likely to accumulate enough snow to
create cirque glaciers. The most distinctive sets of both LIA moraines and Old moraines are
found up in the valley in Fljótavík (Fig. 3.10A).
Hummocky moraines:
Hummocky moraines refer to a moundy and irregular topography. The term has been used in
a wide range of senses and the origin is still debated. Most authors however, refer to
hummocky moraines as moraines that have been deposited during melt-out of debris mantled
glaciers (Benn and Evans, 2010).
Page 35
23
Hummocky moraines have been remotely mapped at several locations in Hornstrandir, for
example in Hesteyrardalur and at Vestur Aðalvík (Fig. 3.4). Hummocky moraines were also
observed and mapped in Hlöðuvík (Fig. 3.10D) and Hælavík during the fieldwork. The
hummocky moraines consist of mature and well vegetated diamicts.
Flutes:
Flutes are streamlined ridges of sediment aligned parallel to former glacier flow. Flutes are
formed during movement of a glacier where weak, saturated sediments are squeezed under
pressure into small lee-side cavities behind obstructions on the bed (Benn and Evans, 2010).
The height and width vary from a few tens of centimetres to a few meters. They usually occur
in clusters and commonly begin on the lee side of lodged boulders, continuing down-glacier
as narrow ridge for distance of few to several hundred meters, although this is not always the
case. Due to low preservation potential, flutes are most common on modern glacier forelands,
rather than in older terrain (Gordon et al., 1992; Benn and Evans, 2010).
Flutes are only found at two localities in Hornstrandir. One set of flutes is situated in front of
the glacier in cirque 3 in Hlöðuvík (Fig. 3.10B). The flutes are usually about 20-100 m long,
constituting of coarse grained diamicts. The second set of flutes was remotely observed and is
located in front of the glacier in Blöndudalir (Fig. 3.5). All flutes are mapped within the LIA
moraines.
Assorted periglacial landforms on the plateaux:
Up on the high plateaux around Hlöðuvík, Kjaransvík and Hælavík, several periglacial
features were examined in the field. This includes features such as blockfields, polygons,
sorted stripes, tors and weathered bedrock. The blockfields consist of considerably weathered
sub-angular to angular blocks. Diamicts were observed at a few locations (Fig. 3.10E).
However, it was difficult to make a certain classification of its origin, whether it was locally
weathered bedrock or glacial deposits. Polygons are also present on the plateaux. They consist
of medium to coarse grained sediments and are usually between 1 – 3 m in diameter. All in
all is there little evidence of any recent cover of actively eroding glaciers on the high plateaux.
Page 36
24
However, glacially transported erratic boulders are scattered on the plateaux, suggesting that
the plateaux have been covered by ice at some point.
Rock glacier:
Rock glaciers are located at the foot of free rock faces and take the form of 20-100 m thick
tongue- or lobe-shaped bodies covered by coarse debris. Rock glaciers flow at a rate of 0.1-1
m a year, making them considerably slower than normal glaciers (Humlum, 1996). The origin
of rock glaciers is unclear, and a few different types of rock glaciers have been suggested.
Some authors suggests a non-glacial (periglacial) origin (e.g. Wahrhaftig and Cox, 1959;
Barsch, 1992), others have argued that rock glaciers are glacier derived (e.g. Potter, 1972;
Humlum, 1988). Others suggests a landslide origin for some rock glaciers (e.g. Johnson,
1984; Humlum et al., 2007).
A landform located at the head of Mannadalur is interpreted to be a rock glacier (Fig. 3.10F).
The interpretation is purely based on the interpretation of aerial photographs, since the area
could not be surveyed manually during fieldwork. The formation is a lobe shaped tongue with
very little or no vegetation. The structure and geomorphology closely resemble rock glaciers
as they are described by Humlum (1996). Whether this is, an active or relict rock glacier is not
known. However, in a study of rock glaciers in the Tröllskagi peninsula, N-Iceland, Farbrot et
al. (2007) mapped active rock glaciers with terminus down to an elevation of 800 – 900 m
a.s.l. The proposed rock glacier in Mannadalur has a terminus at 150 m a.s.l. suggesting that
the rock glacier is no longer active.
Page 37
25
Raised beaches
Raised beach ridges may serve as indicators of past sea level and shoreline positions
(Otvos, 2000). Raised beaches are present at several locations in the valley lowlands and
coastal plains at Hornstrandir. Distinct sets of raised beaches are mapped in Fljótavík and
Hornvík. These sets of raised beaches are based on visual interpretation from aerial
photographs, where they occur as straight or curved ridges (Fig. 3.10C). It is common that
the ridges dam up lakes or redirect rivers. At Hlöðuvík, a distinct beach ridge is present. It
is located about 2 m over the present storm beach (Fig. 3.11B).
Lakes
Apart from Fljótsvatn, Staðarvatn and Rekavíkvatn, there are no major lakes situated at
Hornstrandir. Small lakes are spread out evenly throughout the area. Most lakes are situated
in the valley lowlands, while very few lakes occur up on the plateaux. The lakes seem to
occupy structural depressions in the bedrock rather than being formed as moraine-dammed
lakes. Exceptions are however found in Hælavík where a set of moraines has dammed up
several small lakes. Small dams and lakes have also been created in the hummocky
moraines that are observed at different locations. Fljótsvatn, the biggest lake in
Hornstrandir, has a total area of 4.6 km2 and receives its water from nine cirques
surrounding the lake. None of these cirques are presently containing glaciers.
Page 38
26
Fig. 3.1: An overview map of the geomorphology at Hornstrandir. See Figs 3.2, 3.3, 3.4 and 3.5 for more
detailed maps. See digital supplementary data for full version of the map.
Page 39
27
Fig. 3.2: An overview map of the geomorphology at the north-western part of Hornstrandir.
Page 40
28
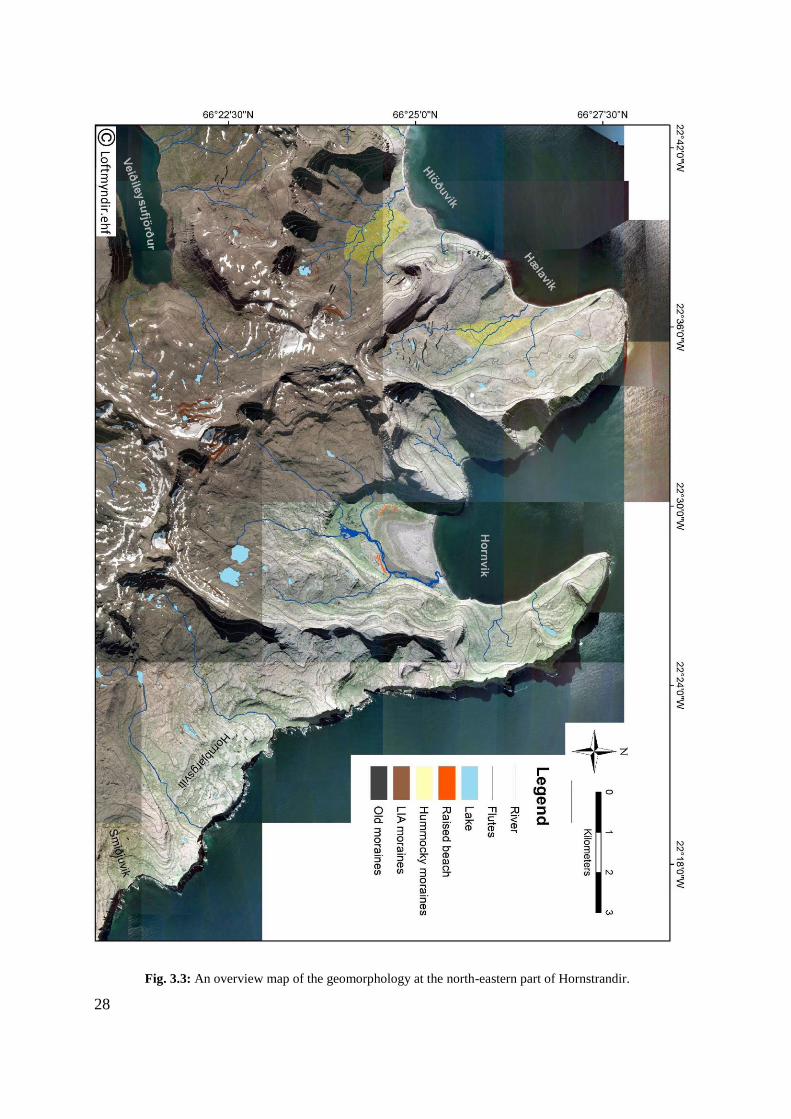
Fig. 3.3: An overview map of the geomorphology at the north-eastern part of Hornstrandir.
Page 41
29
Fig. 3.4: An overview map of the geomorphology at the south-western part of Hornstrandir.
Page 42
30
Fig. 3.5: An overview map of the geomorphology at the south-eastern part of Hornstrandir.
Page 43
31
3.2 Hlöðuvík
A detailed map of the glacial geomorphology in Hlöðuvík is presented in Fig. 3.6.
The coastal section in Hlöðuvík is about 3 km long. The valley inside Hlöðuvík is about 2 km
wide and 4 km long. The valley lowlands are characterized by well vegetated hummocky
moraines. Several small lakes occur in the irregular terrain. Six main rivers drain the cirques
at the head of the valley and they eventually merge into one near the coast. Snow melt is the
main water source for these rivers.
Only one cirque, Cirque 3, out of the seven cirques in Hlöðuvík contains glacier ice.
However, five of the cirques in Hlöðuvík are fronted by small moraines, suggesting that at
least these cirques were glaciated at some time. Moraines in front of cirques 1, 2 and 6 are
mapped as Old moraines. These moraines are fairly weathered and surrounded by a mature
vegetation cover. Moraines in cirque 3 and 4 are mapped as LIA moraines. These moraines
occur as a complex of several well developed ridges, consisting of gravelly and boulder-rich
diamicts. The moraines are sparsely vegetated and look fresher than the other moraines. The
moraine complex in cirque 3 is approximately 500 m long and 150 wide. Due to snow cover,
the height of the moraines was impossible to measure. The surface within the recent moraines
looks much fresher than the surface outside them. A fluted surface is mapped within the LIA
terminal moraines in cirque 3. Due to snow cover during the fieldwork the flutes were
impossible to observe in the field. The flutes are however very distinct on the aerial
photographs (Fig. 3.10B). The flutes vary in length between 20-80 meters. Three medial
moraines are mapped in Hlöðuvík. Two are situated between cirques 3 and 4, while one is
located between cirques 6 and 7.
Page 44
32
Fig. 3.6: A glacial geomorphology map of Hlöðuvík.
3.3 Kjaransvík
A detailed map of the glacial geomorphology in Kjaransvík is presented in figure 3.7.
The coast along Kjaransvík is about 2 km long. The valley inside is approximately 4 km long
and 4 km wide. Five cirques are situated in Kjaransvík. Cirque 1 are facing W, cirque 2 are
facing NW, cirque 3 are facing N, while cirque 4 and 5 are facing NE. None of the cirques
host glacier ice at present. Two of the cirques in Kjaransvík have moraines in front of them.
All of these moraines are interpreted as Old moraines. They have a good amount of
vegetation cover and look considerably older and more weathered than the recently formed
LIA moraines (Fig. 3.11A). Generally Kjaransvík does not show signs of having been
glaciated recently.
Page 45
33
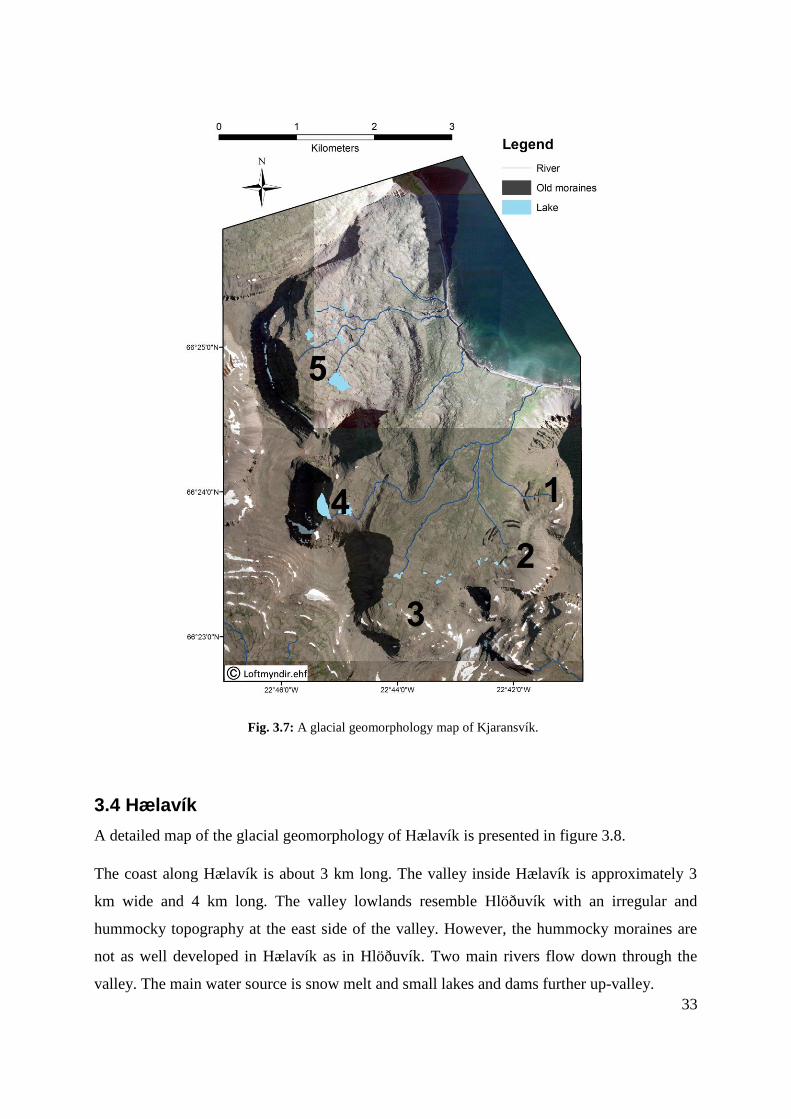
Fig. 3.7: A glacial geomorphology map of Kjaransvík.
3.4 Hælavík
A detailed map of the glacial geomorphology of Hælavík is presented in figure 3.8.
The coast along Hælavík is about 3 km long. The valley inside Hælavík is approximately 3
km wide and 4 km long. The valley lowlands resemble Hlöðuvík with an irregular and
hummocky topography at the east side of the valley. However, the hummocky moraines are
not as well developed in Hælavík as in Hlöðuvík. Two main rivers flow down through the
valley. The main water source is snow melt and small lakes and dams further up-valley.
Page 46
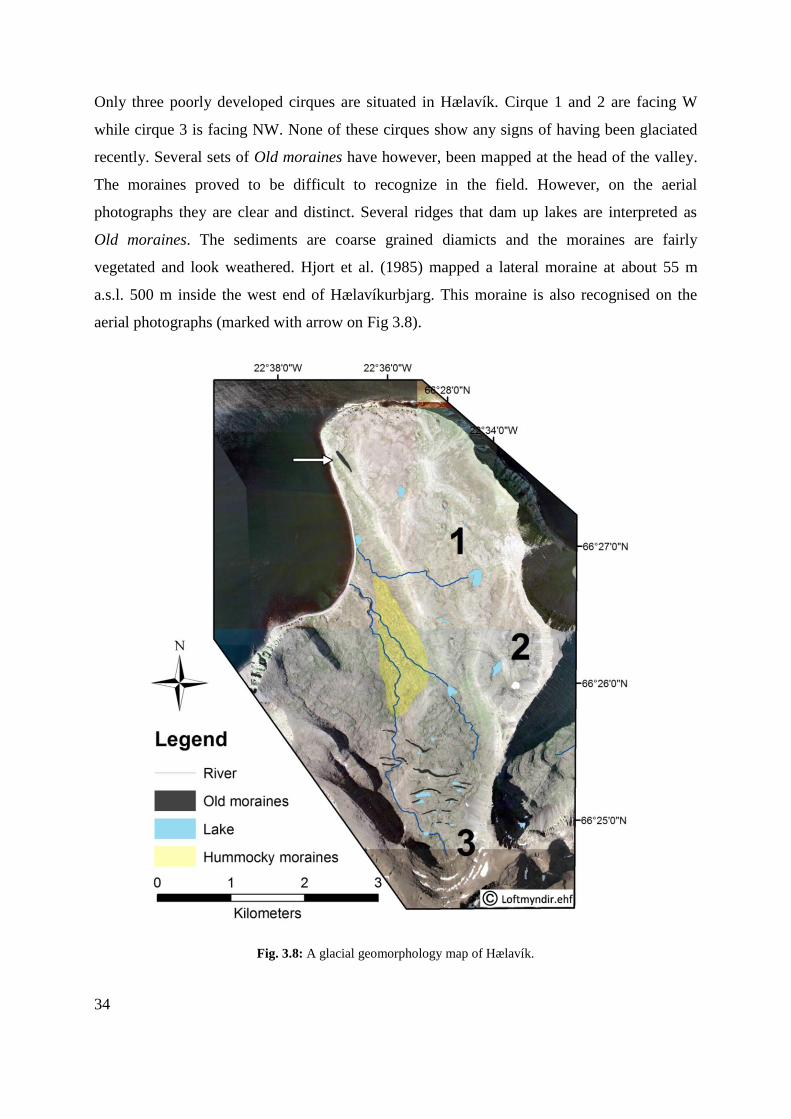
34
Only three poorly developed cirques are situated in Hælavík. Cirque 1 and 2 are facing W
while cirque 3 is facing NW. None of these cirques show any signs of having been glaciated
recently. Several sets of Old moraines have however, been mapped at the head of the valley.
The moraines proved to be difficult to recognize in the field. However, on the aerial
photographs they are clear and distinct. Several ridges that dam up lakes are interpreted as
Old moraines. The sediments are coarse grained diamicts and the moraines are fairly
vegetated and look weathered. Hjort et al. (1985) mapped a lateral moraine at about 55 m
a.s.l. 500 m inside the west end of Hælavíkurbjarg. This moraine is also recognised on the
aerial photographs (marked with arrow on Fig 3.8).
Fig. 3.8: A glacial geomorphology map of Hælavík.
Page 47
35
Fig. 3.9A: Estimated glacier extent on Hornstrandir during Preboreal time. The reconstruction is based on
mapped terminal moraines mapped as Old moraines. B: LIA glacier extent on Hornstrandir. Reconstruction is
based on terminal moraines mapped as LIA moraines.
Page 48
36
Fig. 3.10A: Moraines in Fljótavík. B: Fluted surface located within the LIA moraines in cirque 3 in Hlöðuvík. C:
Raised beaches in Fljótavík. D: Hummocky moraines in Hlöðuvík. E: Erratic boulder sitting on a diamict surface
upon the plateau. F: Rock glacier in Mannadalur.
Page 49
37
Fig. 3.11A: Old moraine located in cirque 1 in Kjaransvík. B: Raised beach in Hlöðuvík. The raised beach is
located about 2 m above the present storm beach.
Page 50
38
3.5 Coastal sections – sediment descriptions
Seven coastal sections were described and logged in the field. Two sedimentological logs
were made in Hlöðuvík and Kjaransvík, respectively, while three logs were made in Hælavík
(Fig. 3.12). The legend for the sedimentological logs is shown in Figure 3.13.
Fig. 3.12: Legend for the seven coastal sections logged in Hornstrandir during fieldwork. The legend is based on
the data chart for field description of glacial diamicts and associated sediments, presented in Krüger and Kjær
(1999).
Page 51
39
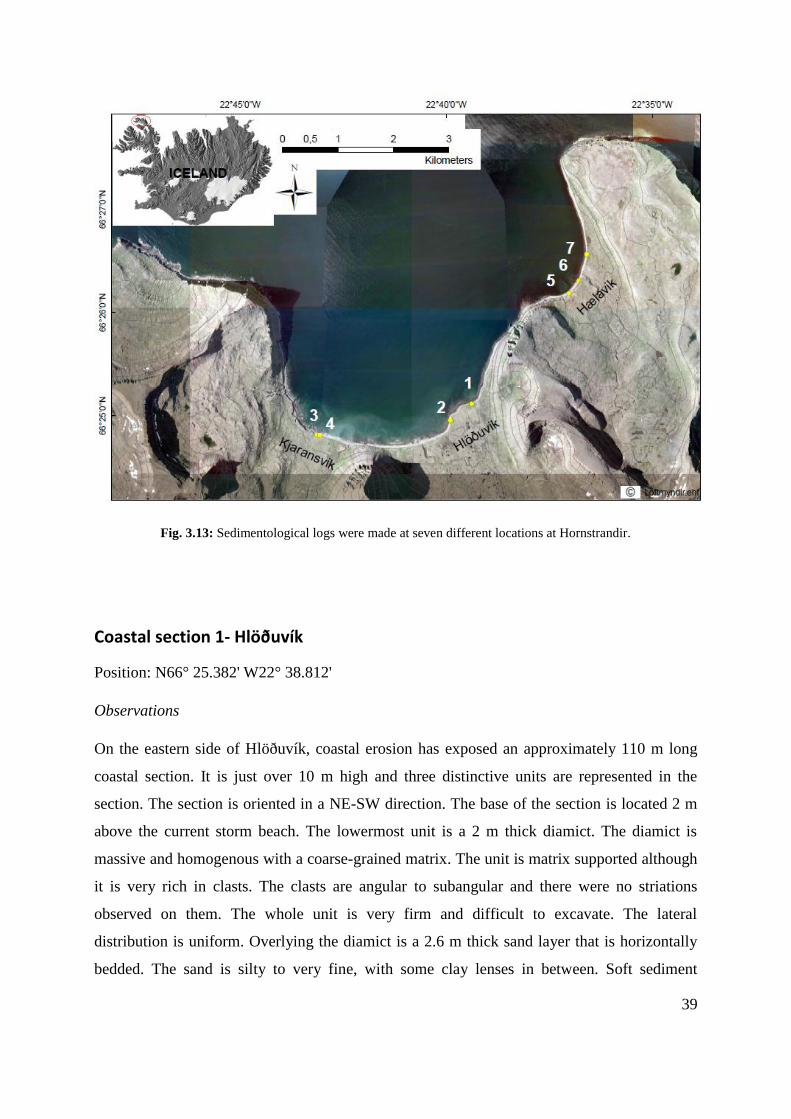
Fig. 3.13: Sedimentological logs were made at seven different locations at Hornstrandir.
Coastal section 1- Hlöðuvík
Position: N66° 25.382' W22° 38.812'
Observations
On the eastern side of Hlöðuvík, coastal erosion has exposed an approximately 110 m long
coastal section. It is just over 10 m high and three distinctive units are represented in the
section. The section is oriented in a NE-SW direction. The base of the section is located 2 m
above the current storm beach. The lowermost unit is a 2 m thick diamict. The diamict is
massive and homogenous with a coarse-grained matrix. The unit is matrix supported although
it is very rich in clasts. The clasts are angular to subangular and there were no striations
observed on them. The whole unit is very firm and difficult to excavate. The lateral
distribution is uniform. Overlying the diamict is a 2.6 m thick sand layer that is horizontally
bedded. The sand is silty to very fine, with some clay lenses in between. Soft sediment
Page 52
40
deformation structures are observed in some of the clay lenses. Some individual clasts are also
observed in the unit, but they are few and far between. No striations are observed on these
clasts. Several light-colored structures, consisting of clay and silt are percolating downwards
through the unit (Fig. 3.21A). They are usually 1-10 mm thick and can be traced between 0.1 -
2 m. These structures are interpreted as water-escape structures. No fossils or mollusc shells
are found in the unit. The silty-sand layer and the lowermost diamict are separated by a sharp
conformable basal contact. A 5.5 m thick diamict concludes the units of this coastal section.
The uppermost diamict is very similar to the lowermost. It is massive and has a coarse
sand/gravel matrix. In contrast to the lowermost diamict, this unit is matrix supported and the
clasts are sub-rounded to rounded. The unit is uniformly distributed laterally. No striations are
found on the clasts and there are no traces of fossils. The sedimentological log representing
coastal section 1 in Hlöðuvík is presented in Figure 3.14B.
Interpretation
The lowermost diamict unit is interpreted to be a subglacial till deposited by an overriding
glacier. Indicators supporting this interpretation is the relatively uniform thickness of the unit,
the high degree of compactness and the coarse grained matrix. The sand and silt unit above
are interpreted as being deposited in a marine environment. The boulders and clasts found
within the unit are interpreted as dropstones originating from calving glaciers further up
valley. The diamict at the top of the section is interpreted as representing a new glacier
advance, depositing a second subglacial till. The indicators are the uniform thickness and high
degree of compactness. The water escape structures in the sand and silt layer were most likely
formed when the uppermost till was deposited, forcing water to escape downwards through
the unit.
The first coastal section in Hlöðuvík reflects a glacial event that deposited a subglacial till.
When the glacier retreated, the sea-level stood at least 5 m higher than today, depositing the
marine sand and silt unit. Finally a new glacial advance deposited the uppermost till.
Page 53
41
Fig. 3.14A: Photograph of coastal section 1 in Hloduvik. B: The sedimentological log representing coastal
section 1 in Hloduvik.
Coastal section 2 – Hlöðuvík 2
Position: N66° 25.142' W22° 39.461'
Observations:
The second coastal section in Hlöðuvík is an approximately 40 m long section. The section is
about 10 m high and located 1 - 2 m above the present storm beach. It is orientated in a NE-
SW direction. The outcropping units are partly covered by debris, making description
difficult. Two units have, however, been described from the section. The lowermost unit is a
banded diamict. The matrix is fine grained, consisting of clay and silt. It is matrix-supported
and very firm, making it hard to excavate. The unit has a uniform thickness laterally. The
second unit is a matrix-supported massive diamict. The matrix is coarse and consists of sand
Page 54
42
and gravel. The diamict is very firm. Parts of the unit are covered by debris. The two units are
separated by a sharp conformable contact and they are both uniform distributed laterally. The
sediment log representing coastal section 2 in Hlöðuvík is presented in Figure 3.15B.
Interpretation
Both units in this section are interpreted as being subglacial tills, deposited by an overriding
glacier. Indicators supporting this are the uniform lateral distribution and the very high degree
of compactness of the tills. The banded appearance of the lowermost diamict suggests that the
unit have undergone high cumulative strains. This deformation probably happened during the
deposition of the upper till. The second coastal section in Hlöðuvík therefore reflects two
different glacial advances.
Fig. 3.15A: Photograph of coastal section 2 in Hlöðuvík. B: The sedimentological log representing coastal
section 2 in Hlöðuvík.
Page 55
43
Coastal section 3 – Kjaransvík 1
Position: N66° 24.934' W22° 42.686'
Observations:
The first cliff in Kjaransvík is a 2.8 m high and 10 m long coastal cliff. It is oriented in a NW-
SE direction and has three distinct units. The bottom unit is 20 cm of imbricated boulders.
The boulders are elongated and sub-rounded to rounded. The grain size varies from 2 - 20 cm
in diameter. Fine silt and sand are situated in between the boulders. The unit above is a 1 m
thick, horizontally bedded sand unit. The sand is from fine to medium grained. The unit
contains large amounts of driftwood in the lower part. The upper part of the sand unit contains
several small lenses of light coloured tephra. Samples of both driftwood (UA-49595, UA-
49596) and tephra (Kjaran) were sampled from this coastal section. Above is a 70 cm thick
and poorly sorted gravel unit. The gravel unit has a clear orange colour. Clasts are sub-
angular. At the boundary between the sand and the gravel, a thin layer of organic material was
observed. The uppermost part of the section is covered by peat. All of the three units seem to
be uniform distributed laterally. The sedimentological log representing coastal section 3 in
Kjaransvík is presented in Figure 3.16B.
Interpretation
Based on the rounded clasts and imbricated structure, the bottom boulder unit is interpreted as
a beach sediment. The coarse grains suggest that the sediment was deposited on a high-energy
beach. The sand unit above suggests calmer conditions and the horizontal bedding and
occurrence of tephra suggests that the sand was deposited in water. It is interpreted that the
sand could have been deposited in a lagoon or a small lake situated just inside the berm crest.
The driftwood could have been deposited during a storm that carried the driftwood over the
crest and into the lagoon. Both the driftwood and the ash layer have been dated. The
driftwood yield ages of 1930 cal. yr BP and 2075 cal. yr BP. The tephra has been identified as
being formed during the Sn-1 eruption (Snæfellsjökull volcano) at 1855 cal. yr BP. This
means that the stratigraphy of the sand unit is correct. Although the uppermost unit looks like
it is glacially derived, the age of the underlying sand does not allow for a glacial
interpretation. The uppermost gravel is therefore interpreted as a new beach deposit.
Page 56
44
The whole section reflects an initial regressional event, where the beach consisting of
boulders, was covered by a lagoon or small lake. At that time, the coastline was situated
further out than present. At some point after 1855 cal. yr BP, a transgression started and
deposited new beach sediments on top of the sandy unit.
Fig. 3.16A: Photograph of coastal section 3 in Kjaransvík. B: The sedimentological log representing coastal
section 3 in Kjaransvík.
Coastal section 4 – Kjaransvík 2
Position: N66° 24.931' W22° 42.615'
Observations:
The second cliff that that was logged in Kjaransvík is a 2.6 m high and approximately 10 m
long section. The section contains several small units that had to be excavated before logging.
The cliff is oriented in a NW-SE direction. The bottom unit is a 1 m thick sequence with
Page 57
45
imbricated boulders. The boulders are elongated and sub-rounded to rounded. The grain size
varies from 2-20 cm in diameter. Fine silt and sand are situated in between the boulders. The
next unit is a 25 cm thick sand layer. The sand is massive and medium grained. Above sits a
10 cm thick, horizontally bedded fine grained sand layer. The unit above is a 25 cm thick,
matrix-supported firm diamict. It is massive with a silty matrix. Above is a 15 cm thick sand
unit. The sand is horizontally bedded and the grain size is fine. The uppermost unit of the
section is a 70 cm thick diamict. It is stratified with a coarse grained matrix. It is very clast
rich and firm. All the basal contacts in the section seem to be sharp and conformable. The
lateral distribution could not be identified. The sedimentological log representing this coastal
section in Kjaransvík is presented in Figure 3.17B.
Interpretation
Based on the imbricated structure, coarse and rounded clasts is the bottom boulder unit
interpreted to be a high-energy beach sediment. Due to the proximity to coastal section 3
(about 30 m), the same interpretations can be made for this section. It is also likely that the
ages of this coastal section resembles the ages obtained from the previously section. The sand
units indicate calmer conditions, while the diamicts are indicators for sediments deposited at
the beach during storms.
The coastal section records small transgressional and regressional events. The initial boulder
beach was first covered by sand during a transgression and rise in sea-level. Then followed a
small regression event where a new storm beach was deposited over the sand. The same
transgression-regression cycle occurred, with the deposition of the next sand and diamict
units.
Page 58
46
Fig. 3.17A: Photograph of coastal section 4 in Kjaransvík. B: The sedimentological log representing coastal
section 4 in Kjaransvík.
Coastal section 5 – Hælavík 1
Position: N66° 26.446' W22° 36.771'
Observations
The first section logged in Hælavík is a 2 m high cliff. It is a 20 m broad section, oriented in a
NE-SW direction. The base of the section is situated 4 m above the present storm beach. The
lower unit is a 1.4 m thick diamict. The diamict is coarse, massive and clast supported. It is
firmable and easy to excavate. In the lower part of the unit, boulder lenses are observed.
Driftwood was found about 50 cm up in the unit and sampled for radiocarbon dating (Sample
number Ua-49593 and Ua-49594). In the upper part of the unit, lenses of silt and clay were
found at various heights. The upper unit is a new diamict. It is a 60 cm thick, massive, firm
and matrix-supported diamict. The matrix is medium grained sand. The boundary between the
Page 59
47
two units is sharp and conformable. Both units have a uniform lateral distribution. The
sedimentological log representing the coastal section in Hælavík 1 is presented in Figure
3.18B.
Interpretation
The bottom unit is coarse, firmable and lacks any traces of clay and silt, except for scattered
lenses in the upper part. The diamict is therefore interpreted to be a beach deposit. The
driftwood is a significant indicator supporting this interpretation. The upper unit are also
interpreted to be a beach deposit, based on the sand matrix, with very little content of clay and
silt.
Fig. 3.18A: Photograph of coastal section 5 in Hælavík. B: The sedimentological log representing coastal
section 4 in Hælavík.
Page 60
48
Coastal section 6 – Hælavík 2
Position: N66° 26.573' W22° 36.555'
Observations
The second cliff in Hælavík is approximately 100 m long and is oriented in a NE-SW
direction. The 14 m high section contains three distinct units and bears similar characteristics
as the Hlöðuvík 1 section. The lower part of the section consists of a 5 m thick diamict. The
diamict has a silty matrix and is extremely firm. It is clast rich and the clasts seem to be
concentrated in the upper part of the unit. The clasts are sub-angular to angular and no
striations of the clasts were observed. Water escape structures are spread evenly out in the
unit (Fig. 3.21A). Over the diamict lies a 3 m thick silty/fine sand unit. The sand is
horizontally bedded and contains a few clasts spread out evenly. Several sets of water escape
structures are also seen in this unit. The unit contains no traces of mollusc shells or other
fossils. The contact between the two units is sharp and conformable. However the thickness
varies laterally. The uppermost unit is a new diamict. It is very similar to the lowermost
diamict, but this one is more coarse grained and is not as firm and therefore easier to excavate.
The contact to the underlying sand is sharp and conformable. The sedimentological log
representing the coastal section in Hælavík is presented in Figure 3.19B.
Interpretation
This section bears resemblance with the Hlöðuvík 1 coastal section and several of the same
interpretations can be made for this section. The lowermost diamict unit is interpreted to be a
subglacial till deposited in a subglacial environment. Indicators supporting this interpretation
is the relatively uniform thickness of the unit and the high degree of compactness. The sand
and silt unit above are interpreted as being deposited in a marine environment. The boulders
and clasts found within the unit are interpreted as drop stones, transported out by ice rafted
debris, originating from calving glaciers further up valley. The diamict at the top of the
section is interpreted as representing a new glacier advance, depositing a second subglacial
till. The indicators are the uniform thickness and high degree of compactness. The water
escape structures observed within the sand and silt layer and the lowermost till were most
Page 61
49
likely formed when the uppermost till was deposited, forcing water to escape downwards
through the section.
As the first section in Hlöðuvík, this coastal section represents an initial glacial advance. Then
as the glacier retreated, the sea-level stood at least 9 m higher than today, depositing the
marine sand and silt unit. Finally a new glacial advance deposited the uppermost till.
Fig. 3. 19A: Photograph of coastal section 6 in Hælavík (Photo: Skafti Brynjólfsson). B: The sedimentological
log representing coastal section 6 in Hælavík.
Page 62
50
Coastal section 7 – Hælavík 3
Position: N66° 26.831' W22° 36.397'
Observations
The third section in Hælavík is an approximately 50 m long cliff, containing four distinct
sedimentary units. The section is 4 m high. The lowermost unit is horizontally laminated
yellow clay. A fold or a load structure is observed in the unit. Above the clay, lies a 1.1 m
thick sand layer. The bottom of the unit is dark black and it gets gradually more light coloured
upwards in the unit (Fig. 3.21B). The sandy grain size and black colour suggests that the
whole unit is a tephra. The unit is ripple cross laminated although the structure is most
apparent in the lower part than in the upper. The top and bottom contacts are sharp and
conformable. Above the sand/tephra unit, lies a new yellow clay layer. It is horizontally
laminated and very similar to the lowermost one. However, no other structures were observed
in the sediment. Over the clay lies an orange/yellow sand layer. The sand is cross bedded
throughout the unit. The basal contacts are sharp and conformable. At the top lies a humus
layer containing large elongated boulders. The sedimentological log representing the coastal
section in Hælavík is presented in Figure 3.20B.
Interpretation
The grain size and laminated structure indicates that the bottom unit was deposited under very
calm conditions, possibly in a lacustrine setting. The unit above is a result of a very heavy
influx of tephra being deposited in the lacustrine environment. The load structure in the clay
layer below, was probably formed when the heavy tephra influx appeared. The clay and silt
unit above the tephra indicates that the tephra influx stopped and the calm conditions
continued. The uppermost sand is interpreted as being an aeolian deposit. Indicators are the
fine grain size and good sorting, cross bedded structure and orange colour. The boulders
located at the top of the section were only found inside remains of old farm houses. They are
therefore thought to be manmade and not relevant to the stratigraphy of the section.
The third coastal section in Hælavík represents a lacustrine environment where fine material
was deposited. The hummocky terrain just inside the coast suggests that the section reflects
Page 63
51
sedimentation in small lake in between the hummocky moraines. After the heavy tephra
influx, sedimentation in the lake continued until the lake dried out and aeolian sand was
deposited at the top as dunes.
Fig. 3.20A: Photograph of coastal section 7 in Hælavík. B: The sedimentological log representing coastal
section 7 in Hælavík.
Page 64
52
Fig. 3.21A: Photograph of water
escape structures in the lowermost
till in Hælavík.
B: Photograph of the base of the
tephra sampled at coastal section 7
in Hælavík.
3.6 14C dating
Organic material was sampled from driftwood that is eroding out from two coastal sections at
present, coastal section 5 in Hælavík and coastal section 3 in Kjaransvík (Fig. 3.12). The
samples were radiocarbon dated at The Ångström Laboratory, Uppsala University (Table 1),
and were dated to; Ua-49593 1335 ± 90 cal. yr BP, Ua-49594 1475 ± 170 cal. yr BP, Ua-
49595 2075 ± 170 cal. yr BP and Ua-48596 1930 ± 140 yr BP. The samples Hæla 2 and Hæla
3 are taken from driftwood in Hælavík, while the samples Kjar 2 and Kjar 3 are from
Kjaransvík.
Page 65
53
Table 1: Radiocarbon ages from sampled driftwood. The dating was done by The Ångström Laboratory,
Uppsala University. (BP = Before present, Present = 1950 AD)
LAB
NUMBER
SAMPLE Δ13C‰VPBD CAL. YR BP
UA-49593 Hæla 2 -25,3 1335 ± 90
UA-49594 Hæla 3 -27,6 1475 ± 170
UA-49595 Kjar 2 -28,0 2075 ± 170
UA-49596 Kjar 3 -26,3 1930 ± 140
Fig. 3.22A: Driftwood from coastal section 3 in Kjaransvík was sampled for 14C dating. B: Sampling of a
driftwood log from coastal section 5 in Hælavík (Photo: Skafti Brynjólfsson, 2014).
Page 66
54
3.7 Tephra analyses
Tephra was sampled at three different sites at Hornstrandir. Two tephras were found in coastal
sections in Hælavík and Kjaransvík, while one was found in a till plain, dissected by
meltwater streams in Hlöðuvík (Fig. 3.23). The geochemical composition of the tephras from
Hornstrandir is presented in Table 2. Plots comparing the tephras from this study with other
studies and tephra databases are shown in Figures 3.24, 3.25 and 3.26.
Fig. 3.23: Map presenting the locations where tephras and rock samples for cosmogenic exposure dating were sampled.
Page 67
55
Hælavík tephra:
Position: N66° 26.831' W22° 36.397'
The tephra was sampled from the coastal section Hælavík 3, where it appeared as a 1.1 m
thick black tephra (Fig. 3.27B). The geochemical composition of the tephra is identical with
the Saksunarvatn tephra (Fig. 3.24). The Saksunarvatn tephra is thought to have originated
from the Grímsvötn volcanic system and is dated to 10180 ± 60 cal. yr BP (Birks et al., 1996;
Andrews et al., 2002a).
Fig. 3.24: Plot showing a comparison of the geochemical composition between the tephra found in Hælavík and
Saksunarvatn tephra from other studies.
Hlöðuvík tephra:
Position: N66° 24.120' W22° 36.293'
The tephra was sampled from a dissected till plain in Hlöðuvík. The tephra appeared as a
black horizon in the dissected section. The geochemical composition in the Hlöðuvík tephra is
identical with the Saksunarvatn tephra (Fig. 3.25).
Page 68
56
Fig. 3.25: Plot showing a comparison of the geochemical composition between the tephra found in Hlöðuvík and
tephra from other studies.
Kjaransvík tephra:
Position: N66° 24.934' W22° 42.686'
The tephra was sampled in the coastal section Kjaransvík 1. It appeared as small white lenses
varying in thickness from 0.1-2 cm and length from 5-15 cm (Fig. 3.27A). The tephra has a
geochemical composition that resembles the Sn-1 tephra (Fig. 3.26). The Sn-1 tephra was
produced during an eruption of the Snæfellsjökull volcano and has been dated to 1855 ± 25
cal. yr BP (Larsen et al., 2002; Eiríksson et al., 2011).
Page 69
57
Fig. 3.26: Plot showing a comparison of the geochemical composition between the tephra found in Kjaransvík
and tephra from other studies.
Fig. 3.27A: Picture of the tephra sampled at Kjaransvík. B: Picture of the tephra sampled at Hælavík.
Page 70
58
Table 2: Results from the geochemical analysis of the three sampled tephras.
Page 71
59
3.8 Cosmogenic exposure dating (36Cl)
Three rock samples were collected for cosmogenic exposure dating. Two samples were
sampled on Jökulhorn while one weas sampled on Fannalágarfjall. See figure 3.22 for the
locations of the samples- Sample H1 was sampled from a tor surface, while H2 and H3 were
sampled from erratic boulders (Fig. 3.28). The rock samples were processed at the PRIME-
Lab, Purude University in USA and dated to; H1 41.6 kyr BP, H2 17.9 kyr BP and H3 14.0
kyr BP. Ages are based on the production rate of Licciardi et al. (2008) and erosion rates are
estimated to e = 0,5cm/kyr.
Table 3: 36Cl cosmogenic surface exposure dates obtained from the plateaux on Hornstrandir. Ages are based on
the production rate of Licciardi et al. (2008).
Sample
number
Location Elevation
(m a.s.l.)
Position Type Age
(kyr)
AMS
error
( ± year)
H1 Jökulhorn 675 7364650 N
0428914 W
Bedrock 41,6 1124
H2 Jökulhorn 630 7364425 N
0428559 W
Erratic 17,9 465
H3 Fannalágarfjall 585 7365235 N
0420978 W
Erratic 14,0 392
Fig. 3.28: Sampling rock samples
for cosmogenic exposure dating
from Fannalágarfjall (Photo:
Skafti Brynjólfsson, 2014).
Page 72
60
4. Discussion: Late Quaternary glacial history of
Hornstrandir
Results from the present study and relevant literature of the glacial history of Hornstrandir are
discussed below. A map featuring the geographical names which are used in the discussion
are presented in figure 4.1.
Fig. 4.1: Map over the area which are featured in the discussion. In the insert map are purple dots and green triangles
showing the locations of tephra sites and cosmogenic exposure dating sites, respectively.
4.1 Late glacial maximum (LGM)
The ice extent and thickness over Iceland during the LGM has been a much discussed topic
over the years. Reconstructions range from an extensive ice cover with no ice free areas
(Larusson, 1983; Buckland and Dugmore, 1991) to a refugia model with ice free areas on the
Page 73
61
high plateaux and nunataks (Hoppe 1982; Einarsson and Albertsson, 1988; Ingólfsson, 1991).
It is also believed that Vestfirðir hosted an ice sheet independant from the mainland ice sheet
during the LGM (Ingolfsson and Norðdahl, 2001).
From Vestfirðir, Geirsdóttir et al. (2002) studied marine cores from Djúpáll and recognised
that IRD was absent from the cores from ca. 22 to 19 kyr, indicating that an extensive land
fast ice cover was present over Vestfirðir at that time. Principato et al. (2006) showed that
bedrock surfaces at an elevation of 370 m a.s.l. were ice free in Vestfirðir by 20.4 kyr. Erratic
boulders dated to 20 -30 kyr BP has also shown that at least some coastal capes and plateaux
above Leirufjörður were ice-free during the LGM (Brynjólfsson et al., 2015). It has been
suggested that ice filled Ísafjarðardjúp and extended to the north/northeast to the Djupall
trough where the ice grounded close to the shelf edge, 100-150 km off the present coast
(Principato et al., 2006). 80 – 120 km to the northeast of Vestfirðir, three marine cores have
penetrated into late glacial diamict units, suggesting that ice also extended out to the
Reykjafjardaráll – Húnaflóadjúp trough system during the LGM (Fig. 4.1) (Andrews and
Principato, 2002; Principato et al., 2006).
Evidence of the LGM ice sheet on Hornstrandir:
Both the coastal sections 1 and 2 in Hlöðuvík and coastal section 6 in Hælavík show signs of
an initial glacial advance, followed by deglaciation and significant sea level rise, then a new
glacial advance. The age of the lowermost tills in the three coastal sections have not been
established in the present study, but it is likely that the tills were deposited sometime during
the LGM. With a substantial ice load at these positions is it likely that the valleys and coastal
lowlands in Hornstrandir were fully covered by ice during the LGM. This supports the
consensus that Vestfirðir was covered by an extensive ice sheet at this point. At the northern
side of Hornstrandir, cirque glaciers are believed to have coalesced to form valley glaciers
that flowed northwards (Fig. 4.3). It is not known where the ice margin outside Hornstrandir
was situated. Hjort et al. (1985) estimated that the ice terminated 6 – 10 km off the present
coast, while other researchers have argued that the ice reached out to the shelf break (e.g.
Andrews and Principato, 2002; Principato et al., 2006). Spagnolo and Clark (2009) who
produced geomorphological maps based on bathymetric data observed that several glacial
Page 74
62
troughs were situated on the Icelandic shelf. These troughs mark the presence of former ice
streams (Spagnolo and Clark, 2009). Outside Hornstrandir, two glacial troughs extend in a
NW direction from Hornvík and the Strandir coast. They reach about 20 km outside the
present coast and suggest that ice streams were flowing from Hornstrandir and that they at
least reached this position during the LGM (Fig. 4.2). At the south side of Hornstrandir are
cirque and valley glaciers thought to have coalesced and flowed into to the ice streams
draining through Jökulfirðir and Ísafjarðardjúp (Fig. 4.3).
Fig. 4.2: Glacial troughs located outside the coast of Hornstrandir. The seabed is presented as a shaded image
with blue colours representing depth. Light blue indicates shallow depths, while dark blue represents deep
depths (Spagnolo and Clark, 2009).
Several researchers have proposed that ice free plateaux and nutataks existed in Iceland
during the LGM. Hornstrandir has been considered a likely candidate for such conditions (e.g.
Page 75
63
Hoppe, 1982; Einarsson and Albertsson, 1988; Ingólfsson, 1991). Principato and Geirsdottir
(2002) argued that the geomorphology of the Strandir coast is the result of alpine style
glaciation and it is unlikely that ice covered the entire area. They concluded that the
topographic features such as bedrock spires, cirques, horns and arêtes, were nunataks during
the LGM. The glaciers could have been cold based, but it is unlikely that these features would
survive a thick ice cover (Principato and Geirsdóttir, 2002). The plateaux on Hornstrandir are
covered with periglacial features such as polygons, block fields and tors which could indicate
that the high plateaux weren’t covered by active glaciers. Commonly has it been accepted that
highly weathered surfaces such as this, took a long time to form and that they therefore must
have escaped any recent glaciation. Thus have also highly weathered mountain tops been
unglaciated and possibly served as biologic refugia throughout the Quaternary (Briner et al.,
2003). Hjort et al. (1985) also recognized that the plateaux showed little signs of being
covered by active glaciers and estimated the maximum glacier height to the altitude of these
plateau surfaces. However, recent work have concluded that not all highly weathered surfaces
can be used as an argument for the absence of LGM ice (Briner et al., 2003). Briner et al.
(2005) suggested that difference in weathering zones represent the differential thermal
regimes, where the highly weathered uplands were less modified by frozen-bedded ice than
the valleys which are highly modified by sliding basal conditions.
The bedrock sample from Jökulhorn (H1) have been dated to 41,6 kyr, suggesting that the
bedrock on Jökulhorn has been exposed to cosmic radiation for the last 41,6 kyr and thus ice
free during the LGM. The surface is also a highly weathered blockfield with little or no signs
of active glaciers. However, due to the “young” erratic (H2) situated nearby isn’t the exposure
age considered to represent the time of deglaciation of the bedrock. The weathered bedrock is
interpreted to contain isotopic inheritance which gives an older exposure age than it actually
has. This implies that the periglacial plateau surface at Jökulhorn was covered by cold based
ice which preserved the periglacial surface beneath. The erratic boulders that are located on
the plateaux must therefore been transported by the deformation of the ice internally, instead
of basal sliding. The highest mountain tops on Hornstrandir reach about 700 m a.s.l., no more
than ~50 m above the bedrock sample. It is therefore suggested that both lowlands and
uplands on Hornstrandir were fully covered by ice during the LGM, but that the ice was
differentially erosive as a function of its spatially basal thermal regime. Cold based glaciation
Page 76
64
of the plateaux was contemporaneous with warm-based glaciation in the valley and fjords.
The reason for this could be as Briner et al. (2003) speculated, that the uplands ice was cold
based because it was relatively thin and flowed over crystalline bedrock, whereas the ice
flowing through the fjords was thick, constrained and flowed over water-saturated
unconsolidated sediments. However, due to a little selection of samples scattered over a
relatively small area, one cannot say for certain that ice free nunataks at the outermost coast
didn’t exist during the LGM.
The two erratic boulders situated on the plateau at Jökulhorn and Fannalágarfjall have yielded
36Cl exposure ages as 17,9 kyr and 14,0 kyr respectively. Both boulders were situated upon a
weathered blockfield and could only have been deposited by an ice sheet covering the
plateaux. Both erratics rest directly on stable plateau surfaces, hence they have experienced
minimal post-depositional shielding or movement. The ages obtained from cosmogenic
exposure dating are therefore assumed to date deglaciation of the upland plateaux. The 17,9
kyr Jökulhorn erratic is located 45 m above the 14,0 kyr Fannalágarfjall erratic, indicating that
the it took about 4 kyr for the glacier to deglaciate 45 m. The 36Cl cosmogenic exposure dates
of erratic boulders from the ~600 m high plateau above Leirufjörður, have shown that the the
plateaux were ice free by 20 – 30 kyr. However it should be mentioned that the 20-30 kyr old
erratics from Leirufjörður could also be older rocks preserved under less active or even cold
based ice, as it is shown in Hornstrandir (Brynjólfsson et al., 2015b). Principato et al. (2006)
also showed that ice free areas existed at 370 m a.s.l. in Ármuli by 20.4 cal. kyr BP, indicating
that the plateaux at Hornstrandir deglaciated ~2 – 6 kyr later than the plateaux around
Drangajökull.
A figure demonstrating a reconstruction of the glacial situation on Hornstrandir during the
Last Glacial Maximum is presented in figure 4.3.
Page 77
65
Fig. 4.3: Ice cover on Hornstrandir during the LGM. Based on literature and observations from this study.
4.2 The Bølling Interstadial
Data from the west Iceland shelf suggest that the ice sheet was grounded close to the shelf
edge, 100 – 150 km off the present coast, around 15 cal. kyr BP (Jennings et al., 2000;
Ingólfsson and Norddahl, 2001; Geirsdóttir et al., 2002). By 14.6 kyr the marine based part of
the ice sheet started to collapse and retreated towards present day dry land (Geirsdóttir et al.,
2002). This led to greatly elevated shorelines after the deglaciation of the LGM ice sheet
(Rundgren et al., 1997). At Reykjarnes on the Strandir coast is a raised beach situated 48 m
a.s.l marking the marine limit on eastern Vestfirðir. Along the Ísafjarðardjúp coastline is the
marine limit approximately 30 m near Kaldalón, while the marine limit is 14 m near the
mouth of Jökulfirðir (Principato, 2008).
Page 78
66
Evidence of the Bølling Interstadial on Hornstrandir:
The sand and silt units found in coastal section 1 in Hlöðuvík and coastal section 6 in Hælavík
are interpreted to represent the sea level rise during the Bølling Interstadial. The sections
suggest that the sea level stood at least 5 - 9 m higher than today. Hjort et al. (1985) argued
that an abrasion terrace marked the marine limit in Hælavík at 26-27 m above present sea
level. The boulders and clasts found within the unit are interpreted to have been derived from
ice rafted debris, originating from calving glaciers. This could suggest that a calving margin
was situated further up valley in Hælavík and Hlöðuvík during the Bølling Interstadial.
However, the IRD could also have originated from calving margins elsewhere, such as the
calving margin situated at the mouth of Ísafjarðardjúp at 15 – 12 cal. kyr BP (Geirsdóttir et
al., 2002). The cosmogenic exposure dates of the erratic boulders have also shown that the
plateaux were ice free by The Bølling Interstadial time.
4.3 Younger Dryas (YD)
Between 13.9 and 11.5 cal. kyr BP a climatic deterioration induced positive mass balance and
increase in ice volume on Iceland. Glaciers extended and the period culminated in Younger
Dryas time at about 12 cal. kyr BP (Ingólfsson et al., 2010). Between 13 – 12 kyr the ice sheet
reached close to the present coastline. In Vestfirðir were the inlet fjords more or less filled
with glaciers from the Vestfirðir Peninsula ice cap that coalesced into the main Ísafjarðardjúp
(Geirsdottir et al., 2002).
In Hornstrandir, the uppermost diamicts in the three coastal sections (Nr. 1, 2, and 6) in
Hlöðuvík and Hælavík are interpreted to represent a new glacial advance. This glacier
advance is suggested to correspond to the Younger Dryas, which would mean that the cirque
glaciers on the northern coast of Hornstrandir coalesced to form valley glaciers that reached at
least out to the present coast. At Hælavík, the glacier had a thickness of 55 m marked by the
lateral moraine mapped 500 m within Hælavíkurbjarg (Fig. 3.8). Several headlands that are
situated in the fjords on the southern side of Hornstrandir are interpreted to be remains of
moraines (Fig. 4.4). It is believed that these moraines marks the location were calving glacier
margins were present during deglaciation of the Younger Dryas ice sheet. IRD found in cores
from the shelf and fjord record, suggests the presence of actively calving glacier margins in
Jökulfirðir and Ísafjarðardjúp at 12 – 11 cal. kyr BP (Geirsdottir et al., 2002). The moraines
Page 79
67
situated in the southern fjords in Hornstrandir could represent some of these calving margins
(Fig. 4.4). The Vedde ash is dated to 12.0 ± 0.8 cal. kyr BP and has proven to be an excellent
marker for the Younger Dryas ice extent (Grönvold et al., 1995). The ash was transported on
sea ice and was deposited when the sea ice melted, making it widespread across large parts of
the North Atlantic. The Vedde Ash is therefore often used as a proxy for ice free conditions
during the Younger Dryas (Birks et al., 1996). A seismic reflector in Jökulfirdir suggests the
presence of the Vedde ash, which would mean that the outer part of Jökulfirdir was ice free at
that time (Johannsdottir, 2003). The Vedde ash lacks terrestrial locations in Hornstrandir,
suggesting that most of the presently dry land on Hornstrandir was covered by ice at 12 kyr.
However, ice free nunataks or areas of cold-based ice are likely to have existed on the
plateaux and mountain tops on Hornstrandir.
Hjort et al. (1985) recognised a moraine bank outside of Aðalvík and suggested it to have
marked the maximum extent of the LGM. The maximum extent of the LGM has later been
estimated to have reached out to the shelf (Principato et al., 2006). It is therefore proposed
that the shallow banks outside Aðalvík instead represent the Younger Dryas glacier extent.
Fig. 4.4: Several headlands interpreted as remains of terminal moraines are situated in the southern fjords on
Hornstrandir.
Page 80
68
4.4 Preboreal
Ice free conditions in Preboreal time are constrained by the presence of the Saksunarvatn Ash
which is dated to 10180 cal. yr BP (Grönvold et al., 1995). The tephra is present in several
marine cores from Jökulfirðir and Ísafjarðardjúp, suggesting that the fjords were ice free at the
time (Fig. 4.5) (Andrews et al., 2002b).
Fig. 4.5: Distribution of the Saksunarvatn Ash and rhyolitic Hekla Ash. The dotted line represents the inferred
Preboral ice extent from Principato (2008).
The black tephra named “The Hælavík Tephra”, was suggested to be the Saksunarvatn Ash by
Hjort et al. (1985). This suggestion has been tested in this study and confirmed. It is believed
that the tephra found in coastal section 7 in Hælavík is the same tephra which is referred to as
“the Hælavík tephra” in Hjort et al. (1985). The presence of the Saksunarvatn tephra in
Hælavík suggests that the valley had ice free conditions at that time. The tephra was deposited
in a lacustrine setting, possibly in a kettle hole or a small lake in connection with the
Page 81
69
hummocky moraines situated just inside of the present coast. With hummocky moraines in the
valley lowlands at that time, the glacier margin in Hælavík must have been situated much
further up in the valley. The glacier margin in Hælavík is probably marked by the moraines
which have been mapped at the head of the valley (Fig. 3.8). The tephra found in Hlöðuvík,
has also chemical characteristics linking it to the Saksunarvatn Ash. The tephra was found
within the outermost moraines situated about 2 km up in the valley inside Hlöðuvík (Fig.
3.22). This suggests that most of Hlöðuvík was ice free at the time. If both Hælavík and
Hlöðuvík were more or less ice free at 10.2 cal. kyr BP is it likely that the rest of the northern
part of Hornstrandir experienced the same kind of restricted glacier cover.
On the southern part of Hornstrandir, several of the valleys and cirques host well developed
moraines, mapped as “old moraines” (Fig. 3.2, 3.3, 3.4, 3.5). None of the moraines are dated,
but due to their morphology and general appearance, they are interpreted to be older than the
Little Ice Age. IRD are found in marine cores from Jökulfirdir between 12 – 11 kyr but is
absent from the fjord record by 10 kyr. This suggests that glaciers in Jökulfirdir had retreated
up on presently dry land by that time (Geirsdóttir et al., 2002). The old moraines mapped in
Hornstrandir are therefore likely to have formed sometime around or shortly after 10 kyr. The
outermost lateral and terminal moraines in Leirufjörður is dated to 9.2 kyr BP (Brynjólfsson et
al., 2015). With moraines forming in Leirufjörður could moraines also have formed on
Hornstrandir around the same time. Several researchers have also reported that a glacier
advance or stillstand occurred in Iceland around 9.8 – 9.6 kyr BP, supporting that the morines
on Hornstrandir formed in the early Preboreal (e.g. Ingolfsson, 1991). Glaciers in Iceland are
considered to have retreated to their minimum extent during the Holocene Thermal Maximum
(HTM) at 5.0 cal kyr BP (Flowers et al., 2008; Ingólfsson et al., 2010). The Neoglaciation
began shortly after the HTM, marked with glacier advances and ice cap growth (Stotter et al.,
1999). However, in most places in Iceland, the LIA advances were the most extensive during
the Holocene. The old moraines mapped at Hornstrandir are located outside of the LIA
moraines and they are therefore considered to have been formed sometime prior to the LIA.
The old moraines must therefore at least yield an age sometime between 10 - 5 kyr. However,
it is most likely that the moraines formed during a small readvance or stillstand during the
general deglaciation of the Vestfirðir ice cap around 10 - 9 kyr.
Page 82
70
The outermost old moraines in several valleys have been used to create a map, estimating the
glaciated area on Hornstrandir sometime around 10 kyr (Fig. 3.9A). The total glaciated area
has been estimated to 44 km2. This figure, which is solely based on mapped terminal
moraines, is recognized as a minimum case scenario. It is likely that several valleys and
cirques that were seemingly deglaciated, contained cold based glacier that did not leave a
geomorphological fingerprint on the landscape. The total glaciated area was therefore
probably more extensive than the terminal moraines indicate.
4.5 Neoglacial period
Neoglaciation began after the HTM at 5.0 cal. kyr BP and was marked by growth of glaciers
and ice caps all over Iceland. The advances appeared in clusters in two intervals: The Sub-
Atlantic period (2.6 – 2.0 cal. kyr BP) and during the Little Ice Age (Björnsson and Pálsson,
2008; Ingólfsson et al., 2010). In Vestfirðir Principato (2008) mapped raised beaches parallel
to the coastlines of Jökulfirðir and Ísafjarðardjúp at an elevation of approximately 5 m a.s.l.
The raised beaches range in age from ~ 3000 to 123 ± 46 cal. yr BP, suggesting several minor
transgression events, where the younger dates suggests that beaches at the same elevation
were reoccupied several times (Principato, 2008).
On Northern Hornstrandir, three coastal sections (Kjaransvík 1, Kjaransvík 2 and Hælavík 1)
were described and interpreted as beach deposits, indicating a sea-level 2 – 3 m higher than
today. In Kjaransvík the dated driftwood and tephra yielded ages around 2000 cal. yr BP and
1900 cal. yr BP respectively. In Hælavík, the sampled driftwood was dated to about 1400 cal.
yr BP. All these coastal sections suggest that a minor transgression event occurred between
1400 and 2000 cal. yr BP. It is believed that the transgression recorded by the coastal sections
in Hornstrandir coincides with some of the transgression events described by Principato
(2008). The cause of this transgression probably relates to the lithospheric depression
following the Sub-Atlantic expansion of glaciers. Unlike most regions in Iceland, the
Neoglacial moraines, and not the LIA moraines, mark the most extensive Holocene glacier
Page 83
71
advance on eastern Vestfirðir (Principato, 2008). At the nearby Drangajökull ice cap, did the
Reykjarfjörður and Kaldalón outlet glaciers reach their Holocene maximum during
Neoglaciation, while the third outlet glacier, Leirufjörður, did not reach its maximum until the
LIA (Brynjólfsson et al., 2015). Whether this is the case for Hornstrandir is not known, but it
is likely that several cirques were reoccupied throughout the Neoglaciation to a larger extent
than during the LIA.
4.6 Little Ice Age (LIA)
The most extensive glacier advances in Iceland during the Holocene occurred during the Little
Ice Age (Gudmundsson, 1997; Ingólfsson et al., 2010). Small valley and outlet glaciers
reached their maximum around AD 1750 (Björnsson and Pálsson, 2008). The three outlet
glaciers of the Drangajökull ice cap (Fig. 4.1) reached their LIA maximum asynchronously
during surges in the period AD ~ 1700 – 1846 (Brynjólfsson et al., 2015a). Hjort et al. (1985)
recorded that the LIA glaciers in Hornstrandir had their maximum extent by AD 1860 and that
most glaciers had disappeared by AD 1920.
Evidence of the Little Ice Age on Hornstrandir are as follows:
Moraines interpreted to be LIA moraines are mapped at several locations on Hornstrandir
(Fig. 3.2, 3.3, 3.4, 3.5). In Hlöðuvík two out of the seven cirques contain LIA moraines in
front of them. Thoroddsen (1982a; 1982b) recognised that the moraines situated at the head of
the Hlöðuvík valley were formed during the Little Ice Age. The presence of a well preserved
fluted surface within the LIA moraines in Hlöðuvík supports that the moraines have been
formed recently. Old local names for cirques and valleys on Hornstrandir also indicate that at
least perennial snow fields or glaciers were present during the Little Ice Age. The valley
inside Hlöðuvík is for instance called “Jökladalur”, meaning “Glacier valley”, suggesting that
the valley contained larger glaciers at that time than it is today.
On Hornstrandir the LIA glacier extent has been constrained by the LIA moraines. The
terminal moraines occur in front of cirques and valley sides and mark the maximum extent of
LIA glaciation. The LIA moraines occur in front of 16 cirques, where nine of the cirques still
Page 84
72
contain glacier ice. None of the LIA moraines have been dated so their age is based on
interpretation of their geomorphological characteristics, vegetation cover and comparison to
older moraines. For a more accurate estimate, more fieldwork should be carried out with the
purpose of dating the moraines. The LIA in Iceland was characterized by a cool climate with
temperature depressions of 1 – 2 °C compared to the AD 1961 – 1990 average (Geirsdottir et
al., 2009). Cirques that presently host glacier ice, but lack any geomorphological fingerprint
are therefore also considered to have been glaciated during the LIA. However, the maximum
extent of these cirque glaciers is unknown. Figure 3.9B presents a reconstruction of the
glacier extent on Hornstrandir during the LIA. The extent of LIA glaciers has been drawn to
the outermost LIA moraines. In glaciated cirques without any moraines, only the present
glacier ice is mapped. It has been estimated that 21 cirques were glaciated during the LIA.
Together, the total glaciated area during the LIA has been calculated to 8.2 km2. Hjort et al.
(1985) calculated the total LIA glacier extent to be 8 – 10 km2, which fits well the estimate
from the present study.
Hjort et al. (1985) also concluded that cirques in Kjaransvík, Hlöðuvík and Hælavík were
glaciated during the LIA. In this study, only Hlöðuvík has been considered to have been
glaciated. In Kjaransvík and Hælavík no signs of LIA glaciation were recognised during
fieldwork. From aerial photographs, moraines have been mapped in both Kjaransvík and
Hælavík, but their appearance does not suggest any recent glaciation as the LIA moraines in
Hlöðuvík do. While Hjort et al. (1985) only mapped glacial landforms at the western and
northern part of Hornstrandir, this study has mapped LIA glaciers extent throughout the entire
Hornstrandir. Taking in account the difference in study area, the results from this study
indicate a more limited LIA extent than suggested by Hjort et al. (1985).
Most of the LIA moraines are located in front of cirques that are facing an S-SW direction.
These cirques face the lee side of the main wind direction (main wind direction is from NE
(Einarsson, 1976)) suggesting that wind transported snow was the main reason for glacier
growth during the LIA. Similar conclusions have been made for the perennial snow fields in
the area surrounding the Drangajökull ice cap (Brynjólfsson et al., 2014).
Page 85
73
5. Conclusions
This thesis has presented detailed geomorphological maps of the Hornstrandir
peninsula in Iceland. Landforms such as terminal moraines, hummocky moraines,
flutes, raised beaches and rock glaciers were mapped.
The Saksunarvatn Ash has been sampled in both Hlöðuvík and Hælavík, while the
Snæfellsjökull-1 tephra has been sampled in Kjaransvík.
Cosmogenic exposure dating from the plateaux have revealed that the entire
Hornstrandir were probably covered by ice during the LGM.
Moraines mapped as LIA moraines and “Old moraines” have been used to reconstruct
the glacier extent on Hornstrandir during the LIA and during Preboreal time.
The glacial history on Hornstrandir has been interpreted as follows:
o During the LGM, the entire Hornstrandir was covered by ice. Cirques glaciers
coalesced to form valley glaciers that flowed northwards towards the shelf
break. These glaciers deposited the subglacial tills in Hlöðuvík and Hælavík.
The upland plateaux were covered by cold based ice which preserved the
periglacial surface beneath. The plateaux weren’t deglaciated until 18 – 14 kyr
BP.
o By the Bølling Interstadial, glaciers had retreated further back than the present
coastline. Fine sand and silt units in Hlöðuvík and Hælavík indicate that the
sea-level stood at least 5 – 9 m higher than today.
o The glacier advance during the Younger Dryas reached at least out to the
present coast. Subglacial tills were deposited in Hlöðuvík and Hæalvik.
o By Preboreal time, most of Hornstrandir was deglaciated as indicated by the
Saksunarvatn Ash.
o During Neoglaciation, small transgression events occurred as seen from raised
shorelines in Kjarnasvík and Hælavík.
o By the LIA, 21 cirques on Hornstrandir were glaciated, with a total area of 8,2
km2.
A summary of the glacial history of Hornstrandir is presented in Figure 5.1.
Page 86
74
Fig. 5.1: Summary of the glacial history on Hornstrandir. Based on literature and observations from this
study.
Page 88
76
6. References
Anderson, J. B., Shipp, S. S., Lowe, A. L., Wellner, J. S. & Mosola, A. B. 2002. The
Antarctic Ice Sheet during the Last Glacial Maximum and its subsequent retreat
history: a review. Quaternary Science Reviews, 21, 49-70.
Andrews, J. T., Geirsdóttir, A., Hardardóttir, J., Principato, S., Grönvold, K., Kristjansdóttir,
G. B., Helgadóttir, G., Drexler, J. & Sveinbjörnsdóttir, A. 2002a. Distribution,
sediment magnetism and geochemistry of the Saksunarvatn (10 180±60 cal. yr BP)
tephra in marine, lake, and terrestrial sediments, northwest Iceland. Journal of
Quaternary Science, 17, 731-745.
Andrews, J. T., Hardardottir, J., Geirsdottir, A. & Helgadottir, G. 2002b. Late Quaternary ice
extent and glacial history from the Djupall Trough, off Vestfirdir Peninsula, North-
west Iceland; a stacked 36 cal. Ky environmental record. Polar Research, 21, 211-226.
Andrews, J. T., Hardardóttir, J., Helgadóttir, G., Jennings, A. E., Geirsdóttir, Á.,
Sveinbjörnsdóttir, Á. E., Schoolfield, S., Kristjánsdóttir, G. B., Smith, L. M. & Thors,
K. 2000. The N and W Iceland Shelf: insights into Last Glacial Maximum ice extent
and deglaciation based on acoustic stratigraphy and basal radiocarbon AMS dates.
Quaternary Science Reviews, 19, 619-631.
Andrews, J. T. & Helgadottir, G. 2003. Late Quaternary ice cap extent and deglaciation,
Hunafloaal, Northwest Iceland; evidence from marine cores. Arctic, Antarctic, and
Alpine Research, 35, 218-232.
Aronson, J. L. & Saemundsson, K. 1975. Relatively old basalts from structurally high areas in
central Iceland. Earth and Planetary Science Letters, 28, 83-97.
Barrett, P. J. 1996. Antarctic palaeoenvironment through Cenozoic times; a review. Terra
Antartica, 3, 103-119.
Barsch, D. 1992. Permafrost creep and rockglaciers. Permafrost and Periglacial Processes, 3,
175-188.
Benn, D. & Evans, D. 2010. Glaciers and glaciation, London UK, Hooder education.
Birks, H. H., Gulliksen, S., Haflidason, H., Mangerud, J. & Possnert, G. 1996. New
radiocarbon dates for the Vedde Ash and the Saksunarvatn Ash from western Norway.
Quaternary Research, 45, 119-127.
Björnsson, H. & Pálsson, F. 2008. Icelandic glaciers. Jökull, 58, 365-386.
Bowman, S. 1990. Radiocarbon dating, Univ of California Press.
Bradley, R. S. 1999. Paleoclimatology: reconstructing climates of the Quaternary, Academic
Press.
Briner, J., Miller, G., Davis, P. T., Bierman, P. & Caffee, M. 2003. Last Glacial Maximum ice
sheet dynamics in Arctic Canada inferred from young erratics perched on ancient tors.
Quaternary Science Reviews, 22, 437-444.
Brynjólfsson, S., Schomacker, A., Guðmundsdóttir, E. R. & Ingólfsson, Ó. 2015a. A 300-year
surge history of the Drangajökull ice cap, northwest Iceland, and its maximum during
the ‘Little Ice Age’. The Holocene, 0959683615576232.
Brynjólfsson, S., Schomacker, A. & Ingólfsson, Ó. 2014. Geomorphology and the Little Ice
Age extent of the Drangajökull ice cap, NW Iceland, with focus on its three surge-type
outlets. Geomorphology, 213, 292-304.
Brynjólfsson, S., Schomacker, A., Ingolfsson, Ó. & Keiding, J. K. 2015b. Early Holocene
extent of the Drangajökull ice cap, NW Iceland, constrained by 36Cl cosmogenic
Page 89
77
exposure dating. NGF Abstracts and Proceedings of the Geological Society of
Norway. , Vol 1.
Buckland & Dugmore 1991. If this is refugia, then why are my feet so bloody cold? In:
CASELDINE C., M. J. (ed.) Environmental Change in Iceland: Past and Present.
Springer Netherlands.
Cohen, K., Finney, S., Gibbard, P. & Fan, J.-X. 2013. The ICS international
chronostratigraphic chart. Episodes, 36, 199-204.
Einarsson, M. A. 1984. Climate of Iceland. World survey of climatology, 15, 673-697.
Einarsson, T. 1973. Geology of Iceland. Arctic Geology. American Association of Petroleum
Geologists Memoir Tulsa.
Einarsson, T. & Albertsson, K. J. 1988. The glacial history of Iceland during the past three
million years. Philosophical Transactions of the Royal Society of London, Series B:
Biological Sciences, 318, 637-644.
Einarsson, Þ. & Douglas, G. 1994. Geology of Iceland: rocks and landscape, Mál og
menning.
Eiríksson, J., Knudsen, K. L., Larsen, G., Olsen, J., Heinemeier, J., Bartels-Jónsdóttir, H. B.,
Jiang, H., Ran, L. & Símonarson, L. A. 2011. Coupling of palaeoceanographic shifts
and changes in marine reservoir ages off North Iceland through the last millennium.
Palaeogeography, Palaeoclimatology, Palaeoecology, 302, 95-108.
Farbrot, H., Etzelmüller, B., Guðmundsson, Á., Humlum, O., Kellerer-Pirklbauer, A., Eiken,
T. & Wangensteen, B. 2007. Rock glaciers and permafrost in Tröllaskagi, northern
Iceland. Zeitschrift für Geomorphologie, Supplementary Issues, 51, 1-16.
Flóvenz, Ó. G. & Saemundsson, K. 1993. Heat flow and geothermal processes in Iceland.
Tectonophysics, 225, 123-138.
Flowers, G. E., Bjornsson, H., Geirsdottir, A., Miller, G. H., Black, J. L. & Clarke, G. K. C.
2008. Holocene climate conditions and glacier variation in central Iceland from
physical modelling and empirical evidence. Quaternary Science Reviews, 27, 797-813.
Frakes, L. A., Francis, J. E. & Syktus, J. I. 2005. Climate modes of the Phanerozoic,
Cambridge University Press.
Geirsdóttir, Á., Andrews, J. T., Ólafsdóttir, S., Helgadóttir, G. & Hardardóttir, J. 2002. A 36
Ky record of iceberg rafting and sedimentation from north‐west Iceland. Polar
Research, 21, 291-298.
Geirsdóttir, Á. & Eiriksson, J. 1994. Sedimentary facies and environmental history of the
Late‐glacial glaciomarine Fossvogur sediments in Reykjavík, Iceland. Boreas, 23,
164-176.
Geirsdóttir, Á., Miller, G. H. & Andrews, J. T. 2007. Glaciation, erosion, and landscape
evolution of Iceland. Journal of Geodynamics, 43, 170-186.
Geirsdottir, A., Miller, G. H., Axford, Y. & Olafsdottir, S. 2009. Holocene and latest
Pleistocene climate and glacier fluctuations in Iceland. Quaternary Science Reviews,
28, 2107-2118.
Gordon, J. E. & Sharp, M. 1983. Lichenometry in dating recent glacial landforms and
deposits, southeast Iceland. Boreas, 12, 191-200.
Gordon, J. E., Whalley, W. B., Gellatly, A. F. & Vere, D. M. 1992. The formation of glacial
flutes; assessment of models with evidence from Lyngsdalen, North Norway.
Quaternary Science Reviews, 11, 709-731.
Gosse, J. C. & Phillips, F. M. 2001. Terrestrial in situ cosmogenic nuclides: theory and
application. Quaternary Science Reviews, 20, 1475-1560.
Page 90
78
Grönvold, K., Óskarsson, N., Johnsen, S. J., Clausen, H. B., Hammer, C. U., Bond, G. &
Bard, E. 1995. Ash layers from Iceland in the Greenland GRIP ice core correlated with
oceanic and land sediments. Earth and Planetary Science Letters, 135, 149-155.
Gudmundsson, H. J. 1997. A review of the Holocene environmental history of Iceland.
Quaternary Science Reviews, 16, 81-92.
Hansom, J. D. & Briggs, D. J. 1991. Sea-Level Change in Vestfirđir, North West Iceland.
Environmental Change in Iceland: Past and Present. Springer.
Hays, J. D., Imbrie, J. & Shackleton, N. J. Variations in the Earth's orbit: pacemaker of the ice
ages. 1976. American Association for the Advancement of Science.
Helgason, J. & Duncan, R. A. 2001. Glacial-interglacial history of the Skaftafell region,
southeast Iceland, 0–5 Ma. Geology, 29, 179-182.
Hjartarson, Á. & Ingólfsson, Ó. 1988. Preboreal glaciation of southern Iceland. Jökull, 1-16.
Hjort, C., Ingolfsson, O. & Norddahl, H. 1985. Late Quaternary geology and glacial history of
Hornstrandir, Northwest Iceland; a reconnaissance study. Joekull, 35, 9-29.
Hoppe, G. 1982. The extent of the last inland ice sheet of Iceland. Joekull, 32, 3-11.
Hubbard, B. & Glasser, N. F. 2005. Field techniques in glaciology and glacial
geomorphology, John Wiley & Sons.
Humlum, O. 1988. Rock glacier appearance level and rock glacier initiation line altitude: a
methodological approach to the study of rock glaciers. Arctic and Alpine Research,
160-178.
Humlum, O. 1996. Origin of rock glaciers; observations from Mellemfjord, Disko Island,
central West Greenland. Permafrost and Periglacial Processes, 7, 361-380.
Humlum, O., Christiansen, H. H. & Juliussen, H. 2007. Avalanche‐derived rock glaciers in
Svalbard. Permafrost and Periglacial Processes, 18, 75-88.
Imbrie, J., Berger, A., Boyle, E., Clemens, S., Duffy, A., Howard, W., Kukla, G., Kutzbach,
J., Martinson, D. & McIntyre, A. 1993. On the structure and origin of major glaciation
cycles 2. The 100,000‐year cycle. Paleoceanography, 8, 699-735.
Ingolfsson, O. 1991. A review of the late Weichselian and early Holocene glacial and
environmental history of Iceland. Environmental change in Iceland, 13-29.
Ingólfsson, Ó. & Norddahl, H. 2001. High relative sea level during the Bolling Interstadial in
western Iceland: a reflection of ice-sheet collapse and extremely rapid glacial
unloading. Arctic, Antarctic, and Alpine Research, 231-243.
Ingólfsson, Ó., Norðdahl, H. & Schomacker, A. 2010. 4 Deglaciation and Holocene Glacial
History of Iceland. Developments in Quaternary Sciences, 13, 51-68.
Jennings, A., SYVITSKI, J., GERSON, L., GRÖNVOLD, K., GEIRSDÓTTIR, Á.,
HARDARDÓTTIR, J., ANDREWS, J. & HAGEN, S. 2000. Chronology and
paleoenvironments during the late Weichselian deglaciation of the southwest Iceland
shelf. Boreas, 29, 163-183.
Johannsdottir, G. 2003. Tephra in marine and terrestrial sequences, Vestfirdir, Iceland BS
Honors thesis, University of Iceland.
Johnson, P. G. 1984. Rock Glacier Formation by High‐Magnitude Low‐Frequency Slope
Processes in the Southwest Yukon. Annals of the Association of American
Geographers, 74, 408-419.
Kaldal, I. & Víkingsson, S. 1991. Early Holocene deglaciation in central Iceland. Jökull, 40,
51-66.
Kjartansson, G. 1969. Geological map of Iceland. Sheet 1, Northwest Iceland. Museum of
Natural Histroy, Reykjavik.
Page 91
79
Krueger, J. & Kjaer, K. H. 1999. A data chart for field description and genetic interpretation
of glacial diamicts and associated sediments; with examples from Greenland, Iceland,
and Denmark. Boreas, 28, 386-402.
Larsen, G. & Eiriksson, J. 2008. Late Quaternary terrestrial tephrochronology of Iceland;
frequency of explosive eruptions, type and volume of tephra deposits. JQS. Journal of
Quaternary Science, 23, 109-120.
Larsen, G., Eiríksson, J., Knudsen, K. L. & Heinemeier, J. 2002. Correlation of late Holocene
terrestrial and marine tephra markers, north Iceland: implications for reservoir age
changes. Polar Research, 21, 283-290.
Larusson, E. 1983. Aspects of the glacial geomorphology of the Vestfirdir Peninsula of
northwest Iceland with particular reference to the Vestur-Isafjarsarsysla area.
Durham University.
Libby, W. F. 1955. Radiocarbon Dating (1955). f. Libby131Radiocarbon Dating1955, 131.
Licciardi, J., Denoncourt, C. & Finkel, R. 2008. Cosmogenic 36 Cl production rates from Ca
spallation in Iceland. Earth and Planetary Science Letters, 267, 365-377.
Lowe, J. J. & Walker, M. J. C. 1997. Reconstructing Quaternary environments, Longman,
Essex, United Kingdom.
Malmberg, S.-A. 1985. The water masses between Iceland and Greenland,
Hafrannsóknastofnunin.
Norðdahl, H. & Pétursson, H. G. 2005. Relative sea-level changes in Iceland: new aspects of
the Weichselian deglaciation of Iceland. Iceland: modern processes and past
environments. Elsevier, Amsterdam, 25-78.
Otvos, E. G. 2000. Beach ridges—definitions and significance. Geomorphology, 32, 83-108.
Potter, N. 1972. Ice-cored rock glacier, Galena Creek, northern Absaroka Mountains,
Wyoming. Geological Society of America Bulletin, 83, 3025-3058.
Principato, S. M. 2008. Geomorphic evidence for Holocene glacial advances and sea level
fluctuations on eastern Vestfirðir, northwest Iceland. Boreas, 37, 132-145.
Principato, S. M. & Geirsdottir, A. 2002. Glacial erosion patterns and moraine sequences on
the northwest peninsula of Iceland. Abstracts with Programs - Geological Society of
America, 34, 549.
Principato, S. M., Geirsdottir, A., Johannsdottir, G. E. & Andrews, J. T. 2006. Late
Quaternary glacial and deglacial history of eastern Vestfirdir, Iceland using
cosmogenic isotope ( (super 36) Cl) exposure ages and marine cores. JQS. Journal of
Quaternary Science, 21, 271-285.
Principato, S. M. & Johnson, J. S. 2009. Using a GIS to quantify patterns of Glacial Erosion
on Northwest Iceland: implications for independent ice sheets. Arctic, Antarctic, and
Alpine Research, 41, 128-137.
Reimer, P. J., Bard, E., Bayliss, A., Beck, J. W., Blackwell, P. G., Ramsey, C. B., Buck, C. E.,
Cheng, H., Edwards, R. L., Friedrich, M., Grootes, P. M., Guilderson, T. P.,
Haflidason, H., Hajdas, I., Hatte, C., Heaton, T. J., Hoffmann, D. L., Hogg, A. G.,
Hughen, K. A., Kaiser, K. F., Kromer, B., Manning, S. W., Niu, M., Reimer, R. W.,
Richards, D. A., Scott, E. M., Southon, J. R., Staff, R. A., Turney, C. S. M. & van der
Plicht, J. 2013. IntCal13 and Marine13 Radiocarbon Age calibration curves 0-50,000
years cal BP. 55, 1869-1887.
Roberts, S. J., Sigurvinsson, J. R., Westgate, J. A. & Sandhu, A. 2007. Late Pliocene
glaciation and landscape evolution of Vestfirðir, Northwest Iceland. Quaternary
Science Reviews, 26, 243-263.
Rundgren, M. & Ingólfsson, O. 1999. Plant survival in Iceland during periods of glaciation?
Journal of Biogeography, 26, 387-396.
Page 92
80
Rundgren, M., Ingolfsson, Ó., Björck, S., Jiang, H. & Haflidason, H. 1997. Dynamic sea‐level
change during the last deglaciation of northern Iceland. Boreas, 26, 201-215.
Shackleton, N. J. 2000. The 100,000-year ice-age cycle identified and found to lag
temperature, carbon dioxide, and orbital eccentricity. Science, 289, 1897-1902.
Spagnolo, M. & Clark, C. D. 2009. A geomorphological overview of glacial landforms on the
Icelandic continental shelf. Journal of Maps, 5, 37-52.
Stotter, J., Wastl, M., Caseldine, C. & Haberle, T. 1999. Holocene palaeoclimatic
reconstruction in northern Iceland: approaches and results. Quaternary Science
Reviews, 18, 457-74.
Thorarinsson, S. 1937. The main geological and topographical features of Iceland.
Geografiska Annaler, 19, 161-175.
Thoroddsen, T. 1892a. Postglaciale marine avflejringer, kystterrasjer og strandlinjer i Island.
Geografisk Tidsskrift, 11, 209 -225.
Thoroddsen, T. 1892b. Islands Jökler i Fortid og Nutid. Geografisk Tidsskrift, 11, 111 - 146.
Vedur.is. 2014. Climatological data from Bolungarvík and Hornbjargsviti [Online].
http://en.vedur.is/climatology/data/. [Accessed 13.10.2014.
Wahrhaftig, C. & Cox, A. 1959. Rock glaciers in the Alaska Range. Geological Society of
America Bulletin, 70, 383-436.
Walker, M. 2005. Quaternary dating methods, John Wiley and Sons.
Watkins, N. & Walker, G. 1977. Magnetostratigraphy of eastern Iceland. American Journal of
Science, 277, 513-584.
Zachos, J., Pagani, M., Sloan, L., Thomas, E. & Billups, K. 2001. Trends, rhythms, and
aberrations in global climate 65 Ma to present. Science, 292, 686-693.