4/19/2013 1 Ice Core Paleoclimate Research Group Ellen Mosley-Thompson Henry Brecher Mary Davis Paolo Gabrielli Ping-Nan Lin Matt Makou Victor Zagorodnov Post-doc. Chiara Ugietti Anna Wegner Funding provided by: NSF: Paleoclimate and Polar Programs NASA: Earth Sciences (Glaciology) NOAA: Paleoclimatology Gary Comer Foundation OSU Climate, Water & Carbon Program Graduate Students: Brad Goodwin Katelyn Johnson Karl Philippoff Donaldi Permana Stacy Porter Glaciers, People and Global Climate Change Lonnie G. Thompson School of Earth Sciences and BPRC, The Ohio State University Research Day 2013, Cleveland State University, April 12, 2013 Objective Introduction to global climate change Glaciers as recorders of global climate change Examples of how changes in climate impacted past Peruvian cultures Evidence for recent acceleration of the rate of glacier loss Evidence that some glaciers like the Quelccaya ice cap are smaller than they have been in the last 6,000 years Our options Why B.F. Skinner became pessimistic about human beings. “Immediate consequences outweigh delayed consequences” “Consequences for the individual outweigh consequences for others” P. Chance, 2007 Our greatest challenges in the 21 st Century
Source: Solar irradiance from composite satellite-based time series: 1976/01/05 to 2011/02/02 Physikalisch Meteorologisches Observatorium Davos2011/02/03 to 2012/01/11 University of Colorado Solar Radiation & Climate Experiment
Ice Cores
Pollen
Corals
Ocean & Lake Sediments
Tree rings
Speleothems
Various archival systems provide paleoclimate records
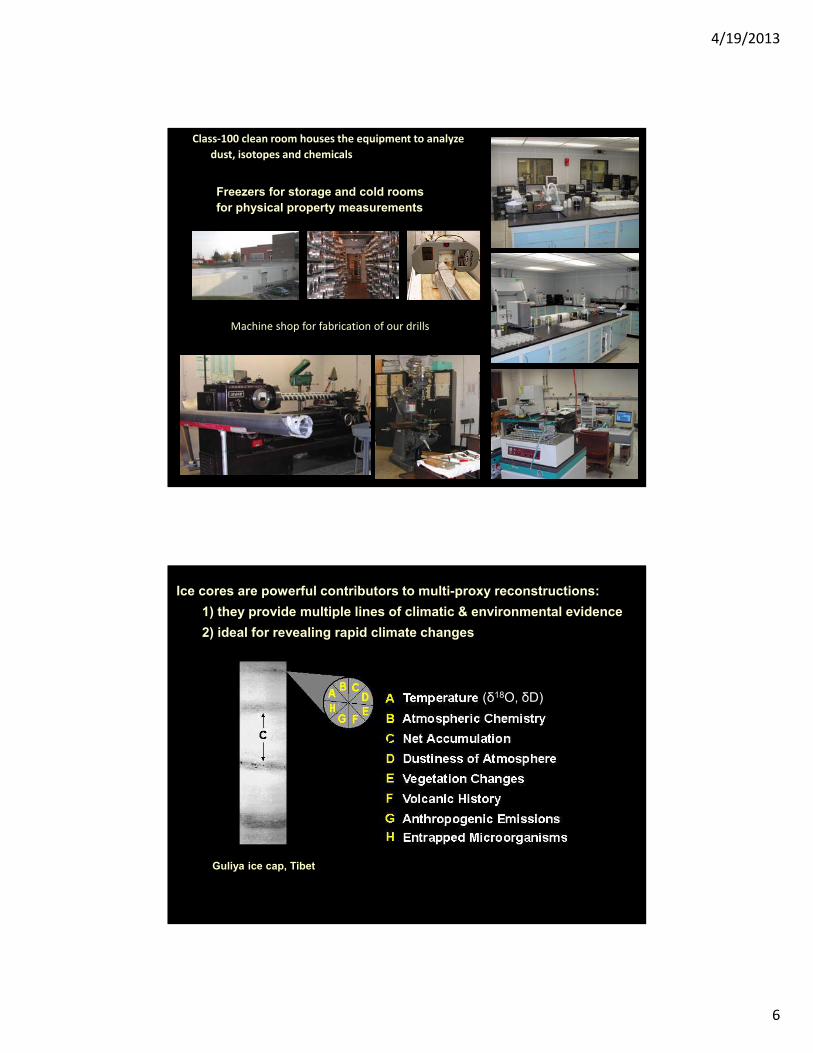
Freezers for storage and cold roomsfor physical property measurements
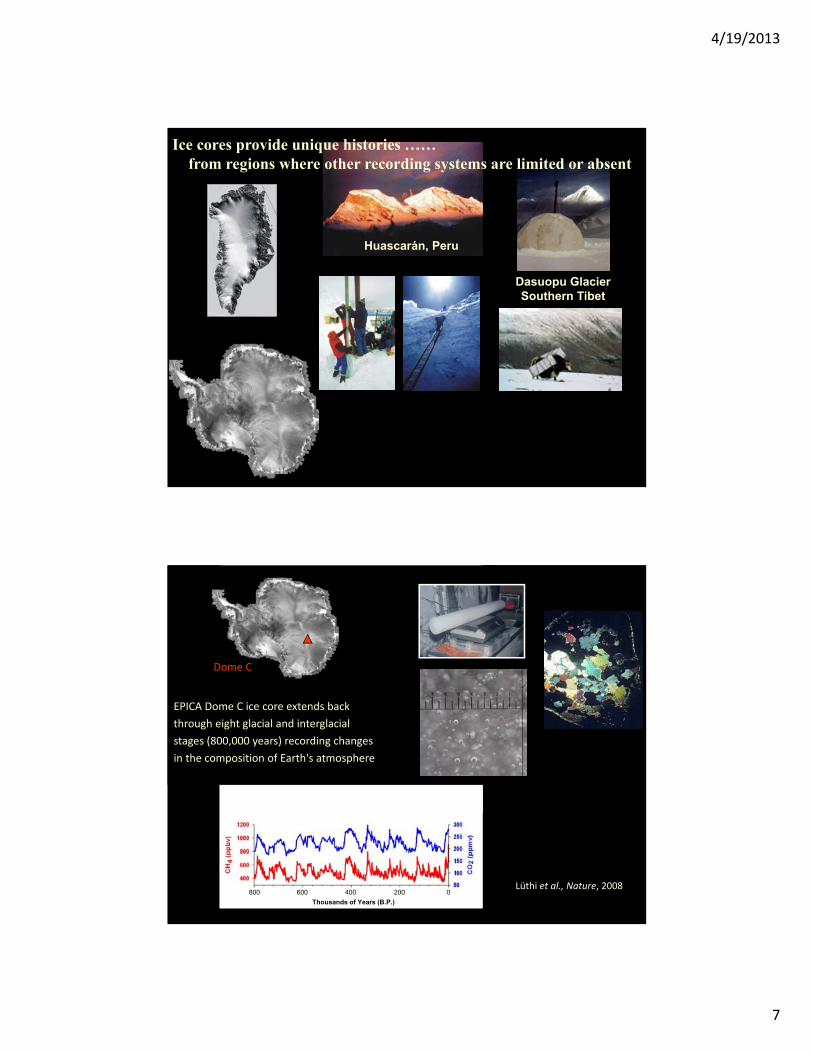
Guliya ice cap, Tibet
Ice cores are powerful contributors to multi-proxy reconstructions:1) they provide multiple lines of climatic & environmental evidence2) ideal for revealing rapid climate changes
(į18O, įD)
4/19/2013
7
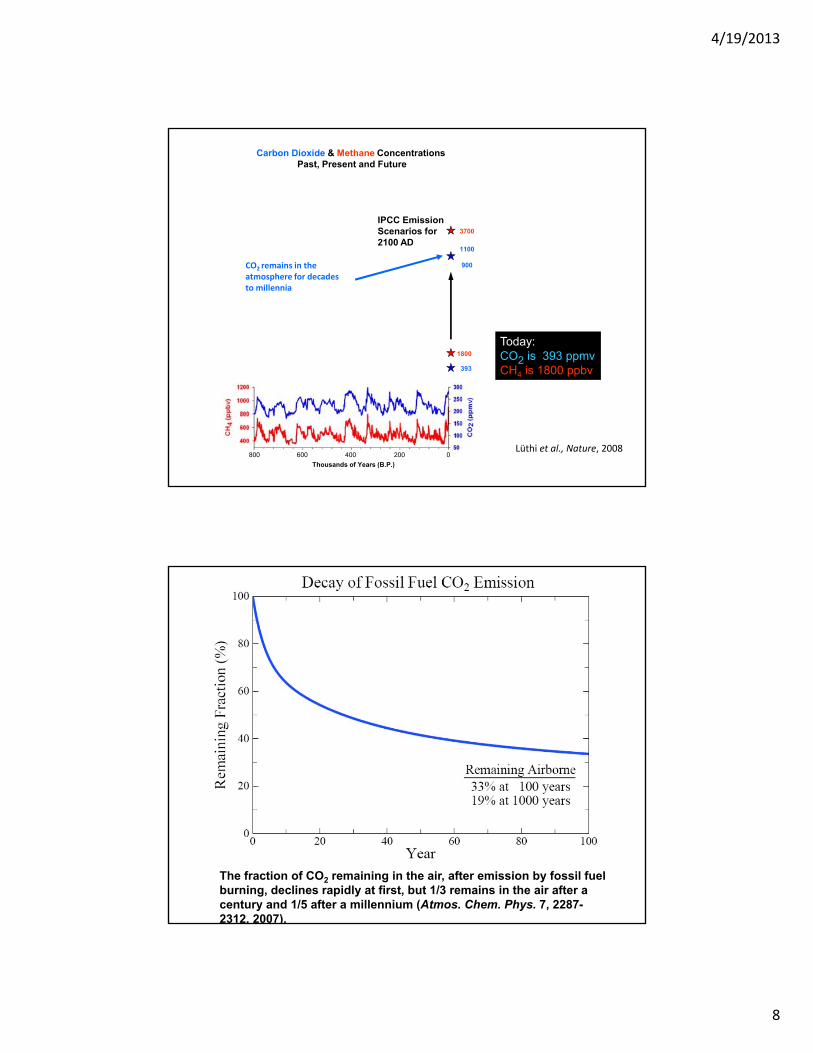
Dasuopu GlacierSouthern Tibet
Ice cores provide unique histories ……from regions where other recording systems are limited or absent
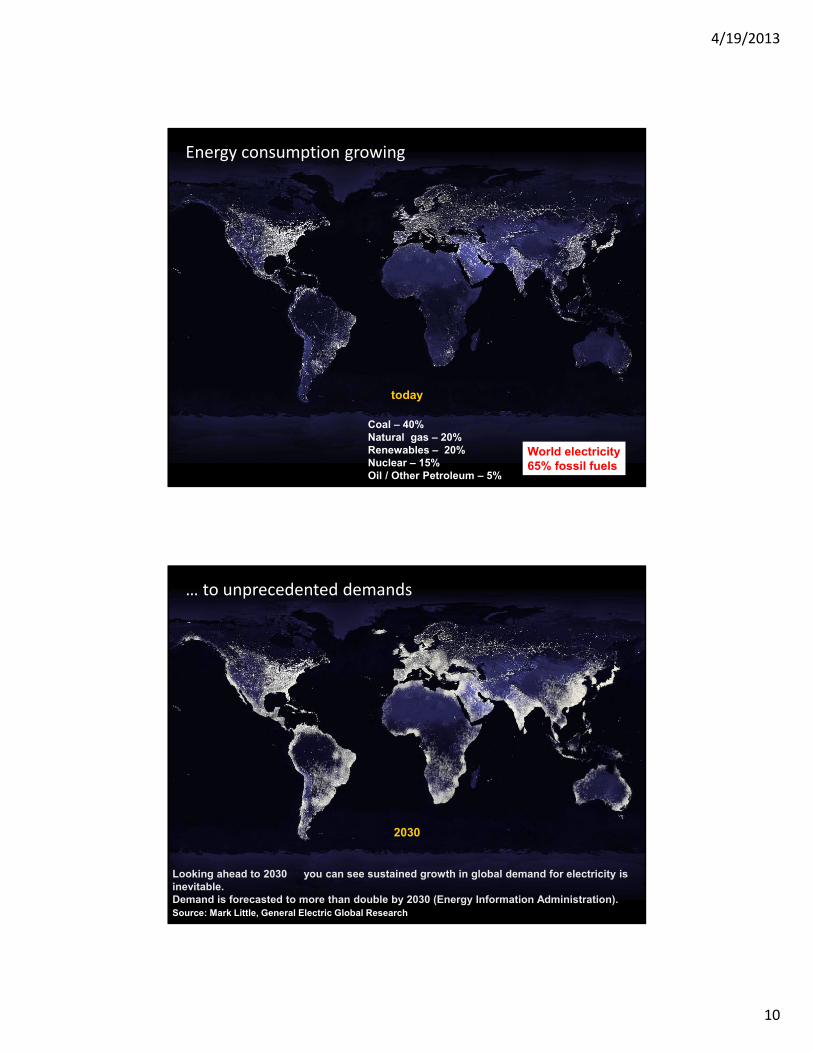
Carbon Dioxide & Methane Concentrations Past, Present and Future
Lüthi et�al., Nature,�2008
The fraction of CO2 remaining in the air, after emission by fossil fuel burning, declines rapidly at first, but 1/3 remains in the air after a century and 1/5 after a millennium (Atmos. Chem. Phys. 7, 2287-2312, 2007).
4/19/2013
9
4
3
5
0
Glo
bal
Tem
pera
ture
(C
)
1000 1200 1400 1600 1800 2000Year (C.E.)
2
1
0
0.4
-0.4
-0.8
IPCC Fourth Assessment, February 2007
IPCC 4th Assessment (2007)Projection for 2100 AD
2.0 – 4.5 oC
Northern Hemisphere temperature ( C)
for the last 1000 years
Population
1.0 billion in 1850 2.0 billion in 19304.1 billion in 19756.1 billion in 20007.0 billion in 20129.0 billion by 2050
Coal – 40% Natural gas – 20%Renewables – 20%Nuclear – 15%Oil / Other Petroleum – 5%
World electricity65% fossil fuels
…�to�unprecedented�demands�
Looking ahead to 2030 you can see sustained growth in global demand for electricity is inevitable.Demand is forecasted to more than double by 2030 (Energy Information Administration).
2030
Source: Mark Little, General Electric Global Research
1903Foto: Archivio Storico – Biblioteca della Montagna SATFoto: G. Alberti CGT 2005
Ghiacciai della Lobbia e dell’Adamello/Mandrone (102 anni)
4/19/2013
28
1978 – no lake
Retreat of the Qori Kalis Glacier (Peru)
1978 – no lake
2011lake covers 84 acres
The Third Pole high, cold, remote & threatened by climate change- Centered on the Tibetan Plateau & Himalayas- Covers 5 million km2
- One of the largest glacial stores of fresh water over 46,000 glaciers(Asia’s water tower)- Glaciers feed Asia’s largest rivers- Help sustain 1.5 billion people in 10 countries
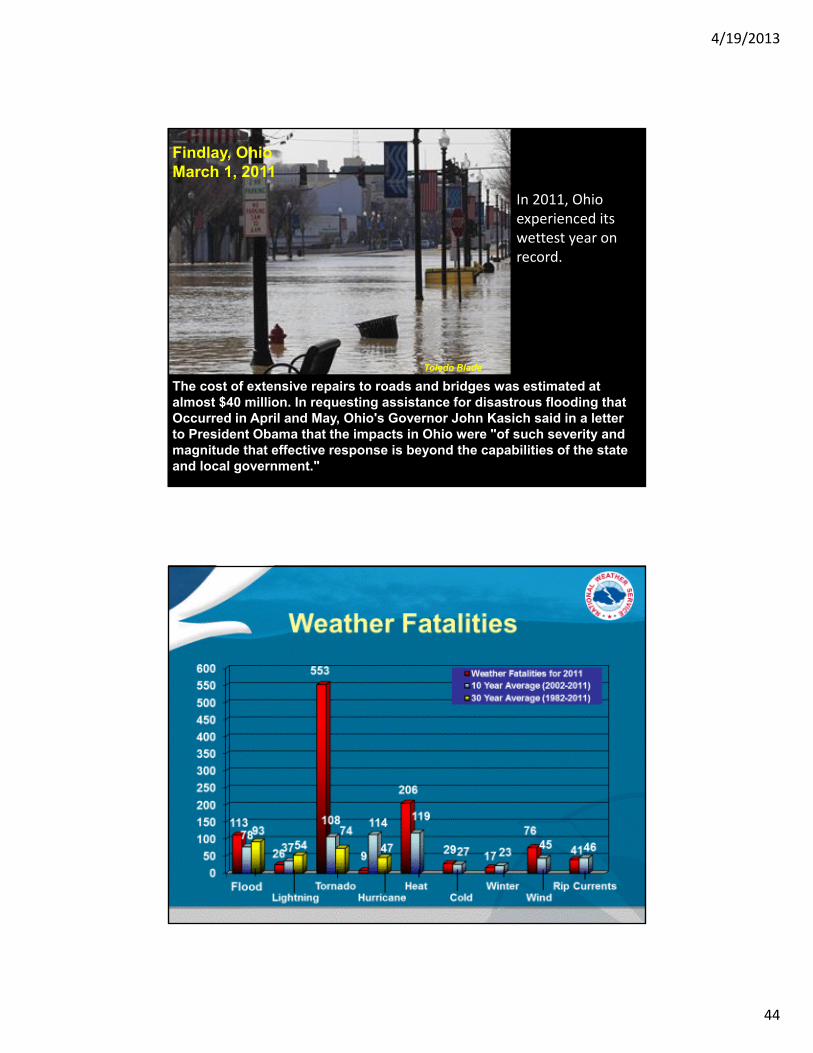
The cost of extensive repairs to roads and bridges was estimated at almost $40 million. In requesting assistance for disastrous flooding that Occurred in April and May, Ohio's Governor John Kasich said in a letter to President Obama that the impacts in Ohio were "of such severity and magnitude that effective response is beyond the capabilities of the state and local government."
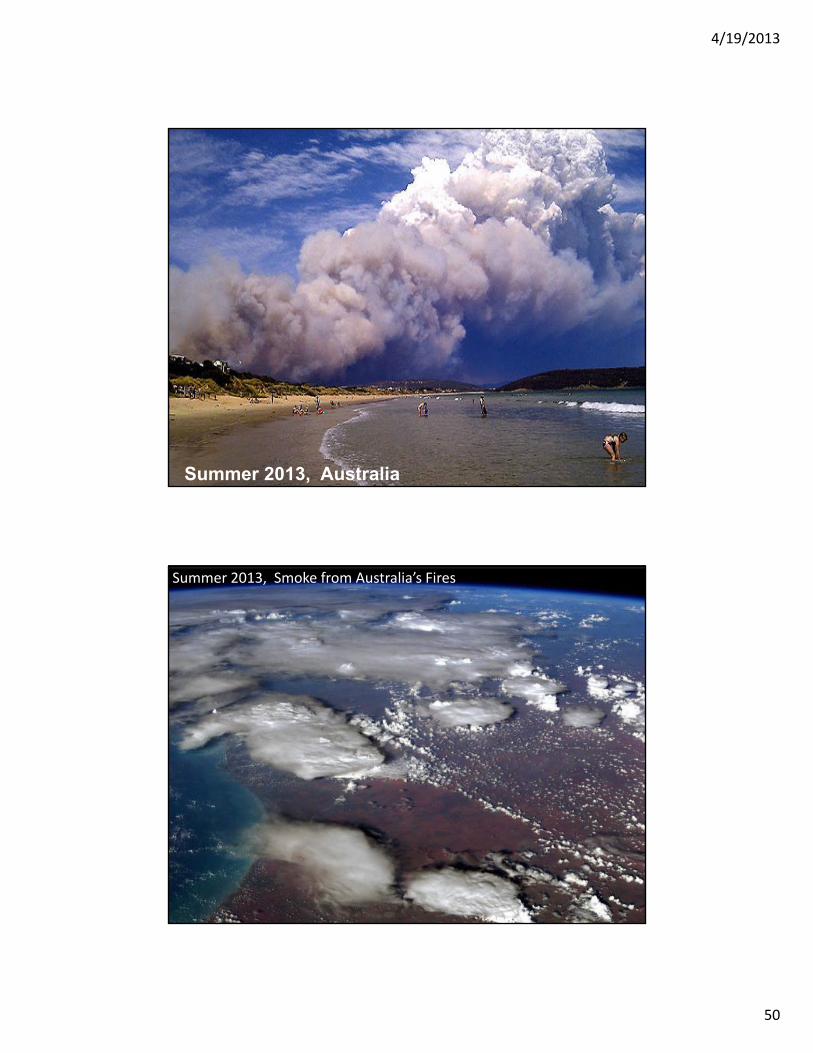
The U.S has endured a near-record wildfire seasonwith the total acres burned roughly the same size as Massachusetts and Connecticut combined: 2006-- 9.8 million acres2007-- 9.3 million acres2012-- 9.1 million acres
Data: September 17, 2012: Left Panel: sea ice extent (>15% ice), Right: sea ice concentration (%). Pink Line: climatological extent (1979—2000). Source: National Snow and Ice Date Center, Boulder, Colorado.Sea Ice cover in September, 2012 was 3.42 million square kilometers (1.32 M sq. mi.) which is 18% smaller than in 2007 record low of 4.17 million square kilometers (1.61 M sq. mi.)
Illustrates: the conditions and events and scenariosthat we can expect from climate change. In New York and New Jersey there are 45 superfund toxic waste sites within half a mile of the coast