Glass transition and crystallization kinetics of a barium borosilicate glass by a non- isothermal method Andreia A. S. Lopes, Roque S. Soares, Maria M. A. Lima, and Regina C. C. Monteiro Citation: Journal of Applied Physics 115, 043516 (2014); doi: 10.1063/1.4863334 View online: http://dx.doi.org/10.1063/1.4863334 View Table of Contents: http://scitation.aip.org/content/aip/journal/jap/115/4?ver=pdfcov Published by the AIP Publishing Articles you may be interested in Low-temperature properties of monoalcohol glasses and crystals Low Temp. Phys. 39, 468 (2013); 10.1063/1.4807147 Kinetics of amorphous-crystallization transformation of Se 85 x Te 15 Sn x (x = 2, 4 and 6) alloys under non- isothermal conditions using Matusita's approach AIP Conf. Proc. 1512, 542 (2013); 10.1063/1.4791151 Crystallization of amorphous Cu 47 Ti 34 Zr 11 Ni 8 J. Appl. Phys. 89, 1573 (2001); 10.1063/1.1332089 Crystallization kinetics and structural aspects of TeGaSn amorphous alloys J. Appl. Phys. 88, 3276 (2000); 10.1063/1.1288691 Differential scanning calorimetry, x-ray diffraction and 19 F nuclear magnetic resonance investigations of the crystallization of InF 3 -based glasses J. Chem. Phys. 109, 2432 (1998); 10.1063/1.476812 [This article is copyrighted as indicated in the article. Reuse of AIP content is subject to the terms at: http://scitation.aip.org/termsconditions. Downloaded to ] IP: 193.136.124.211 On: Wed, 25 Jun 2014 14:09:03
Transcript
Glass transition and crystallization kinetics of a barium borosilicate glass by a non-isothermal methodAndreia A. S. Lopes, Roque S. Soares, Maria M. A. Lima, and Regina C. C. Monteiro
Citation: Journal of Applied Physics 115, 043516 (2014); doi: 10.1063/1.4863334 View online: http://dx.doi.org/10.1063/1.4863334 View Table of Contents: http://scitation.aip.org/content/aip/journal/jap/115/4?ver=pdfcov Published by the AIP Publishing Articles you may be interested in Low-temperature properties of monoalcohol glasses and crystals Low Temp. Phys. 39, 468 (2013); 10.1063/1.4807147 Kinetics of amorphous-crystallization transformation of Se 85 x Te 15 Sn x (x = 2, 4 and 6) alloys under non-isothermal conditions using Matusita's approach AIP Conf. Proc. 1512, 542 (2013); 10.1063/1.4791151 Crystallization of amorphous Cu 47 Ti 34 Zr 11 Ni 8 J. Appl. Phys. 89, 1573 (2001); 10.1063/1.1332089 Crystallization kinetics and structural aspects of TeGaSn amorphous alloys J. Appl. Phys. 88, 3276 (2000); 10.1063/1.1288691 Differential scanning calorimetry, x-ray diffraction and 19 F nuclear magnetic resonance investigations of thecrystallization of InF 3 -based glasses J. Chem. Phys. 109, 2432 (1998); 10.1063/1.476812
[This article is copyrighted as indicated in the article. Reuse of AIP content is subject to the terms at: http://scitation.aip.org/termsconditions. Downloaded to ] IP:
[This article is copyrighted as indicated in the article. Reuse of AIP content is subject to the terms at: http://scitation.aip.org/termsconditions. Downloaded to ] IP:
data were corrected by subtracting a blank measurement
made without sample under the same conditions, and auto-
matic baseline correction was performed with the software
package delivered with the thermal analysis equipment. The
glass transition temperature (Tg), the onset temperature of
crystallization (Tc), and the peak crystallization temperature
(Tp) for the investigated glass were determined from the
DSC data by using the microprocessor of the thermal ana-
lyzer, the measurement error being assumed as 1%.
The glass powders were uniaxial pressed using a com-
pressive stress of �75 MPa and the resulting compacts
(�3 mm height, 13 mm diameter) were heat treated in an
electric tubular furnace from room temperature up to a
selected temperature suggested by the DSC results. The sam-
ples were held during 60 min at that temperature and then
were left to cool inside the furnace.
The amorphous nature of the glass powder and the crys-
talline phases present in heat-treated glass samples were
identified by XRD analysis (DMAX-IIIC diffractometer-
Rigaku Industrial Corporation), using CuKa radiation
(40 kV, 30 mA), 2h angle range 10�–60�, a scanning rate of
2� min�1 and a sampling interval of 0.01� (2h). The phases
were identified by comparing the experimental X-ray pat-
terns to standards complied by the International Centre for
Diffraction Data (ICDD).
Microstructural observations of the sintered glass sam-
ples were performed by SEM (ZEISS, DSM 960). SEM
observations were carried out in polished surfaces (mirror
finishing) and some of them were etched by immersion in 2
vol. % HF solution for 2 s. Au/Pd surface coating was used
to avoid electric charging.
III. RESULTS AND DISCUSSION
A. Structural and thermal studies
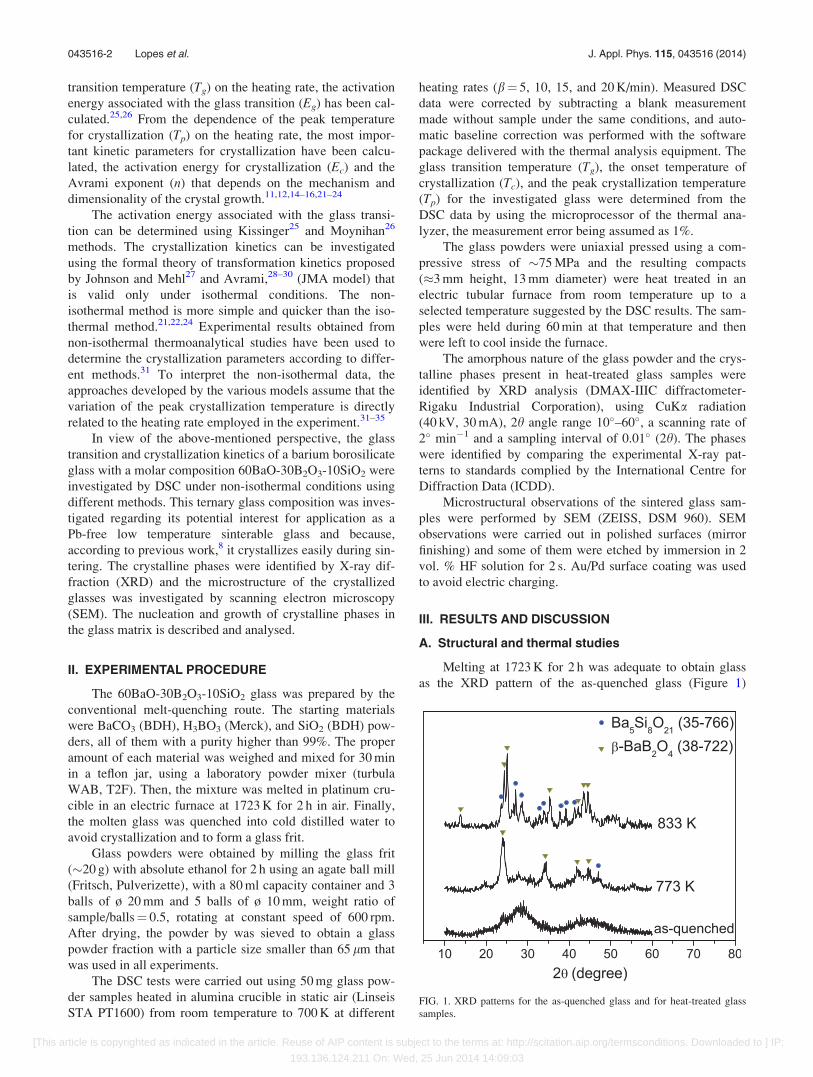
Melting at 1723 K for 2 h was adequate to obtain glass
as the XRD pattern of the as-quenched glass (Figure 1)
FIG. 1. XRD patterns for the as-quenched glass and for heat-treated glass
samples.
043516-2 Lopes et al. J. Appl. Phys. 115, 043516 (2014)
[This article is copyrighted as indicated in the article. Reuse of AIP content is subject to the terms at: http://scitation.aip.org/termsconditions. Downloaded to ] IP:
193.136.124.211 On: Wed, 25 Jun 2014 14:09:03
confirmed its amorphous nature. Two broad peaks are clearly
observed, approximately at 2h¼ 28� and 43�, which is
the characteristic of borate glasses containing a high level
of BaO plus B2O3 (totalizing� 90 mol. %)1,2,8 The
as-quenched glass appeared slightly opalescent and this is
likely due to phase separation as it appeared that two distinct
amorphous structures coexisted as revealed by the double
hump in the XRD pattern. According to some structural
models of alkali borosilicate glasses reported in literature,36
the glass is composed of two micro-phase separated borate
and silicate networks, in which the sharing of the modifier
between the two networks depends on the relative amounts
of borate structural units.20,36
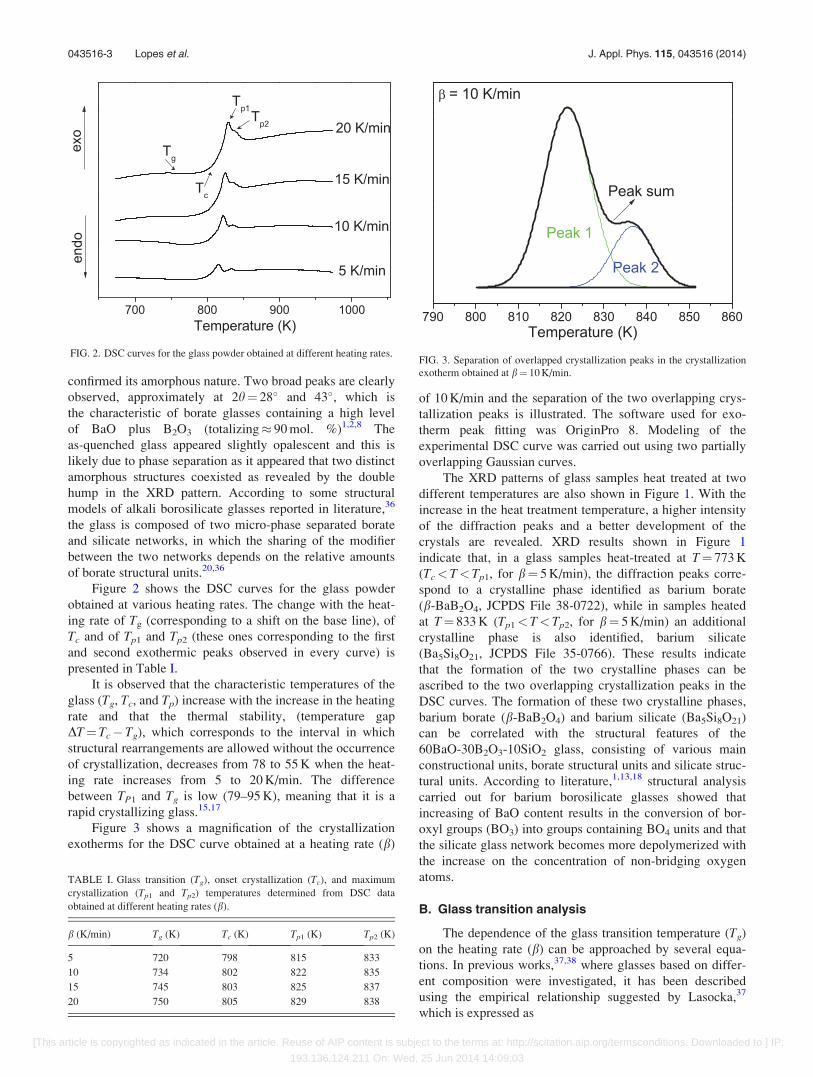
Figure 2 shows the DSC curves for the glass powder
obtained at various heating rates. The change with the heat-
ing rate of Tg (corresponding to a shift on the base line), of
Tc and of Tp1 and Tp2 (these ones corresponding to the first
and second exothermic peaks observed in every curve) is
presented in Table I.
It is observed that the characteristic temperatures of the
glass (Tg, Tc, and Tp) increase with the increase in the heating
rate and that the thermal stability, (temperature gap
DT¼ Tc�Tg), which corresponds to the interval in which
structural rearrangements are allowed without the occurrence
of crystallization, decreases from 78 to 55 K when the heat-
ing rate increases from 5 to 20 K/min. The difference
between TP1 and Tg is low (79–95 K), meaning that it is a
rapid crystallizing glass.15,17
Figure 3 shows a magnification of the crystallization
exotherms for the DSC curve obtained at a heating rate (b)
of 10 K/min and the separation of the two overlapping crys-
tallization peaks is illustrated. The software used for exo-
therm peak fitting was OriginPro 8. Modeling of the
experimental DSC curve was carried out using two partially
overlapping Gaussian curves.
The XRD patterns of glass samples heat treated at two
different temperatures are also shown in Figure 1. With the
increase in the heat treatment temperature, a higher intensity
of the diffraction peaks and a better development of the
crystals are revealed. XRD results shown in Figure 1
indicate that, in a glass samples heat-treated at T¼ 773 K
(Tc< T<Tp1, for b¼ 5 K/min), the diffraction peaks corre-
spond to a crystalline phase identified as barium borate
(b-BaB2O4, JCPDS File 38-0722), while in samples heated
at T¼ 833 K (Tp1<T< Tp2, for b¼ 5 K/min) an additional
crystalline phase is also identified, barium silicate
(Ba5Si8O21, JCPDS File 35-0766). These results indicate
that the formation of the two crystalline phases can be
ascribed to the two overlapping crystallization peaks in the
DSC curves. The formation of these two crystalline phases,
barium borate (b-BaB2O4) and barium silicate (Ba5Si8O21)
can be correlated with the structural features of the
60BaO-30B2O3-10SiO2 glass, consisting of various main
constructional units, borate structural units and silicate struc-
tural units. According to literature,1,13,18 structural analysis
carried out for barium borosilicate glasses showed that
increasing of BaO content results in the conversion of bor-
oxyl groups (BO3) into groups containing BO4 units and that
the silicate glass network becomes more depolymerized with
the increase on the concentration of non-bridging oxygen
atoms.
B. Glass transition analysis
The dependence of the glass transition temperature (Tg)
on the heating rate (b) can be approached by several equa-
tions. In previous works,37,38 where glasses based on differ-
ent composition were investigated, it has been described
using the empirical relationship suggested by Lasocka,37
which is expressed as
FIG. 2. DSC curves for the glass powder obtained at different heating rates.
TABLE I. Glass transition (Tg), onset crystallization (Tc), and maximum
crystallization (Tp1 and Tp2) temperatures determined from DSC data
obtained at different heating rates (b).
b (K/min) Tg (K) Tc (K) Tp1 (K) Tp2 (K)
5 720 798 815 833
10 734 802 822 835
15 745 803 825 837
20 750 805 829 838
FIG. 3. Separation of overlapped crystallization peaks in the crystallization
exotherm obtained at b¼ 10 K/min.
043516-3 Lopes et al. J. Appl. Phys. 115, 043516 (2014)
[This article is copyrighted as indicated in the article. Reuse of AIP content is subject to the terms at: http://scitation.aip.org/termsconditions. Downloaded to ] IP:
193.136.124.211 On: Wed, 25 Jun 2014 14:09:03
Tg ¼ Ag þ Bglogb; (1)
where Ag and Bg are constants for a given glass composition.
The value for Ag represents the glass transition temperature
at a heating rate of 1 K/min. The value for the constant Bg
has been related to the method of quenching the glass,37 the
lower the cooling rate of the melt, the lower the Bg
value.37–40 The plot of Tg versus log (b) and a straight regres-
sion line fitted to the DSC experimental data are shown in
Figure 4. The inset in Figure 4 shows an upward shift in Tg
with increasing heating rate, and the change of Tg with b is
also presented in Table I. For the current glass, the values
determined for Ag and Bg are 684.3 K and 50.8 K, respec-
tively, and so the empirical formula can be written in the
form
Tg ¼ 684:3þ 50:8 logb: (2)
A second approach regarding the dependence of the
glass transition temperature on the heating rate is based on
Kissinger’s method,25 which considers the following
relationship:
lnT2
g
b
!¼ Eg
RTgþ constant; (3)
where R is the universal gas constant and Eg is the activation
energy associated with the glass transition.40 Although XRD
results for the as-quenched glass indicated two distinct amor-
phous structures, only a single Tg was identified in the DTA
curves (see Figure 1 and inset in Figure 4) and therefore it
was considered appropriate to apply Eq. (3) for the determi-
nation of Eg. Despite the fact that such expression has been
originally deduced for the crystallization kinetics, it has of-
ten been used to calculate the activation energy for the glass
transition that involves the molecular motion and rearrange-
ment of atoms around the glass transition temperature.39
According to Eq. (3), a plot of ln (Tg2/b) versus 1/Tg should
be a straight line, and from its slope the value of Eg can be
determined. A plot of ln (Tg2/b) versus 1000/Tg for the
studied glass is shown in Figure 5, displaying the linearity of
the used equation. From the slope of the straight line, the
value of Eg was calculated, and it is equal to190 kJ/mol.
Another approach to determine the value of Eg is based
on a simplified form of Eq. (3), since it has been assumed
that the variation of ln(1/Tp2) with ln b is much slower than
that of ln(1/Tp) with ln b, resulting in the following
relationship:26,41
� ln bð Þ ¼ Eg
RTgþ constant: (4)
The plot of ln(b) versus 1/Tg is also presented in Figure 5.
In this case, the value obtained for Eg is equal to 202 kJ/mol,
which is in good agreement with that obtained by the
Kissinger equation. From the above two values, the activation
energy of glass transition is around 196 kJ/mol.
C. Crystallization kinetics
The crystallization process was evaluated using different
non-isothermal methods, employing the DSC results
obtained at different heating rates, and the kinetic parameters
(activation energy for crystallization, Ec, and Avrami expo-
nent, n) for the first and the second crystallization peaks
were determined. Kissinger method,25 beyond its use in the
determination of the activation energy for glass transition, is
widely used to determine the activation energy for crystalli-
zation (Ec) considering the heating rate (b) dependence of
the peak crystallization temperature (Tp). The value of Ec
can be determined from the slope of a plot of ln (Tp2/b) vs
1/Tp according to the following equation:35,42
lnT2
p
b
!¼ Ec
RTpþ constant; (5)
where R is the universal gas constant. A linear plot indicates
the validity of the Kissinger method. The value of activation
energy for crystallization (Ec) can be calculated using a sim-
plified form of Kissinger equation that, as mentioned before,
has been proposed by some authors assuming that the varia-
tion of ln(1/Tp2) with lnb is is much slower than that of
ln(1/Tp) with lnb:31,41–43
FIG. 4. Tg versus log b for the as-quenched glass. The inset depicts the glass
transition peaks observed at various heating rates. FIG. 5. Plots of ln (Tg2/b) and of ln (b) vs. 1000/Tg.
043516-4 Lopes et al. J. Appl. Phys. 115, 043516 (2014)
[This article is copyrighted as indicated in the article. Reuse of AIP content is subject to the terms at: http://scitation.aip.org/termsconditions. Downloaded to ] IP:
193.136.124.211 On: Wed, 25 Jun 2014 14:09:03
ln bð Þ ¼ � Ec
RTpþ constant: (6)
The plot of ln(b) vs 1/Tp should be a straight line whose
slope also yields the value of Ec. Figure 6 shows the plots of
ln (Tp2/b) and of lnb versus 1000/Tp. The Ec values deter-
mined according to Eqs. (5) and (6) for the first and second
exothermic peaks are shown in Table II. The values are close
to each other indicating that it is possible to use either of the
two approaches.
From Table II, it is observed that Ec increases for the
second peak, suggesting that the energy barrier for the glass-
crystallization transformation for the second peak is higher
than that for the first peak. That is, Ec value for the peak cor-
responding to the crystallization of barium borate (b-
BaB2O4) is lower than Ec value for the peak corresponding
to the crystallization of barium silicate (Ba5Si8O21). These
results indicate that the formation of the barium borate
crystalline phase needs lower activation energy as it is gener-
ated in a loose borate-rich glass network structure, while the
barium silicate crystalline phase has to be formed in a more
interlocked silicate glass network structure.
To study the nature of the crystallization process, the
fraction of crystallization (v) was determined. The area
under a DSC crystallization peak, obtained at a constant
heating rate, is directly proportional to the volume fraction
of crystallites (v) precipitated in the glass.11,22,39,44,45 From
the DSC curve, the fraction of crystallization at any tempera-
ture T can be determined by the ratio AT/A, where A is the
total area of the crystallization peak between the temperature
Ti (where crystallization just begins) and the temperature Tf
(where the crystallization is completed) and AT is the area
between Ti and T, as shown schematically in Figure 7. For
both exothermic peaks, the variation of the crystallization
fraction (v) as a function of temperature (T) is shown in
Figure 8. The curves display a classical sigmoid shape for
the different heating rates, indicating that the formation of
the crystalline phase proceeds by a combination of nuclea-
tion and growth processes.42
The ratio between the ordinates of the DSC curve and the
total area of the exothermal peak gives the corresponding crys-
tallization rates,11,44 which make it possible to build the curves
of the exothermal peaks represented in Figures 9(a) and 9(b).
The maxima of the crystallization rate (dv/dt) values, (dv/dt)Tp,
increase with the increase in the heating rate, which agrees
with what has been widely reported in the literature.11,42,44
For both exothermic peaks, taking into account the ex-
perimental value of (dv/dt)Tp at each heating rate, the value
of the Avrami exponent (n) can be calculated from the fol-
lowing equation:11,42
n ¼dv=dtð ÞTp � RT2
p
0:37bEc: (7)
For both peaks, the mean value of hni is very close to 2.
For the first exothermic peak, corresponding to the crystalli-
zation of barium borate (b-BaB2O4), the values determined
for n are in the range 1.7–2.4, and for the second exothermic
FIG. 6. Plots of ln (Tp2/b) and of ln (b) vs. 1000/Tp for the two exothermic
peaks.
TABLE II. Values of the activation energy for crystallization (Ec) obtained
by different equations (kJ/mol).
Equation
First crystallization
peak (Ec1)
Second crystallization
peak (Ec2)
(5) 581 904
(6) 595 918 FIG. 7. Area A between Ti and Tf, and area AT between Ti and T for the first
crystallization peak (b¼ 10 K/min).
043516-5 Lopes et al. J. Appl. Phys. 115, 043516 (2014)
[This article is copyrighted as indicated in the article. Reuse of AIP content is subject to the terms at: http://scitation.aip.org/termsconditions. Downloaded to ] IP:
193.136.124.211 On: Wed, 25 Jun 2014 14:09:03
peak, corresponding to the crystallization of barium silicate
(Ba5Si8O21), n values are in the range 1.5–2.1. The value of
the kinetic exponent (n� 2) for this ternary glass
(60BaO-30B2O3-10SiO2) is consistent with a crystallization
mechanism with one dimensional growth.46
In a non-isothermal crystallization process, the volume
fraction of crystallites (v) precipitated at a given temperature
(T) in a glass heated at constant rate (b) can be related to the
activation energy for crystallization (Ec) and to the Avrami
exponent (n) through the following expression suggested by
Matusita et al.:47
ln �ln 1� vð Þ½ � ¼ �nln bð Þ � 1:052 n� 1ð Þ Ec
RT
� �þ const:
(8)
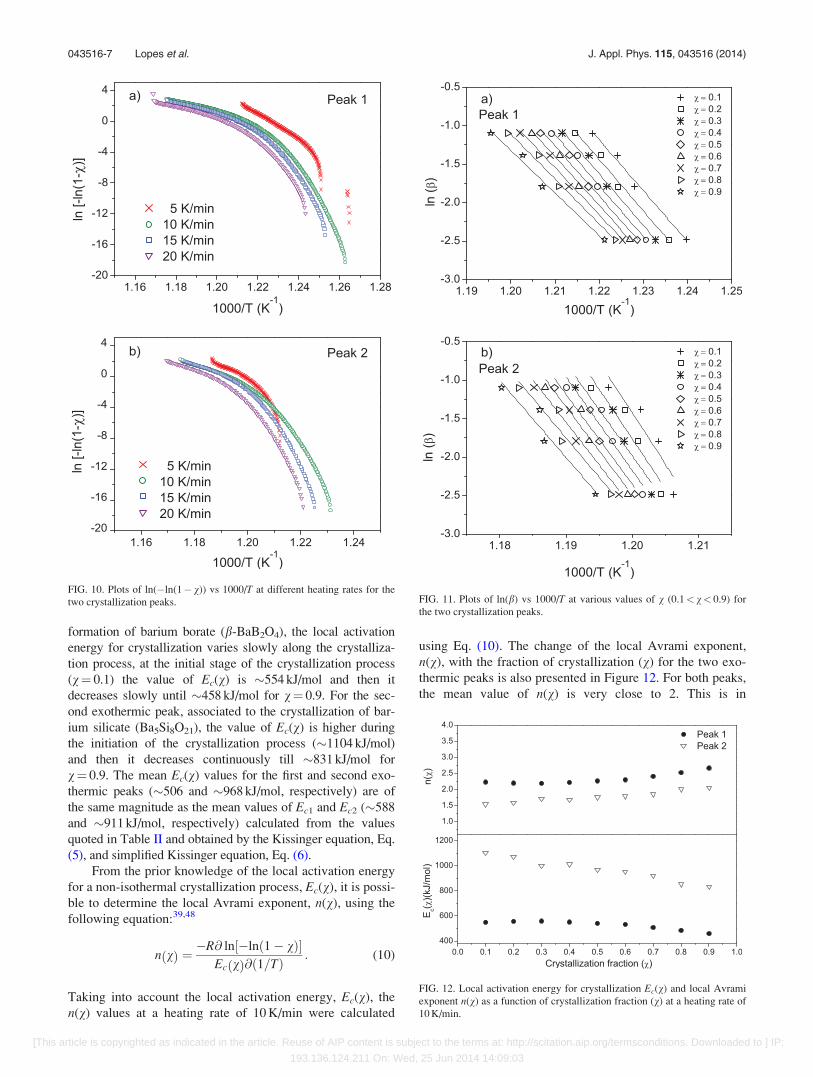
From this equation, a plot of ln[�ln(1� v)] versus 1000/Tfor each heating rate is expected to be a straight line with a
slope of 1.052(n� 1)(Ec/R). It is verified that, for the various
heating rates, the plots are non-linear over the entire temper-
ature range, as shown in Figure 10. This suggests that there
is a variation in Ec and n during the crystallization process of
glass.48–50
In fact, some authors have shown that n and Ec values are
not necessarily constant but vary during the transformation,
both in isothermal49 and in non-isothermal methods.39,50 The
activation energy for different crystallization volume fractions
is not constant in the whole transformation due to the change
of nucleation and growth behaviors during the crystallization
process.50 The variation of the activation energy Ec and of the
Avrami exponent n can be expressed by the local activation
energy Ec(v) and the local Avrami exponent n(v).48,51,52
The local activation energy Ec(v), representing the acti-
vation energy for crystallization when the crystallized vol-
ume fraction is v, can be determined from non-isothermal
DSC results, using the method proposed by Ozawa, accord-
ing to the following expression:53,54
d ln bð Þð Þd 1=Tð Þ
� �v
¼ �Ec vð Þ
R; (9)
where R is the gas constant and T and b are the temperature
and the heating rate corresponding to the value of v, respec-
tively. Taking into account the experimental data presented
in Figure 8, the plots of ln (b) versus 1000/T at various val-
ues of v (0.1< v< 0.9) were obtained (Figure 11) and from
the slopes the local activation energy, Ec(v) values were
calculated.
Figure 12 illustrates the change of Ec(v) with the crystal-
lized volume fraction (v) for the two crystallization peaks. It
is seen that for the first exothermic peak, corresponding to the
FIG. 8. Crystallized fraction (v) as a function of temperature at different
heating rates for the two overlapped crystallization peaks.
FIG. 9. Crystallization rate as a function of temperature for the first and sec-
ond exothermal peaks at different heating rates.
043516-6 Lopes et al. J. Appl. Phys. 115, 043516 (2014)
[This article is copyrighted as indicated in the article. Reuse of AIP content is subject to the terms at: http://scitation.aip.org/termsconditions. Downloaded to ] IP:
193.136.124.211 On: Wed, 25 Jun 2014 14:09:03
formation of barium borate (b-BaB2O4), the local activation
energy for crystallization varies slowly along the crystalliza-
tion process, at the initial stage of the crystallization process
(v¼ 0.1) the value of Ec(v) is �554 kJ/mol and then it
decreases slowly until �458 kJ/mol for v¼ 0.9. For the sec-
ond exothermic peak, associated to the crystallization of bar-
ium silicate (Ba5Si8O21), the value of Ec(v) is higher during
the initiation of the crystallization process (�1104 kJ/mol)
and then it decreases continuously till �831 kJ/mol for
v¼ 0.9. The mean Ec(v) values for the first and second exo-
thermic peaks (�506 and �968 kJ/mol, respectively) are of
the same magnitude as the mean values of Ec1 and Ec2 (�588
and �911 kJ/mol, respectively) calculated from the values
quoted in Table II and obtained by the Kissinger equation, Eq.
(5), and simplified Kissinger equation, Eq. (6).
From the prior knowledge of the local activation energy
for a non-isothermal crystallization process, Ec(v), it is possi-
ble to determine the local Avrami exponent, n(v), using the
following equation:39,48
n vð Þ ¼�R@ ln �ln 1� vð Þ½ �
Ec vð Þ@ð1=TÞ : (10)
Taking into account the local activation energy, Ec(v), the
n(v) values at a heating rate of 10 K/min were calculated
using Eq. (10). The change of the local Avrami exponent,
n(v), with the fraction of crystallization (v) for the two exo-
thermic peaks is also presented in Figure 12. For both peaks,
the mean value of n(v) is very close to 2. This is in
FIG. 10. Plots of ln(�ln(1� v)) vs 1000/T at different heating rates for the
two crystallization peaks. FIG. 11. Plots of ln(b) vs 1000/T at various values of v (0.1< v< 0.9) for
the two crystallization peaks.
FIG. 12. Local activation energy for crystallization Ec(v) and local Avrami
exponent n(v) as a function of crystallization fraction (v) at a heating rate of
10 K/min.
043516-7 Lopes et al. J. Appl. Phys. 115, 043516 (2014)
[This article is copyrighted as indicated in the article. Reuse of AIP content is subject to the terms at: http://scitation.aip.org/termsconditions. Downloaded to ] IP:
193.136.124.211 On: Wed, 25 Jun 2014 14:09:03
agreement with the mean value of hni for both crystallization
peaks calculated from Eq. (7), being indicative of a crystalli-
zation mechanism with a one-dimensional growth.46,55
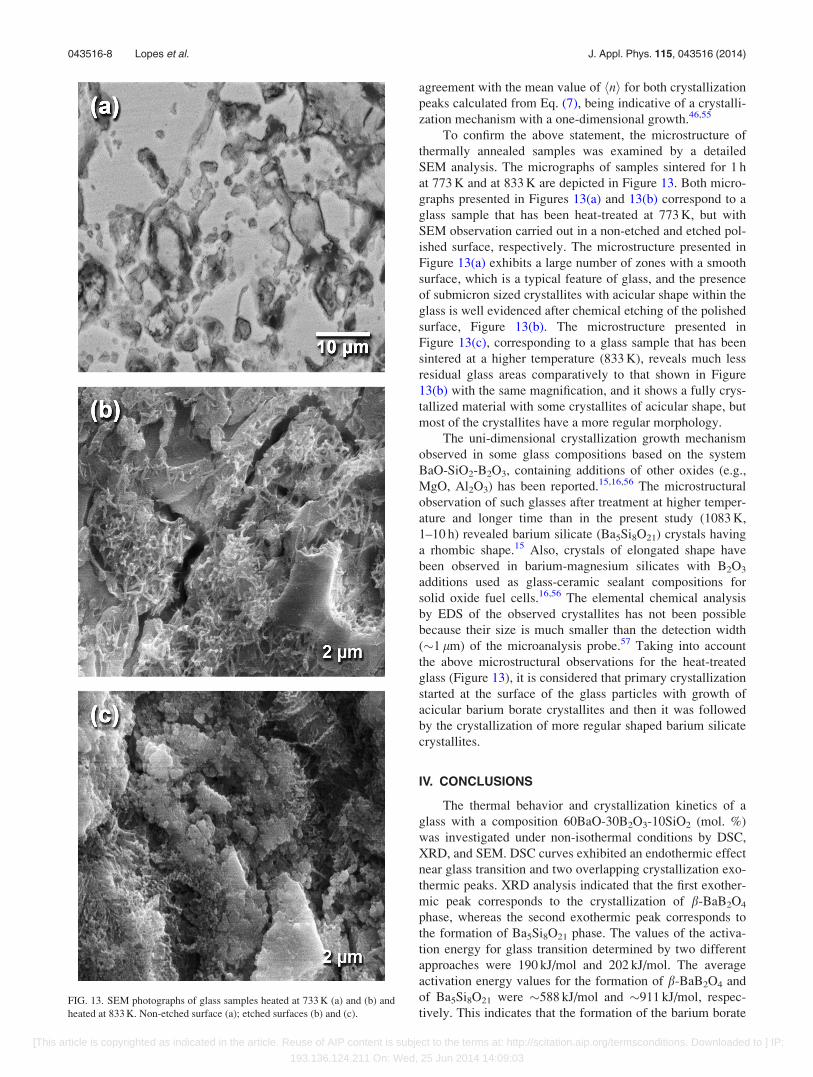
To confirm the above statement, the microstructure of
thermally annealed samples was examined by a detailed
SEM analysis. The micrographs of samples sintered for 1 h
at 773 K and at 833 K are depicted in Figure 13. Both micro-
graphs presented in Figures 13(a) and 13(b) correspond to a
glass sample that has been heat-treated at 773 K, but with
SEM observation carried out in a non-etched and etched pol-
ished surface, respectively. The microstructure presented in
Figure 13(a) exhibits a large number of zones with a smooth
surface, which is a typical feature of glass, and the presence
of submicron sized crystallites with acicular shape within the
glass is well evidenced after chemical etching of the polished
surface, Figure 13(b). The microstructure presented in
Figure 13(c), corresponding to a glass sample that has been
sintered at a higher temperature (833 K), reveals much less
residual glass areas comparatively to that shown in Figure
13(b) with the same magnification, and it shows a fully crys-
tallized material with some crystallites of acicular shape, but
most of the crystallites have a more regular morphology.
The uni-dimensional crystallization growth mechanism
observed in some glass compositions based on the system
BaO-SiO2-B2O3, containing additions of other oxides (e.g.,
MgO, Al2O3) has been reported.15,16,56 The microstructural
observation of such glasses after treatment at higher temper-
ature and longer time than in the present study (1083 K,
1–10 h) revealed barium silicate (Ba5Si8O21) crystals having
a rhombic shape.15 Also, crystals of elongated shape have
been observed in barium-magnesium silicates with B2O3
additions used as glass-ceramic sealant compositions for
solid oxide fuel cells.16,56 The elemental chemical analysis
by EDS of the observed crystallites has not been possible
because their size is much smaller than the detection width
(�1 lm) of the microanalysis probe.57 Taking into account
the above microstructural observations for the heat-treated
glass (Figure 13), it is considered that primary crystallization
started at the surface of the glass particles with growth of
acicular barium borate crystallites and then it was followed
by the crystallization of more regular shaped barium silicate
crystallites.
IV. CONCLUSIONS
The thermal behavior and crystallization kinetics of a
glass with a composition 60BaO-30B2O3-10SiO2 (mol. %)
was investigated under non-isothermal conditions by DSC,
XRD, and SEM. DSC curves exhibited an endothermic effect
near glass transition and two overlapping crystallization exo-
thermic peaks. XRD analysis indicated that the first exother-
mic peak corresponds to the crystallization of b-BaB2O4
phase, whereas the second exothermic peak corresponds to
the formation of Ba5Si8O21 phase. The values of the activa-
tion energy for glass transition determined by two different
approaches were 190 kJ/mol and 202 kJ/mol. The average
activation energy values for the formation of b-BaB2O4 and
of Ba5Si8O21 were �588 kJ/mol and �911 kJ/mol, respec-
tively. This indicates that the formation of the barium borateFIG. 13. SEM photographs of glass samples heated at 733 K (a) and (b) and
heated at 833 K. Non-etched surface (a); etched surfaces (b) and (c).
043516-8 Lopes et al. J. Appl. Phys. 115, 043516 (2014)
[This article is copyrighted as indicated in the article. Reuse of AIP content is subject to the terms at: http://scitation.aip.org/termsconditions. Downloaded to ] IP:
193.136.124.211 On: Wed, 25 Jun 2014 14:09:03
crystalline phase needs lower activation energy as it is gener-
ated in a loose borate-rich glass network structure, while the
barium silicate crystalline phase has to be formed in a more
interlocked silicate glass network structure.
The values of the local activation energy for crystalliza-
tion of b-BaB2O4 decreased from �554 to �458 kJ mol�1
and for crystallization of Ba5Si8O21 decreased from �1104
to �831 kJ mol�1, as the fraction of crystallization varied
from 0.1 to 0.9. The Avrami exponent calculated for both
exothermic peaks has the same value, n� 2. SEM observa-
tions indicated that surface crystallization with formation of
acicular submicron crystallites was the dominant crystalliza-
tion mechanism at 773 K, but when the sintering temperature
of the glass increased to 833 K crystallization progressed
from the surface towards the bulk with formation of more
regular shape submicron crystallites.
ACKNOWLEDGMENTS
This work was supported by Fundac~ao para a Ciencia e
a Tecnologia (FCT, Portugal) through Project PTDC/CTM/
113, 658 (2009).4S. Chen, S. Zhang, X. Zhou, T. Zhang, and M. He, J. Alloys Compd. 498,
185 (2010).5N. Santha, S. Shamsudeen, N. T. Karunakaran, and J. I. Naseemabeevi,
Int. J. Appl. Ceram. Technol. 8, 1042 (2011).6S. Chen and D. Zhu, J. Alloys Compd. 536, 73 (2012).7Z. Wang, Y. Hu, H. Lu, and F. Yu, J. Non-Cryst. Solids 354, 1128 (2008).8R. C. C. Monteiro, A. A. S. Lopes, M. M. A. Lima, J. P. Veiga, R. J. C.
Silva, C. J. Dias, E. J. R. Davim, and M. H. V. Fernandes, J. Am. Ceram.
Soc. 95, 3144 (2012).9G.-H. Hwang, H.-J. Jeon, and Y.-S. Kim, J. Am. Ceram. Soc. 85, 2956
(2002).10E.-S. Lim, B.-S. Kim, J.-H. Lee, and J.-J. Kim, J. Electroceram. 17, 359
(2006).11A. Arora, E. R. Shaaban, K. Singh, and O. P. Pandey, J. Non-Cryst. Solids
354, 3944 (2008).12J.-H. Jean, Y.-C. Fang, S. X. Dai, and D. L. Wilcox, J. Am. Ceram. Soc.
84, 1354 (2001).13J. Ramkumar, S. Chandramouleeswaran, V. Sudarsan, R. K. Mishr, C. P.
Kaushik, K. Raj, and A. K. Tyagi, J. Hazard. Mater. 172, 457 (2009).14A. Goel, D. U. Tulyaganov, I. K. Goel, E. R. Shaaban, and J. M. F.
Ferreira, J. Non-Cryst. Solids 355, 193 (2009).15D. Godeke and U. Dahlmann, J. Power Sources 196, 9046 (2011).
16M. J. Pascual, C. Lara, and A. Duran, Phys. Chem. Glasses: Eur. J. Glass
Sci. Technol., Part B 47, 572 (2006).17L. Rezazadeh, S. Baghshahi, A. N. Golikand, and Z. Hamnabard, Ionics
20, 55 (2014).18V. Kumar, O. P. Pandey, and K. Singh, Physica B 405, 204 (2010).19V. V. Golubkov, V. L. Stolyarova, Z. G. Tyurnina, and N. G. Tyurnina,
Glass Phys. Chem. 36, 554 (2010).20T. Mullenbach, M. Franke, A. Ramm, A. R. Betzen, S. Kapoor, N. Lower,
T. Munhollon, M. Berman, M. Affatigato, and S. A. Feller, Phys. Chem.
Glasses: Eur. J. Glass Sci. Technol., Part B 50, 89 (2009).21M. Erol, S. K€uc€ukbayrak, and A. E-Mericboyu, J. Non-Cryst. Solids 355,
569 (2009).22M. Ghasemzadeh, A. Nemati, A. Nozad Golikand, Z. Hamnabard, and S.
Baghshahi, Synth. React. Inorg. Met.-Org., and Nano-Met. Chem. 41, 561
(2011).23B. Shanmugavelu and V. V. R. K. Kumar, J. Am. Ceram. Soc. 95, 2891
(2012).24J. V�azquez, P. L. L�opez-Alemany, P. Villares, and R. Jim�enez-Garay,
J. Phys. Chem. Solids 61, 493 (2000).25H. E. Kissinger, J. Res. Natl. Bur. Stand. 57, 217 (1956).26C. T. Moynihan, A. J. Easteal, J. Wilder, and J. Tucker, J. Phys. Chem. 78,
2673 (1974).27W. A. Johnson and R. F. Mehl, Trans AIME 135, 416 (1939).28M. Avrami, J. Chem. Phys. 7, 1103 (1939).29M. Avrami, J. Chem. Phys. 8, 212 (1940).30M. Avrami, J. Chem. Phys. 9, 177 (1941).31H. Yinnon and D. R. Uhlmann, J. Non-Cryst. Solids 54, 253 (1983).32H. E. Kissinger, Anal. Chem. 29, 1702 (1957).33A. B. Selcuk and H. Yavuz, Mater. Lett. 57, 4382 (2003).34D. W. Henderson, J. Therm. Anal. 15, 325 (1979).35K. Matusita and S. Sakka, J. Non-Cryst. Solids 38–39, 741 (1980).36S. Z. Xiao, J. Non-Cryst. Solids 45, 29 (1981).37M. Lasocka, Mater. Sci. Eng. 23, 173 (1976).38O. S. Narayanaswamy, J. Am. Ceram. Soc. 54, 491 (1971).39K. Majhi and K. Varma, J. Mater. Sci. 44, 385 (2009).40A. Abu-Sehly, Mater. Chem. Phys. 125, 672 (2011).41S. Mahadevan, A. Giridhar, and A. K. Singh, J. Non-Cryst. Solids 88, 11
(1986).42J. V�azquez, C. Wagner, P. Villares, and R. Jim�enez-Garay, J. Non-Cryst.
Solids 235, 548 (1998).43T. Ozawa, Polymer 12, 150 (1971).44K. A. Aly, A. A. Othman, and A. M. Abousehly, J. Alloys Compd. 467,
417 (2009).45C.-R. Chang and J.-H. Jean, J. Am. Ceram. Soc. 82, 1725 (1999).46R. Iordanova, E. Lefterova, I. Uzunov, and D. Klissurshi, J. Therm. Anal.
Calorim. 70, 393 (2002).47K. Matusita, T. Komatsu, and R. Yokota, J. Mater. Sci. 19, 291 (1984).48W. Lu, B. Yan, and W. Huang, J. Non-Cryst. Solids 351, 3320 (2005).49A. A. Abu-Sehly, S. N. Alamri, and A. A. Joraid, J. Alloys Compd. 476,
348 (2009).50A. A. Joraid, S. N. Alamri, and A. A. Abu-Sehly, J. Non-Cryst. Solids 354,
3380 (2008).51A. Calka and A. P. Radlinski, Mater. Sci. Eng. 97, 241 (1988).52K. Lu and J. T. Wang, Mater. Sci. Eng., A 133, 500 (1991).53T. Ozawa, J. Therm. Anal. 2, 301 (1970).54T. Ozawa, J. Therm. Anal. 31, 547 (1986).55T. Sun, H. Xiao, Y. Cheng, and H. Liu, Ceram. Int. 35, 1051 (2009).56M. J. Pascual, A. Guillet, and A. Duran, J. Power Sources 169, 40 (2007).57J. I. Golstein, D. E. Newbury, P. Echlin, D. C. Joy, A. D. Romig, Jr., C. E.
Lyman, C. Fiori, and E. Lifshin, “Scanning electron microscopy and x-ray
microanalysis,” in A Text for Biologists, Materials Scientists, andGeologists (Plenum Press, New York, 1992), p. 417.
043516-9 Lopes et al. J. Appl. Phys. 115, 043516 (2014)
[This article is copyrighted as indicated in the article. Reuse of AIP content is subject to the terms at: http://scitation.aip.org/termsconditions. Downloaded to ] IP: