Glass Transition as the Rheological Inverse of GelationH. Henning Winter*
Department of Chemical Engineering and Department of Polymer Science and Engineering, University of Massachusetts, Amherst,Massachusetts 01003, United States
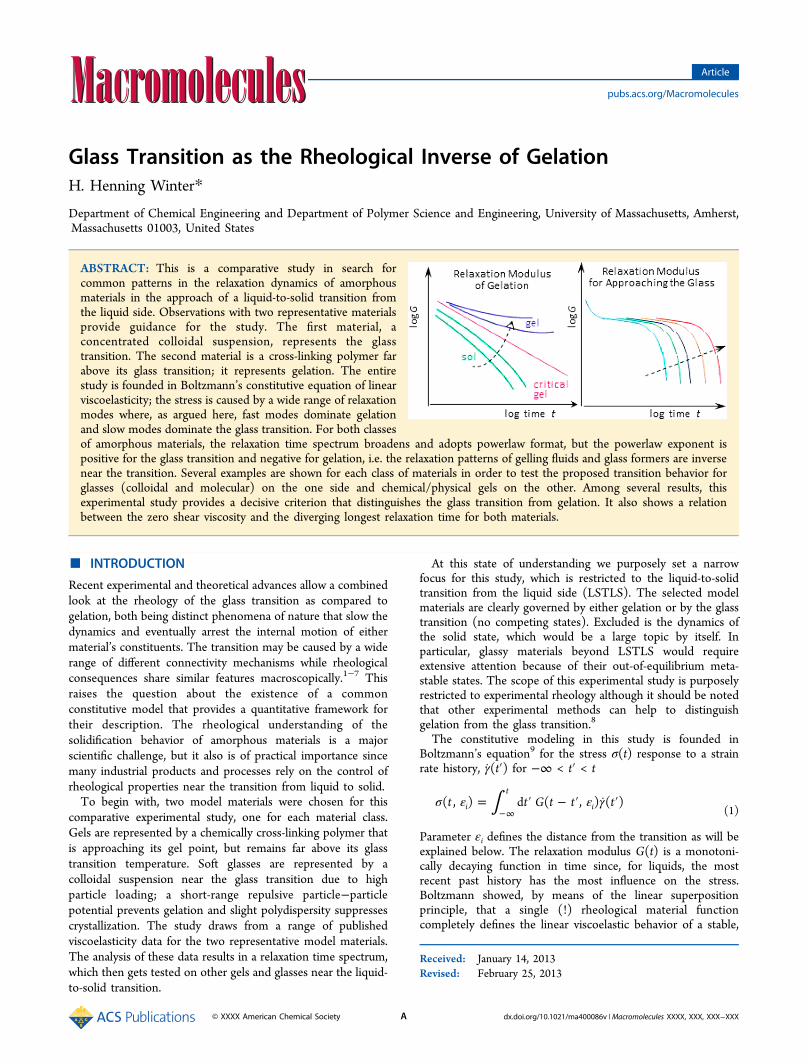
ABSTRACT: This is a comparative study in search forcommon patterns in the relaxation dynamics of amorphousmaterials in the approach of a liquid-to-solid transition fromthe liquid side. Observations with two representative materialsprovide guidance for the study. The first material, aconcentrated colloidal suspension, represents the glasstransition. The second material is a cross-linking polymer farabove its glass transition; it represents gelation. The entirestudy is founded in Boltzmann’s constitutive equation of linearviscoelasticity; the stress is caused by a wide range of relaxationmodes where, as argued here, fast modes dominate gelationand slow modes dominate the glass transition. For both classesof amorphous materials, the relaxation time spectrum broadens and adopts powerlaw format, but the powerlaw exponent ispositive for the glass transition and negative for gelation, i.e. the relaxation patterns of gelling fluids and glass formers are inversenear the transition. Several examples are shown for each class of materials in order to test the proposed transition behavior forglasses (colloidal and molecular) on the one side and chemical/physical gels on the other. Among several results, thisexperimental study provides a decisive criterion that distinguishes the glass transition from gelation. It also shows a relationbetween the zero shear viscosity and the diverging longest relaxation time for both materials.
■ INTRODUCTION
Recent experimental and theoretical advances allow a combinedlook at the rheology of the glass transition as compared togelation, both being distinct phenomena of nature that slow thedynamics and eventually arrest the internal motion of eithermaterial’s constituents. The transition may be caused by a widerange of different connectivity mechanisms while rheologicalconsequences share similar features macroscopically.1−7 Thisraises the question about the existence of a commonconstitutive model that provides a quantitative framework fortheir description. The rheological understanding of thesolidification behavior of amorphous materials is a majorscientific challenge, but it also is of practical importance sincemany industrial products and processes rely on the control ofrheological properties near the transition from liquid to solid.To begin with, two model materials were chosen for this
comparative experimental study, one for each material class.Gels are represented by a chemically cross-linking polymer thatis approaching its gel point, but remains far above its glasstransition temperature. Soft glasses are represented by acolloidal suspension near the glass transition due to highparticle loading; a short-range repulsive particle−particlepotential prevents gelation and slight polydispersity suppressescrystallization. The study draws from a range of publishedviscoelasticity data for the two representative model materials.The analysis of these data results in a relaxation time spectrum,which then gets tested on other gels and glasses near the liquid-to-solid transition.
At this state of understanding we purposely set a narrowfocus for this study, which is restricted to the liquid-to-solidtransition from the liquid side (LSTLS). The selected modelmaterials are clearly governed by either gelation or by the glasstransition (no competing states). Excluded is the dynamics ofthe solid state, which would be a large topic by itself. Inparticular, glassy materials beyond LSTLS would requireextensive attention because of their out-of-equilibrium meta-stable states. The scope of this experimental study is purposelyrestricted to experimental rheology although it should be notedthat other experimental methods can help to distinguishgelation from the glass transition.8
The constitutive modeling in this study is founded inBoltzmann’s equation9 for the stress σ(t) response to a strainrate history, γ(t′) for −∞ < t′ < t
∫σ ε ε γ= ′ − ′ ′−∞
t t G t t t( , ) d ( , ) ( )i
t
i (1)
Parameter εi defines the distance from the transition as will beexplained below. The relaxation modulus G(t) is a monotoni-cally decaying function in time since, for liquids, the mostrecent past history has the most influence on the stress.Boltzmann showed, by means of the linear superpositionprinciple, that a single (!) rheological material functioncompletely defines the linear viscoelastic behavior of a stable,
Received: January 14, 2013Revised: February 25, 2013
isochoric material in shear, extension, or any mixed flow,transient or steady. No other material function is needed(assuming constant density) beyond G(t). However, G(t) canbe expressed in other equivalent ways, for instance as weightedtime integral over all relaxation modes for τ ≤ τmax
∫ε ττ
τ ε= +
=
ττ−G t G H
G
( , )d
( , )e ,
with 0 for liquids
i e it
e
0
/max
(2)
Equation 2 defines the relaxation time spectrum H(τ). Theupper limit of the relaxation time spectrum, with a longestrelaxation time τmax, belongs to the largest connected materialregion that can still relax. In general, there is no preference forusing either H(τ) or G(t) to express the viscoelasticity of amaterial. This study, however, finds that H(τ) capturesexperimental LSTLS data in a simpler mathematical formatso that preference will be given to H(τ).The modulus and the relaxation time spectrum in
Boltzmann’s constitutive equation is written here as a functionof the distance from the transition, ε, with ε = 0 at thetransition point. Vastly different connectivity mechanisms ingels and glasses require an appropriate definition for theseparation parameter ε which naturally varies from material tomaterial. In the close vicinity of the chemical gel point of a cross-linking polymer, the separation parameter is defined as thedistance from the critical reaction conversion, ε = pc − p, withpc being the bond probability at the gel point. Less clear is thedefinition of ε for physical gels, which may connect with a widerange of different clustering mechanisms;10 ε needs to bereconsidered from case to case. Colloidal glass formers aresubject of a separation parameter ε = |ϕ − ϕc|/ϕc, for which thecritical volume fraction of particles, ϕc, varies with experimentalconditions11−14 because of trapped nonequilibrium conditionsof the sample structure, and it depends on particle size. Theactual value of ϕc for a specific experiment might be lower thantheory would predict.15 Colloidal dynamics will be compared tothe dynamics of temperature-dependent, molecular glass formersthat change their internal connectivity with ε = |T − Tg|/Tginvolving a glass transition temperature, Tg, that typicallydepends on the cooling rate in the approach of LSTLS.This study will proceed directly to the determination of linear
viscoelasticity for gelation and the glass transition in order tocompare the two phenomena. Following Boltzmann, all weneed is G(t,εi) or H (t,εi) of model gels and model glassymaterials at discrete, stable states ε1, ε2, ε3, .... near LSTLS. Thelongest relaxation time τmax(εi) diverges in the approach ofLSTLS, εi → 0. It will be shown that both material groups sharethe same powerlaw relaxation time spectrum,
τ ε ττ ε
τ τ= <⎛⎝⎜
⎞⎠⎟H H( , )
( ), fori
i
n
0max
max(3)
except that the exponent is positive (n ≥ 0) for the glasstransition and negative (−1 < n < 0) for gelation. In thisframework, gelation is viewed as the rheological inverse of theglass transition. This will be derived in the following and testedon several amorphous materials.Determination of the Relaxation Time Spectrum.
While many studies of LSTLS focus on the longest relaxationtime (which superficially looks quite similar for gelation and theglass transition), this study focuses on the broad distribution ofrelaxation times and the associated pattern since these express
the difference between gelation and the glass transition mostclearly. The relaxation time spectrum H(τ) is a macroscopicexpression of small-scale structural rearrangements in time.Relaxation processes at short τ refer to small-scale rearrange-ments in a test material. Correspondingly, long-time relaxationdepends on large-scale rearrangement processes of materialconstituents. H(τ) may adopt any functional shape dependingwhether short or long-time structural rearrangements dominatethe stress.G(t) and H(τ) can be effectively determined by measuring
dynamic moduli,
∫
∫
ω ττ
τ ωτωτ
ω ττ
τ ωτωτ
′ = ++
″ =+
τ
τ
G G H
G H
( )d
( )( )
1 ( );
( )d
( )( )
1 ( )
e0
2
2
0 2
max
max
(4)
in small-amplitude oscillatory shear (SAOS) and thenextracting H(τ) or G(t). This is the approach taken here.Equations 4 derive from eq 1 when inserting the SAOS shearrate.16 The data analysis in this study uses the parsimoniousmodeling approach, which attempts an unbiased fit function forH(τ) that optimally represents the data with the smallestparameter set. The discrete spectrum is then converted into acontinuous spectrum.17,18
Rheological complexity arises from variations in ε nearLSTLS and from the corresponding structural changes. Thetransient structure near LSTLS conflicts with Boltzmann’srequirement of a stable material structure during thecontributing strain rate history. Material stability is aprerequisite for eq 1 which would be invalid for time-dependentε(t).19 Because of this limitation, rheological experiments willhave to rely on iso-evolution conditions, i.e. stabilized samplesat constant distance from the transition, εi=const., or quasi-stable conditions for which ε-changes are negligibly smallduring the taking of a data point. Throughout this study, whenexpressing viscoelasticity in terms of G(t,εi) or H(t,εi), theseparation from LSTLS, ε, will not be treated as a variable butas a discrete, independent parameter that defines the state ofadvancement in gelation or the glass transition. Also, stress orstrain induced effects need to be avoided at this level ofunderstanding; this has been achieved by measuring the linearviscoelastic functions at sufficiently small strain.For linear viscoelastic characterization of samples with slowly
and time-resolved rheometry19 are suitable. Data points aredeemed acceptable as long as both mutation numbers,19
πω
πω
′ =′
∂ ′∂
″ =″
∂ ″∂
NG
Gt
NG
Gt
2;
2mu mu (5)
stay below a tolerable limit (typically N′mu < 0.1 while N″mu ≪N′mu) . SAOS is a spectroscopic technique which reaches quasi-stable condition in about one sampling period. This is why 2π/ω is chosen as reference time in the definition of the mutationnumbers. Time-resolved rheometry allows the study of amaterial’s response under slightly dynamic conditions.
Relaxation Time Spectrum of Gelation. In chemicalgelation, covalent bonds connect molecules into a highlybranched molecular structure with a molecular size distribution,which is still broad at intermediate reaction conversions nearLSTLS. A chemically cross-linking material is ideally suited forthe study of gelation as long as the bond probability can becontrolled chemically and the glass transition if way outside the
experimental region. The long levity of the chemical bonds isadvantageous since it provides stability for the rheologicalstudy. Endlinking poydimethylsiloxane has successfully servedas such a model material for rheological experiments, which ledto the discovery of the powerlaw relaxation time spectrum atthe gel point, p = pc
22−25
τ ε ττ
τ τ= > − < <⎛⎝⎜
⎞⎠⎟H H n( , ) , for with 1 0i
n
00
0(6)
For performing the rheological experiments, the cross-linkingreaction had either been stopped at discrete εi near the gelpoint or cross-linking was slowed down to maintain lowmutation number values. τ0 is a short relaxation time whichcharacterizes the structural building block of the gel.26 Thecorresponding dynamic moduli for the above powerlawspectrum with negative exponent, eq 6, can be expressedanalytically
ωπ τ ω
ωπ τ ω
ω τ
′ =−
″ =−
− < < < <
π π
− −
( ) ( )G
HG
H
n
( )( )
2 sin; ( )
( )
2 cos;
with 1 0 for 0 1/
n
n
n
n0 0
2
0 0
2
0 (7)
The loss tangent becomes frequency independent, tan δ = G″/G′ = constant. The normalized loss angle equals the powerlawexponent, n = −2δ/π.25Near the gel point (finite ε), the spectrum is cut off at the
largest relaxation time, H = 0 for τ > τmax. Below τmax, therelaxation time spectrum can be approximated as H = H0(τ/τmax)
n for τ > τ0. Friedrich et al.27 successfully used a truncatedpowerlaw spectrum to describe the relaxation near the chemicalgel point.Since its discovery in1985, the powerlaw spectrum at the gel
point has been found for a wide range of diverse chemical andphysical gels. Recent examples are studies by Morris et al.,28
Ghiringhelli et al.,21 Aliaghaie et al.,29 Aoki,30 Bonino et al.,31
Ng et al.,32 and Eberle et al.33
Instead of showing the 1985 data again, the viscoelasticgelation data of a polybutadiene (PB) of DeRosa et al.34,35 isanalyzed in Figures 1 and 2. The data are typical for thechemical gelation of a cross-linking polymer. Both, G′ and G″grow with increasing extent of cross-linking (increasing reactiontime, listed in Figure 2b). Three states are selected in Figure 1a,including the transition state which shows the powerlaw. Theresulting loss angle, Figure 1b, decays and assumes a constantvalue for most of the data, including the lowest frequencies.The normalized loss angle, 2δ/π, begins to tip down at thelowest frequencies when extending the measurements beyondthe gel point. The dynamic moduli for the approach of LSTLScan be merged into a master curve, Figure 2a, as already shownby Adolf and Martin.36 However, while G′ and G″ overlaynicely, the tan δ curves suggest that the shift is not reallysatisfying. For this cross-linking PB, the powerlaw dynamics isonly valid in a narrow window close to the chemical gel point.The magnitude of the horizontal shift (frequency shift) is ameasure of the slowdown of the dynamics, Figure 2b.Relaxation Time Spectrum of the Glass Transition.
Concentrated colloidal suspensions of particles characterized bya sufficiently steep mutual repulsion may be treated as the mostideal model system for studying near-glass dynamics.1,11,37−40
Two pronounced relaxation processes, known as α- and β-relaxation, each with its distinct pattern of relaxation times andstrengths, govern the near-glass dynamics of LSTLS. For
colloidal suspensions, the fast β relaxation is attributed to thelocalized motion of particles inside “cages” that are formed bytheir neighboring particles. The slow α relaxation expresses theopening of particle cages and the cooperative dynamics of theparticle surroundings. The dynamics becomes spatiallyheterogeneous due to the varying size of cooperatively movingparticle assemblies.41−45 The crossover from α to β regionsresults in a pronounced minimum of G″. This minimum shiftsto lower frequencies when the distance to the glass gets smalland is often used to estimate the divergence of the longestrelaxation time when it begins to diverge to values outside theexperimental range.The rheology of colloidal suspensions has been studied
extensively but very few complete data sets are available fordetermining G(t) or H(λ) in the approach of LSTLS, mostlyfrom the groups of Petekidis46 and Ballauff.47−51 For this studywe focus on Siebenburger‘s data51 because her particles are oftunable size, her data cover a wide frequency range, and hermeasurements are in close agreement with mode couplingtheory (MCT) predictions. Her thermosensitive colloidalsuspension is a model system for which tunability was achievedby coating spherical polystyrene particles (diameter ∼100 nm)with a cross-linked shell of thermosensitive poly-(Nisopropylacrylamide) (PNIPAM) and suspending the
Figure 1. Data of DeRosa et al.;34,35 dynamic moduli and loss angle δof chemical gelation at T = 28 °C of a polybutadiene (Mw = 18 100 g/mol; Mw/Mn = 1.03; % cis = 41; % trans = 52; % vinyl = 7.3; Tg = −92°C) with p-bis(dimethylsilyl) benzene as difunctional crossliker. (1a)G′(ω) (open symbols) and G″(ω) (filled symbols) of three selectedcross-linking states denoting the sol, the critical gel, and the gel. (1b)The normalized loss angle δ decreases at advancing reaction times696s, 796s, 894s, 944s, 993s, 1042s, 1091s, 1142s, 1196s, and 1245s,which correspond to increasing chemical conversions as shown byDeRosa et al.35 The gel point is reached after 1196s. The critical gelexpresses itself in parallel moduli (1a) and a flat 2δ/π (1b) at lowfrequencies. The property values at the gel point are n = −0.43 and S =9200 Pa s0.43.
Figure 2. Shifting attempt of the dynamic moduli of DeRosa et al.34,35
(a) All data of Figure 1b are shifted onto the earliest G′,G″ data(lowest moduli corresponding to highest 2δ/π curve of Figure 1b) inorder to show the relative growth of the relaxation times (b).
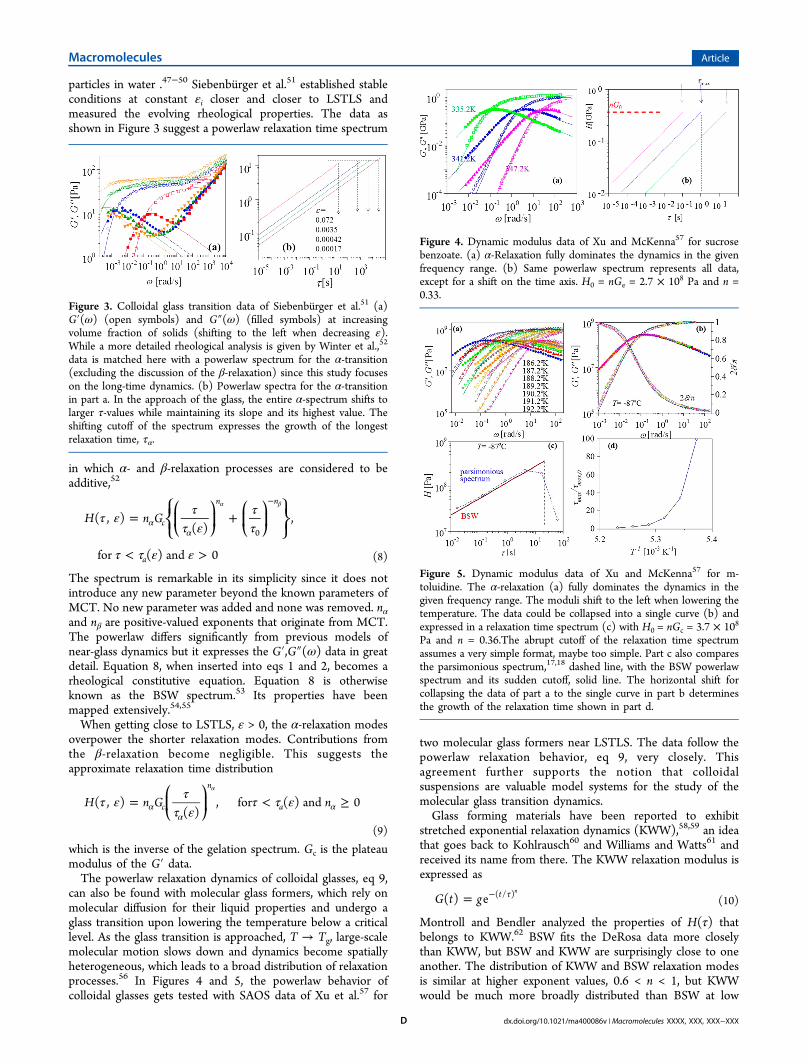
particles in water .47−50 Siebenburger et al.51 established stableconditions at constant εi closer and closer to LSTLS andmeasured the evolving rheological properties. The data asshown in Figure 3 suggest a powerlaw relaxation time spectrum
in which α- and β-relaxation processes are considered to beadditive,52
τ ε ττ ε
ττ
τ τ ε ε
= +
< >
αα
−α β
⎪ ⎪
⎪ ⎪⎧⎨⎩
⎛⎝⎜
⎞⎠⎟
⎛⎝⎜
⎞⎠⎟
⎫⎬⎭H n G( , )
( ),
for ( ) and 0
c
n n
a
0
(8)
The spectrum is remarkable in its simplicity since it does notintroduce any new parameter beyond the known parameters ofMCT. No new parameter was added and none was removed. nαand nβ are positive-valued exponents that originate from MCT.The powerlaw differs significantly from previous models ofnear-glass dynamics but it expresses the G′,G″(ω) data in greatdetail. Equation 8, when inserted into eqs 1 and 2, becomes arheological constitutive equation. Equation 8 is otherwiseknown as the BSW spectrum.53 Its properties have beenmapped extensively.54,55
When getting close to LSTLS, ε > 0, the α-relaxation modesoverpower the shorter relaxation modes. Contributions fromthe β-relaxation become negligible. This suggests theapproximate relaxation time distribution
τ ε ττ ε
τ τ ε= < ≥αα
α
α⎛⎝⎜
⎞⎠⎟H n G n( , )
( ), for ( ) and 0c
n
a
(9)
which is the inverse of the gelation spectrum. Gc is the plateaumodulus of the G′ data.The powerlaw relaxation dynamics of colloidal glasses, eq 9,
can also be found with molecular glass formers, which rely onmolecular diffusion for their liquid properties and undergo aglass transition upon lowering the temperature below a criticallevel. As the glass transition is approached, T → Tg, large-scalemolecular motion slows down and dynamics become spatiallyheterogeneous, which leads to a broad distribution of relaxationprocesses.56 In Figures 4 and 5, the powerlaw behavior ofcolloidal glasses gets tested with SAOS data of Xu et al.57 for
two molecular glass formers near LSTLS. The data follow thepowerlaw relaxation behavior, eq 9, very closely. Thisagreement further supports the notion that colloidalsuspensions are valuable model systems for the study of themolecular glass transition dynamics.Glass forming materials have been reported to exhibit
stretched exponential relaxation dynamics (KWW),58,59 an ideathat goes back to Kohlrausch60 and Williams and Watts61 andreceived its name from there. The KWW relaxation modulus isexpressed as
= τ−G t g( ) e t( / )n
(10)
Montroll and Bendler analyzed the properties of H(τ) thatbelongs to KWW.62 BSW fits the DeRosa data more closelythan KWW, but BSW and KWW are surprisingly close to oneanother. The distribution of KWW and BSW relaxation modesis similar at higher exponent values, 0.6 < n < 1, but KWWwould be much more broadly distributed than BSW at low
Figure 3. Colloidal glass transition data of Siebenburger et al.51 (a)G′(ω) (open symbols) and G″(ω) (filled symbols) at increasingvolume fraction of solids (shifting to the left when decreasing ε).While a more detailed rheological analysis is given by Winter et al.,52
data is matched here with a powerlaw spectrum for the α-transition(excluding the discussion of the β-relaxation) since this study focuseson the long-time dynamics. (b) Powerlaw spectra for the α-transitionin part a. In the approach of the glass, the entire α-spectrum shifts tolarger τ-values while maintaining its slope and its highest value. Theshifting cutoff of the spectrum expresses the growth of the longestrelaxation time, τα.
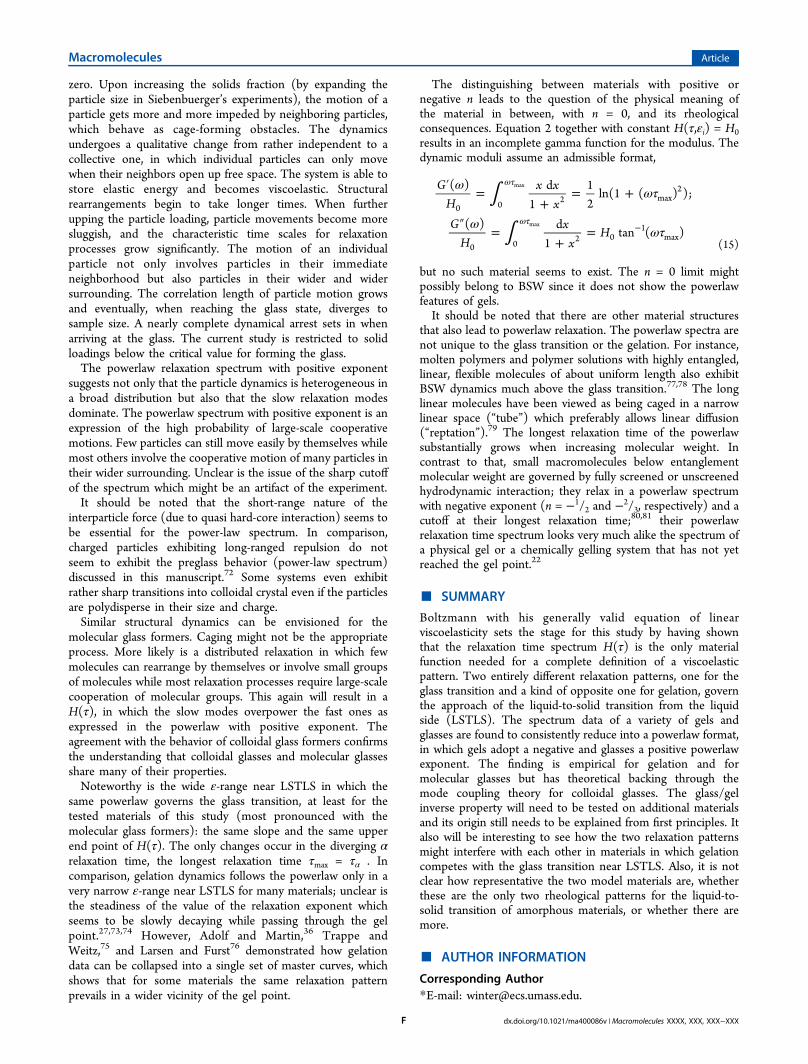
Figure 4. Dynamic modulus data of Xu and McKenna57 for sucrosebenzoate. (a) α-Relaxation fully dominates the dynamics in the givenfrequency range. (b) Same powerlaw spectrum represents all data,except for a shift on the time axis. H0 = nGe = 2.7 × 10⁸ Pa and n =0.33.
Figure 5. Dynamic modulus data of Xu and McKenna57 for m-toluidine. The α-relaxation (a) fully dominates the dynamics in thegiven frequency range. The moduli shift to the left when lowering thetemperature. The data could be collapsed into a single curve (b) andexpressed in a relaxation time spectrum (c) with H0 = nGc = 3.7 × 10⁸
Pa and n = 0.36.The abrupt cutoff of the relaxation time spectrumassumes a very simple format, maybe too simple. Part c also comparesthe parsimonious spectrum,17,18 dashed line, with the BSW powerlawspectrum and its sudden cutoff, solid line. The horizontal shift forcollapsing the data of part a to the single curve in part b determinesthe growth of the relaxation time shown in part d.
exponent values. The α-transition of DeRosa’s polymer isnarrower than expressed with KWW but probably not as sharpas shown with BSW and its sudden cutoff. Figure 5c addressesthe broadening of the cutoff by comparing the continuousrelaxation time spectrum as calculated with the parsimoniousmodel17,18 with BSW.53 The parsimonious H(τ) clearly showsthe powerlaw (discrete points on a straight line at about equaldistance between them) but then combines it with thebroadened cutoff.Divergence of Zero Shear Rate Viscosity. Knowledge of
the spectrum allows to calculate the whole range of linearviscoelastic material functions. An example is given here withthe longest relaxation time, τmax, and its relation to the zeroshear rate viscosity, η0. Both diverge in the approach of LSTLS.The known relaxation time spectrum makes it now possible toconnect these two material functions. The zero shear rateviscosity is defined as16
∫ ∫ ∫∫
η ττ
τ
τ τ
= = +
=
ττ
τ
∞ ∞−⎜ ⎟⎛
⎝⎞⎠t G t t G H
H
d ( ) dd
( )e
d ( )
et
0 0 0 0
/
0
max
max
(11)
When only using the dominant part of the relaxation timespectrum, having powerlaw format for gelation and the glasstransition, H=H0 (τ/τmax)
n, the above equation consolidates to
∫ τ ττ
τ ητ
=+
=+
τ ⎛⎝⎜
⎞⎠⎟H
Hn
Hn
d1
or1
n
00
max
0 max 0
max
0max
(12)
The ratio of viscosity and longest relaxation time turns out tobe constant in the approach of the transition from the liquidside. This is a meaningful result, which helps to connect withexisting knowledge about gels and glasses.The diverging viscosity in the approach of the gel point from
the liquid side has drawn early attention because of its dramaticappearance. In the close vicinity of the chemical gel point of across-linking polymer, the viscosity is predicted to follow apowerlaw,63
η ε≈ s0 (13)
with the distance from the critical reaction conversion, ε = pc-p,as independent variable.For the colloidal glass, the diverging relaxation time as
predicted by the mode coupling theory64,65 allows a predictionnow for the diverging zero shear rate viscosity:
η τ τ ε=+
=+
α
α
α
αα
γ−nn
Gn
nG
1 1( )c c0 max 0,
(14)
The characteristic relaxation times for the α- relaxation ispredicted to diverge in a powerlaw in the approach of the glass(for ε > 0), τα = τ0,α(ε)
−γ. The divergence of the longestrelaxation time and its relation to structural evolution has beenstudied extensively, see Marcotte et al.15 and references therein.
■ DISCUSSIONSmall amplitude oscillatory shear (SAOS) data are anexpression of the dynamics at different structural length scalesof gels and glasses in the approach of LSTLS. The glass/gelinverse relaxation property (Figure 6) shows the distinctdifference between the two material classes. The findings of thisstudy become plausible when focusing on the slowest mode(longest relaxation time) and its probability to contribute to the
stress, eq 1. For gels, the slowest relaxation mode is weakestwhile for glasses the slowest mode dominates as will bediscussed next.For gelation, the characteristic molecular size distribution is
assumed to be the main reason for the decaying H(τ), i.e. thenegative exponent of the powerlaw. The molecular weightdistribution broadens in the approach of LSTLS and assumespowerlaw format and a negative exponent.66,67 The majority ofthe molecules are still small when the material reaches the gelpoint and the stress is dominated by rearrangement of the smallmolecules. The largest molecular cluster diverges in size but hasthe lowest probability. On the basis of that information, thelongest mode can be expected to be weakest since thepercolating structure is barely connected. Fast relaxationprocesses of the low molecular weight fraction dominate therelaxation time spectrum. The resulting spectrum is a decayingfunction in τ; i.e., the exponent for eq 3 is negative.Branching is also known to lead to powerlaw relaxation
behavior. A gel-like spectrum is found for multibranchedpolymers which exhibit a broad powerlaw transition from theelastic behavior at intermediate frequencies to the terminalbehavior at low frequencies.70 The width of the powerlawregion of branched systems depends on temperature, i.e. notsatisfying the time−temperature superposition any more.Branching by itself is able to produce powerlaw dynamics asshown for the hypothetical case a polymer with monodisperse,self-similarly branched architecture;68,69 this power-law behav-ior results from the validity of the coarse-graining of the chainstructure according to the time scale and from the entropicnature of the stress. The powerlaw shape of H(τ) of actualgelling systems might be caused by both, the branchingdistribution and the powerlaw distribution of molecular sizes.Exploring this interrelation is outside the scope of the currentstudy.The study here concerns gels with sufficiently stable
connectivity once an internal bond was formed. This allowsthe longest relaxation time to fully diverge in the approach ofLSTLS. Extension of the study to systems with an upper limitfor the diverging τmax is considered in the future. The constraintfor the growth of longest relaxation time is important for theunderstanding of many physical gels10 and of chemical gelationwith reversible bond kinetics.71 The presence of an upperlimiting relaxation time is less apparent in the approach of theLSTLS but becomes important beyond the gel point where amore and more pronounced G″ minimum develops as anindication of τmax even if τmax might be outside the accessibleexperimental range. The dynamics of such gels in their “solidstate” is a large topic by itself and is not addressed here.For the approach of the colloidal glass transition, the
suspended particles can still move freely at low solids loadingand relaxation processes in the suspension decay quickly to
Figure 6. Glass transition spectrum as inverse of relaxation spectrumfor gelation.
zero. Upon increasing the solids fraction (by expanding theparticle size in Siebenbuerger’s experiments), the motion of aparticle gets more and more impeded by neighboring particles,which behave as cage-forming obstacles. The dynamicsundergoes a qualitative change from rather independent to acollective one, in which individual particles can only movewhen their neighbors open up free space. The system is able tostore elastic energy and becomes viscoelastic. Structuralrearrangements begin to take longer times. When furtherupping the particle loading, particle movements become moresluggish, and the characteristic time scales for relaxationprocesses grow significantly. The motion of an individualparticle not only involves particles in their immediateneighborhood but also particles in their wider and widersurrounding. The correlation length of particle motion growsand eventually, when reaching the glass state, diverges tosample size. A nearly complete dynamical arrest sets in whenarriving at the glass. The current study is restricted to solidloadings below the critical value for forming the glass.The powerlaw relaxation spectrum with positive exponent
suggests not only that the particle dynamics is heterogeneous ina broad distribution but also that the slow relaxation modesdominate. The powerlaw spectrum with positive exponent is anexpression of the high probability of large-scale cooperativemotions. Few particles can still move easily by themselves whilemost others involve the cooperative motion of many particles intheir wider surrounding. Unclear is the issue of the sharp cutoffof the spectrum which might be an artifact of the experiment.It should be noted that the short-range nature of the
interparticle force (due to quasi hard-core interaction) seems tobe essential for the power-law spectrum. In comparison,charged particles exhibiting long-ranged repulsion do notseem to exhibit the preglass behavior (power-law spectrum)discussed in this manuscript.72 Some systems even exhibitrather sharp transitions into colloidal crystal even if the particlesare polydisperse in their size and charge.Similar structural dynamics can be envisioned for the
molecular glass formers. Caging might not be the appropriateprocess. More likely is a distributed relaxation in which fewmolecules can rearrange by themselves or involve small groupsof molecules while most relaxation processes require large-scalecooperation of molecular groups. This again will result in aH(τ), in which the slow modes overpower the fast ones asexpressed in the powerlaw with positive exponent. Theagreement with the behavior of colloidal glass formers confirmsthe understanding that colloidal glasses and molecular glassesshare many of their properties.Noteworthy is the wide ε-range near LSTLS in which the
same powerlaw governs the glass transition, at least for thetested materials of this study (most pronounced with themolecular glass formers): the same slope and the same upperend point of H(τ). The only changes occur in the diverging αrelaxation time, the longest relaxation time τmax = τα . Incomparison, gelation dynamics follows the powerlaw only in avery narrow ε-range near LSTLS for many materials; unclear isthe steadiness of the value of the relaxation exponent whichseems to be slowly decaying while passing through the gelpoint.27,73,74 However, Adolf and Martin,36 Trappe andWeitz,75 and Larsen and Furst76 demonstrated how gelationdata can be collapsed into a single set of master curves, whichshows that for some materials the same relaxation patternprevails in a wider vicinity of the gel point.
The distinguishing between materials with positive ornegative n leads to the question of the physical meaning ofthe material in between, with n = 0, and its rheologicalconsequences. Equation 2 together with constant H(τ,εi) = H0results in an incomplete gamma function for the modulus. Thedynamic moduli assume an admissible format,
∫
∫
ω ωτ
ω ωτ
′ =+
= +
″ =+
=
ωτ
ωτ−
GH
x xx
GH
xx
H
( ) d1
12
ln(1 ( ) );
( ) d1
tan ( )
0 0 2 max2
0 0 2 01
max
max
max
(15)
but no such material seems to exist. The n = 0 limit mightpossibly belong to BSW since it does not show the powerlawfeatures of gels.It should be noted that there are other material structures
that also lead to powerlaw relaxation. The powerlaw spectra arenot unique to the glass transition or the gelation. For instance,molten polymers and polymer solutions with highly entangled,linear, flexible molecules of about uniform length also exhibitBSW dynamics much above the glass transition.77,78 The longlinear molecules have been viewed as being caged in a narrowlinear space (“tube”) which preferably allows linear diffusion(“reptation”).79 The longest relaxation time of the powerlawsubstantially grows when increasing molecular weight. Incontrast to that, small macromolecules below entanglementmolecular weight are governed by fully screened or unscreenedhydrodynamic interaction; they relax in a powerlaw spectrumwith negative exponent (n = −1/2 and −2/3, respectively) and acutoff at their longest relaxation time;80,81 their powerlawrelaxation time spectrum looks very much alike the spectrum ofa physical gel or a chemically gelling system that has not yetreached the gel point.22
■ SUMMARY
Boltzmann with his generally valid equation of linearviscoelasticity sets the stage for this study by having shownthat the relaxation time spectrum H(τ) is the only materialfunction needed for a complete definition of a viscoelasticpattern. Two entirely different relaxation patterns, one for theglass transition and a kind of opposite one for gelation, governthe approach of the liquid-to-solid transition from the liquidside (LSTLS). The spectrum data of a variety of gels andglasses are found to consistently reduce into a powerlaw format,in which gels adopt a negative and glasses a positive powerlawexponent. The finding is empirical for gelation and formolecular glasses but has theoretical backing through themode coupling theory for colloidal glasses. The glass/gelinverse property will need to be tested on additional materialsand its origin still needs to be explained from first principles. Italso will be interesting to see how the two relaxation patternsmight interfere with each other in materials in which gelationcompetes with the glass transition near LSTLS. Also, it is notclear how representative the two model materials are, whetherthese are the only two rheological patterns for the liquid-to-solid transition of amorphous materials, or whether there aremore.
NotesThe authors declare no competing financial interest.
■ ACKNOWLEDGMENTSH.H.W. gratefully acknowledges the support of the NSF whichallowed him to continue research while serving as a programdirector during the past three years. Acknowledgment is madeto the donors of the Petroleum Research Fund, administered bythe American Chemical Society, for partial support of thisresearch. Many thanks go to Miriam Siebenburger, MatthiasBallauff, and Matthias Fuchs for sharing their data and forintroducing me to colloidal dynamics, experimentally andtheoretically, to Ben Xu and Greg McKenna for sharing theirextensive modulus data, and to Jeffrey Morris, DimitrisVlassopoulos, and Hiroshi Watanabe for helpful discussions.All data analysis and plotting was done with the InteractiveRheology Information Software (IRIS).82
■ REFERENCES(1) Mason, T. G.; Weitz, D. A. Phys. Rev. Lett. 1995, 75, 2770−2773.(2) Parker, A.; Normand, V. Soft Matter 2010, 6, 4916−4919.(3) Larson, R. G. The Structure and Rheology of Complex Fluids.Oxford Univ Press: New York, 1999.(4) Zaccarelli, E.; Poon, W. C. K. Proc. Natl. Acad. Sci. U.S.A. 2009,106, 15203−15208.(5) Jabbari-Farouji, S.; Wegdam, G. H.; Bonn, D. Phys. Rev. Lett.2007, 99, 065701.(6) Eckert, T.; Bartsch, E. Phys. Rev. Lett. 2002, 89, 125701.(7) Willenbacher, N.; Vesaratchanon, J. S.; Thorwarth, O.; Bartsch, E.Soft Matter 2011, 7, 5777−88.(8) Shibayama, M.; Ozeki, S.; Norisuye, T. Polymer 2005, 46, 2381−88.(9) Boltzmann, L. Sitzungsber. Kaiserl. Akad. Wiss. Wien, Math.-Naturwiss. 1874, 70, 275−306.(10) te Nijenhuis, K. Adv. Polym. Sci. 1997, 130, 1−267.(11) Hunter, G. L.; Weeks, E. R. Rep. Prog. Phys. 2012, 75, 066501.(12) Cheng, Z.; Zhu, J.; Chaikin, P. M.; Phan, S. E.; Russel, W. B.Phys. Rev. E 2002, 65, 041405.(13) Torquato, S.; Truskett, T. M.; Debenedetti, P. G. Phys. Rev. Lett.2000, 84, 2064.(14) Bernal, J. D. Proc. R. Soc. London A 1964, 280, 299.(15) Marcotte, E.; Stillinger, F. H.; Torquato, S. J. Chem. Phys. 2013,138, 12A508.(16) Ferry, J. D. Viscoelastic Properties of Polymers, 3rd. ed.; Wiley:New York, 1980.(17) Baumgartel, M.; Winter, H. H. Rheol. Acta 1989, 28, 511−519.(18) Baumgartel, M.; Winter, H. H. J Non-Newtonian Fluid Mech.1992, 44, 15−36.(19) Mours, M.; Winter, H. H. Rheol. Acta 1994, 33, 385−397.(20) Holly, E. E.; Venkataraman, S. K.; Chambon, F.; Winter, H. H. JNon-Newtonian Fluid Mech. 1988, 27, 17−26.(21) Ghiringhelli, E.; Roux, D.; Bleses, D.; Galliard, H.; Caton, F.Rheol. Acta 2012, 51, 413−420.(22) Chambon, F.; Winter, H. H. Polym. Bull. 1985, 13, 499−503.(23) Winter, H. H., Chambon, F. Rheology of crosslinking polymers atthe gel point; Proceedings of the Bi-annual Meeting; Polymer NetworksGroup: Elsinore, Denmark, 1986.(24) Winter, H. H.; Chambon, F. J. Rheol. 1986, 30, 367−382.(25) Chambon, F.; Winter, H. H. J. Rheol. 1987, 31, 683−697.(26) Izuka, A.; Winter, H. H.; Hashimoto, T. Macromol 1994, 27,6883−6888.(27) Friedrich, C.; Heymann, L.; Berger, H. R. Rheol. Acta 1989, 28,535−539.(28) Morris, E. R.; Nishinari, K.; Marguerite, R. Food Hydrocolloids2012, 28, 373−411.(29) Aliaghaie, M.; Mirzadeh, H.; Dashtimoghadam, E.; Taranejoo, S.Soft Matter 2012, 8, 3128−3137.
(30) Aoki, Y. Rheol. Acta 2011, 50, 787−793.(31) Bonino, C. A.; Samorezov, J. E.; Jeon, O.; Alsberg, E.; Khan, S.A. Soft Matter 2011, 7, 11510−11517.(32) Ng, T. S. K.; McKinley, G. H.; Ewoldt, R. H. J. Rheol. 2011, 55,627−654.(33) Eberle, A. P. R.; Wagner, N. J.; Castaneda-Priego, R. Phys. Rev.Lett. 2011, 106, 105704.(34) DeRosa, M. E.; Winter, H. H. Rheol. Acta 1994, 33, 220−237.(35) DeRosa, M. E.; Mours, M.; Winter, H. H. Polym. Gels Networks1997, 5, 69−94.(36) Adolf, D.; Martin, J. E. Macromol 1990, 23, 3700−3704.(37) van Megen, W.; Pusey, P. N. Phys Rev A 1991, 43, 5429.(38) Sciortino, F.; Tartaglia, P. Adv. Phys. 2005, 54, 471.(39) Pusey, P. N. J. Phys.: Condens. Matter 2008, 20, 494202.(40) Pham, K. N.; Petekidis, G.; Vlassopoulos, D.; Egelhaaf, S. U.;Poon, W. C. K.; Pusey, P. N. J. Rheol. 2008, 52, 649−676.(41) Habdas, P.; Weeks, E. R. Curr. Opin. Colloid Interface Sci. 2002,7, 196−203.(42) Prasad, V.; Semwogerere, D.; Weeks, E. R. J. Phys: CondensMatter 2007, 19, 113102.(43) Narumi, T.; Franklin, S. V.; Desmond, K. W.; Tokuyama, M.;Weeks, E. R. Soft Matter 2011, 7, 1472.(44) Ballesta, P.; Duri, A.; Cipelletti, L. Nature Phys. 2008, 4, 550.(45) Sessoms, D. A.; Bischofberger, I.; Cipelletti, L.; Trappe, V.Philos. Trans. R. Soc. A 2009, 367, 5013.(46) Koumakis, N.; Pamvouxoglou, A.; Poulosa, A. S.; Petekidis, G.Soft Matter 2012, 8, 4271−82.(47) Crassous, J. J.; Siebenburger, M.; Ballauff, M.; Drechsler, M.;Hajnal, D.; Henrich, O.; Fuchs, M. J. Chem. Phys. 2006, 125, 204906.(48) Crassous, J. J.; Ballauff, M.; Drechsler, M.; Schmidt, J.; Talmon,Y. Langmuir 2006, 22, 2403.(49) Crassous, J. J.; Siebenburger, M.; Ballauff, M.; Drechsler, M.;Hajnal, D.; Henrich, O.; Fuchs, M. J. Chem. Phys. 2008, 128, 204902.(50) Crassous, J. J.; Wittemann, A.; Siebenburger, M.; Schrinner, M.;Drechsler, M.; Ballauff, M. Colloid Polym. Sci. 2008, 286, 805.(51) Siebenburger, M.; Fuchs, M.; Winter, H. H.; Ballauff, M. J.Rheol. 2009, 53, 707−720.(52) Winter, H. H.; Siebenburger, M.; Hajnal, D.; Henrich, O.;Fuchs, M.; Ballauff, M. Rheol. Acta 2009, 48, 747−753.(53) Baumgartel, M.; Schausberger, A.; Winter, H. H. Rheol. Acta1990, 29, 400−408.(54) Carri, G.; Winter, H. H. Rheol. Acta 1997, 36, 330−344.(55) Friedrich, C.; Waizenegger, F.; Winter, H. H. Rheol. Acta 2007,47 (8), 909−916.(56) Ediger, M. Annu. Rev. Phys. Chem. 2000, 51, 99−128.(57) Xu, B.; McKenna, G. B. J. Chem. Phys. 2011, 134, 124902−7.(58) Berry, G. C.; Plazek, D. J. Rheol. Acta 1997, 36, 320−329.(59) Ngai, K. L.; Plazek, D. J.; Rendell, R. W. Rheol. Acta 1997, 36,307−319.(60) Kohlrausch, R. H. A. Poggendorff 1854, 91 (56−82), 179−213.(61) Williams, G.; Watts, D. C. Trans Faraday Soc 1970, 66, 80−85.(62) Montroll, E. W.; Bendler, T. J. J. Stat. Phys. 1984, 34, 129−162.(63) Stauffer, D.; Coniglio, A.; Adam, A. Adv. Polym. Sci. 1982, 44,103.(64) Gotze, W. In Liquids, Freezing and Glass Transition, Hansen, J.P., Levesque, D., Zinn-Justin, J.; Eds.; Session LI of Les HouchesSummer Schools of Theoretical Physics; North-Holland: Amsterdam,1991; Vol. 287.(65) Gotze, W.; Sjogren, L. Rep. Prog. Phys. 1992, 55, 241.(66) Schosseler, S.; Leibler, L. Phys. Lett 1984, 45, 501−507.(67) Martin, J. E.; Adolf, D.; Wilcoxon, J. P. Phys. Rev. Lett. 1988, 61,2620−2623.(68) Cates, M. E. Phys. Rev. Lett. 1984, 53, 926−929.(69) Muthukumar, M. J. Chem. Phys. 1985, 83, 3161−3168.(70) Robertson, C. G.; Garcia-Franco, C. A.; Srinivas, S. J. Polym. Sci.,Part B: Polym. Phys. 2004, 42, 1671−1684.(71) Wang, M., Roth, M., Winter, H. H., Auernhammer, G. K.Mechanical properties and structure in precipitated colloidal silica; XVIthInt Congr Rheology, Book Abstr., 2012; p169
(72) Fagan, M. E.; Zukoski, C. F. J. Rheol. 1997, 41, 373−397.(73) Mours, M.; Winter, H. H. Macromol 1996, 29, 7221−7229.(74) Winter, H. H.; Mours, M. Adv. Polym. Sci. 1997, 134, 165−234.(75) Trappe, V.; Weitz, D. A. Phys. Rev. Lett. 2000, 85, 449−452.(76) Larsen, T. H.; Furst, E. M. Phys. Rev. Lett. 2008, 100, 146001.(77) Abdel-Goad, M.; Pyckhout-Hintzen, W.; Kahle, S.; Allgaier, J.;Richter, D.; Fetters, L. J. Macromolecules 2004, 37, 8135−8144.(78) Baumgartel, M.; DeRosa, M. E.; Machado, J.; Masse, M.; Winter,H. H. Rheol. Acta 1992, 31, 75−82.(79) Doi, M., Edwards, S. F. The Theory of Polymer Dynamics; OxfordU Press: Oxford, U.K., 1988.(80) Rouse, P. E. J. Chem. Phys. 1953, 21, 1272−1280.(81) Zimm, B. H. J. Chem. Phys. 1956, 24, 269−278.(82) Winter, H. H.; Mours, M. Rheol. Acta 2006, 45, 331−338.