GLAST LAT Project CAL Peer Design Review, Mar 17-18, 2003 O. Ferreira CNRS/IN2P3-LLR Ecole Polytechnique GLAST Large Area GLAST Large Area Telescope Telescope Calorimeter Subsystem Gamma-ray Large Gamma-ray Large Area Space Area Space Telescope Telescope 6.1 Mechanical Design and Analysis Oscar Ferreira L.L.R. Ecole Polytechnique Calorimeter IN2P3 Project Manager [email protected]33–1–69–33–31–87
Transcript
GLAST LAT Project CAL Peer Design Review, Mar 17-18, 2003
O. Ferreira
CNRS/IN2P3-LLREcole Polytechnique
GLAST Large Area TelescopeGLAST Large Area TelescopeCalorimeter Subsystem
Gamma-ray Large Gamma-ray Large Area Space Area Space TelescopeTelescope
6.1 Mechanical Design and Analysis
Oscar FerreiraL.L.R. Ecole PolytechniqueCalorimeter IN2P3 Project Manager
Yet Secure Them Under Launch Loads– Accommodate Room and Provide Support for AFEE Boards With
Efficient Shielding and Yet Minimize Gaps Between Module
GLAST LAT Project CAL Peer Design Review, Mar 17-18, 2003
O. Ferreira 6.1-4CNRS/IN2P3-LLR
Ecole Polytechnique
PEM Mechanical DesignPEM Mechanical Design
GLAST LAT Project CAL Peer Design Review, Mar 17-18, 2003
O. Ferreira 6.1-5CNRS/IN2P3-LLR
Ecole Polytechnique
Design Concept – Composite structureDesign Concept – Composite structure One Stiff, Dimensionally Precise Composite Structure With Individual Cells for the
CsI Logs (96 Cells Per Module)
Titanium Inserts on the Sides to Allow Attachment of the Mechanical Parts– The Composite Structure Carries the Loads– It Defines the Overall Dimensions of the Cal Module– Each CDE Is Independent
The Base Plate Interfaces the CAL Module With the Grid through the 36 Tabs on Its Perimeter. The Friction Joint Contributes to the Stiffness of the Grid by Closing its Bays. The Plate is Attached to the Titanium Alloy Inserts Embedded in the Base of the Composite Structure.
The Top Frame is Mounted on the Top of the Composite Structure. It Allows the Attachment of the Side Plates but also Provides Material to Connect the Lifting Fixture on the CAL Module.
• 2618A T851 Aluminum Alloy• Total Mass 3.19 Kg• Helical Coils in All the Threads
• 2618A T851 Aluminum Alloy• Total Mass 0.63 Kg
GLAST LAT Project CAL Peer Design Review, Mar 17-18, 2003
The Closeout Plates Close the Cells, Preloading the Bumper Frame. They Also Provide the Support and EMI Shield for the AFEE Boards. They are Attached to the Lateral Inserts of the Composite Structure, Base Plate and Top Frame, Improving the Shear Strength of the CAL Modules.
The Side Panels are Thin Aluminum Plates that Close the Cal Module to Protect the Electronic Boards and Provide EMI Shielding. They Are Attached to the Lateral Inserts and the Other Aluminum Parts.
• 2618A T851 Aluminum Alloy• Close-Out Plate Mass: 0.33 Kg• Side Panel Mass: 0.15 Kg• Helical Coils in All the Threads• Corners of Close-Out Plates Fastened
Together to Improve Stiffness
GLAST LAT Project CAL Peer Design Review, Mar 17-18, 2003
O. Ferreira 6.1-10CNRS/IN2P3-LLR
Ecole Polytechnique
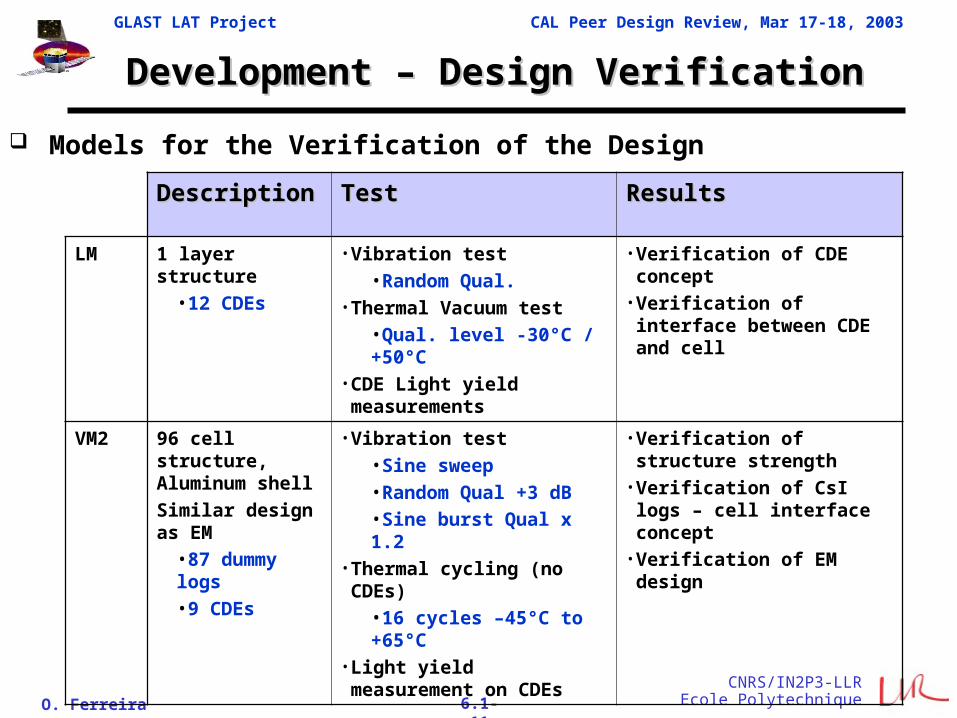
Development – Design Concept Development – Design Concept
Verification of the Concept: Main Prototypes and Models
Assembly of VM2 for Vibration Test Thermal Test of VM2
Size of Dummy Logs and +85°C to get Equivalent Load as +60°C with CsI Logs (Higher CTE)
Test Report: LAT-TD-00850-02
GLAST LAT Project CAL Peer Design Review, Mar 17-18, 2003
O. Ferreira 6.1-15CNRS/IN2P3-LLR
Ecole Polytechnique
Development – VM2 Vibration testDevelopment – VM2 Vibration test
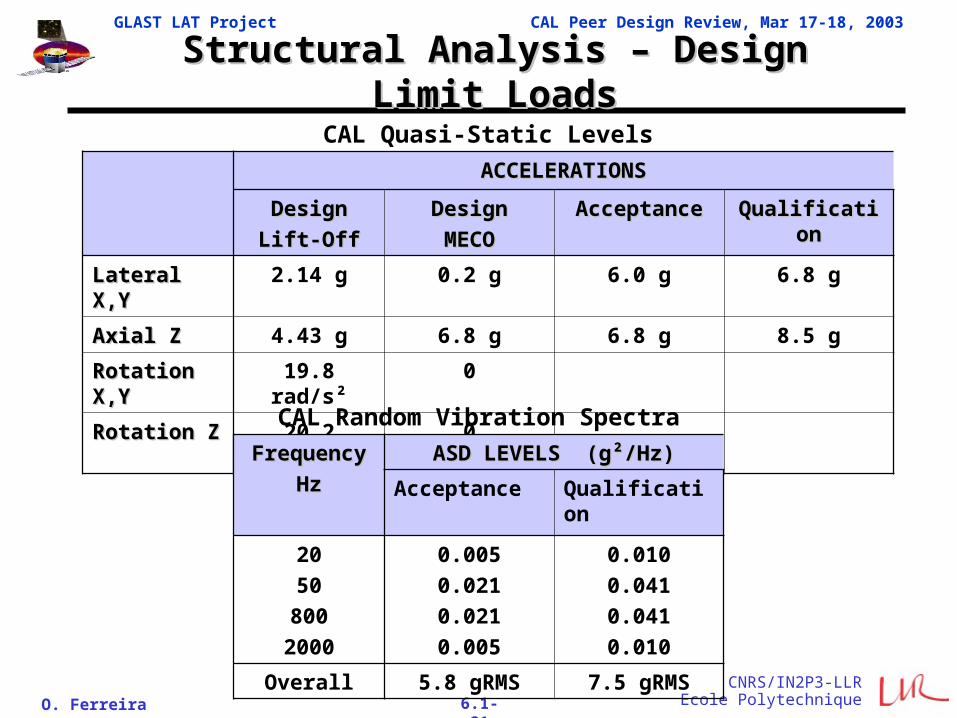
FrequencyFrequency
HzHz
ASD LEVELS (g²/Hz)ASD LEVELS (g²/Hz)
VM2 Levels Qualification
20
50
800
2000
0.012
0.005
0.005
0.012
0.010
0.041
0.041
0.010
Overall 8.2 gRMS 7.5 gRMSVM2 RANDOM VIBRATION TESTVM2 RANDOM VIBRATION TEST
Accelerometer Position Displacement (mm RMS)
1 – Dummy Log 2- 6 0,269
2 - CDE 4-7 0,277
3 - Dummy Log 3-8 0,266
4 -Close-Out Plate 1 0,257
6 - Dummy Circuit Board 0,251
7 - X Side Panel Center 0,250
8 - X Side Panel Top 0,240
9 - Y Side Panel Center 0,234
X-Axis Sine Sweep / CDE in Cell 1-3Evolution of the Signature
10
1
10-1
10-2
102 103
Frequency in Hz
Acceleratio
n in
g
Fundamental FrequenciesX and Y Axis: 180 HzZ Axis: 220 Hz
Vibration Test Report: SOPEMEA - LD31572
GLAST LAT Project CAL Peer Design Review, Mar 17-18, 2003
O. Ferreira 6.1-16CNRS/IN2P3-LLR
Ecole Polytechnique
Development – VM2 Thermal TestDevelopment – VM2 Thermal Test
VM2 Model Has Gone Through 43 Thermal Cycles Between –45°C to +85°C, at Atmospheric Pressure (16h per Cycle)
– Aluminum Logs Have Been Used Instead of CsI. The Max Temperature Has Been Increased to 85°C to Compensate for the Lower CTE
Strain Measurements Have Been Made on the Composite Structure During 9 Cycles: 13 Points on the Top and Sides of the Structure
– The Strain Levels Have Not Changed During the Thermal Cycles
Strain Measurements on VM2 during thermal tests
STRESS MEASUREMENTSSTRESS MEASUREMENTS
PositionPosition Stress in MPa
Top face of structure 50
Vertical cell wall 20
Insert X side 33
Insert Y side 34
Test report: BUREAU VERITAS - NT 049/VLM/LPA
GLAST LAT Project CAL Peer Design Review, Mar 17-18, 2003
O. Ferreira 6.1-17CNRS/IN2P3-LLR
Ecole Polytechnique
Development – Verification of the InsertsDevelopment – Verification of the Inserts
The Design of the Inserts Has Been Verified by Test and Analysis
Test Coupons
– Base, Top and Lateral Inserts Embedded in 80 mm² Composite Plates, Same Material and Lay-up as Composite Structure, Same Cure Procedure as EM (Oven 135°C)
Test
– Pull Test, Bending and Torsion: Min 5 Coupons per Insert Type and per Test Type
– Pull Test and Bending Test on Lateral Inserts After 50 Thermal Cycles, -40°C to +60°C, With RH 80%
Pull TestBending Test Torsion Test
GLAST LAT Project CAL Peer Design Review, Mar 17-18, 2003
O. Ferreira 6.1-18CNRS/IN2P3-LLR
Ecole Polytechnique
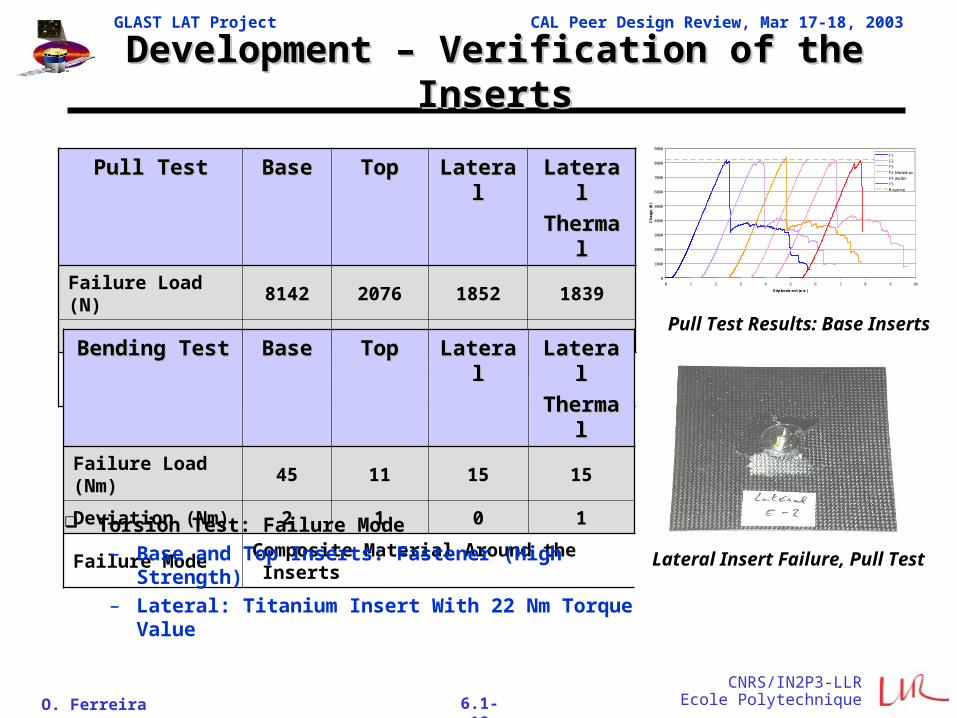
Development – Verification of the InsertsDevelopment – Verification of the Inserts
Pull TestPull Test BaseBase TopTop LateralLateral LateralLateral
ThermalThermal
Failure Load (N) 8142 2076 1852 1839
Deviation (N) 159 58 48 52
Failure Mode Composite Material Around the Inserts
Bending TestBending Test BaseBase TopTop LateralLateral LateralLateral
ThermalThermal
Failure Load (Nm) 45 11 15 15
Deviation (Nm) 2 1 0 1
Failure Mode Composite Material Around the Inserts
Torsion Test: Failure Mode– Base and Top Inserts: Fastener (High Strength)– Lateral: Titanium Insert With 22 Nm Torque Value
Pull Test Results: Base Inserts
Lateral Insert Failure, Pull Test
0
1000
2000
3000
4000
5000
6000
7000
8000
9000
0 1 2 3 4 5 6 7 8 9 10
Déplacement (mm)
Ch
arg
e (
N)
F1
F2
F3
F4 Interrompu
F4 reprise
F5
Moyenne
GLAST LAT Project CAL Peer Design Review, Mar 17-18, 2003
O. Ferreira 6.1-19CNRS/IN2P3-LLR
Ecole Polytechnique
Development – ConclusionDevelopment – Conclusion
The Design of All the Critical Parameters of the CAL Mechanical Structure Ave Been Tested With Levels Higher Than Qualification
All the Tests Have Been Successfully Passed
– No Light Yield Evolution on the 12 CDEs Has Been Noticed
– No Structure Failure Has Been Seen After More Than 40 Thermal Cycles With Temperature Range Greater Than Survival
– No Structure Failure Has Been Noticed After Random Vibration and Quasi-static Loading With Levels Higher Than Qualification
– The First Measured Natural Frequency Is Above 150 Hz
– All Displacement Measured on Logs and Structure Are Less Than 0.3 mm Under Quasi-static Loading
– All RMS Displacements Are Less Than 0.32 mm
– The Inserts Have Been Intensively Tested and Show Comfortable Safety Margins to Failure
GLAST LAT Project CAL Peer Design Review, Mar 17-18, 2003
Fundamental Frequency Above 100 Hz to Avoid Any Coupling with the Grid
Min Margin of Safety = 2, For Composite Structure.
Max Allowed Displacement for CAL Box: 0.5 mm Under Quasi-Static Loads to Avoid Any Interference with the Grid Walls
Max Relative Displacement Between the CDEs and Close-Out Plates: 0.3 mm to Avoid Any Contact Between the Pins of the Photodiodes and the Aluminum Plates
Max Allowed Deflection of the PCBs: 0.25 mm Between Attachment Points
GLAST LAT Project CAL Peer Design Review, Mar 17-18, 2003
• Grid Interface Loading on CAL Tabs due to Limit Loads• Grid Interface Loading on CAL Tabs due to Out-of-Plane Grid
Distortion• TEM/TPS Interface Loading on CAL Base Plate
GLAST LAT Project CAL Peer Design Review, Mar 17-18, 2003
O. Ferreira 6.1-24CNRS/IN2P3-LLR
Ecole Polytechnique
Mechanical FEA Model DescriptionMechanical FEA Model Description
The FEA Models of the CAL Module Have Been Built with SAMCEF V8.1 and V9 from SAMTECH. Different Models Have Been Developed to Better Fit the Analysis Needs. All Models are Correlated.
– Model 1: CDEs are Modeled as Structural Mass
• Allows the Verification of the Stiffness of the Mechanical Structure without Contribution of the Crystals
• Not Suited for Modal Analysis Because No Coupling Between the Logs and the Structure
– Model 2: CDEs are Modeled as Beam Elements Connected to the Composite Structure and Closeout Plates by Linear Spring Elements
• All the Connections Between the Components Have Been Included in the Model to Have Direct Information on the Reaction Loads on the Inserts and All the Fasteners
– Model 3: Light Version of Model 2 to Perform a Modal Analysis
– Local Detailed Model to Simulate the CDEs Inside the Cells and the Contribution of the Elastomeric Parts
– Local Detailed Model to Verify the Strength of the Inserts
Additional Modeling Has Been Performed to Address Interface Aspects
GLAST LAT Project CAL Peer Design Review, Mar 17-18, 2003
O. Ferreira 6.1-25CNRS/IN2P3-LLR
Ecole Polytechnique
Mechanical FEA ModelingMechanical FEA Modeling
Compression TestSilicone CordsBumper Frames
Local Cell ModelDetailed ModelSolid Elements
Local Cell ModelSimplified
Beam, Springs
Simplified CDEModel
Model 1Detailed ModelCDEs as Mass
Model 2Detailed ModelCDEs as Beams
Model 3Intermediate
CDEs as Beams
Quasi-StaticThermo-Mech.
Analysis
ModalAnalysis
Quasi-StaticThermo-Mech.
Analysis
Insert TestingPull, Bending,
Torsion
Insert ModelDetailed ModelSolid Elements
Static Analysis
CompositeStructure
Verification
InsertVerification
VerificationReaction
Loads
NaturalFrequencies
Correlation
Correlation
Correlation
Correlation
GLAST LAT Project CAL Peer Design Review, Mar 17-18, 2003
O. Ferreira 6.1-26CNRS/IN2P3-LLR
Ecole Polytechnique
Mechanical FEA ModelingMechanical FEA Modeling
ComponentComponent ReferenceReference MaterialMaterial FE ElementFE Element
Composite
StructureLAT-DS-00973
T300 1K HS Carbon
M76 Epoxy ResinThin Laminate Shell Type 56
Base Plate LAT-DS-00919 2618A T851 Aluminum Solid Type 11
Top Frame LAT-DS-00917 2618A T851 Aluminum Solid Type 11
Load caseLoad case Boundary conditionsBoundary conditions
• +30 °C Temperature Increase• -50 °C Temperature Reduction
TZ=0 For the Nodes on the Lower Face ff the Tabs
TX=0 For Y Symmetry Plane
TY=0 For X Symmetry Plane
Tsai Margin of Safety for the CompositeStructure 2.9 Min (Top of the Structure)
T-50 °C
Contraction of the CsI Logs Inside theComposite Cells
T-50 °C
GLAST LAT Project CAL Peer Design Review, Mar 17-18, 2003
O. Ferreira 6.1-33CNRS/IN2P3-LLR
Ecole Polytechnique
Buckling AnalysisBuckling Analysis
The Buckling of the Structure is Prevented by the Presence of the CsI Logs Inside the Cells. Still, the Composite Structure Alone Provides Enough Safety Margin
A Local Simplified Model Has Been Developed for the Buckling Analysis of the Composite Structure. Analysis Will Be Verified on the Full Model
– 1 Layer of 12 Cells, Model Includes Only the Composite Structure– Assumption of a Uniform Loading Has Been Made, Resulting From the
Weight of 7 Layers of CsI Logs Under Qualification Level Accelerations– The Layer is Supported where X and Y Horizontal Walls Intersect– The Analysis is Limited to Linear Buckling, Assuming Perfect Geometry
MODESMODES BUCKLING FACTORSBUCKLING FACTORS
Compression Shear
1 15.8 16.5
2 21.8 -16.5
The First Buckling Mode (Compression) is Global. All the Others are Local Buckling Modes of the Inner Vertical Walls
GLAST LAT Project CAL Peer Design Review, Mar 17-18, 2003
Model 2 is Being Simplified to Reduce CPU Time Required to Complete the Analysis– Reduction of the Number of Nodes– Increase of the Mesh Size
The Analysis Will Include Calculation of the Natural Frequencies in the 0 - 2000hz Range with Test-Like Configuration for Correlation with the EM Vibration Test Results
GLAST LAT Project CAL Peer Design Review, Mar 17-18, 2003
The Reaction Loads on the Inserts Have Been Recovered from the CAL Structural Analysis. They Have Been Applied on the Local Model of the Lateral Inserts, which are the More Critical Ones. The Strength of the Base Inserts is Much Higher (8000N) and the Loads on the Top Inserts are Lower.
To Reduce the Load Cases (10 Inserts Per Side, 4 Static Loads, 2 Thermal Loads), the Analysis Has Been Made for the Insert with the Max Bending Load and Max Shear Load.
Tsai Margins of Safety: 4.3 minCombined Loads 7.5g X,Y – 8.5g Z
Tsai Margins of Safety: 0.69, MinT= 65°C (Survival 50°C)
Static Loads Thermal Loads
GLAST LAT Project CAL Peer Design Review, Mar 17-18, 2003
O. Ferreira 6.1-37CNRS/IN2P3-LLR
Ecole Polytechnique
Interface Loads Analysis Methodology and ResultsInterface Loads Analysis Methodology and Results
Grid Interface Loading on CAL Tabs due to Limit Loads – Load Case for Analysis
– Hand Calculations• Bending Stress, Tensile Stress and Shear Stress
Calculated to Determine the Von Mises Stress• Factor of Safety = 1.25 (Yield) and 1.40 (Ultimate)• Margins of Safety = 0.16 (Yield) and 0.36 (Ultimate)
CAL Unit in N & m Unit in lbs & in
Tabs LC1 LC2 LC3 LC1 LC2 LC3 Comments
F(x) 4373 1140 -3302 983 256 -742 Across tab in plane of plate
F(y) 206 2994 1414 46 673 318 Along tab
F(z) -195 -11 654 -44 -3 147 Out of plane of plate
M(x) 1.39 -0.05 -6.09 12.34 -0.43 -53.85 Around x-axis
M(y) 0.45 -1.28 0.22 3.94 -11.32 1.93 Around y-axis
M(z) 20.98 4.58 -14.86 185.65 40.56 -131.49 Around z-axisNotes: Interface loads are for CAL tab thickness of 7 mm
GLAST LAT Project CAL Peer Design Review, Mar 17-18, 2003
O. Ferreira 6.1-38CNRS/IN2P3-LLR
Ecole Polytechnique
Interface Loads Analysis Methodology and ResultsInterface Loads Analysis Methodology and Results
Grid Interface Loading on CAL Tabs due to Out-of-Plane Grid Distortion
– Load Case for Analysis
• Interface Distortion is Superimposed with the MECO Static-Equivalent Acceleration
• MECO Design Limit Loads and Out-of-Plane Grid Distortion Defined in LAT-SS-00778
– FE Analysis
• Interface Distortion and MECO Design Limit Loads are Applied to the CAL FE Model
GLAST LAT Project CAL Peer Design Review, Mar 17-18, 2003
O. Ferreira 6.1-39CNRS/IN2P3-LLR
Ecole Polytechnique
Interface Loads Analysis Methodology and ResultsInterface Loads Analysis Methodology and Results
Grid Interface Loading on CAL Tabs due to Out-of-Plane Grid Distortion - Continued– Results
• Peak Stress = 23.0 ksi (at the Left Corner Tab) • Factor of Safety = 1.25 (Yield) and 1.40 (Ultimate)• Margins of Safety = 0.27 (Yield) and 0.49 (Ultimate)
X
Y
Z
23045.
21605.
20165.
18724.
17284.
15844.
14403.
12963.
11523.
10082.
8642.
7202.
5761.
4321.
2881.
1440.
3.638E-12
V1L5C1G5
Output Set: MSC/NASTRAN Case 3Contour: Plate Top VonMises Stress, Plate Bot VonMises Stress
peakstress
GLAST LAT Project CAL Peer Design Review, Mar 17-18, 2003
O. Ferreira 6.1-40CNRS/IN2P3-LLR
Ecole Polytechnique
Interface Loads Analysis Methodology and ResultsInterface Loads Analysis Methodology and Results
TEM/TPS Interface Loading on CAL Base Plate– Load Case for Analysis
– FE Analysis• Interface Load Applied to the CAL FE at a Node 15 mm
Below the Interface to Produce the Required Bending Moment
E-Box Stand-Off Unit N-m Unit Lb-inTension 3,750 844
Compression 2,625 591Shear 1,288 290
Bending Moment 19.3 170.9
GLAST LAT Project CAL Peer Design Review, Mar 17-18, 2003
O. Ferreira 6.1-41CNRS/IN2P3-LLR
Ecole Polytechnique
Interface Loads Analysis Methodology and ResultsInterface Loads Analysis Methodology and Results
TEM/TPS Interface Loading on CAL Base Plate - Continued– Results
• Peak Stress = 2.8 ksi• Factor of Safety = 1.25 (Yield) and 1.40 (Ultimate)• Margins of Safety = 12.0 (Yield) and 14.0 (Ultimate)
X
Y
Z
2771.
2598.
2425.
2251.
2078.
1905.
1732.
1559.
1386.
1212.
1039.
866.
692.8
519.6
346.4
173.2
0.
V1L5C1G5
Output Set: MSC/NASTRAN Case 4Contour: Plate Top VonMises Stress, Plate Bot VonMises Stress
Peak Stress
GLAST LAT Project CAL Peer Design Review, Mar 17-18, 2003
O. Ferreira 6.1-42CNRS/IN2P3-LLR
Ecole Polytechnique
Analysis Results – Margins of SafetyAnalysis Results – Margins of Safety
(1) Margins of Safety are Tsai Margin, Assuming Yield Strength for Aluminum and Titanium Alloys
(2) Values Have Been Measured on Test Samples, Weave Direction
(3) Calculated for Lateral Inserts Only
(4) Temperature Reduction of 65°C Instead of 50°C
GLAST LAT Project CAL Peer Design Review, Mar 17-18, 2003
O. Ferreira 6.1-43CNRS/IN2P3-LLR
Ecole Polytechnique
Structural Design StatusStructural Design Status
Design Meets Strength and Stability Requirements
– Positive Margins Have Been Calculated for All the Components
– Displacements Are Within Acceptable Range for All the Components
Modal Analysis Results are Not Yet Available but Previous Tests Have Already Demonstrated a Fundamental Frequency Above 150 Hz for the CAL Module (VM2), Showing Comfortable Margin to the Requirements
Additional Analysis on the Inserts is Required to Clearly Identify the Critical Inserts and Evaluate the Corresponding Margins of Safety
FE Models Will Have to be Correlated with EM Test Results
Detailed FE Model Needs to be Translated from SAMCEF to NASTRAN
GLAST LAT Project CAL Peer Design Review, Mar 17-18, 2003
O. Ferreira 6.1-44CNRS/IN2P3-LLR
Ecole Polytechnique
Work in ProgressWork in Progress
Modal Analysis is Ongoing
– Results Will Be Available After CDR
Margins of Safety for Critical Inserts Need to Be Re-evaluated
– LGMT, the Laboratory That Has Performed the Insert Testing and Analysis, will Provide the Results by the End of March
Model Correlation with Test Data– Modeling of the Interface Between the CsI Logs and the Composite
Cells is a Complex Task Because of the Highly Non-Linear Problem of the Silicone Cords. Current FE Models have been Correlated with Results from Compression Tests and VM2 Vibration Test. Because the Specification of the CsI Logs Has Changed, the FE Models Must be Correlated with EM Test Results
– Additional Time is Necessary to Correlate Results with Test Data Following EM Structural Environment Testing
GLAST LAT Project CAL Peer Design Review, Mar 17-18, 2003
O. Ferreira 6.1-45CNRS/IN2P3-LLR
Ecole Polytechnique
Work in Progress (cont)Work in Progress (cont)
FE Model Translation to NASTRAN for NASA-GSFC Deliverable– The CAL FE Models Have Been Developed with SAMCEF FEA
Software. Because These Models Were Not Originally Created with a Translation to NASTRAN in Mind (for Required Deliverable), They were Created Using SAMCEF-Specific Design Elements and Functionalities.
– Translation to NASTRAN is Requiring a Additional Effort from DDL, the Company Tasked to Provide Analysis for LLR. Additional Time is Necessary to Complete This Task.
Independent Review of Analysis Needs to be Completed