Glencoe Science
Chapter Resources
Climate
Includes:
Reproducible Student Pages
ASSESSMENT
✔ Chapter Tests
✔ Chapter Review
HANDS-ON ACTIVITIES
✔ Lab Worksheets for each Student Edition Activity
✔ Laboratory Activities
✔ Foldables–Reading and Study Skills activity sheet
MEETING INDIVIDUAL NEEDS
✔ Directed Reading for Content Mastery
✔ Directed Reading for Content Mastery in Spanish
✔ Reinforcement
✔ Enrichment
✔ Note-taking Worksheets
TRANSPARENCY ACTIVITIES
✔ Section Focus Transparency Activities
✔ Teaching Transparency Activity
✔ Assessment Transparency Activity
Teacher Support and Planning
✔ Content Outline for Teaching
✔ Spanish Resources
✔ Teacher Guide and Answers
Glencoe Science
Photo CreditsSection Focus Transparency 1: NASASection Focus Transparency 2: (tl) Robert W. Madden/NGS Image Collection, (tr) Gregory G. Dimijian/PhotoResearchers, (bl) Tim Davis/Photo Researchers, (br) ML Sinibaldi/The Stock MarketSection Focus Transparency 3: George Shelley/The Stock Market
Copyright © by The McGraw-Hill Companies, Inc. All rights reserved.Permission is granted to reproduce the material contained herein on the conditionthat such material be reproduced only for classroom use; be provided to students,teachers, and families without charge; and be used solely in conjunction with theClimate program. Any other reproduction, for use or sale, is prohibited withoutprior written permission of the publisher.
Send all inquiries to:Glencoe/McGraw-Hill8787 Orion Place Columbus, OH 43240-4027
ISBN 0-07-866954-5
Printed in the United States of America.
1 2 3 4 5 6 7 8 9 10 071 09 08 07 06 05 04
Climate 1
ReproducibleStudent Pages
Reproducible Student Pages■ Hands-On Activities
MiniLAB: Observing Solar Radiation . . . . . . . . . . . . . . . . . . . . . . . . . . 3MiniLAB: Try at Home Modeling El Niño . . . . . . . . . . . . . . . . . . . . . . 4Lab: The Greenhouse Effect . . . . . . . . . . . . . . . . . . . . . . . . . . . . . . . . . . 5Lab: Micro-climates. . . . . . . . . . . . . . . . . . . . . . . . . . . . . . . . . . . . . . . . 7Laboratory Activity 1: How do the oceans affect climate? . . . . . . . . . . . 9Laboratory Activity 2: Solar Energy Storage . . . . . . . . . . . . . . . . . . . . 13Foldables: Reading and Study Skills. . . . . . . . . . . . . . . . . . . . . . . . . . 17
■ Meeting Individual NeedsExtension and Intervention
Directed Reading for Content Mastery . . . . . . . . . . . . . . . . . . . . . . . 19Directed Reading for Content Mastery in Spanish . . . . . . . . . . . . . . 23Reinforcement . . . . . . . . . . . . . . . . . . . . . . . . . . . . . . . . . . . . . . . . . . 27Enrichment. . . . . . . . . . . . . . . . . . . . . . . . . . . . . . . . . . . . . . . . . . . . . 30Note-taking Worksheet . . . . . . . . . . . . . . . . . . . . . . . . . . . . . . . . . . . 33
■ AssessmentChapter Review . . . . . . . . . . . . . . . . . . . . . . . . . . . . . . . . . . . . . . . . . 37Chapter Test . . . . . . . . . . . . . . . . . . . . . . . . . . . . . . . . . . . . . . . . . . . . 39
■ Transparency ActivitiesSection Focus Transparency Activities . . . . . . . . . . . . . . . . . . . . . . . . 44Teaching Transparency Activity . . . . . . . . . . . . . . . . . . . . . . . . . . . . . 47Assessment Transparency Activity . . . . . . . . . . . . . . . . . . . . . . . . . . . 49
Cop
yrig
ht ©
Gle
ncoe
/McG
raw
-Hill
,a d
ivis
ion
of t
he M
cGra
w-H
ill C
ompa
nies
,Inc
.
Climate 3
Name Date Class
Observing Solar RadiationProcedure1. Darken the room.
2. Hold a flashlight about 30 cm from a globe. Shine the light directly on theequator. With your finger, trace around the light.
3. Now, tilt the flashlight to shine on 30°N latitude. The size of the lightedarea should increase. Repeat at 60°N latitude.
Han
ds-O
n A
ctiv
itie
s
Data and Observations
Table 1
Location WhereBeam is Directed
Description of Size of Lighted Area
1. Equator
2. 30˚N latitude
3. 60˚N latitude
Analysis1. How did the size and shape of the light beam change as you directed the light toward higher
latitudes?
2. How does Earth’s tilt affect the solar radiation received by different latitudes?
4 Climate
Name Date Class
Modeling El Niño
Procedure 1. During El Niño, trade winds blowing across the Pacific Ocean from east to
west slacken or even reverse. Surface waters move back toward the coast ofPeru.
2. Add warm water to a 9-in ✕ 13-in baking pan until it is two-thirds full. Placethe pan on a smooth countertop.
3. Blow as hard as you can across the surface of the water along the length of thepan. Next, blow with less force. Then, blow in the opposite direction.
Han
ds-On
Activities
Cop
yrig
ht ©
Gle
ncoe
/McG
raw
-Hill
,a d
ivis
ion
of t
he M
cGra
w-H
ill C
ompa
nies
,Inc
.
Analysis1. What happened to the water as you blew across its surface? What was different when you blew
with less force and when you blew from the opposite direction?
2. Explain how this is similar to what happens during an El Niño event.
Data and Observations
Table 1
Effects of Wind on Water Surfaces
Wind Forceor Direction
Observations
1. Greater force
2. Lesser force
3. Change of direction
Cop
yrig
ht ©
Gle
ncoe
/McG
raw
-Hill
,a d
ivis
ion
of t
he M
cGra
w-H
ill C
ompa
nies
,Inc
.
Climate 5
Name Date Class
Lab Preview
Directions: Answer the following questions before you begin the Lab.
1. What objects in this lab would be hazardous if broken?
2. You have just brought water to a boil in an uncovered pot and turned off the flame under thepot. Without turning the flame back on, how can you keep the water hot?
Do you remember climbing into the car on a warm, sunny day? Why was it so hot inside the car when it wasn’t that hot outside? It was hotter in the car because the car functioned like a greenhouse. You experienced the greenhouse effect.
The Greenhouse Effect
Han
ds-O
n A
ctiv
itie
s
Jar Temperature
Time Thermometer 1 Thermometer 2 Thermometer 3
5 min
10 min
15 min
Real-World QuestionHow can you demonstrate the greenhouse effect?
Materialsidentical large, empty glass jars (2)lid for one jarnonmercury thermometers (3)
Goals■ Model the greenhouse effect.■ Measure and graph temperature changes.
Safety Precautions WARNING: Be careful when you handle glassthermometers. If a thermometer breaks, do nottouch it. Have your teacher dispose of the glasssafely.
Data and Observations
Table 1
Procedure1. Lay a thermometer inside each jar.2. Place the jars next to each other by a sunny
window. Lay the third thermometerbetween the jars.
3. Record the temperatures of the three thermometers. They should be the same.
4. Place the lid on one jar.5. Record the temperatures of all three
thermometers at the end of 5, 10, and 15 min.
6. Plot your data on the graph in the Dataand Observations section that shows thetemperatures of the three thermometersfor the 15 min of the experiment.
6 Climate
Cop
yrig
ht ©
Gle
ncoe
/McG
raw
-Hill
,a d
ivis
ion
of t
he M
cGra
w-H
ill C
ompa
nies
,Inc
.
Name Date Class
Han
ds-On
Activities
Conclude and Apply1. Explain why you placed a thermometer between the two jars.
2. List the constants in this experiment. What was the variable?
3. Identify which thermometer showed the greatest temperature change during your experiment.
4. Analyze what occurred in this experiment. How was the lid in this experiment like the greenhouse gases in the atmosphere?
5. Infer from this experiment why you should never leave a pet inside a closed car in warm weather.
Communicating Your Data
Give a brief speech describing your conclusions to your class.
Tem
pera
ture
(˚C)
Time
00 5 10 15
(continued)
Cop
yrig
ht ©
Gle
ncoe
/McG
raw
-Hill
,a d
ivis
ion
of t
he M
cGra
w-H
ill C
ompa
nies
,Inc
.
Climate 7
Name Date Class
Lab Preview
Directions: Answer the following questions before you begin the Lab.
1. What should you do if a thermometer breaks?
2. How do large cities affect local climates?
A micro-climate is a localized climate that differs from the main climate of aregion. Buildings in a city, for instance, can affect the climate of the surround-ing area. Large buildings, such as the Bank of America Plaza in Dallas, Texas,can create micro-climates by blocking the Sun or changing wind patterns.
Real-World QuestionDoes your school create micro-climates?
Materialsthermometers *beakers or rainpsychrometer gauges (4 or 5)paper strip or wind sock unlined paperlarge cans (4 or 5) *Alternative materials
Goals■ Observe temperature, wind speed, relative
humidity, and precipitation in areas outsideyour school.
■ Identify local micro-climates.
Safety Precautions WARNING: If a thermometer breaks, do nottouch it. Have your teacher dispose of the glasssafely.
Procedure1. Select four or five sites around your school
building. Also, select a control site wellaway from the school.
2. Attach a thermometer to an object near eachof the locations you selected. Set up a raingauge, beaker, or can to collect precipitation.
3. Visit each site at two predetermined times,one in the morning and one in theafternoon, each day for a week. Record thetemperature and measure any precipitationthat might have fallen. Use a wind sock orpaper strip to determine wind direction.
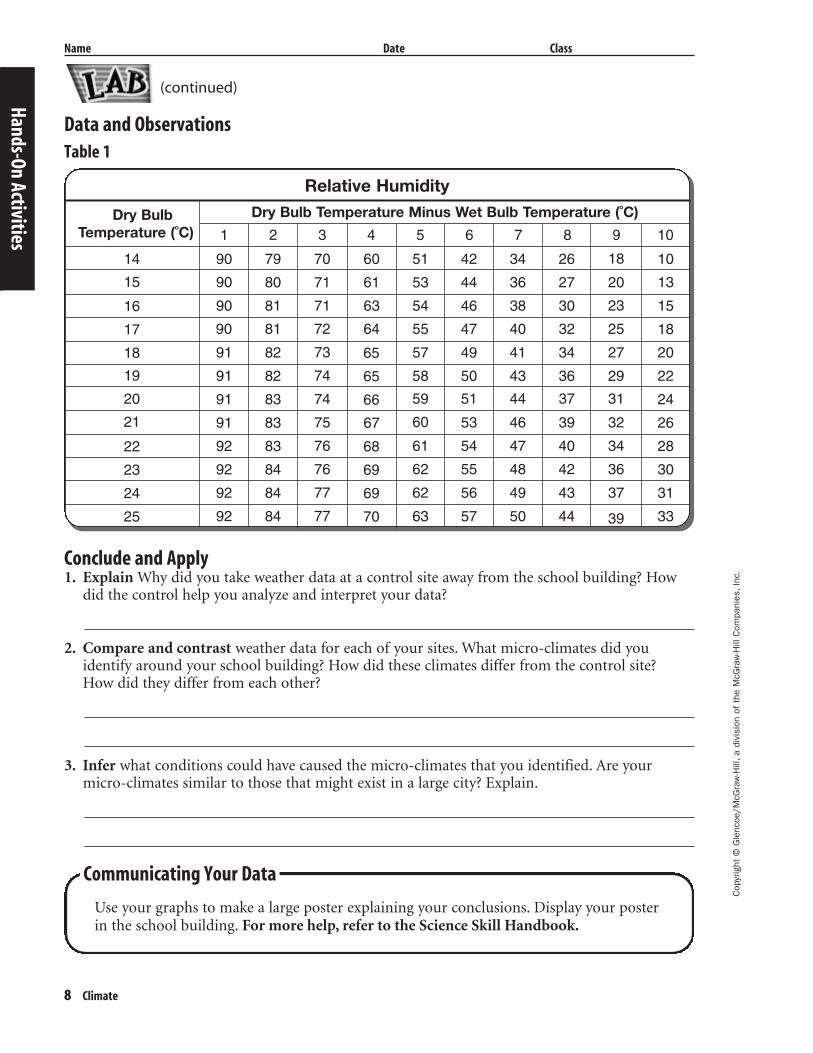
4. To find relative humidity, you’ll need to use apsychrometer. A psychrometer is aninstrument with two thermometers—onewet and one dry. As moisture from the wetthermometer evaporates, it takes heat energyfrom its environment, and the environmentimmediately around the wet thermometercools. The thermometer records a lowertemperature. Relative humidity can be foundby finding the difference between the wetthermometer and the dry thermometer andby using the chart on the following page.Record all of your weather data.
5. Analyze your data to find patterns. Makeseparate line graphs for temperature,relative humidity, and precipitation foryour morning and afternoon data. Make atable showing wind direction data.
Micro-climates
Han
ds-O
n A
ctiv
itie
s
8 Climate
Cop
yrig
ht ©
Gle
ncoe
/McG
raw
-Hill
,a d
ivis
ion
of t
he M
cGra
w-H
ill C
ompa
nies
,Inc
.
Name Date Class
Data and Observations
Table 1
Han
ds-On
Activities
Conclude and Apply1. Explain Why did you take weather data at a control site away from the school building? How
did the control help you analyze and interpret your data?
2. Compare and contrast weather data for each of your sites. What micro-climates did you identify around your school building? How did these climates differ from the control site? How did they differ from each other?
3. Infer what conditions could have caused the micro-climates that you identified. Are your micro-climates similar to those that might exist in a large city? Explain.
Communicating Your Data
Use your graphs to make a large poster explaining your conclusions. Display your posterin the school building. For more help, refer to the Science Skill Handbook.
90 79 70 60 51 42 34 26 18 10
90 80 71 61 53 44 36 27 20 13
90 81 71 63 54 46 38 30 23 15
90 81 72 64 55 47 40 32 25 18
91 82 73 65 57 49 41 34 27 20
91 82 74 65 58 50 43 36 29 22
91 83 74 66 59 51 44 37 31 24
91 83 75 60 53 46 39 32 26
92 83 76 68 61 54 47 40 34 28
92 84 76 69 62 55 48 42 36 30
92 84 77 69 62 56 49 43 37 31
14
15
16
17
18
19
20
21
22
23
24
92 84 77 70 63 57 50 44 39 3325
67
Relative Humidity
Dry Bulb Temperature (˚C)
Dry Bulb Temperature Minus Wet Bulb Temperature (˚C)
1 2 3 4 5 6 7 8 9 10
(continued)
Cop
yrig
ht ©
Gle
ncoe
/McG
raw
-Hill
,a d
ivis
ion
of t
he M
cGra
w-H
ill C
ompa
nies
,Inc
.
Climate 9
Name Date Class
How do the oceans affect climate?
Meteorologists, people who study weather and climate, are always looking atwhat happens in the oceans. Most of the climate we experience on land is a resultof winds and evaporated water at sea. One of the effects of the oceans is to keep theclimate near their shores fairly constant. This happens because the water maintainsa relatively even temperature. As a result of the weak attractions that form betweenthe hydrogen atoms of one molecule of water and the oxygen atoms of nearbywater molecules, a large amount of heat energy can be absorbed by water before itstemperature rises. Air molecules do not have this type of attraction between them;therefore the temperature rises more quickly with heat input from the Sun. Volumeis also an important consideration in looking at the effects of the Sun’s energy onwater molecules. It is much easier for the Sun to heat or cool a small pond than it isfor the Sun to heat or cool the ocean. In this laboratory exercise, you will comparethe effect of the Sun’s energy on water with its effect on the atmosphere. From yourdata, you will make conclusions about climate in different regions.
StrategyYou will model and observe the effect of
energy from the Sun on water and on air.You will infer how oceans and energy from
the Sun affect climate.
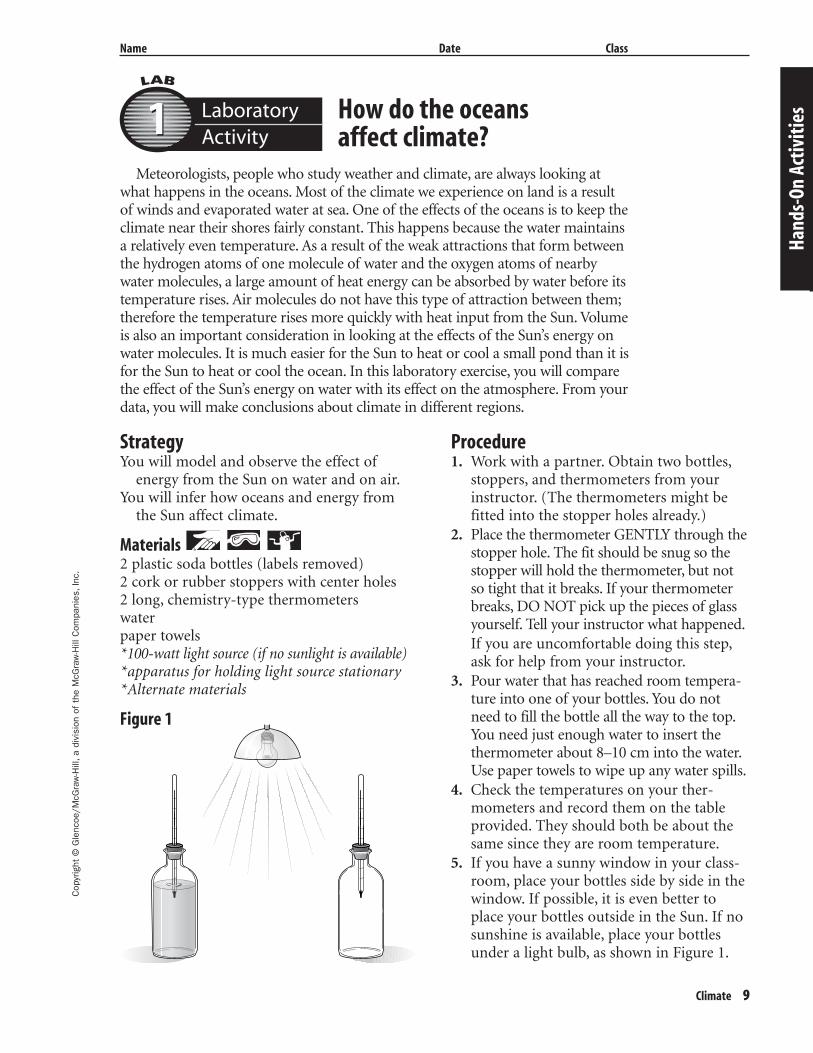
Materials 2 plastic soda bottles (labels removed)2 cork or rubber stoppers with center holes 2 long, chemistry-type thermometerswaterpaper towels*100-watt light source (if no sunlight is available)*apparatus for holding light source stationary*Alternate materials
Figure 1
Procedure1. Work with a partner. Obtain two bottles,
stoppers, and thermometers from yourinstructor. (The thermometers might be fitted into the stopper holes already.)
2. Place the thermometer GENTLY through thestopper hole. The fit should be snug so thestopper will hold the thermometer, but notso tight that it breaks. If your thermometerbreaks, DO NOT pick up the pieces of glassyourself. Tell your instructor what happened.If you are uncomfortable doing this step,ask for help from your instructor.
3. Pour water that has reached room tempera-ture into one of your bottles. You do notneed to fill the bottle all the way to the top.You need just enough water to insert thethermometer about 8–10 cm into the water.Use paper towels to wipe up any water spills.
4. Check the temperatures on your ther-mometers and record them on the tableprovided. They should both be about thesame since they are room temperature.
5. If you have a sunny window in your class-room, place your bottles side by side in thewindow. If possible, it is even better toplace your bottles outside in the Sun. If nosunshine is available, place your bottlesunder a light bulb, as shown in Figure 1.
Han
ds-O
n A
ctiv
itie
sLaboratoryActivity11
10 Climate
Cop
yrig
ht ©
Gle
ncoe
/McG
raw
-Hill
,a d
ivis
ion
of t
he M
cGra
w-H
ill C
ompa
nies
,Inc
.
Laboratory Activity 1 (continued)
Name Date Class
6. After 10 min, observe and record the temper-atures inside your bottles. If you need toremove the stoppers and thermometers toread the temperature, replace the stoppersquickly or you will lose heat from the bottles.
7. Repeat step 6 two times, so you have a totalof four temperature readings for each bottle.
Questions and Conclusions1. Which bottle had the greatest amount of temperature change?
2. How do you explain this based on the idea that weak attractions exist between water molecules?
3. How would you relate this temperature change to warm, coastal climates? To flat, inland landscapes, like deserts?
Han
ds-On
Activities
Data and Observations
Time ofobservationin minutes
Temperatureof air bottle
(°C)
Temperatureof water
bottle (°C)
Initial time 0
10
20
30
Table 1
Cop
yrig
ht ©
Gle
ncoe
/McG
raw
-Hill
,a d
ivis
ion
of t
he M
cGra
w-H
ill C
ompa
nies
,Inc
.
Climate 11
Name Date Class
4. The climate at the North and South Poles is never warm even though they are surrounded byoceans. How do you explain this? [Hint: Think about the angles of the sun’s rays.]
Strategy Check
Can you explain how water and air are affected differently by the Sun’s energy?
Can you explain how oceans influence climate?
Han
ds-O
n A
ctiv
itie
s
Laboratory Activity 1 (continued)
Cop
yrig
ht ©
Gle
ncoe
/McG
raw
-Hill
,a d
ivis
ion
of t
he M
cGra
w-H
ill C
ompa
nies
,Inc
.
Climate 13
Name Date Class
Solar Energy Storage
Solar energy is not always available when we need it, such as on cloudy days and at night.Storing the solar energy is one of the problems that must be solved before solar energy can beused on a large scale to produce electricity for homes, factories, or businesses. One method ofstorage involves solids such as rocks. Another method involves the use of water or air.
StrategyYou will construct storage tanks for heat energy.You will compare the ability of water and gravel to absorb and release heat energy.You will explain how these storage methods can be used to heat a home.
Materials 2 small coffee cans with lidswaterhot plate2 nonmercury thermometerswatch with second handbeaker tongs or pliersgravelgraph paperpencils (colored)
Procedure1. Pour water into one coffee can until it
is half full, and set it on the hot plate.WARNING: Use proper protection whenhandling a hot plate. Measure the water’stemperature near the bottom of the canand near the top. Record the temperaturesin Table 1.
2. Turn the hot plate to high and allow it toheat for 2 min. Turn the hot plate off.Measure the temperature of the water near the bottom of the can with one thermometer and close to the top with theother thermometer every minute for 15min. Record the temperatures in Table 1.WARNING: Do not leave thermometer incan during heating.
3. Using beaker tongs or pliers, remove the canof water from the hot plate.WARNING : Hot water can cause seriousburns.
4. Allow the hot plate to cool.5. Pour gravel into the second coffee can until
it is half-full, and place it on the hot plate.Measure the temperature near the bottomwith one thermometer and near the top of the can with the other thermometer.WARNING: Follow your teacher’s instruc-tions on inserting your thermometer into thegravel. Hot gravel can cause serious burns.Record the temperatures in Table 1.
6. Repeat step 2. This time with gravel instead of water. Allow the can with thegravel to remain on the hot plate until it iscompletely cool.
Han
ds-O
n A
ctiv
itie
sLaboratoryActivity22
14 Climate
Cop
yrig
ht ©
Gle
ncoe
/McG
raw
-Hill
,a d
ivis
ion
of t
he M
cGra
w-H
ill C
ompa
nies
,Inc
.
Laboratory Activity 2 (continued)
Name Date Class
Data and Observations
Table 1
Han
ds-On
Activities
Temperature (˚C)
Prior to heating
GravelTime (min) Water
Top Bottom Top Bottom
Cop
yrig
ht ©
Gle
ncoe
/McG
raw
-Hill
,a d
ivis
ion
of t
he M
cGra
w-H
ill C
ompa
nies
,Inc
.
Climate 15
Name Date Class
Directions: Graph temperature and time for each material. Use a different-colored pencil for each material.
Han
ds-O
n A
ctiv
itie
s
Laboratory Activity 2 (continued)
1 2 3 4 5 6 7 8 9 10 11 12 13 14 15
Tem
pera
ture
Minutes
Questions and Conclusions1. Which material heated more rapidly? How do you know?
2. Which material cooled more rapidly? How do you know?
3. Which material would you choose to store heat energy from a solar collector? Explain.
4. If you use a solar collector that circulates water, you need a large tank of water to store the heat,generally 2.7 L per square meter. How much water would you need to store to heat a housewith an area of 1380 m2?
5. How would you store the rocks necessary for a solid solar storage system?
16 Climate
Cop
yrig
ht ©
Gle
ncoe
/McG
raw
-Hill
,a d
ivis
ion
of t
he M
cGra
w-H
ill C
ompa
nies
,Inc
.
Laboratory Activity 2 (continued)
Name Date Class
6. How can you change the storage system to make it more efficient than it is in this activity?
Strategy Check
Can you construct tanks for heat energy?
Can you compare the ability of water and gravel to absorb and release heat energy?
Can you explain how these storage methods can be used to heat a home?
Han
ds-On
Activities
Cop
yrig
ht ©
Gle
ncoe
/McG
raw
-Hill
,a d
ivis
ion
of t
he M
cGra
w-H
ill C
ompa
nies
,Inc
.
Climate 17
Climate
Directions: Use this page to label your Foldable at the beginning of the chapter.
Climate Classification Tropical Mild
Dry Continental
Polar
High ElevationIt is always hot here, except at high elevations.
It is colder here because the air is thinner.
This climate can have warm or cool summers.
This climate is found around the Mediterranean Sea.
This climate is never warm.
This type can be arid or semiarid.
Name Date Class
Han
ds-O
n A
ctiv
itie
s
Cop
yrig
ht ©
Gle
ncoe
/McG
raw
-Hill
,a d
ivis
ion
of t
he M
cGra
w-H
ill C
ompa
nies
,Inc
.
Name Date Class
Climate 19
OverviewClimate
Directions: Use the following terms to complete the concept map below.
mild solar output large cities tropical
volcanic eruptions temperate continental
seasons polar dry
meteorite collisions high elevation
Mee
tin
g In
divi
dual
Nee
ds
Climate
12.
can be changed byhas three zones determined by latitude
11.
10.
9.
8.
7.
6.
5.
4.
3.
2.
1.
has six classificationsdetermined by precipitation
and temperature
polar
tropical
El Niño
Directed Reading for
Content Mastery
Directed Reading for
Content Mastery
Name Date Class
20 Climate
Section 1 ■ What is climate?Section 2 ■ Climate Types
Directions: Unscramble the following terms to complete the concept map below.
tudealti gelar estici dnalmsfor
isodbe fo tarew oecan rrucenst isanotumn
Cop
yrig
ht ©
Gle
ncoe
/McG
raw
-Hill
,a d
ivis
ion
of t
he M
cGra
w-H
ill C
ompa
nies
,Inc
.
Meetin
g Individu
al Needs
Directions: Choose the phrase on the right that correctly completes each sentence. Write the letter of the phrase
in the space provided.
7. The fur of mammals is an example
of a _____.
8. Water heats up and cools down _____.
9. As air rises, _____.
10. Climates can be classified based on _____.
11. Hibernation and estivation are twokinds of _____.
12. Deserts are common on the _____.
a. temperature, moisture, and amount of sunlight.
b. it cools.
c. structural adaptation.
d. leeward side of mountains,away from the wind.
e. more slowly than land.
f. behavioral adaptations.
climate
1.
3.
6.
5.
affect(s)
4.
2.
Cop
yrig
ht ©
Gle
ncoe
/McG
raw
-Hill
,a d
ivis
ion
of t
he M
cGra
w-H
ill C
ompa
nies
,Inc
.
Name Date Class
Climate 21
Section 3 ■ Climatic Changes
Directions: Circle the term that correctly completes each sentence.
1. (Earth’s rotation/Earth’s tilt) causes seasons.
2. El Niño occurs when (rain/wind) patterns change over the Pacific Ocean.
3. The amount of (carbon dioxide/volcanic ash) in the atmosphere helps create the
greenhouse effect.
4. Great events such as meteorite collisions and (volcanic eruptions/glaciation) can
affect the amount of sunlight reaching Earth.
5. Because of fairly (low/constant) solar radiation near the equator, the tropics do
not have great seasonal temperature changes.
Directions: Place the sentences in the top oval in correct order in the flow chart that follows.
Mee
tin
g In
divi
dual
Nee
ds
Directed Reading for
Content Mastery
• Carbon dioxide levels in the atmosphere increase.
• Global warming occurs.• People burn fossil fuels and cut down forests.
8.
7.
6.
Directed Reading for
Content Mastery
Name Date Class
22 Climate
Key TermsClimate
Directions: Use the following terms to complete the puzzle below. The letters in the dark vertical box will spell a
familiar word.
adaptation global warming hibernation
temperate zone deforestation tropics greenhouse effect
Cop
yrig
ht ©
Gle
ncoe
/McG
raw
-Hill
,a d
ivis
ion
of t
he M
cGra
w-H
ill C
ompa
nies
,Inc
.
Meetin
g Individu
al Needs
1. Regions of Earth that receive the most solar radiation
2. Increase in global temperatures
3. An animal’s long period of inactivity during winter
4. Moderate temperature zone between the polar zone and the tropics
5. Any structure or behavior that helps an organism survive in its environment
6. Destroying and cutting down trees
7. Natural heating caused when gases in the atmosphere trap heat
8. The familiar word in the dark vertical box is ____________________.
7
6
5
4
3
2
11
Cop
yrig
ht ©
Gle
ncoe
/McG
raw
-Hill
,a d
ivis
ion
of t
he M
cGra
w-H
ill C
ompa
nies
,Inc
.
Nombre Fecha Clase
Clima 23
SinopsisClima
Instrucciones: Usa los siguientes términos para completar el mapa conceptual.
moderado potencia solar ciudades grandes tropical
erupciones volcánicas temperatura continental
estaciones polar seco
colisiones de meteoritos alta elevación
Lectura dirigida para
Dominio del contenidio
Sati
sfac
e la
s n
eces
idad
es in
divi
dual
es
El clima
12.
puede cambiar a causa detiene tres zonas deter-minadas por la latitud
11.
10.
9.
8.
7.
6.
5.
4.
3.
2.
1.
tiene seis clasificacionesdeterminadas por la preci-
pitación y temperatura
polar
tropical
El Niño
Lectura dirigida para
Dominio del contenidio
Nombre Fecha Clase
24 Clima
Sección 1 ■ ¿Qué es el clima?Sección 2 ■ Tipos de clima
Instrucciones: Descifrar los siguientes términos para completar el mapa conceptual.
tudealti gelar estici dnalmsfor
isodbe fo tarew oecan rrucenst isanotumn
Cop
yrig
ht ©
Gle
ncoe
/McG
raw
-Hill
,a d
ivis
ion
of t
he M
cGra
w-H
ill C
ompa
nies
,Inc
.
Instrucciones: Escoge la letra de la frase que complete correctamente cada oración. Escribe la letra en el
espacio dado.
7. El pelo de los mamíferos es un
ejemplo de _____.
8. El agua se calienta y seenfría _____.
9. A medida que el aire se eleva, _____.
10. Los climas pueden clasificarse con base en _____.
11. La hibernación y la estivación sondos clases de _____.
12. Los desiertos son comunes en _____.
a. temperatura, humedad y cantidad de luz solar.
b. se enfría.
c. adaptación estructural.
d. el lado de sotavento de las montañas, dando la espalda al viento.
e. más lentamente que la tierra.
f. adaptaciones del compor-
tamiento.
el clima
1.
3.
6.
5.
afecta
4.
2.
Satisface las necesidades in
dividuales
Cop
yrig
ht ©
Gle
ncoe
/McG
raw
-Hill
,a d
ivis
ion
of t
he M
cGra
w-H
ill C
ompa
nies
,Inc
.
Nombre Fecha Clase
Clima 25
Sección 3 ■ Cambios climáticos
Instrucciones: Haz un círculo alrededor del término que responde correctamente cada oración.
1. (La rotación/inclinación) de la Tierra causa las estaciones.
2. El Niño ocurre cuando cambian los patrones de (lluvia/viento) sobre el océanoPacífico.
3. La cantidad de (dióxido de carbono/cenizas volcánicas) en la atmósfera ayuda a
crear el efecto de invernadero.
4. Sucesos importantes como las colisiones de meteoritos y (erupciones volcánicas-/glaciaciones) pueden afectar la cantidad de luz solar que llega a la Tierra.
5. Debido a la radiación solar (baja/constante) cerca del ecuador, los trópicos no
experimentan grandes cambios de temperatura.
Instrucciones: Ordena las oraciones en el diagrama de flujo.
Lectura dirigida para
Dominio del contenidio
• El nivel de dióxido de carbonoen la atmósfera se eleva.
• Ocurre el calentamiento global.• Se usan los combustibles fósiles y se talan los bosques.
8.
7.
6.
Sati
sfac
e la
s n
eces
idad
es in
divi
dual
es
Lectura dirigida para
Dominio del contenidio
Nombre Fecha Clase
26 Clima
Palabras clavesClima
Instrucciones: Usa los siguientes términos para completar el crucigrama. Las letras en los cuadrados sombrea-
dos deletrean una palabra familiar.
adaptación calentamiento global hibernación
zona templada tala trópicos efecto de invernadero
Cop
yrig
ht ©
Gle
ncoe
/McG
raw
-Hill
,a d
ivis
ion
of t
he M
cGra
w-H
ill C
ompa
nies
,Inc
.
1. Regiones de la Tierra que reciben la mayor cantidad de radiación solar.
2. Aumento en las temperaturas globales.
3. Período largo de inactividad de un animal durante el invierno.
4. Zona de temperatura moderada entre la zona polar y los trópicos.
5. Cualquier estructura o comportamiento que le ayuda a un organismo a sobre-vivir en su ambiente.
6. Destrucción y tala de árboles.
7. Calentamiento natural que ocurre cuando los gases en la atmósfera atrapan elcalor.
8. La palabra familiar en los cuadrados verticales es ____________________.
7
6
5
4
3
2
11
Satisface las necesidades in
dividuales
Cop
yrig
ht ©
Gle
ncoe
/McG
raw
-Hill
,a d
ivis
ion
of t
he M
cGra
w-H
ill C
ompa
nies
,Inc
.
Name Date Class
Climate 27
What is climate?
Mee
tin
g In
divi
dual
Nee
ds
Directions: On the map above, note the factors that can affect the climate. Then, in the table below, enter the
names of these factors and describe the effects they cause.
Key
Mountains
City
Ocean
Factors Effects
1.
2.
3.
Reinforcement11
28 Climate
Cop
yrig
ht ©
Gle
ncoe
/McG
raw
-Hill
,a d
ivis
ion
of t
he M
cGra
w-H
ill C
ompa
nies
,Inc
.
Name Date Class
Climate Types
Directions: Complete the following sentences using the correct terms.
1. The type of plants found in a region depends on the region’s ____________________.
2. The fur of mammals ____________________ them from the cold.
3. A(n) ____________________ is a characteristic that helps an organism survive.
4. Desert turtles and lizards obtain the moisture they need from their ____________________.
5. Some mammals survive cold winters in a state of reduced activity called
____________________.
6. Lungfish survive intense heat in an inactive state called ____________________.
7. A body structure that helps an organism survive in its environment is
a(n) ____________________ adaptation.
8. In the Köppen System, climate groups are classified according to temperature and
____________________.
Directions: Answer the following questions on the lines provided.9. What is an adaptation?
10. What behavioral adaptations help snakes survive in hot, dry places?
11. What are three body structures that help cactus plants survive in dry climates?
12. How do the body structures you listed above help the cactus plants survive in dry climates?
13. Name the six groups of climates in the Köppen classification system.
Meetin
g Individu
al Needs
Reinforcement22
Cop
yrig
ht ©
Gle
ncoe
/McG
raw
-Hill
,a d
ivis
ion
of t
he M
cGra
w-H
ill C
ompa
nies
,Inc
.
Name Date Class
Climate 29
Directions: Answer the following questions on the lines provided.1. In the illustration, what season is it in the
northern hemispheres? In the southern hemisphere?
2. Where on Earth are the seasonal variations oftemperature and day length greatest? Least?
3. What are the effects of El Niño?
4. What is global warming?
5. How might global warming affect Earth?
6. What are some possible causes for climatic changes in the past?
7. What is the greenhouse effect?
8. How does the greenhouse effect influence Earth?
9. How do scientists know what Earth’s climate was like in earlier geologic eras?
Climatic Changes
Mee
tin
g In
divi
dual
Nee
ds
To
Sun
Reinforcement33
30 Climate
Cop
yrig
ht ©
Gle
ncoe
/McG
raw
-Hill
,a d
ivis
ion
of t
he M
cGra
w-H
ill C
ompa
nies
,Inc
.
Name Date Class
Shadowy Figures
The state of California is especially luckywhen it comes to climate. On the western side,the warm Pacific Ocean keeps coastal tempera-tures generally mild. The eastern side has thebeautiful Sierra Nevada Mountain range,where people camp in summer and ski in win-ter. However, California’s neighbor to the east,Nevada, is not so lucky. Nevada’s climate is arain shadow desert.
Rain for AgricultureThe rain shadow forms when warm moist
air from the Pacific Ocean blows east andinland. As the moist air moves toward themountains, the warm air is forced upwardwhere it cools. The cooling condenses themoisture in the air, producing rain for centraland northern California. Because of this rain,farmers easily grow fruit, nuts, rice, vegetables,and cotton. Grass also grows well, sustaininglarge herds of livestock for milk and meat.
The Dry SideThe problem for Nevada is that the SierraNevada Mountains are so high that very lit-tle moisture gets past them. Nevada receivesso little moisture that much of the state is adesert. Agriculture consists primarily ofranching and forage production. Tourism,government-related activities, and the min-ing of gold, silver, and other minerals aremore important than agriculture in Nevada’seconomy. Most food comes from Californiaand other places.
Food production, however, is one ofCalifornia’s major industries. The food you eattoday might have come from California. Thenext time you visit a grocery store, see if youcan discover where your fruits, vegetables, andmeat come from.
1. Is the climate of California affected by an ocean? Explain.
2. What is a rain shadow?
3. What is Nevada’s climate like? Why?
4. Draw a diagram of a rain shadow that shows its effects on the surrounding climates.M
eeting In
dividual N
eeds
Enrichment11
Cop
yrig
ht ©
Gle
ncoe
/McG
raw
-Hill
,a d
ivis
ion
of t
he M
cGra
w-H
ill C
ompa
nies
,Inc
.
Name Date Class
Climate 31
The Steppe Climate
Directions: Chart the following information on the blank graph for Pueblo, Colorado.Rainfall: January—1 cm July—5 cm Temperature in °C: January—0° July—24°
February—2 cm August—4.5 cm February—0° August—24°March—2.5 cm September—3 cm March—5° September—18°April—4 cm October—2 cm April—10° October—11°May—4 cm November—1 cm May—15° November—5°June—3.5 cm December—1.5 cm June—20° December—0°
Directions: Use the information in the graphs to answer the following questions.1. How does the rainfall distribution differ between Monterrey and Semipalatinsk?
2. What does the graph indicate about the temperature range in Monterrey?
3. What does the graph show about the temperature range in Semipalatinsk?
4. When is the rainy season in Pueblo, Colorado?
5. Compare the climate in Pueblo to the climate in Monterrey.
The steppe or semiarid climate zone is locatedin prairies and grasslands. Steppes are often foundsurrounding desert areas. Annual rainfall is light,somewhere between the desert and more humidclimates. The specific characteristics of eachsteppe depend on the steppe’s latitude andwhether it is located near mountains or an ocean.
The graphs below show one way to sum-marize basic climate information. The lineshows how temperature changes over theyear. The bar graphs show the monthly pre-cipitation (J is for January, F is for February,and so on). All three places are classified assteppes.
Mee
tin
g In
divi
dual
Nee
dsTemperature in (˚C)
Precipitation in (cm)
Monterey, Mexico
J F M A M J J A S O N D0
20
-30
-20
-10
0
10
20
30
40
-30
-20
-10
0
10
20
30
40
-30
-20
-10
0
10
20
30
40
2
4
6
8
10
12
14
16
18
0
20
2
4
6
8
10
12
14
16
18
J F M A M J J A S O N D
Temperature in (˚C)
Precipitation in (cm)
Semipalatinsk, Russia
0
20
2
4
6
8
10
12
14
16
18
J F M A M J J A S O N D
Temperature in (˚C)
Precipitation in (cm)
Pueblo, Colorado
Enrichment22
32 Climate
Cop
yrig
ht ©
Gle
ncoe
/McG
raw
-Hill
,a d
ivis
ion
of t
he M
cGra
w-H
ill C
ompa
nies
,Inc
.
Name Date Class
The Gulf Stream
The Gulf Stream is one of the most impor-tant oceanic currents in the world. It is respon-sible for warmer climates in north Atlanticcountries, like Iceland and the countries ofwestern Europe. The Gulf Stream acts as a con-veyor belt—moving warm ocean water into theicy cold waters of the north polar seas while thecold northern waters sink to the ocean bottombecause they are very dense. This cold waterflows south along the bottom of the ocean tothe equator. As the cold waters flow south, thewarmer equatorial surface layers of the oceanare pulled to the north. This warm water ispulled up and around the entire Atlantic Ocean,keeping climates relatively warm along theEuropean coasts.
World TravelerThe Gulf Stream begins near Africa as an
equatorial current formed when winds blowsurface water from Africa westward to theCaribbean Sea. Warm water flowing out of theGulf of Mexico meets the equatorial currentin the Florida Straits between the Caribbean,Cuba, and the tip of Florida. From here, theGulf Stream is then pulled north by theundertow movement of the cold polar waterflowing south. The warm water continues uppast Newfoundland, Greenland, Iceland, andNorway. It continues down along the westernside of France, Spain, and back to Africawhere the winds blow it west again.
Ponce de Leon, a Spanish explorer of theearly 1500s, was the first person to describe theGulf Stream current. Ben Franklin later puttogether puzzling stories from ship captainsabout how it took longer to sail from London toAmerica than from America to London. Heboarded a ship, sailed the current of the GulfStream and charted the first map of the current.
New InformationOne of the most recent discoveries about the
Gulf Stream is that during the ice ages it “shutsdown.” A scientist, Jean Lynch-Stieglitz, lookedat oxygen levels in the shells of tiny organismscalled foraminifera, found in muds that wereat least 20,000 years old. Oxygen isotope levelschange when climate changes. When it is cold,levels of O16 are lower in foraminifera shells,and O18 is high. Her study showed that duringthe ice ages, the Gulf Stream was very slow anddid not carry warm water up to the poles as itdoes today. Whether the shutdown of the GulfStream caused the ice ages or the ice agescaused the shutdown is not known.
What we do know is that today the GulfStream current has a huge effect on climate inmany parts of the world. If the Gulf Streamchanges again, so will the climate. Or is thatvice versa?
1. Where do winds start the current that will form the Gulf Stream?
2. What causes warm water in the Gulf of Mexico to be pulled toward the North Atlantic?
3. Has the Gulf Stream current always been as active as it is today? Explain your answer.
4. Why do you think the Gulf Stream current does not flow down into the southern hemisphere?
Meetin
g Individu
al Needs
Enrichment33
Cop
yrig
ht ©
Gle
ncoe
/McG
raw
-Hill
,a d
ivis
ion
of t
he M
cGra
w-H
ill C
ompa
nies
,Inc
.
Name Date Class
Climate 33
Climate
Section 1 What is climate?
A. Climate is the pattern of weather that occurs in an area over ______________________
1. Determines the types of plants or animals that can survive, and influences how people live
2. Elements that are averaged to determine climate: _______________________, precipitation,
air pressure, humidity, and days of sunshine
B. Factors that affect climate:
1. Latitude—distance north or south of the ___________________
a. Tropics (between 23° north and 23° south)—sun shines directly overhead, keeping
temperatures _________________
b. ___________ zones (66° north and 66° south to the poles)—sun shines at a low angle,
keeping temperatures low
c. Temperate zones (between the tropics and the polar zones)—________ temperatures
2. Large bodies of water affect the climate of coastal areas by _________________ or giving
off heat.
3. Ocean currents can bring cool or warm temperatures and ________________ to coastal areas.
4. Mountains affect their own climate as well as the climates of nearby areas.
a. At the same latitude, the climate on a mountain is ______________ than the climate at
sea level.
b. Mountains cause air to rise, cool, and condense, creating a _______________ climate on the
windward side of the mountain and a much drier climate on the leeward side.
5. Because of their large areas of solar radiation-absorbing pavement, _________________
frequently have higher temperatures than surrounding areas.
Mee
tin
g In
divi
dual
Nee
ds
Note-takingWorksheet
34 Climate
Cop
yrig
ht ©
Gle
ncoe
/McG
raw
-Hill
,a d
ivis
ion
of t
he M
cGra
w-H
ill C
ompa
nies
,Inc
.
Name Date Class
Section 2 Climate Types
A. Köppen’s system of climate ______________________
1. Examined temperature, precipitation, and ___________________
2. Six types of climate: tropical, mild, dry, continental, polar, and ______________________
B. Adaptation—any structure or behavior that helps an organism _______________ in its
environment
1. __________ adaptations are body structures that help organisms survive in certain climates.
a. Example: the ___________ of mammals insulates them from cold temperatures.
b. Example: a cactus’s thick, fleshy ____________ helps it hold water.
2. __________ adaptations
a. Example: ___________________—a period of greatly reduced activity during cold months
b. Example: estivation—state of ________________________, similar to hibernation, that
occurs during periods of intense heat
Section 3 Climatic Changes
A. Seasons—short periods of climatic change caused by changes in the amount of
_______________________ an area receives
1. As Earth revolves around the Sun, different areas of Earth are ______________ toward the
Sun.
2. The ___________ do not experience much seasonal temperature change.
3. High latitudes near the poles experience __________ seasonal temperature change.
B. El Niño—an occasional climatic event in which strong Pacific winds ______________ and
sometimes _______________
1. Effects of El Niño:
a. Ocean temperatures near Peru _______________.
b. The position and strength of one of the ___________________ may be altered, changing
wind and precipitation patterns around the world.
c. Africa and Australia may experience _______________.
2. La Niña—The winds blowing across the Pacific are ________________ than normal.
Meetin
g Individu
al Needs
Note-taking Worksheet (continued)
Cop
yrig
ht ©
Gle
ncoe
/McG
raw
-Hill
,a d
ivis
ion
of t
he M
cGra
w-H
ill C
ompa
nies
,Inc
.
Name Date Class
Climate 35
C. At times in the past, Earth’s climate was much warmer or colder than now.
D. Causes of _________________ change can operate over short or very long periods of time.
1. Solar radiation is blocked by larger numbers of solid and liquid _________________ entering
the atmosphere.
a. Catastrophic events such as ___________________________ and _________________
collisions can cause climatic change.
b. __________________ can also cause climatic change.
2. Variations in solar radiation, possibly related to the presence of ________________ can
cause climatic change.
3. Earth’s movements in space can change the amount of _______________________
reaching it.
a. Earth’s ____________ changes about every 41,000 years.
b. Earth’s ____________ wobbles in space.
c. The shape of Earth’s _____________ changes over a 100,000-year cycle.
4. The movement of Earth’s ______________________ affects the transfer of heat on Earth.
E. Climatic changes today
1. Greenhouse effect—a natural heating process that occurs when certain gases such as
______________________, _______________, and water vapor in Earth’s atmosphere trap
heat
2. Global warming—Earth’s average global surface temperature is rising, possibly due to the
increase in ________________________ in our atmosphere.
3. Human activities affect the air in Earth’s atmosphere.
a. Burning ____________________ increases the amount of carbon dioxide in the atmosphere.
b. _____________ results in fewer trees to absorb carbon dioxide from the atmosphere.
c. Individuals can help reduce the amount of _______________________ in the
atmosphere.
Mee
tin
g In
divi
dual
Nee
ds
Note-taking Worksheet (continued)
Cop
yrig
ht ©
Gle
ncoe
/McG
raw
-Hill
,a d
ivis
ion
of t
he M
cGra
w-H
ill C
ompa
nies
,Inc
.
Name Date Class
Climate 37
Climate
Part A. Vocabulary Review
Directions: Match the terms in Column I with their description in Column II. Write the letter of the correct
description in the blank at the left.
Column I
1. adaptation
2. climate
3. El Niño
4. temperate zones
5. seasons
6. hibernation
7. polar zones
8. greenhouse effect
9. global warming
10. tropics
11. deforestation
Ass
essm
ent
Column II
a. the pattern of weather in a region
b. the region that extends from the poles to 66 1/2° northand south latitudes
c. any structure or behavioral feature that helps anorganism survive in its environment
d. short-term periods of climate change caused by variationsin daylight, temperature, and weather patterns
e. a climate event that starts in the tropical Pacific Oceanand sets off changes in the atmosphere
f. the region that receives the most solar radiationbecause the sun shines almost directly overhead
g. rise in the average global surface temperature
h. destroying and cutting down of trees
i. natural heating process of Earth caused by gases trapping heat in the atmosphere
j. a period of reduced activity that some mammalsundergo in the winter
k. areas between tropics and polar zones
Part B. Concept Review
Directions: Answer the following questions on the lines provided.
1. Describe how the Koppen system classifies climate.
2. List four of the classifications used in the Köppen climate classification system.
Chapter Review
Cop
yrig
ht ©
Gle
ncoe
/McG
raw
-Hill
,a d
ivis
ion
of t
he M
cGra
w-H
ill C
ompa
nies
,Inc
.
Name Date Class
Chapter Review (continued)
38 Climate
3. Describe how El Niño affects the climate.
4. How do spiny leaves help a cactus survive in the desert?
5. Explain the difference between the greenhouse effect and global warming. Does one have any-thing to do with the other? Explain.
6. How has Earth’s climate changed in the past?
7. How do mountains affect the climate of nearby areas?
8. Explain how humans add carbon dioxide to the atmosphere and how they can reduce theamount of carbon dioxide in the atmosphere.
Assessm
ent
Cop
yrig
ht ©
Gle
ncoe
/McG
raw
-Hill
,a d
ivis
ion
of t
he M
cGra
w-H
ill C
ompa
nies
,Inc
.
Name Date Class
44 Climate
City HeatSection FocusTransparency Activity11
Transparen
cy Activities
Have you ever gone from the country into a city and noticed thatthe temperature felt warmer? Streets lined with buildings and largeasphalt parking lots can actually have an effect on the temperature.The map below shows heat levels in different parts of a large city.Reds and yellows show where the temperatures are higher, and bluesand greens show cooler temperatures.
1. What areas of this picture are hot? What areas are cooler?
2. What features might you find in the red areas? What differentcharacteristics would you expect to find in the blue and greenareas?
3. If you were planning a city, what features would you include?
Cop
yrig
ht ©
Gle
ncoe
/McG
raw
-Hill
,a d
ivis
ion
of t
he M
cGra
w-H
ill C
ompa
nies
,Inc
.
Climate 45
Name Date Class
Where are we?Section FocusTransparency Activity22
Tran
spar
ency
Act
ivit
ies
You can drive around this place in just a few hours, but as you ride,you travel through many different climates. Cool mountains, drydeserts, tropical rainforests, and brilliant beaches are all just aroundthe corner. So where are we?
1. Describe the climates you see in these four pictures.
2. How is it possible to have snow close to a desert?
3. In general, what physical features do you think affect climate?
Cop
yrig
ht ©
Gle
ncoe
/McG
raw
-Hill
,a d
ivis
ion
of t
he M
cGra
w-H
ill C
ompa
nies
,Inc
.
Name Date Class
46 Climate
Informative FruitSection FocusTransparency Activity33
Transparen
cy Activities
Up-to-the minute weather and climate information is used to plan a day’s events or to know when to take cover from a storm. However,information about Earth’s past climate is also very useful to scientists.Ice cores, fossils, and sediments provide a lot of data about the climatelong ago, but what about grapes? One study used the recorded datesof the French grape harvest to infer summer temperatures in Parisbetween 1370 and 1879!
1. How might scientists use information about Earth’s past climate?
2. What factors might affect temperature?
Cop
yrig
ht ©
Gle
ncoe
/McG
raw
-Hill
,a d
ivis
ion
of t
he M
cGra
w-H
ill C
ompa
nies
,Inc
.
Name Date Class
Climate 47
Climate ClassificationSystem
Tran
spar
ency
Act
ivit
ies
Teaching TransparencyActivity22
90°N
60°N
30°N
0°
30°S
60°S
90°S
Tro
pic
al w
et
Tro
pic
al w
et &
dry
Trop
ical
Sem
iari
d
Ari
d
Dry
Mar
ine
wes
t co
ast
Med
iter
ran
ean
Hu
mid
su
btr
op
ical
Mild
Tun
dra
Icec
ap
Pola
r
War
m s
um
mer
Co
ol s
um
mer
Sub
arct
ic
Cont
inen
tal
Hig
hla
nd
s
Up
lan
ds
Hig
h El
evat
ion
90°N
60°N
30°N
0°
30°S
60°S
90°S
48 Climate
Cop
yrig
ht ©
Gle
ncoe
/McG
raw
-Hill
,a d
ivis
ion
of t
he M
cGra
w-H
ill C
ompa
nies
,Inc
.
Name Date Class
Teaching Transparency Activity (continued)
1. Define climate.
2. Wladimir Köppen, a climatologist, developed a climate classification system in 1918. What twoelements did Köppen base his system on?
3. What allows organisms to survive in certain climates? Give an example.
4. What type of climate does the southeastern United States have?
5. Why does western Europe have a warmer climate than eastern Canada when these two areasare at the same latitude?
Transparen
cy Activities
Cop
yrig
ht ©
Gle
ncoe
/McG
raw
-Hill
,a d
ivis
ion
of t
he M
cGra
w-H
ill C
ompa
nies
,Inc
.
Name Date Class
Climate 49
Climate
Tran
spar
ency
Act
ivit
ies
AssessmentTransparency Activity
Directions: Carefully review the picture and answer the following questions.
1. Which organism can probably most efficiently handle beingexposed to the sunlight and heat?A cactus B girl C lizard D snake
2. The most likely benefit of a desert snake’s behavioral adaptation asshown in the picture is to ___.F keep it cool during the dayG hide from predatorsH surprise attack its preyJ get enough rest
3. When a human’s body temperature rises too high, the body produces sweat. Which of these is most likely the main purpose of this structural adaptation?A To clean the body of dirtB To cure illnessC To save energyD To cool the body