One Righter Parkway Suite 3200 Wilmington, DE 19803 (302) 477-6000 www.DuPontCapital.com Page 1 GLOBAL EQUITY OUTLOOK SECOND QUARTER 2018 Lode Devlaminck, Managing Director, Equities Andrew Smith, Associate Portfolio Manager and Senior Equity Analyst ❖ Leading economic and market indicators are starng to move in opposite direcons from coincident indicators, creang uncertainty and confusion in equity markets. ❖ For equity markets to move higher, you have to believe we are mid cycle rather than late cycle. ❖ With most economic traffic lights flashing green, it is hard to see a recession on the near-term horizon. ❖ Macro data are retreang from very high levels, but are sll supporve of healthy earnings growth. As a result, we maintain a pro-cyclical stance. However, we cannot be blind to the stronger than expected near-term headwinds we are facing in the form of rising trade concerns, soſter economic data, rising rates, and higher volality. ❖ We expect volality to persist, so adding exposure to style characteriscs, like quality, free cash flow, and especially profitability makes sense to us. GLOBAL EQUITIES APRIL 2018
Transcript
One Righter Parkway Suite 3200 Wilmington, DE 19803 (302) 477-6000 www.DuPontCapital.com Page 1
GLOBAL EQUITY OUTLOOK SECOND QUARTER 2018
Lode Devlaminck, Managing Director, Equities Andrew Smith, Associate Portfolio Manager and Senior Equity Analyst
❖ Leading economic and market indicators are starting to move in opposite directions from coincident indicators, creating uncertainty and confusion in equity markets.
❖ For equity markets to move higher, you have to believe we are mid cycle rather than late cycle.
❖ With most economic traffic lights flashing green, it is hard to see a recession on the near-term horizon.
❖ Macro data are retreating from very high levels, but are still supportive of healthy earnings growth. As a result, we maintain a pro-cyclical stance. However, we cannot be blind to the stronger than expected near-term headwinds we are facing in the form of rising trade concerns, softer economic data, rising rates, and higher volatility.
❖ We expect volatility to persist, so adding exposure to style characteristics, like quality, free cash flow, and especially profitability makes sense to us.
GLOBAL EQUITIES APRIL 2018
One Righter Parkway Suite 3200 Wilmington, DE 19803 (302) 477-6000 www.DuPontCapital.com Page 2
GLOBAL EQUITY OUTLOOK APRIL 2018
For those old enough to remember, “Land of Confusion” was a mid-‘80s political protest song by the band Genesis. The song, well-known for its music video featuring cartoonish puppets, questioned the wisdom of world leaders at a time of geopolitical turmoil. Not unlike today, people perceived the era to be confusing. The song’s release coincided with the comprehensive Tax Reform Act in late 1986, when American de-industrialization and a weakening U.S. dollar were major preoccupations. The calendar also featured the Reykjavik Summit between Presidents Reagan and Gorbachev on nuclear missile de-escalation, which, at least initially, ended in a disappointing deadlock.
Broad historical parallels aside, equity markets have started to resemble a Land of Confusion recently, with conflicting signals pointing in different directions. Optimism is waning and valuation momentum is following suit. In our assessment, this confusion stems primarily from leading indicators of economic and market activity that are starting to move in the opposite direction of coincident indicators, a phenomenon not unheard of in the later stages in the economic cycle. Figure 1 itemizes the different leading and coincident Conference Board Economic Indicators.
Some strategists are focusing on leading indicators that seem to be peaking, while economists and analysts point to the economic expansion apparent in coincident indicators. Whether you want to double up or double down on equities, you can find reputable data to support your position. Confirmation bias is available in either direction, setting the stage for an emotional tug-of-war.
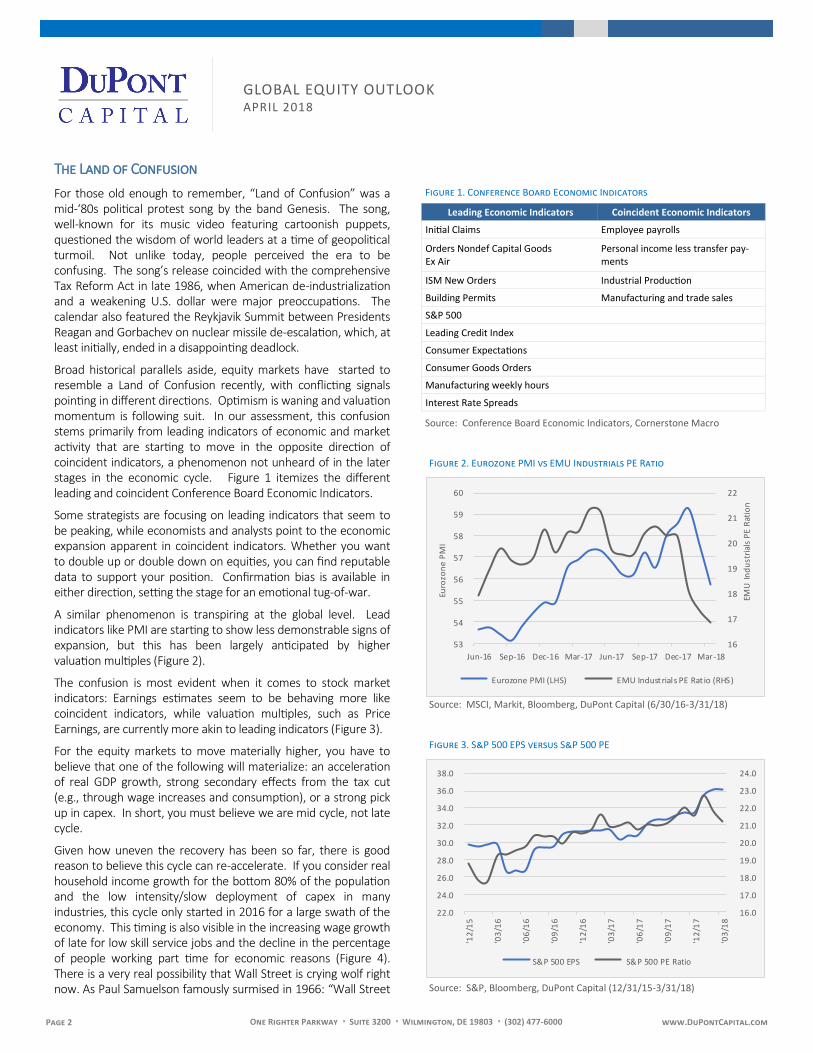
A similar phenomenon is transpiring at the global level. Lead indicators like PMI are starting to show less demonstrable signs of expansion, but this has been largely anticipated by higher valuation multiples (Figure 2).
The confusion is most evident when it comes to stock market indicators: Earnings estimates seem to be behaving more like coincident indicators, while valuation multiples, such as Price Earnings, are currently more akin to leading indicators (Figure 3).
For the equity markets to move materially higher, you have to believe that one of the following will materialize: an acceleration of real GDP growth, strong secondary effects from the tax cut (e.g., through wage increases and consumption), or a strong pick up in capex. In short, you must believe we are mid cycle, not late cycle.
Given how uneven the recovery has been so far, there is good reason to believe this cycle can re-accelerate. If you consider real household income growth for the bottom 80% of the population and the low intensity/slow deployment of capex in many industries, this cycle only started in 2016 for a large swath of the economy. This timing is also visible in the increasing wage growth of late for low skill service jobs and the decline in the percentage of people working part time for economic reasons (Figure 4). There is a very real possibility that Wall Street is crying wolf right now. As Paul Samuelson famously surmised in 1966: “Wall Street
Eurozone PMI (LHS) EMU Industrials PE Rat io (RHS)
Source: MSCI, Markit, Bloomberg, DuPont Capital (6/30/16-3/31/18)
Figure 3. S&P 500 EPS versus S&P 500 PE
Source: S&P, Bloomberg, DuPont Capital (12/31/15-3/31/18)
16.0
17.0
18.0
19.0
20.0
21.0
22.0
23.0
24.0
22.0
24.0
26.0
28.0
30.0
32.0
34.0
36.0
38.0
'12
/15
'03
/16
'06
/16
'09
/16
'12
/16
'03
/17
'06
/17
'09
/17
'12
/17
'03
/18
S&P 500 EPS S&P 500 PE Ratio
One Righter Parkway Suite 3200 Wilmington, DE 19803 (302) 477-6000 www.DuPontCapital.com Page 3
GLOBAL EQUITY OUTLOOK APRIL 2018
indexes predicted nine out of the last five recessions!”
With most economic traffic lights, like the yield curve, job creation, housing dynamics, and ISM manufacturing activity, still glowing green, it is hard to see a recession near-term. However, because we have seen a growing disconnect between the equity market and the economy as witnessed, for example, by the negative correlation between stock market wealth and consumer spending, good news for Main Street may not necessarily be good news for Wall Street.
Some of the market indicators we suggest watching more closely are a shift in the relative performance of cyclicals versus defensives (industrials versus consumer), the widening of high yield credit spreads, the shape of the yield curve, and any deterioration of household/business confidence indicators.
Known unknowns versus unknown unknowns
Inflation and interest rates are the biggest risk concerns for investors today. A recent survey by Cornerstone Macro found that 80% of their clients expect higher inflation to have an impact on financial markets in 2018, and 95% expect 10-year Treasuries will be flat or higher (with >50% thinking the latter). As a result, most investment strategies seem to focus on companies with pricing power or the financial sector (yield beneficiaries), while reducing exposure to bond proxies and high P/E stocks.
What if the risk for equity markets is not in the interest rates, but the expected growth rates? What if interest rates have become the known unknowns and growth rates the unknown unknowns?
As most investors have bought into the idea of a synchronized global recovery and bullish earnings outlook, we wonder if the market is becoming too complacent about the growth outlook. The underperformance of defensive bond proxy sectors relative to more cyclical sectors over the last two years suggests the current market positioning is skewed towards growth. We entered 2018 with extremely positive sentiment and confidence readings as reflected by investor sentiment, ISM New Orders, Consumer Confidence, and earnings guidance. Was the market overly focused on the positive impacts of growth, taxes, and
deregulation while dismissing economic nationalist agendas?
Besides consensus positioning, we see other reasons why risk may be in the growth numbers: (1) economic momentum is softening, (2) tighter financial conditions do not appear to be reflected in estimates, (3) part of the tax benefit will likely be competed away or deployed inefficiently, and (4) increased rhetoric around trade tariffs will be incrementally negative.
Economic and earnings momentum is softening
Some, but not all, of the recent activity prints have been weaker. The bulls on the street argue that we are just coming off elevated levels. While the economic surprise index is holding up reasonably well in the U.S., we have been seeing a marked deterioration in Europe and Japan. As economic news starts to surprise on the downside, we are more likely to see negative revisions.
Financial Conditions are tightening
Despite the stimulus measures and positive outlook, we have seen the yield curve continue to flatten and rates move higher (Figure 6). This change not only represents a headwind for
Figure 4. Working Part-Time, Wage Growth for Low Skill Service Positions
Source: Bureau of Labor Statistics, Empirical Research Partners Analysis
Figure 5. Citigroup Economic Surprise Index (CESI)
Source: Citigroup, Bloomberg, DuPont Capital (12/31/14-3/31/18)
0.5
1.0
1.5
2.0
2.5
3.0
3.5
4.0
4.5
2.0
2.5
3.0
3.5
4.0
4.5
5.0
5.5
6.0
6.5
03 04 05 06 07 08 09 10 11 12 13 14 15 16 17 18
Wag
e G
row
th fo
r Lo
w-S
kil
l S
erv
ice
Po
siti
on
s
Wo
rkin
g P
art-
tim
e fo
r Ec
on
om
ic R
easo
ns
Working Part-Time for Economic ReasonsWage Growth for Low-Skill Service Positions
Figure 6. U.S. 10-2 Year Yield Curve
Source: Bloomberg, DuPont Capital (1/1/08-3/31/18)
(100)
(80)
(60)
(40)
(20)
-
20
40
60
80
100
'15 '16 '17 '18
U.S. Europe Japan EM
-
50
100
150
200
250
300
'08 '09 '10 '11 '12 '13 '14 '15 '16 '17 '18
One Righter Parkway Suite 3200 Wilmington, DE 19803 (302) 477-6000 www.DuPontCapital.com Page 4
GLOBAL EQUITY OUTLOOK APRIL 2018
financial profits, but also highlights that the bond market thinks we are either late cycle and/or there will be little inflation or growth acceleration.
We are also seeing mortgage rates increase on the back of higher Treasury yields (Figure 7). While we think high consumer confidence and the strength of the job market are currently compensating for the higher cost of financing, we do not see many analysts incorporating this headwind into their estimates (touchstones here include the outlook for housing demand and marginal propensity to consume on ‘big ticket’ items).
All else being equal, higher rates ultimately warrant lower valuation multiples in the equity markets.
Tax Reform: No panacea for all
Equity markets care less about bottom line growth than revenues or operating profit margins, especially at this stage of the cycle. Case in point, earnings estimates saw a big jump after the new U.S. tax bill passed, but equity markets did not follow, as seen in Figure 3. While it is likely that the markets had already
anticipated higher estimates, there has been a simultaneous de-rating of the market of near-equal magnitude. Figure 8 shows the change in sales and earnings growth since the tax reform was enacted (2018 estimates on 09/2017 compared to 02/2018).
While currency fluctuations and oil prices have had an impact on earnings estimates, tax reform influenced estimates the most between September 2017 and February 2018. Figure 8 shows that tax reform has had a disproportionate impact on earnings for financials, telecoms, staples, and industrials. The chart also shows that tax reform has not yet had a positive impact on operating performance. We believe it will take time for secondary effects to work their way through the system.
Sectors like financials, staples and utilities have actually seen very slow or negative top line revisions, indicating they are facing a more challenging operating environment.
It is not the tax benefit itself that will drive returns, but how the extra cash is redeployed. Accretive capital allocation in the form of capital returns or genuine growth capex will ultimately flow back to shareholders, but structurally challenged companies (retail) or highly competitive industries (financials) will likely pass the benefit on to other stakeholders. It will probably take several quarters for any effects to be reflected in earnings estimates or valuations, but we see limited scope for tax policy alone to radically alter the competitive landscape, innovation hierarchies, or disruptive threats within and across most industries.
Mounting political risks
The sell-off in February was driven by a spike in volatility and inflation expectations feeding into interest rates projections. However international trade tariffs and technology drove markets down in March. As seen in Figure 9, global policy uncertainty has recently ticked back up after coming off the extreme levels of the Brexit vote and US elections in 2016.
As mentioned in our thought piece on Merger Arbitrage, we are seeing mounting political/regulatory risks in the M&A landscape
Figure 7. 30-Year Mortgage Rates (U.S.)
Source: Bankrate.com, Bloomberg, DuPont Capital (1/31/16-1/31/18)
Figure 8. Change in S&P 500 Earnings and Sales Growth
Source: S&P, Bloomberg (between September 2017 and February 2018)
Figure 9. Global Economic Uncertainty Index (With Current Price GDP Weight)
Source: Bloomberg, DuPont Capital (12/31/12-3/31/18)
50
100
150
200
250
300
12/
12
03/
13
06/
13
09/
13
12/
13
03/
14
06/
14
09/
14
12/
14
03/
15
06/
15
09/
15
12/
15
03/
16
06/
16
09/
16
12/
16
03/
17
06/
17
09/
17
12/
17
03/
18
Monthly 12 Month Moving Average
One Righter Parkway Suite 3200 Wilmington, DE 19803 (302) 477-6000 www.DuPontCapital.com Page 5
GLOBAL EQUITY OUTLOOK APRIL 2018
(e.g., the AT&T / Time Warner deal). Optimistic observers argue the launch of trade tariffs are negotiating tactics, but they are creating less business friendly precedents. We are not hopeful that the rhetoric will quiet any time soon, as recent changes to the US administration leave us with fewer moderates in the room.
In our view, an escalating trade war between the U.S. and China would be chronically worrisome. The equity market has been supported by, and is sensitive to, corporate profit margins. Empirical Research Partners estimates that the strong manufacturing margin expansion between 2000 and 2015 was driven by wage savings from offshoring and domestic efficiency, a decline in interest rates, and lower effective tax rates (due to offshoring and re-domiciling). Protectionist policies could jeopardize these structural components of profitability.
Here again, all else being equal, higher volatility and uncertainty warrants lower valuation multiples.
Conclusion
There are clearly more reasons to be vigilant, but we do not think running for the hills is the right strategy. Global synchronized growth is the backbone of our positive view on equities with risks to growth, inflation, and policy rates skewed to the upside.
Macro data are retreating from very high levels, but remain supportive of healthy earnings growth. As a result, we suggest maintaining a pro-cyclical stance. However, we cannot be blind to the fact that we are facing stronger than expected near-term headwinds in the form of rising trade concerns, softer economic data, rising rates, and higher volatility. For Europe and Japan, we can add stronger currencies relative to the USD to the mix.
All else being equal, these headwinds lead to a higher equity risk premium and lower valuation multiples. While higher growth is likely or possible, it may well be required to compensate for a
higher equity risk premium.
Given where we are in the cycle and the more aggressive global trade rhetoric, we expect volatility to persist, so adding exposure to style characteristics, like quality, abundant free cash flow, and especially profitability, seems prudent.
From a geographic perspective, we remain positively biased towards Europe. Most of Europe’s multi-year underperformance (relative to the U.S.) can be explained by its structural economic and earnings growth deficit, technology’s smaller index weight and compositional impact in the region, and persistent net equity issuance (in contrast to widespread share buybacks in the U.S.).
At the same time that we believe the structural advantages of the U.S. have become less pronounced, the Eurozone has better cyclical tailwinds. As such, we prefer more domestically oriented cyclical exposure, primarily in Europe and Japan.
One long-term theme across a broad range of industries that continues to gain traction from a company-level perspective is the operational adoption and strategic deployment of digital technologies. The potential for the Internet of Things (IoT), big data, and, ultimately, artificial intelligence, to transform existing business models, revenue streams, cost structures, and client experiences is increasingly acknowledged. According to PWC’s Digital IQ survey (2017)1, more than 40% of executives believe the IoT will present disruptive threats and opportunities to their addressable markets, and many plan to invest accordingly. However, this inclination to invest coincides with a loss of self-confidence in their assessment of their company’s digital competency. The last two iterations of the survey have seen the percentage of companies that rate their own Digital IQ as “strong” fall from two-thirds (67%) to half (52%). As executives grapple with this “the more I see, the less I know” phenomenon, it seems that the Land of Confusion metaphor may increasingly ring true from a bottom-up perspective.
Figure 10. Drivers of S&P 500 Manufacturers Margin Expansion (2015 vs 2000)
Source: U.S. Bureau of Labor Statistics, U.S. Census Bureau, Corporate Reports, Empirical Research Partners Analysis. 1 Assumes that the lost U.S. jobs were replaced one-for-one by jobs in China at lower rates of compensation. 2 Assumes the decline in the labor intensity of these plants matches that for the entire U.S. manufacturing system.
Wage Savings from
Offshoring
Decline in Effective Tax
Rate
More Efficient Domestic
Plants
Lower Interest Rates
One Righter Parkway Suite 3200 Wilmington, DE 19803 (302) 477-6000 www.DuPontCapital.com Page 6
GLOBAL EQUITY OUTLOOK APRIL 2018
Important Disclosures:
Sources: PWC “2017 Global Digital IQ Survey: 10th Anniversary Edition” Annual Survey. 2017.
The information contained in this memorandum is intended for the sole use of understanding and evaluating the impact of market events and is not designed or intended to be used for any other purpose. The document may contain forward-looking statements, which are based on current opinions, expectations and projections. DCM undertakes no obligation to update or revise any opinions or statements herein. Actual results could differ materially from those anticipated in forward-looking statements. Information contained herein has been obtained from sources believed to be reliable, but DCM does not guarantee the accuracy, adequacy or completeness of such information. An investment in securities includes risk of loss. There is no guarantee that any investment in the securities mentioned will be profitable. Past performance is no guarantee of future results.
This document is not intended as an offer or solicitation for the purchase or sale of any security or financial instrument or as a recommendation to invest in any of the securities or financial instruments discussed herein. Registration of an investment adviser with the SEC does not imply any level of skill or training. No part of this presentation may be reproduced in any form.
About our firm:
DuPont Capital has a long history of institutional asset management. Our parent company, DuPont (a wholly owned subsidiary of DowDuPont) established a retirement pension plan for employees in 1942, and in 1975 created a separate pension management division.
In 1993, DuPont Capital was established and became an SEC registered investment advisor. We share our parent company’s history of innovation and, over the years, have been on the forefront of developing global investment opportunities in both traditional and alternative strategies across equity, fixed income, and alternative investments.
For additional information, please contact:
Mr. Timothy Sweeney Managing Director Business Development and Client Service (302) 477-6083 [email protected]
About The Authors:
Lode J. Devlaminck, Managing Director, Equities, is the lead portfolio manager for the firm’s EAFE and Global Equity strategies and a portfolio manager on the Emerging Markets Equity strategy. Mr. Devlaminck is a member of the DuPont Pension Trust Investment Committee and the DuPont Savings Plan Investment Oversight Committee. Prior to joining DuPont Capital in 2014, Mr. Devlaminck was a Senior Portfolio Manager and Sector Specialist of Global Equities at Hermes Fund Managers in Boston, Massachusetts. Mr. Devlaminck joined the investment industry in 1989. Mr. Devlaminck holds a Master’s degree in Applied Economics from the University of Antwerp, in Antwerp, Belgium.
Andrew J. Smith, CFA, Associate Portfolio Manager and Senior Equity Analyst, helps oversee the firm's Core and High Conviction International strategies. His fundamental analysis focuses on the Industrials, Materials, and Energy sectors and part of the Consumer Discretionary sector. He is also a Senior Portfolio Specialist, serving as a primary point of contact for in-depth insight on the firm’s Equity products and capabilities. Prior to joining DuPont Capital in 2015, Mr. Smith was a Portfolio Manager and Global Equity Analyst at Hermes Fund Managers. He joined the financial services industry in 1998. Mr. Smith holds a B.S. in Economics from University College London, UK, and is a CFA charterholder.