+ All Categories
Home > Documents > global advertising specialties impressions study - Promotional

global advertising specialties impressions study - Promotional

Date post: 09-Feb-2022
Category:
Upload: others
View: 2 times
Download: 0 times
Share this document with a friend
24
A cost analysis of promotional products versus other advertising media Released at the 2012 ASI Power Summit ©Copyright 2012 Advertising Specialty Institute. All Rights Reserved This report may be reproduced and used in presentations by active supplier, distributor and decorator members of the Advertising Specialty Institute (ASI) to educate the public about advertising specialties. Such use must not alter the information and must set forth the following legend: “Research provided by the Advertising Specialty Institute, ©2012, All Rights Reserved.” No other use is permitted without the express written consent of ASI. GLOBAL ADVERTISING SPECIALTIES IMPRESSIONS STUDY V.3
Transcript

A cost analysis of promotional products versus other advertising media

Released at the 2012 ASI Power Summit

©Copyright 2012 Advertising Specialty Institute. All Rights Reserved

This report may be reproduced and used in presentations by active supplier, distributor and decorator members of the Advertising Specialty Institute (ASI) to educate the public about advertising specialties. Such use must not alter the information and must set forth the following legend: “Research provided by the Advertising Specialty Institute, ©2012, All Rights Reserved.” No other use is permitted without the express written consent of ASI.

GLOBALADVERTISINGSPECIALTIESIMPRESSIONSSTUDY

V.3

2©2012 Advertising Specialty Institute®. All Rights Reserved.

Introduction . . . . . . . . . . . . . . . . . . . . . . . . . . . . . . . . . . . . . . . . . . . . . . . . . . . . . . . . . . . . . . . . . . . . . . . . . . . . . . . . . . . . . . . . . . . . . . . . 3

��Section One

Product Popularity . . . . . . . . . . . . . . . . . . . . . . . . . . . . . . . . . . . . . . . . . . . . . . . . . . . . . . . . . . . . . . . . . . . . . . . . . . . . . . . . . . . . . .4

Product Spotlight: Writing Instruments . . . . . . . . . . . . . . . . . . . . . . . . . . . . . . . . . . . . . . . . . . . . . . . . . . . . . 5

Product Spotlight: Shirts . . . . . . . . . . . . . . . . . . . . . . . . . . . . . . . . . . . . . . . . . . . . . . . . . . . . . . . . . . . . . . . . . . . . . . . . . . . . . 6

Product Spotlight: Bags . . . . . . . . . . . . . . . . . . . . . . . . . . . . . . . . . . . . . . . . . . . . . . . . . . . . . . . . . . . . . . . . . . . . . . . . . . . . . . . 7

Product Spotlight: Calendars . . . . . . . . . . . . . . . . . . . . . . . . . . . . . . . . . . . . . . . . . . . . . . . . . . . . . . . . . . . . . . . . . . . . . . .8

Product Spotlight: Desk Accessories . . . . . . . . . . . . . . . . . . . . . . . . . . . . . . . . . . . . . . . . . . . . . . . . . . . . . . . . . . . 9

Product Spotlight: Hats . . . . . . . . . . . . . . . . . . . . . . . . . . . . . . . . . . . . . . . . . . . . . . . . . . . . . . . . . . . . . . . . . . . . . . . . . . . . . .10

Product Spotlight: Drinkware . . . . . . . . . . . . . . . . . . . . . . . . . . . . . . . . . . . . . . . . . . . . . . . . . . . . . . . . . . . . . . . . . . . . . .11

Product Spotlight: USB Drives . . . . . . . . . . . . . . . . . . . . . . . . . . . . . . . . . . . . . . . . . . . . . . . . . . . . . . . . . . . . . . . . . . . . 12

Product Spotlight: Health & Safety Items . . . . . . . . . . . . . . . . . . . . . . . . . . . . . . . . . . . . . . . . . . . . . . . . . . . 13

Product Spotlight: Outerwear . . . . . . . . . . . . . . . . . . . . . . . . . . . . . . . . . . . . . . . . . . . . . . . . . . . . . . . . . . . . . . . . . . . . .14

Staying Power . . . . . . . . . . . . . . . . . . . . . . . . . . . . . . . . . . . . . . . . . . . . . . . . . . . . . . . . . . . . . . . . . . . . . . . . . . . . . . . . . . . . . . . . . . . . . 15

Not for the Garbage . . . . . . . . . . . . . . . . . . . . . . . . . . . . . . . . . . . . . . . . . . . . . . . . . . . . . . . . . . . . . . . . . . . . . . . . . . . . . . . . . . . . 16

How Many Items Do People Own? . . . . . . . . . . . . . . . . . . . . . . . . . . . . . . . . . . . . . . . . . . . . . . . . . . . . . . . . . . . . . 17

��Section Two

Recipients’ Views on Advertisers . . . . . . . . . . . . . . . . . . . . . . . . . . . . . . . . . . . . . . . . . . . . . . . . . . . . . . . . . . . . . . .18

Swaying Opinions . . . . . . . . . . . . . . . . . . . . . . . . . . . . . . . . . . . . . . . . . . . . . . . . . . . . . . . . . . . . . . . . . . . . . . . . . . . . . . . . . . . . . . . 19

Ad Specialties Generate New Business . . . . . . . . . . . . . . . . . . . . . . . . . . . . . . . . . . . . . . . . . . . . . . . . . . . . . . 20

�Section Three

Promotional Products Make an Impression . . . . . . . . . . . . . . . . . . . . . . . . . . . . . . . . . . . . . . . . . . . . . . . 21

The Cost-Effectiveness of Ad Specialties . . . . . . . . . . . . . . . . . . . . . . . . . . . . . . . . . . . . . . . . . . . . . . . . . . . .22

Demographics . . . . . . . . . . . . . . . . . . . . . . . . . . . . . . . . . . . . . . . . . . . . . . . . . . . . . . . . . . . . . . . . . . . . . . . . . . . . . . . . . . . . . . . . . . . . 23

Table of Contents

GLOBALADVERTISINGSPECIALTIESIMPRESSIONSSTUDYV.3

3©2012 Advertising Specialty Institute®. All Rights Reserved.

The ASI Ad Impressions Study was first launched in 2008 by ASI’s research team to give its members powerful data that proves that ad specialties are a high-impact and cost-effective ad medium.

Through thousands of live and online interviews with businesspeople in key cities in the United States, Canada, France and the U.K., the study gauges consumer perceptions of promotional products and how they influence buying decisions; highlights the popularity of key promo product categories by demographic group (such as age, race and gender); reveals the cost-per-impression of top advertising specialty product categories; and shows the cost-per-impression of promotional products compared to other forms of advertising media, like radio, TV and Internet advertising. The study is conducted by ASI every two years.

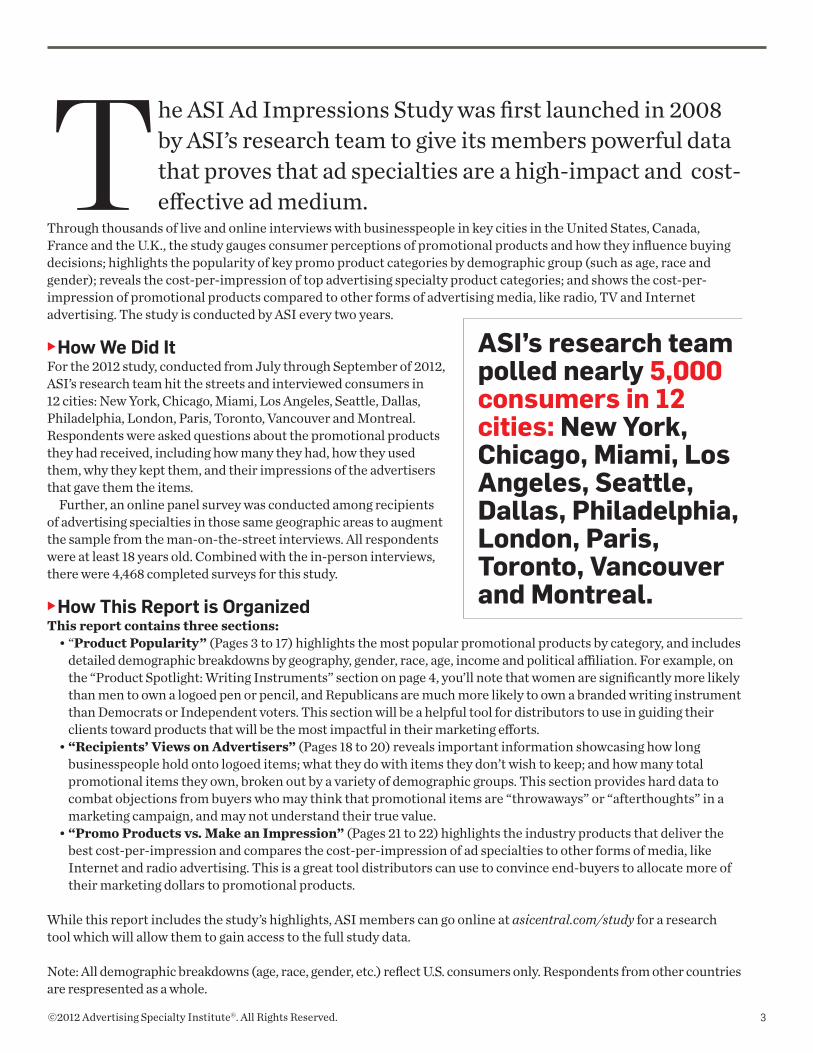
How We Did It For the 2012 study, conducted from July through September of 2012, ASI’s research team hit the streets and interviewed consumers in 12 cities: New York, Chicago, Miami, Los Angeles, Seattle, Dallas, Philadelphia, London, Paris, Toronto, Vancouver and Montreal. Respondents were asked questions about the promotional products they had received, including how many they had, how they used them, why they kept them, and their impressions of the advertisers that gave them the items.

Further, an online panel survey was conducted among recipients of advertising specialties in those same geographic areas to augment the sample from the man-on-the-street interviews. All respondents were at least 18 years old. Combined with the in-person interviews, there were 4,468 completed surveys for this study.

How This Report is OrganizedThis report contains three sections:

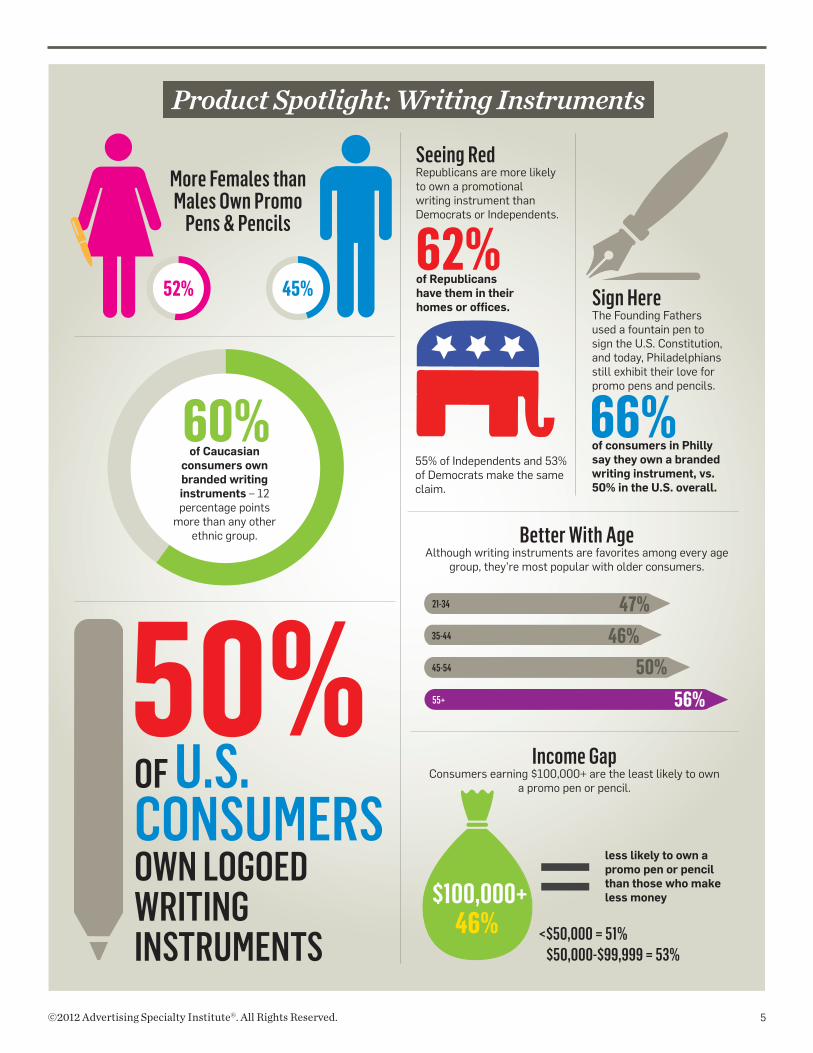
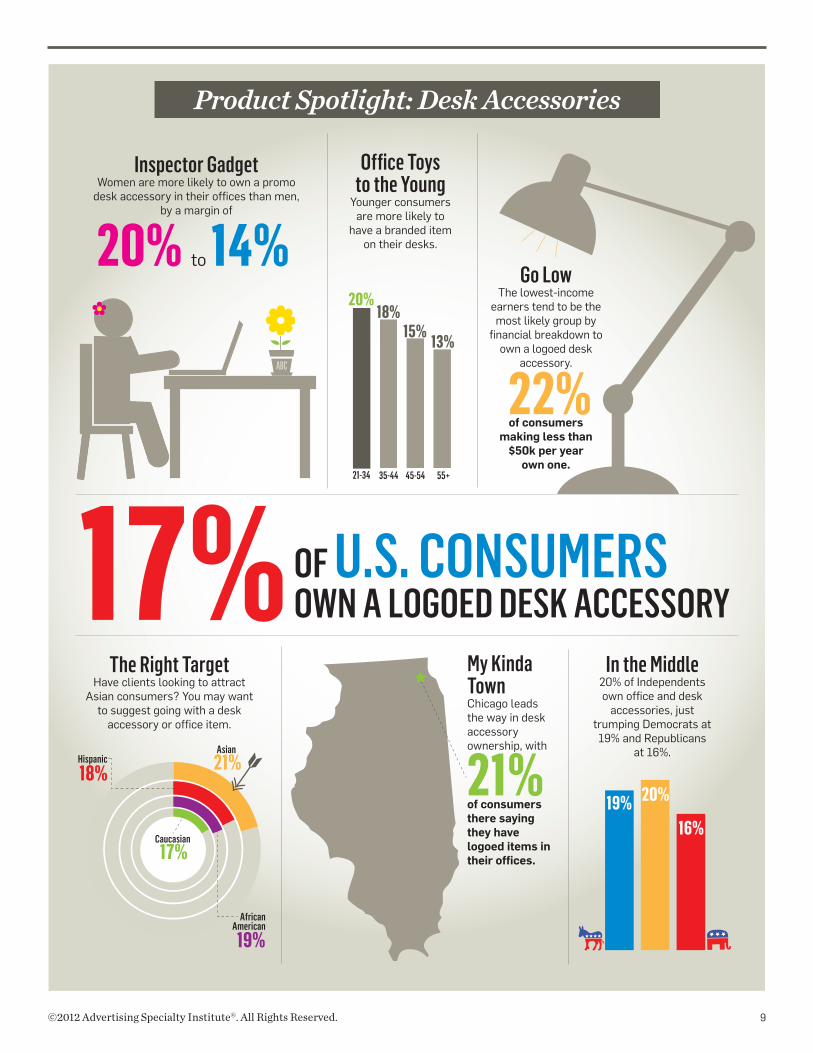
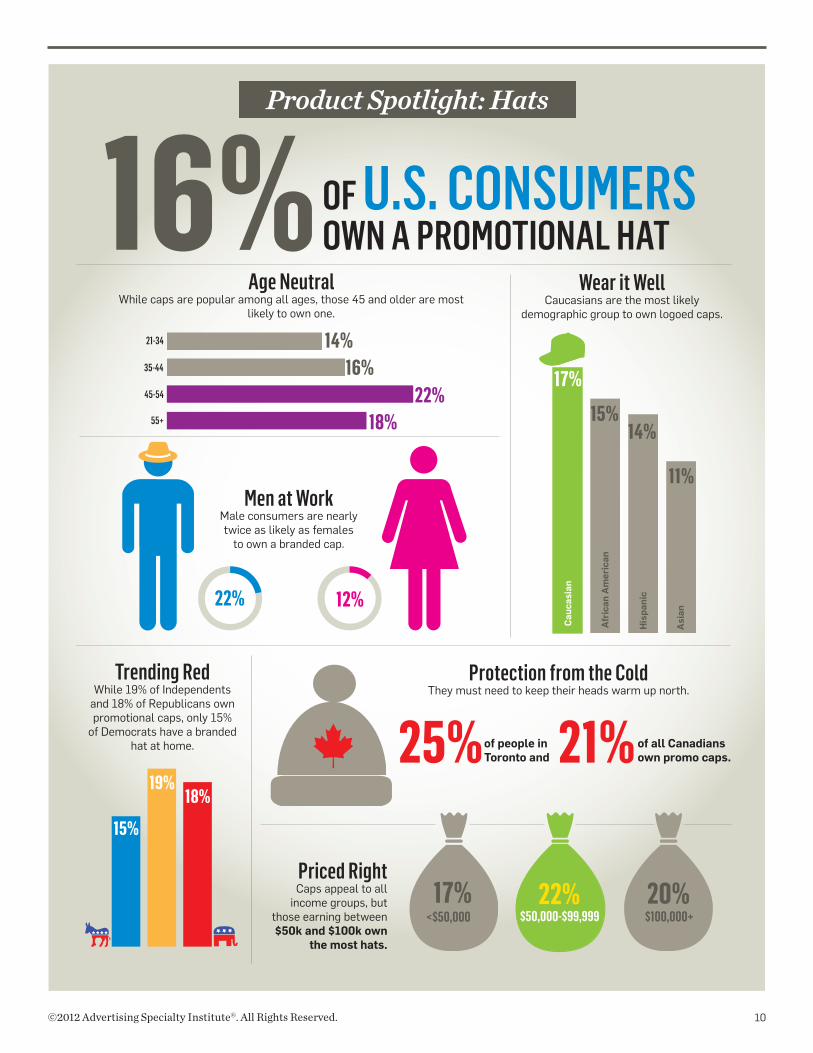
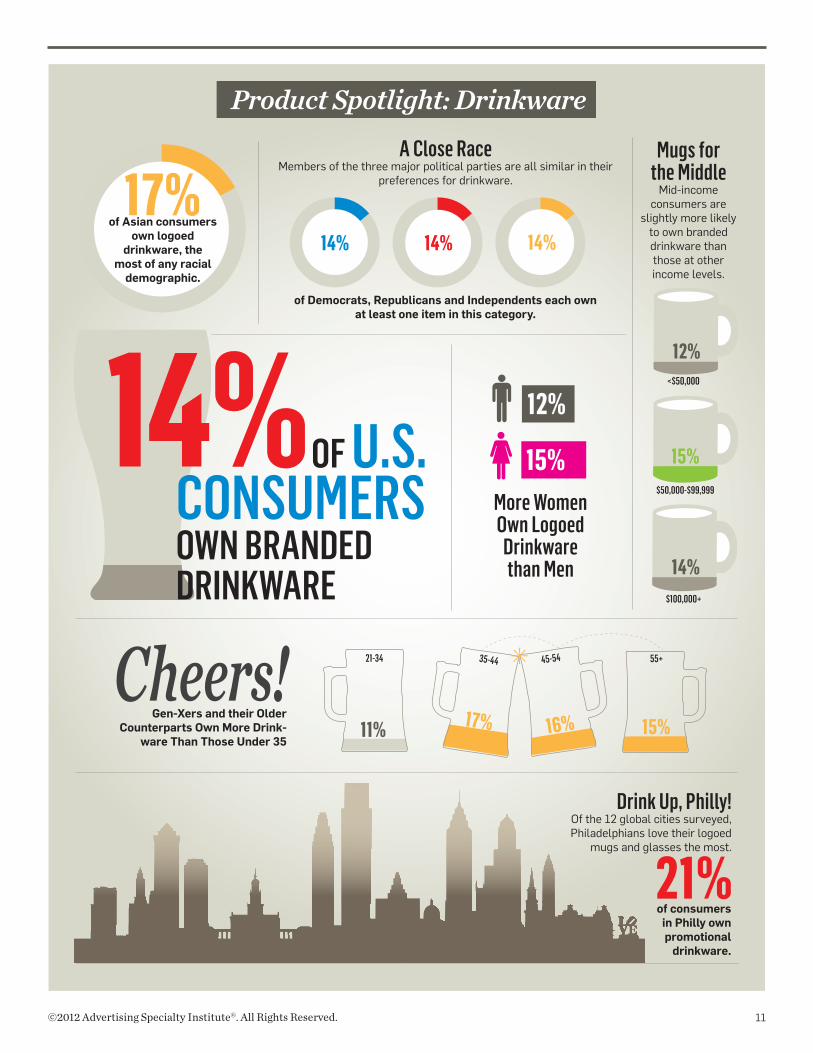
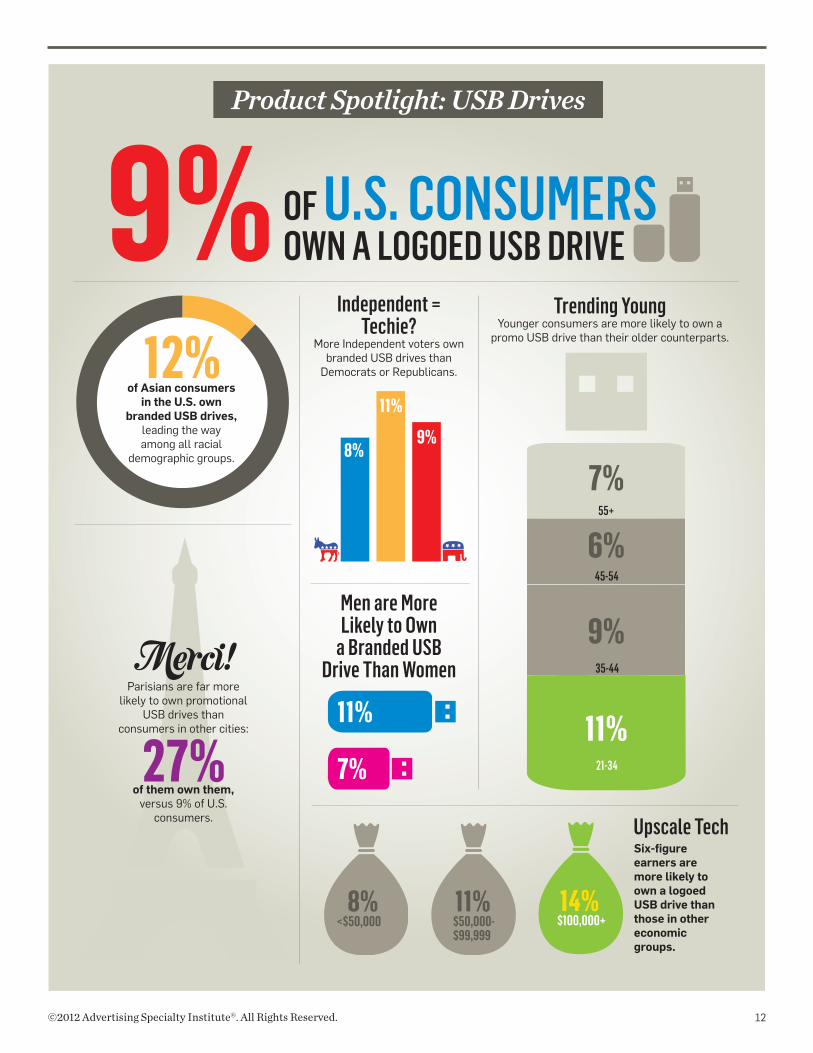
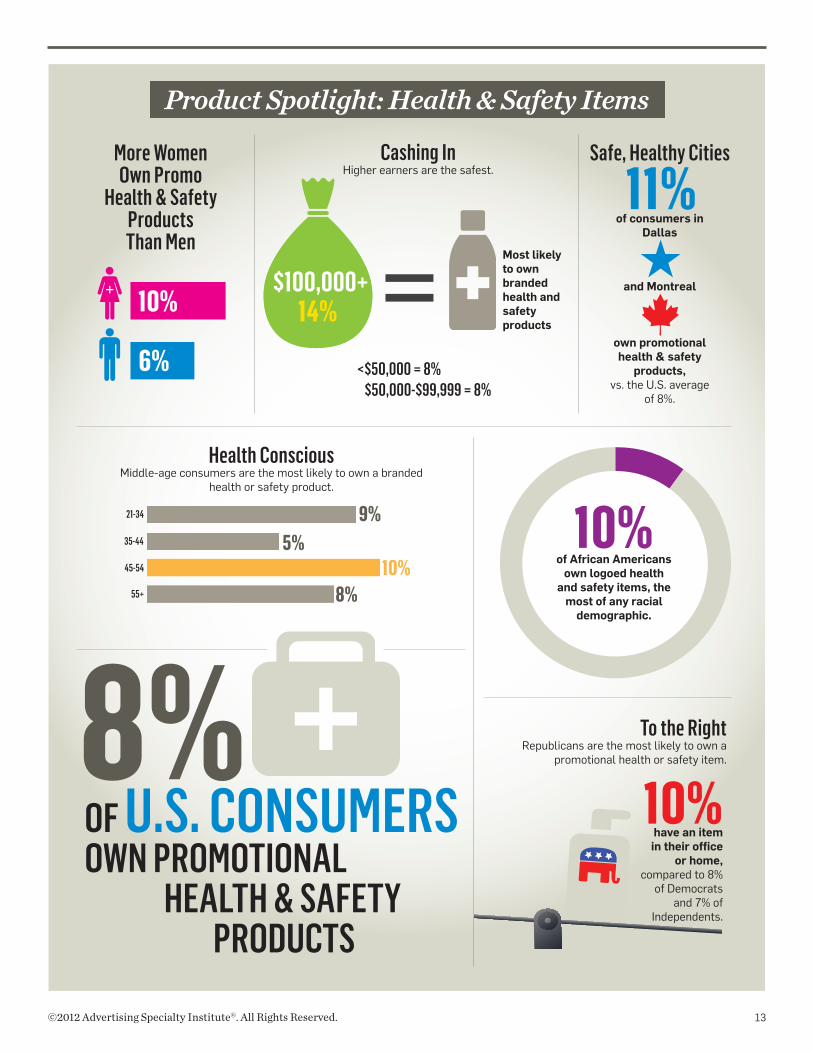
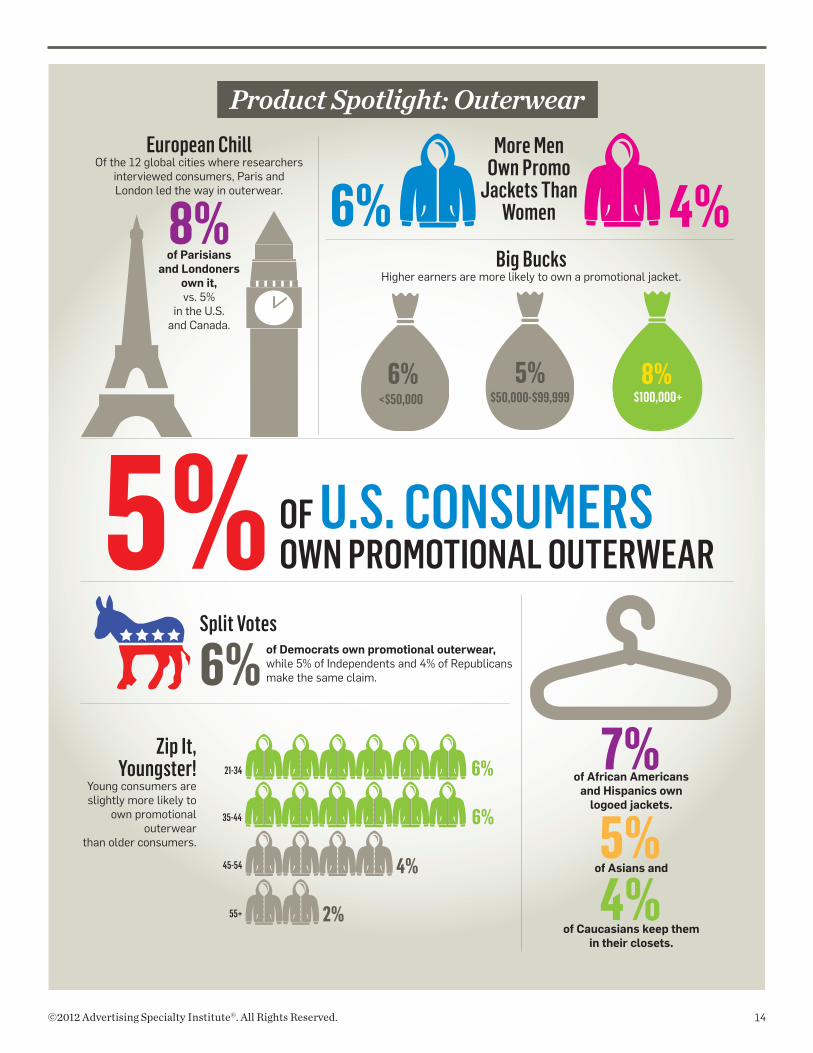
• “Product Popularity” (Pages 3 to 17) highlights the most popular promotional products by category, and includes detailed demographic breakdowns by geography, gender, race, age, income and political affiliation. For example, on the “Product Spotlight: Writing Instruments” section on page 4, you’ll note that women are significantly more likely than men to own a logoed pen or pencil, and Republicans are much more likely to own a branded writing instrument than Democrats or Independent voters. This section will be a helpful tool for distributors to use in guiding their clients toward products that will be the most impactful in their marketing efforts.

• “Recipients’ Views on Advertisers” (Pages 18 to 20) reveals important information showcasing how long businesspeople hold onto logoed items; what they do with items they don’t wish to keep; and how many total promotional items they own, broken out by a variety of demographic groups. This section provides hard data to combat objections from buyers who may think that promotional items are “throwaways” or “afterthoughts” in a marketing campaign, and may not understand their true value.

• “Promo Products vs. Make an Impression” (Pages 21 to 22) highlights the industry products that deliver the best cost-per-impression and compares the cost-per-impression of ad specialties to other forms of media, like Internet and radio advertising. This is a great tool distributors can use to convince end-buyers to allocate more of their marketing dollars to promotional products.

While this report includes the study’s highlights, ASI members can go online at asicentral.com/study for a research tool which will allow them to gain access to the full study data.

Note: All demographic breakdowns (age, race, gender, etc.) reflect U.S. consumers only. Respondents from other countries are respresented as a whole.

ASI’s research team polled nearly 5,000 consumers in 12 cities: New York, Chicago, Miami, Los Angeles, Seattle, Dallas, Philadelphia, London, Paris, Toronto, Vancouver and Montreal.

4©2012 Advertising Specialty Institute®. All Rights Reserved.

Section One

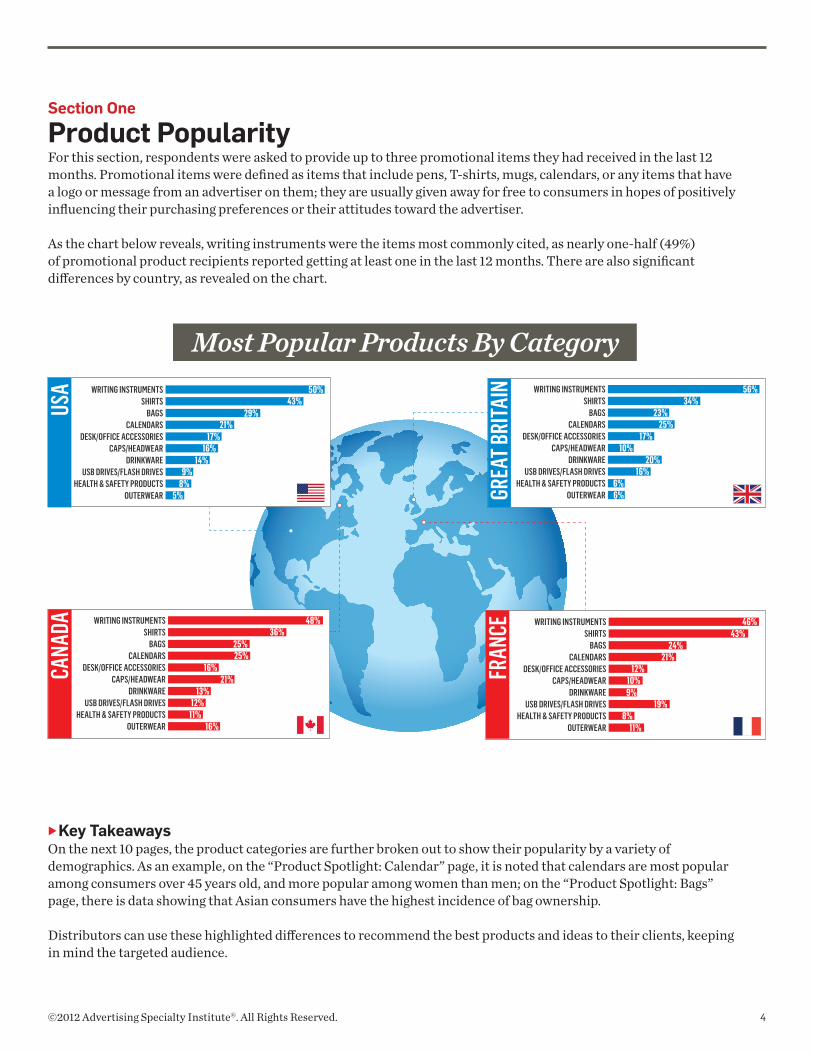
Product PopularityFor this section, respondents were asked to provide up to three promotional items they had received in the last 12 months. Promotional items were defined as items that include pens, T-shirts, mugs, calendars, or any items that have a logo or message from an advertiser on them; they are usually given away for free to consumers in hopes of positively influencing their purchasing preferences or their attitudes toward the advertiser.

As the chart below reveals, writing instruments were the items most commonly cited, as nearly one-half (49%) of promotional product recipients reported getting at least one in the last 12 months. There are also significant differences by country, as revealed on the chart.

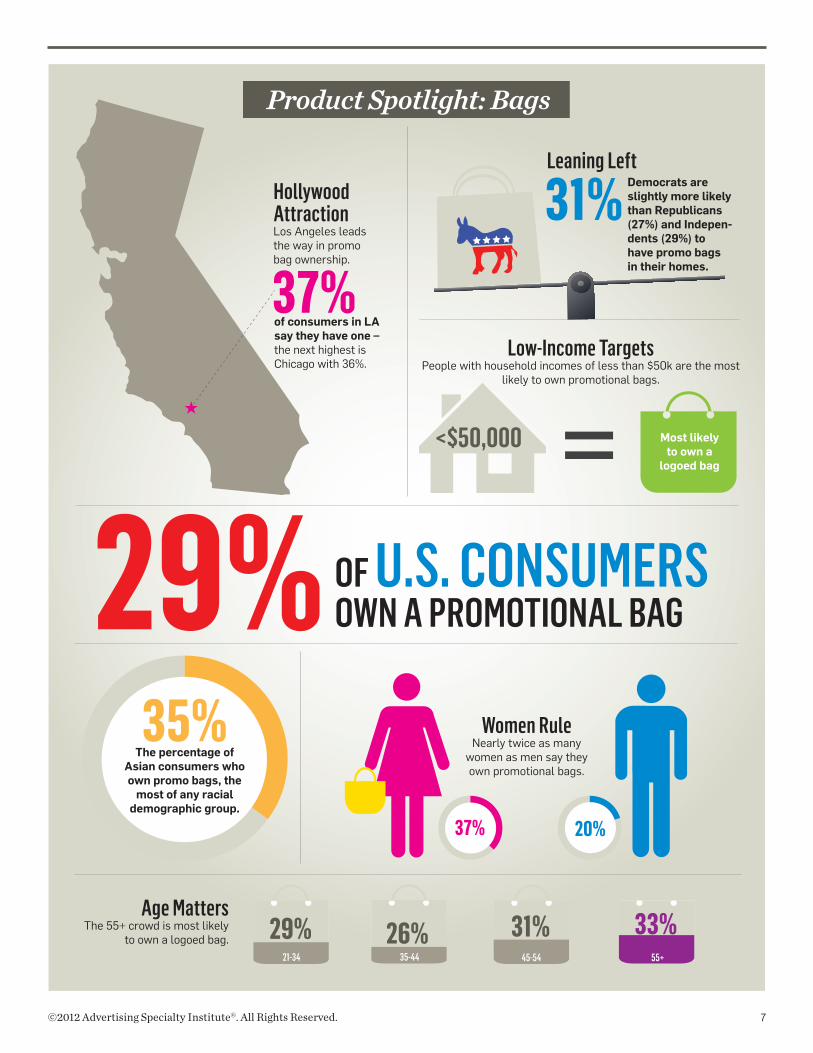
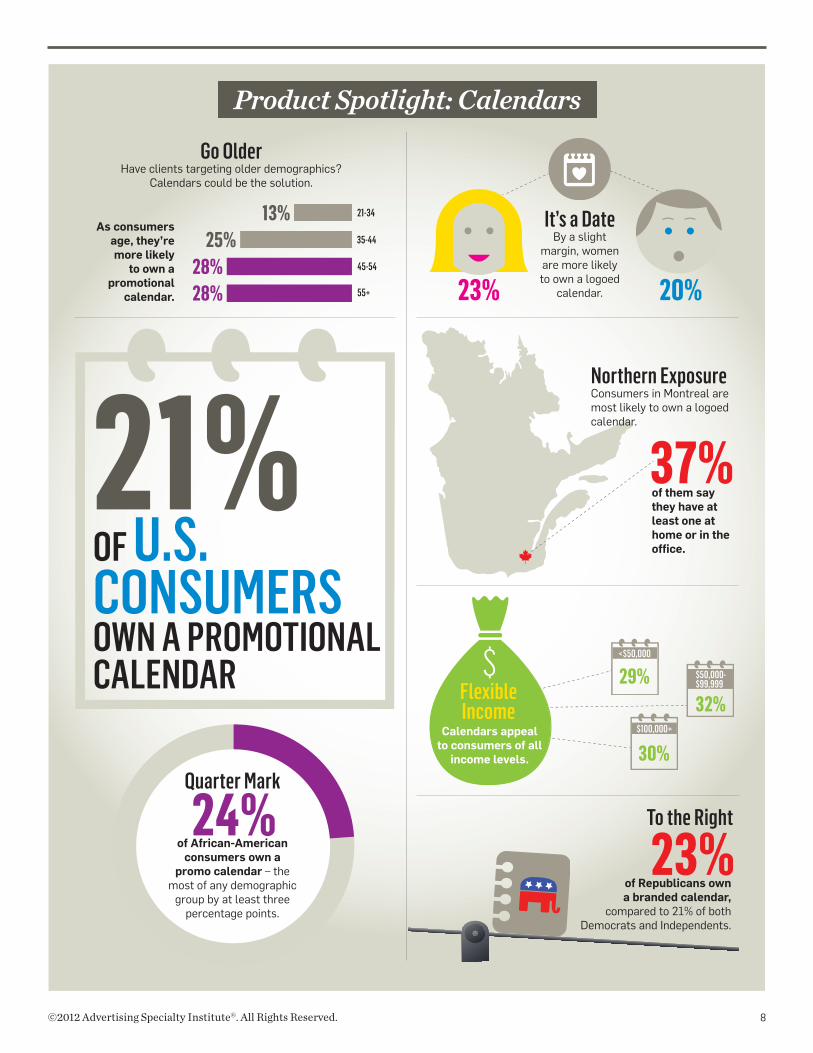
Key TakeawaysOn the next 10 pages, the product categories are further broken out to show their popularity by a variety of demographics. As an example, on the “Product Spotlight: Calendar” page, it is noted that calendars are most popular among consumers over 45 years old, and more popular among women than men; on the “Product Spotlight: Bags” page, there is data showing that Asian consumers have the highest incidence of bag ownership.

Distributors can use these highlighted differences to recommend the best products and ideas to their clients, keeping in mind the targeted audience.

5.8

WRITING INSTRUMENTSSHIRTS

BAGSCALENDARS

DESK/OFFICE ACCESSORIESCAPS/HEADWEAR

DRINKWAREUSB DRIVES/FLASH DRIVES

HEALTH & SAFETY PRODUCTSOUTERWEAR

50%43%

29%21%

17%16%

14%9%

8%5%

USA

5.8

WRITING INSTRUMENTSSHIRTS

BAGSCALENDARS

DESK/OFFICE ACCESSORIESCAPS/HEADWEAR

DRINKWAREUSB DRIVES/FLASH DRIVES

HEALTH & SAFETY PRODUCTSOUTERWEAR

48%36%

25%25%

16%21%

13%12%

11%16%

CANA

DA

GREA

T BRI

TAIN

5.8

WRITING INSTRUMENTSSHIRTS

BAGSCALENDARS

DESK/OFFICE ACCESSORIESCAPS/HEADWEAR

DRINKWAREUSB DRIVES/FLASH DRIVES

HEALTH & SAFETY PRODUCTSOUTERWEAR

56%34%

23%25%

17%10%

20%16%

6%6%

FRAN

CE

5.8

WRITING INSTRUMENTSSHIRTS

BAGSCALENDARS

DESK/OFFICE ACCESSORIESCAPS/HEADWEAR

DRINKWAREUSB DRIVES/FLASH DRIVES

HEALTH & SAFETY PRODUCTSOUTERWEAR

46%43%

24%21%

12%10%9%

19%8%

11%

Most Popular Products By Category

5.8

WRITING INSTRUMENTSSHIRTS

BAGSCALENDARS

DESK/OFFICE ACCESSORIESCAPS/HEADWEAR

DRINKWAREUSB DRIVES/FLASH DRIVES

HEALTH & SAFETY PRODUCTSOUTERWEAR

50%43%

29%21%

17%16%

14%9%

8%5%

USA

5.8

WRITING INSTRUMENTSSHIRTS

BAGSCALENDARS

DESK/OFFICE ACCESSORIESCAPS/HEADWEAR

DRINKWAREUSB DRIVES/FLASH DRIVES

HEALTH & SAFETY PRODUCTSOUTERWEAR

48%36%

25%25%

16%21%

13%12%

11%16%

CANA

DA

GREA

T BRI

TAIN

5.8

WRITING INSTRUMENTSSHIRTS

BAGSCALENDARS

DESK/OFFICE ACCESSORIESCAPS/HEADWEAR

DRINKWAREUSB DRIVES/FLASH DRIVES

HEALTH & SAFETY PRODUCTSOUTERWEAR

56%34%

23%25%

17%10%

20%16%

6%6%

FRAN

CE

5.8

WRITING INSTRUMENTSSHIRTS

BAGSCALENDARS

DESK/OFFICE ACCESSORIESCAPS/HEADWEAR

DRINKWAREUSB DRIVES/FLASH DRIVES

HEALTH & SAFETY PRODUCTSOUTERWEAR

46%43%

24%21%

12%10%9%

19%8%

11%

Most Popular Products By Category

5©2012 Advertising Specialty Institute®. All Rights Reserved.

OF U.S. CONSUMERS OWN LOGOED WRITING INSTRUMENTS

50%

Product Spotlight: Writing Instruments

66%

Sign HereThe Founding Fathers used a fountain pen to sign the U.S. Constitution, and today, Philadelphians still exhibit their love for promo pens and pencils.

of consumers in Philly say they own a branded writing instrument, vs. 50% in the U.S. overall.

More Females than Males Own Promo

Pens & Pencils

52% 45%

Income GapConsumers earning $100,000+ are the least likely to own

a promo pen or pencil.

= less likely to own a promo pen or pencil than those who make less money

<$50,000 = 51%$50,000-$99,999 = 53%

60%of Caucasian

consumers own branded writing instruments – 12 percentage points

more than any other ethnic group.

Seeing RedRepublicans are more likely to own a promotional writing instrument than Democrats or Independents.

of Republicans have them in their homes or offices.

62%

55% of Independents and 53% of Democrats make the same claim.

Better With AgeAlthough writing instruments are favorites among every age

group, they’re most popular with older consumers.

21-34

35-44

45-54

55+

47%46%

50%

56%

46%$100,000+

6©2012 Advertising Specialty Institute®. All Rights Reserved.

Everyone Loves A Free T-Shirt!

Across all income levels, the percentage

of consumers who own a promotional

T-shirt remains about the same.

Latino Market MagnetHave clients that want to target the fast-growing

Hispanic sector in the U.S.?

The Voters SpeakWhile many members of each political party say they own a promotional T-shirt, Independents lead the way.

48%of Independents say they have a logoed shirt at home. Only 44% of Republicans and 39% of Democrats make the same claim.

50%of consumers in Dallas say they own a promotional T-shirt vs. 43% in the U.S.

TEXANSWear It WellOf the 12 global cities that researchers polled consumers in, Dallas leads the way.

OF U.S. CONSUMERS OWN A PROMOTIONAL SHIRT43%

<$50,000 $50,000-$99,999 $100,000+

46% 47% 46%

54%of Latino

consumers own a promotional

T-shirt, the most of any racial

demographic.

More Males Own Promo Shirts

Than Females

46%

41%

GO YOUNG!Younger consumers

are more likely to own a promotional shirt.

Product Spotlight: Shirts

55+

21-34

35-44

45-54

49%

46%

36%

34%

7©2012 Advertising Specialty Institute®. All Rights Reserved.

Age MattersThe 55+ crowd is most likely

to own a logoed bag.

31%

OF U.S. CONSUMERS OWN A PROMOTIONAL BAG29%

37%of consumers in LA say they have one – the next highest is Chicago with 36%.

Hollywood AttractionLos Angeles leads the way in promo bag ownership.

Product Spotlight: Bags

Low-Income TargetsPeople with household incomes of less than $50k are the most

likely to own promotional bags.

<$50,000 = Most likely to own a

logoed bag

35%The percentage of

Asian consumers who own promo bags, the

most of any racial demographic group.

Leaning LeftDemocrats are slightly more likely than Republicans (27%) and Indepen-dents (29%) to have promo bags in their homes.

Women RuleNearly twice as many

women as men say they own promotional bags.

29%21-34

26%35-44

31%45-54

33%55+

37% 20%

8©2012 Advertising Specialty Institute®. All Rights Reserved.

Product Spotlight: Calendars

21%OF U.S.CONSUMERS OWN A PROMOTIONAL CALENDAR

24%Quarter Mark

of African-American consumers own a

promo calendar – the most of any demographic

group by at least three percentage points.

It’s a DateBy a slight

margin, women are more likely to own a logoed

calendar.23% 20%

23%of Republicans own a branded calendar,

compared to 21% of both Democrats and Independents.

To the Right

of them say they have at least one at home or in the office.

Northern ExposureConsumers in Montreal are most likely to own a logoed calendar.

37%

Go OlderHave clients targeting older demographics?

Calendars could be the solution.

30%$100,000+

32%

$50,000-$99,99929%

<$50,000

As consumers age, they’re more likely

to own a promotional

calendar.

Calendars appeal to consumers of all

income levels.

Flexible Income

21-34

35-44

45-54

55+

13%25%

28%28%

9©2012 Advertising Specialty Institute®. All Rights Reserved.

Product Spotlight: Desk Accessories

35-4421-34 45-54 55+

20%18%

15% 13%

OF U.S. CONSUMERS OWN A LOGOED DESK ACCESSORY17%

My Kinda TownChicago leads the way in desk accessory ownership, with

of consumers there saying they have logoed items in their offices.

21%

In the Middle20% of Independents own office and desk

accessories, just trumping Democrats at 19% and Republicans

at 16%.

19% 20%

16%

The Right TargetHave clients looking to attract

Asian consumers? You may want to suggest going with a desk

accessory or office item.

Office Toys to the Young

Younger consumers are more likely to

have a branded item on their desks.

22%

Go LowThe lowest-income

earners tend to be the most likely group by

financial breakdown to own a logoed desk

accessory.

of consumers making less than

$50k per year own one.

19%African

American

18%Hispanic

17%Caucasian

21%Asian

20% to 14%

Inspector GadgetWomen are more likely to own a promo

desk accessory in their offices than men, by a margin of

ABC

10©2012 Advertising Specialty Institute®. All Rights Reserved.

Product Spotlight: Hats

Wear it WellCaucasians are the most likely

demographic group to own logoed caps.

OF U.S. CONSUMERS OWN A PROMOTIONAL HAT16%

Men at WorkMale consumers are nearly twice as likely as females

to own a branded cap.

17%

15%14%

11%

Cau

casi

an

Afr

ican

Am

eric

an

His

pani

c

Asi

an

Priced Right Caps appeal to all

income groups, but those earning between $50k and $100k own

the most hats.

15%

19%18%

Trending RedWhile 19% of Independents

and 18% of Republicans own promotional caps, only 15%

of Democrats have a branded hat at home.

22% 12%

Protection from the ColdThey must need to keep their heads warm up north.

$100,000+$50,000-$99,999<$50,00020%22%17%

Age NeutralWhile caps are popular among all ages, those 45 and older are most

likely to own one.

14%21-34

35-44

45-54

55+

22%16%

18%

25% 21%of people in Toronto and

of all Canadians own promo caps.

11©2012 Advertising Specialty Institute®. All Rights Reserved.

Mugs for the Middle

Mid-income consumers are

slightly more likely to own branded drinkware than those at other income levels.

Product Spotlight: Drinkware

More Women Own Logoed

Drinkware than Men

12%

15%

17%of Asian consumers

own logoed drinkware, the

most of any racial demographic.

Gen-Xers and their Older Counterparts Own More Drink-

ware Than Those Under 35

14% OF U.S. CONSUMERS OWN BRANDED DRINKWARE

$50,000-$99,999

15%

$100,000+

14%

<$50,000

12%

11% 17% 16% 15%

21-34 35-44 45-54 55+

Drink Up, Philly!Of the 12 global cities surveyed, Philadelphians love their logoed

mugs and glasses the most.

of consumers in Philly own promotional

drinkware.

21%

of Democrats, Republicans and Independents each own at least one item in this category.

A Close RaceMembers of the three major political parties are all similar in their

preferences for drinkware.

14% 14% 14%

12©2012 Advertising Specialty Institute®. All Rights Reserved.

Product Spotlight: USB Drives

Upscale Tech

12%of Asian consumers

in the U.S. own branded USB drives,

leading the way among all racial

demographic groups.

Independent = Techie?

More Independent voters own branded USB drives than

Democrats or Republicans.

OF U.S. CONSUMERS OWN A LOGOED USB DRIVE9%

Men are More Likely to Own

a Branded USB Drive Than Women

11%

7%27%

Merci! Parisians are far more

likely to own promotional USB drives than

consumers in other cities:

of them own them, versus 9% of U.S.

consumers.

Trending YoungYounger consumers are more likely to own a

promo USB drive than their older counterparts.

55+

45-54

35-44

21-34

7%

6%

9%

11%

Six-figure earners are more likely to own a logoed USB drive than those in other economic groups.

8%

11%

9%

$100,000+$50,000-$99,999

<$50,00014%11%8%

13©2012 Advertising Specialty Institute®. All Rights Reserved.

Product Spotlight: Health & Safety Items

OF U.S. CONSUMERS OWN PROMOTIONAL HEALTH & SAFETY PRODUCTS

8%

More Women Own Promo

Health & Safety Products Than Men

10%of African Americans

own logoed health and safety items, the

most of any racial demographic.

10%have an item in their office

or home, compared to 8%

of Democrats and 7% of

Independents.

To the RightRepublicans are the most likely to own a

promotional health or safety item.

11%Safe, Healthy Cities

of consumers in Dallas

and Montreal

own promotional health & safety

products, vs. the U.S. average

of 8%.

Cashing InHigher earners are the safest.

Health ConsciousMiddle-age consumers are the most likely to own a branded

health or safety product.

14%$100,000+ = Most likely

to own branded health and safety products

<$50,000 = 8%$50,000-$99,999 = 8%

+ 10%

6%

8%

9%5%

21-34

35-44

45-54

55+

10%

14©2012 Advertising Specialty Institute®. All Rights Reserved.

Product Spotlight: Outerwear

6%

8%Big Bucks

Higher earners are more likely to own a promotional jacket.

of African Americans and Hispanics own

logoed jackets.

of Asians and

of Caucasians keep them in their closets.

OF U.S. CONSUMERS OWN PROMOTIONAL OUTERWEAR5%

Zip It, Youngster!

Young consumers are slightly more likely to

own promotional outerwear

than older consumers.

21-34

35-44

45-54

55+

6%

6%

4%

2%

Split Votesof Democrats own promotional outerwear, while 5% of Independents and 4% of Republicans make the same claim.

European ChillOf the 12 global cities where researchers

interviewed consumers, Paris and London led the way in outerwear.

of Parisians and Londoners

own it, vs. 5%

in the U.S. and Canada.

6% 4%More Men

Own Promo Jackets Than

Women

7%

5%4%

6% 5%$50,000-$99,999

8%$100,000+<$50,000

15©2012 Advertising Specialty Institute®. All Rights Reserved.

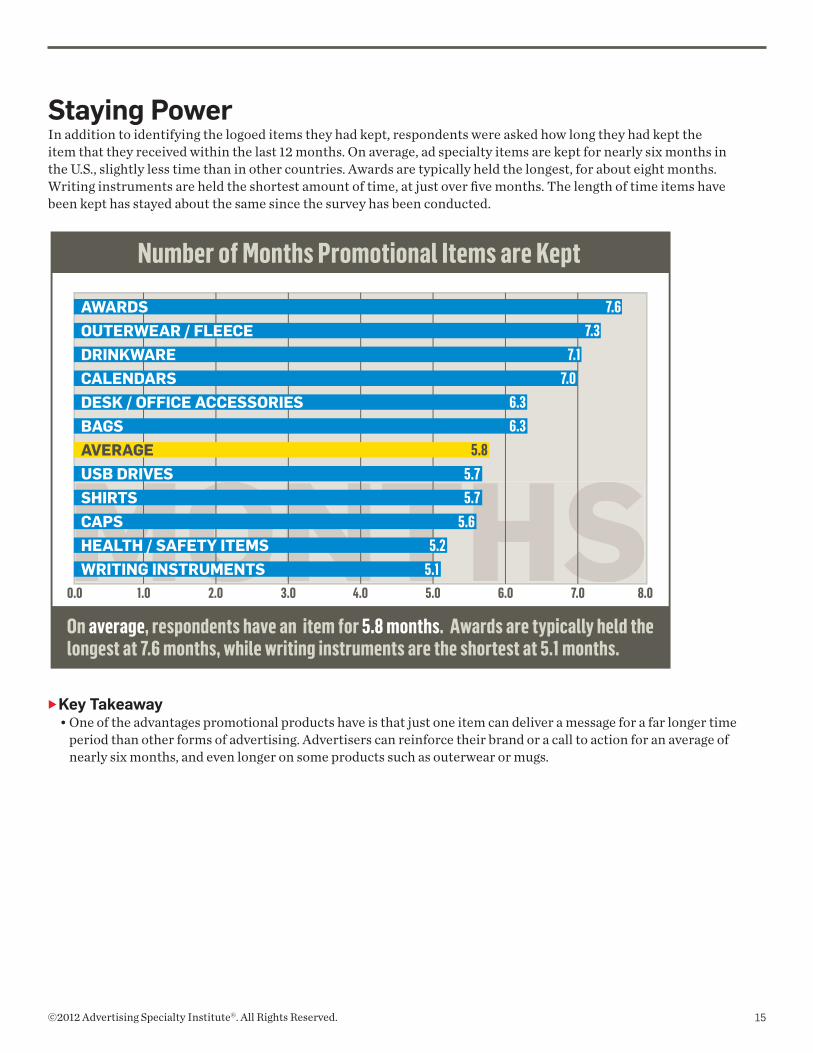
Staying PowerIn addition to identifying the logoed items they had kept, respondents were asked how long they had kept the item that they received within the last 12 months. On average, ad specialty items are kept for nearly six months in the U.S., slightly less time than in other countries. Awards are typically held the longest, for about eight months. Writing instruments are held the shortest amount of time, at just over five months. The length of time items have been kept has stayed about the same since the survey has been conducted.

Key Takeaway• One of the advantages promotional products have is that just one item can deliver a message for a far longer time

period than other forms of advertising. Advertisers can reinforce their brand or a call to action for an average of nearly six months, and even longer on some products such as outerwear or mugs.

Number of Months Promotional Items are Kept

MONTHS

AWARDSOUTERWEAR / FLEECEDRINKWARECALENDARSDESK / OFFICE ACCESSORIESBAGSAVERAGEUSB DRIVESSHIRTSCAPSHEALTH / SAFETY ITEMSWRITING INSTRUMENTS

0.0 1.0 2.0 3.0 4.0

7.67.3

7.17.0

6.36.3

5.85.75.7

5.65.2

5.15.0 6.0 7.0 8.0

On average, respondents have an item for 5.8 months. Awards are typically held the longest at 7.6 months, while writing instruments are the shortest at 5.1 months.

16©2012 Advertising Specialty Institute®. All Rights Reserved.

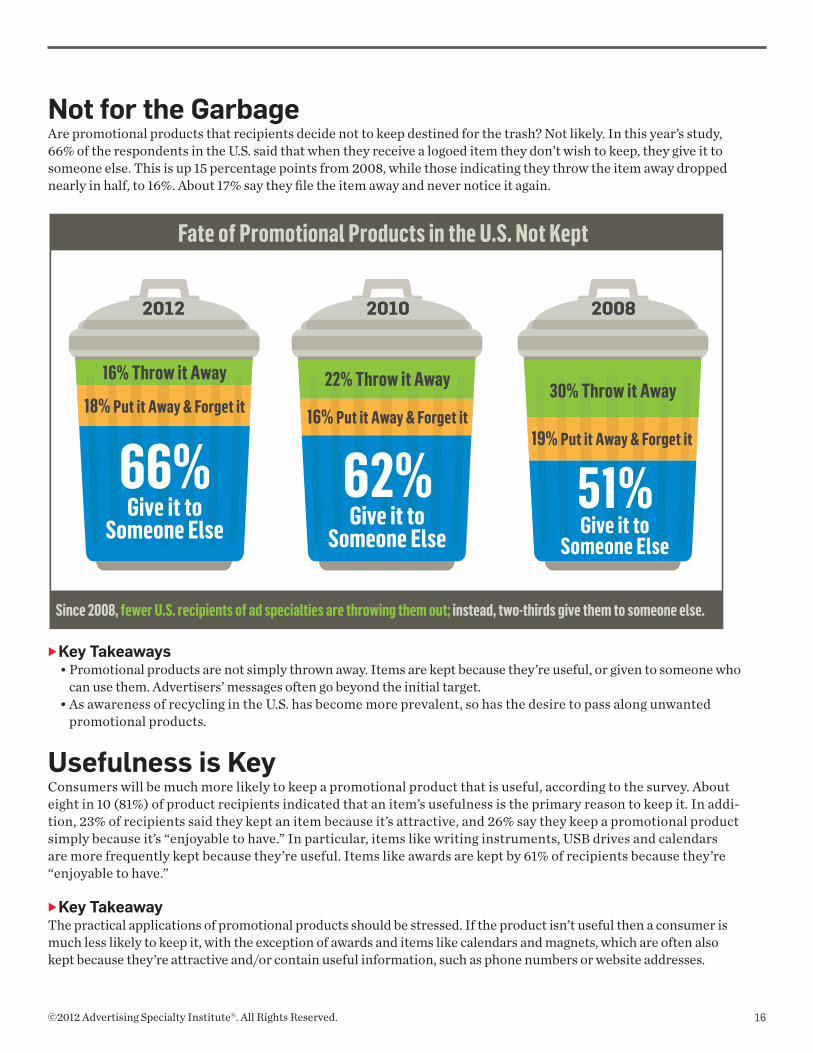
Not for the GarbageAre promotional products that recipients decide not to keep destined for the trash? Not likely. In this year’s study, 66% of the respondents in the U.S. said that when they receive a logoed item they don’t wish to keep, they give it to someone else. This is up 15 percentage points from 2008, while those indicating they throw the item away dropped nearly in half, to 16%. About 17% say they file the item away and never notice it again.

Key Takeaways • Promotional products are not simply thrown away. Items are kept because they’re useful, or given to someone who

can use them. Advertisers’ messages often go beyond the initial target. • As awareness of recycling in the U.S. has become more prevalent, so has the desire to pass along unwanted

promotional products.

Usefulness is KeyConsumers will be much more likely to keep a promotional product that is useful, according to the survey. About eight in 10 (81%) of product recipients indicated that an item’s usefulness is the primary reason to keep it. In addi-tion, 23% of recipients said they kept an item because it’s attractive, and 26% say they keep a promotional product simply because it’s “enjoyable to have.” In particular, items like writing instruments, USB drives and calendars are more frequently kept because they’re useful. Items like awards are kept by 61% of recipients because they’re “enjoyable to have.”

Key TakeawayThe practical applications of promotional products should be stressed. If the product isn’t useful then a consumer is much less likely to keep it, with the exception of awards and items like calendars and magnets, which are often also kept because they’re attractive and/or contain useful information, such as phone numbers or website addresses.

Since 2008, fewer U.S. recipients of ad specialties are throwing them out; instead, two-thirds give them to someone else.

Fate of Promotional Products in the U.S. Not Kept

Give it toSomeone Else

2010

62%Give it to

Someone Else

16% Put it Away & Forget it

22% Throw it Away

2008

30% Throw it Away

51%19% Put it Away & Forget it

Give it toSomeone Else

16% Throw it Away

66%18% Put it Away & Forget it

Give it toSomeone Else

2012

17©2012 Advertising Specialty Institute®. All Rights Reserved.

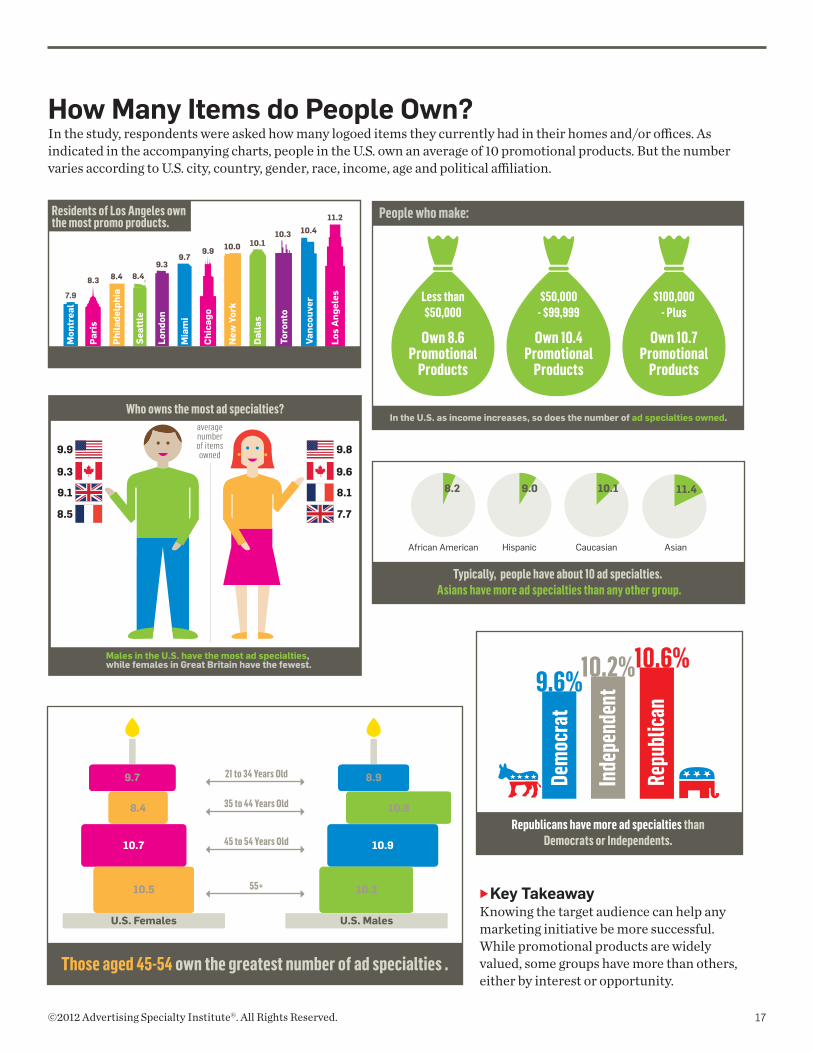
How Many Items do People Own?In the study, respondents were asked how many logoed items they currently had in their homes and/or offices. As indicated in the accompanying charts, people in the U.S. own an average of 10 promotional products. But the number varies according to U.S. city, country, gender, race, income, age and political affiliation.

Key Takeaway Knowing the target audience can help any marketing initiative be more successful. While promotional products are widely valued, some groups have more than others, either by interest or opportunity.

Mon

trea

l

Pari

s

Phi

lade

lphi

a

Seat

tle

7.9

8.3 8.4 8.49.3

9.79.9 10.0 10.1

10.3 10.411.2

Lond

on

Mia

mi

Chi

cago

New

Yor

k

Dal

las

Toro

nto

Vanc

ouve

r

Los

Ang

eles

Residents of Los Angeles own the most promo products.

Who owns the most ad specialties?

Males in the U.S. have the most ad specialties, while females in Great Britain have the fewest.

9.6

9.8

8.1

7.7

9.3

9.9

9.1

8.5

average number of items owned

African American Hispanic Caucasian

9.0

Asian

Typically, people have about 10 ad specialties. Asians have more ad specialties than any other group.

8.2 10.1 11.4

Less than $50,000

Own 8.6Promotional

Products

$50,000- $99,999

Own 10.4Promotional

Products

$100,000- Plus

Own 10.7Promotional

Products

People who make:

In the U.S. as income increases, so does the number of ad specialties owned.

Those aged 45-54 own the greatest number of ad specialties .

U.S. Females U.S. Males

35 to 44 Years Old

45 to 54 Years Old

55+

10.8

10.9

10.2

21 to 34 Years Old 8.99.7

8.4

10.7

10.5

9.6%10.6%10.2%

Inde

pend

ent

Dem

ocra

t

Repu

blic

an

Republicans have more ad specialties than Democrats or Independents.

18©2012 Advertising Specialty Institute®. All Rights Reserved.

Section Two

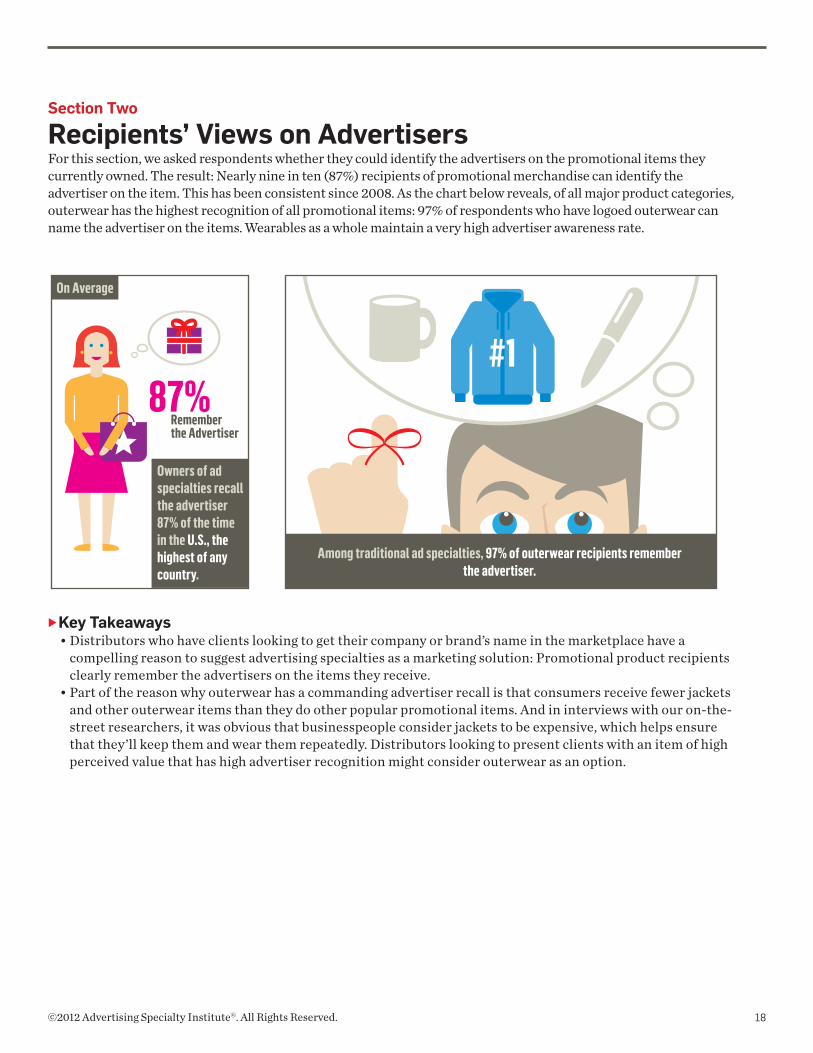
Recipients’ Views on AdvertisersFor this section, we asked respondents whether they could identify the advertisers on the promotional items they currently owned. The result: Nearly nine in ten (87%) recipients of promotional merchandise can identify the advertiser on the item. This has been consistent since 2008. As the chart below reveals, of all major product categories, outerwear has the highest recognition of all promotional items: 97% of respondents who have logoed outerwear can name the advertiser on the items. Wearables as a whole maintain a very high advertiser awareness rate.

Key Takeaways • Distributors who have clients looking to get their company or brand’s name in the marketplace have a

compelling reason to suggest advertising specialties as a marketing solution: Promotional product recipients clearly remember the advertisers on the items they receive.

• Part of the reason why outerwear has a commanding advertiser recall is that consumers receive fewer jackets and other outerwear items than they do other popular promotional items. And in interviews with our on-the-street researchers, it was obvious that businesspeople consider jackets to be expensive, which helps ensure that they’ll keep them and wear them repeatedly. Distributors looking to present clients with an item of high perceived value that has high advertiser recognition might consider outerwear as an option.

Rememberthe Advertiser

87%

On Average

Owners of ad specialties recall the advertiser 87% of the time in the U.S., the highest of any country.

#1

Among traditional ad specialties, 97% of outerwear recipients remember the advertiser.

19©2012 Advertising Specialty Institute®. All Rights Reserved.

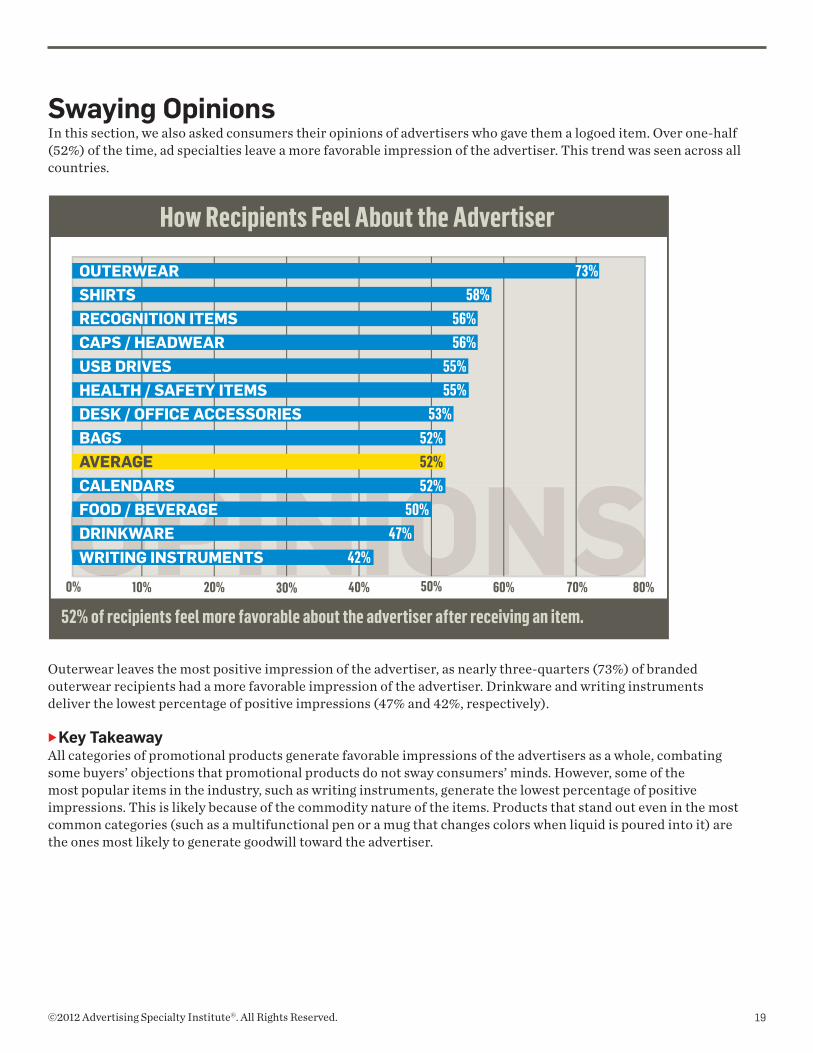
Swaying OpinionsIn this section, we also asked consumers their opinions of advertisers who gave them a logoed item. Over one-half (52%) of the time, ad specialties leave a more favorable impression of the advertiser. This trend was seen across all countries.

Outerwear leaves the most positive impression of the advertiser, as nearly three-quarters (73%) of branded outerwear recipients had a more favorable impression of the advertiser. Drinkware and writing instruments deliver the lowest percentage of positive impressions (47% and 42%, respectively).

Key TakeawayAll categories of promotional products generate favorable impressions of the advertisers as a whole, combating some buyers’ objections that promotional products do not sway consumers’ minds. However, some of the most popular items in the industry, such as writing instruments, generate the lowest percentage of positive impressions. This is likely because of the commodity nature of the items. Products that stand out even in the most common categories (such as a multifunctional pen or a mug that changes colors when liquid is poured into it) are the ones most likely to generate goodwill toward the advertiser.

How Recipients Feel About the Advertiser

OOPINIONSOPINIONS

OUTERWEARSHIRTSRECOGNITION ITEMSCAPS / HEADWEARUSB DRIVESHEALTH / SAFETY ITEMSDESK / OFFICE ACCESSORIESBAGSAVERAGECALENDARSFOOD / BEVERAGEDRINKWAREWRITING INSTRUMENTS

0% 10% 20% 30% 40%

73%58%

56%56%

55%55%

53%52%52%52%

50%47%

42%

50% 60% 70% 80%

52% of recipients feel more favorable about the advertiser after receiving an item.

20©2012 Advertising Specialty Institute®. All Rights Reserved.

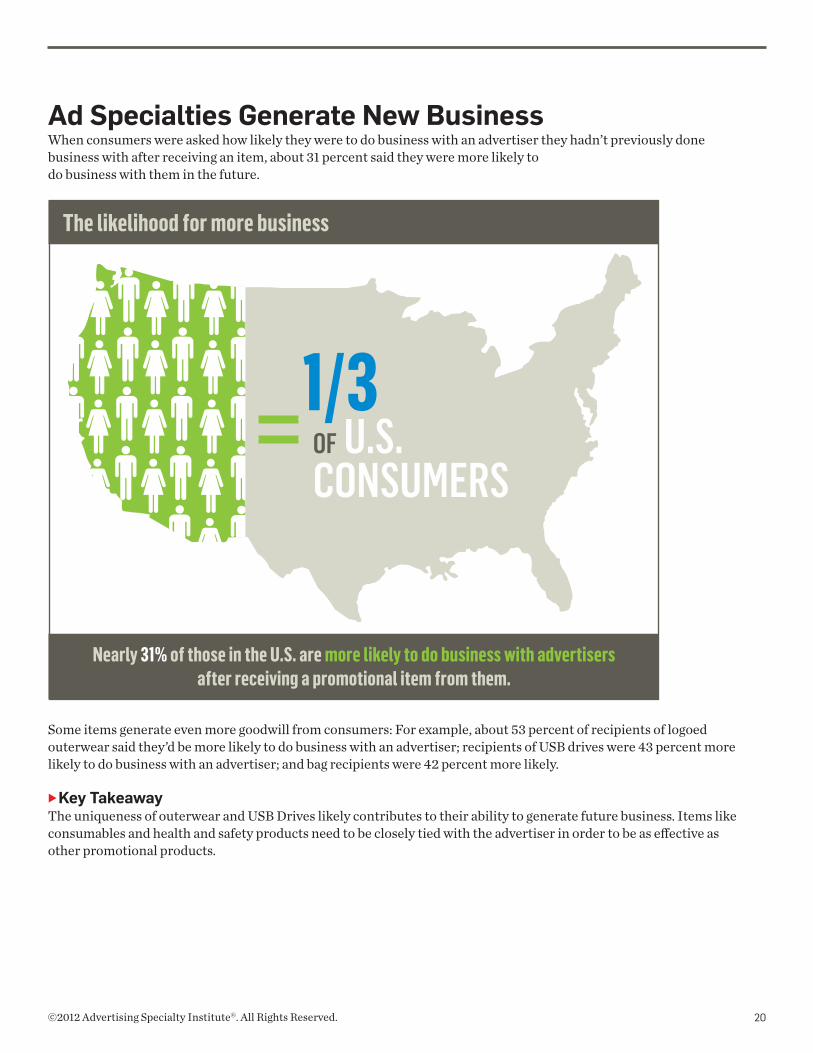
Ad Specialties Generate New BusinessWhen consumers were asked how likely they were to do business with an advertiser they hadn’t previously done business with after receiving an item, about 31 percent said they were more likely to do business with them in the future.

Some items generate even more goodwill from consumers: For example, about 53 percent of recipients of logoed outerwear said they’d be more likely to do business with an advertiser; recipients of USB drives were 43 percent more likely to do business with an advertiser; and bag recipients were 42 percent more likely.

Key TakeawayThe uniqueness of outerwear and USB Drives likely contributes to their ability to generate future business. Items like consumables and health and safety products need to be closely tied with the advertiser in order to be as effective as other promotional products.

OF U.S. CONSUMERS

1/3

Nearly 31% of those in the U.S. are more likely to do business with advertisers after receiving a promotional item from them.

The likelihood for more business

21©2012 Advertising Specialty Institute®. All Rights Reserved.

Section Three

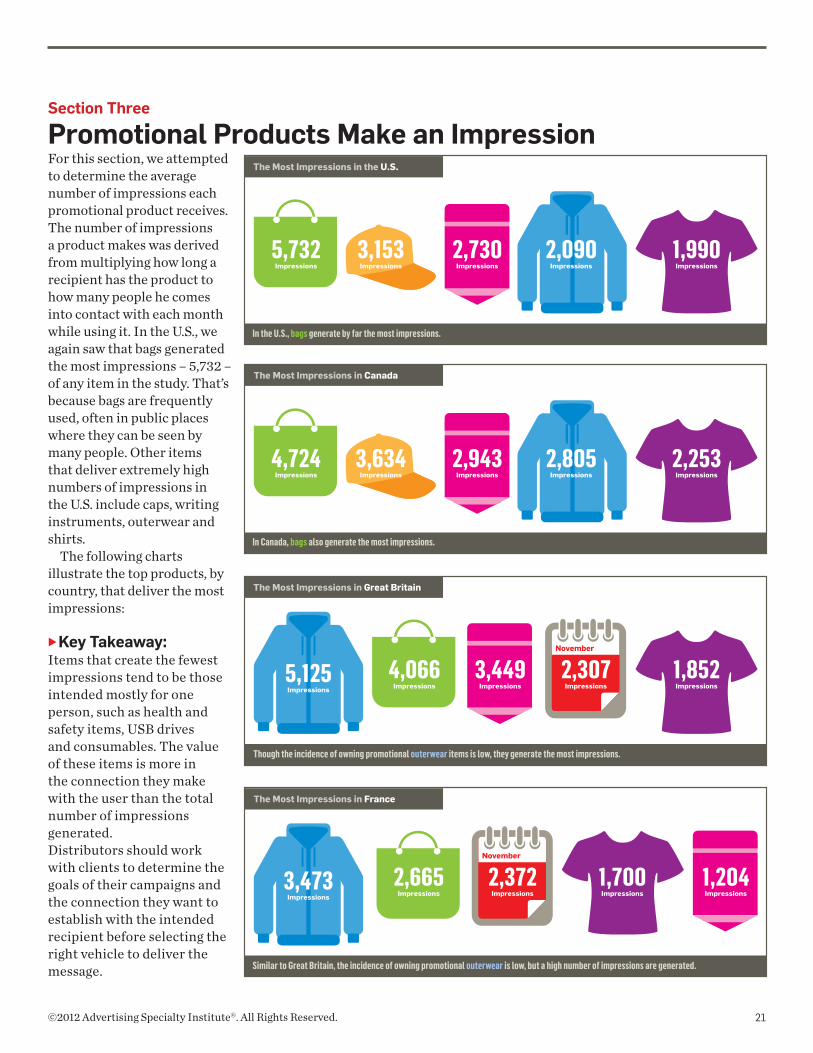
Promotional Products Make an ImpressionFor this section, we attempted to determine the average number of impressions each promotional product receives. The number of impressions a product makes was derived from multiplying how long a recipient has the product to how many people he comes into contact with each month while using it. In the U.S., we again saw that bags generated the most impressions – 5,732 – of any item in the study. That’s because bags are frequently used, often in public places where they can be seen by many people. Other items that deliver extremely high numbers of impressions in the U.S. include caps, writing instruments, outerwear and shirts.

The following charts illustrate the top products, by country, that deliver the most impressions:

Key Takeaway: Items that create the fewest impressions tend to be those intended mostly for one person, such as health and safety items, USB drives and consumables. The value of these items is more in the connection they make with the user than the total number of impressions generated. Distributors should work with clients to determine the goals of their campaigns and the connection they want to establish with the intended recipient before selecting the right vehicle to deliver the message.

4,724Impressions

4,066Impressions

3,634Impressions

2,253Impressions

2,805Impressions

1,852Impressions

2,943Impressions

3,449Impressions

1,204Impressions

The Most Impressions in the U.S.

5,732Impressions

3,153Impressions

1,990Impressions

2,090Impressions

In the U.S., bags generate by far the most impressions.

The Most Impressions in Canada

In Canada, bags also generate the most impressions.

The Most Impressions in Great Britain

Though the incidence of owning promotional outerwear items is low, they generate the most impressions.

November

The Most Impressions in France

Similar to Great Britain, the incidence of owning promotional outerwear is low, but a high number of impressions are generated.

5,125Impressions

3,473Impressions

2,730Impressions

2,307Impressions

November

2,372Impressions

2,665Impressions

1,700Impressions

22©2012 Advertising Specialty Institute®. All Rights Reserved.

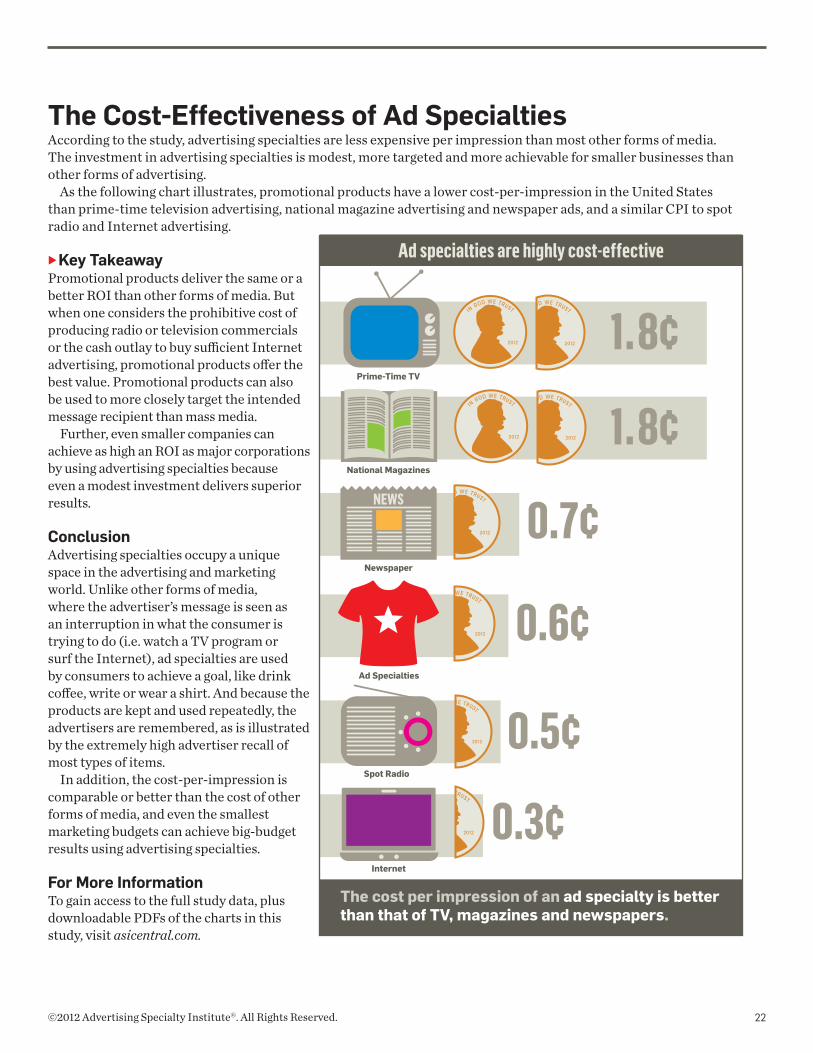
The Cost-Effectiveness of Ad SpecialtiesAccording to the study, advertising specialties are less expensive per impression than most other forms of media. The investment in advertising specialties is modest, more targeted and more achievable for smaller businesses than other forms of advertising.

As the following chart illustrates, promotional products have a lower cost-per-impression in the United States than prime-time television advertising, national magazine advertising and newspaper ads, and a similar CPI to spot radio and Internet advertising.

Key TakeawayPromotional products deliver the same or a better ROI than other forms of media. But when one considers the prohibitive cost of producing radio or television commercials or the cash outlay to buy sufficient Internet advertising, promotional products offer the best value. Promotional products can also be used to more closely target the intended message recipient than mass media.

Further, even smaller companies can achieve as high an ROI as major corporations by using advertising specialties because even a modest investment delivers superior results.

ConclusionAdvertising specialties occupy a unique space in the advertising and marketing world. Unlike other forms of media, where the advertiser’s message is seen as an interruption in what the consumer is trying to do (i.e. watch a TV program or surf the Internet), ad specialties are used by consumers to achieve a goal, like drink coffee, write or wear a shirt. And because the products are kept and used repeatedly, the advertisers are remembered, as is illustrated by the extremely high advertiser recall of most types of items.

In addition, the cost-per-impression is comparable or better than the cost of other forms of media, and even the smallest marketing budgets can achieve big-budget results using advertising specialties.

For More InformationTo gain access to the full study data, plus downloadable PDFs of the charts in this study, visit asicentral.com.

National Magazines

NEWS

Newspaper

Internet

Spot Radio

The cost per impression of an ad specialty is better than that of TV, magazines and newspapers.

0.5¢

0.3¢

0.6¢

0.7¢

1.8¢

1.8¢

Ad Specialties

Prime-Time TV

Ad specialties are highly cost-effective

23©2012 Advertising Specialty Institute®. All Rights Reserved.

DemographicsThe following is a breakdown of the demographics of all survey respondents who indicated they currently owned promotional products.

Gender % Count

Male 44.9% 830

Female 55.1% 1,017

Total   1,847

Age    

21 to 34 years 45.9% 852

35 to 44 years 22.4% 416

45 to 54 years 18.9% 351

55 to 64 years 10.4% 193

65 years and over 2.4% 44

Total   1,856

Race    

American Indian or Alaska Native 0.7% 13

Asian 11.5% 214

Black or African American 8.7% 162

Hispanic or Latino 7.8% 145

White/Caucasian 67.6% 1,254

Native Hawaiian or Other Pacific Islander 0.3% 5

Other 3.4% 63

Total   1,856

Country    

United States 60.0% 1,113

Canada 24.7% 459

Great Britain 8.4% 155

France 7.0% 129

Total   1,856

24©2012 Advertising Specialty Institute®. All Rights Reserved.

Political Party  %  Count

Democrat 43.8% 482

Republican 21.3% 235

Independent 18.0% 198

Other 3.2% 35

Not registered 13.7% 151

Total   1,101

Cities

Chicago 6.6% 116

Dallas 8.1% 142

London 8.6% 150

Los Angeles 8.0% 141

Miami 8.8% 155

Montreal 8.6% 151

New York 8.7% 153

Paris 7.7% 135

Philadelphia 7.5% 131

Seattle 9.8% 171

Toronto 8.4% 147

Vancouver 9.1% 160

 Total   1,752

Demographics continued


Recommended