Page 1
1
Global and local strength analysis in equivalent quasi-
static head waves, for a tanker ship structure, based on
full length and 2-3 cargo holds 3D-FEM models
Cioarec Dan Sebastian
Master Thesis
presented in partial fulfilment
of the requirements for the double degree:
“Advanced Master in Naval Architecture” conferred by University of Liege
"Master of Sciences in Applied Mechanics, specialization in Hydrodynamics, Energetics and
Propulsion” conferred by Ecole Centrale de Nantes
developed at "Dunarea de Jos" University of Galati
in the framework of the
“EMSHIP”
Erasmus Mundus Master Course
in “Integrated Advanced Ship Design”
Ref. 159652-1-2009-1-BE-ERA MUNDUS-EMMC
Supervisor: Prof. Leonard Domnisoru, "Dunarea de Jos" University of Galati
Reviewer: Prof. André Hage, University of Liege
Galati, February 2013
Page 2
2 Cioarec Dan Sebastian
Master Thesis developed at the University " Dunarea de Jos" of Galati, Romania
CONTENTS
CONTENTS ............................................................................................................................... 2
DECLARATION OF AUTHORSHIP ....................................................................................... 5
ABSTRACT ............................................................................................................................... 6
1. INTRODUCTION ................................................................................................................. 7
2.THEORETICAL BACKGROUND ........................................................................................ 9
2.1. The Global Ship Strengths Analysis Based on 1D-Equivalent Beam Method ............... 9
2.1.1. The Ship 1D-Equivalent Beam Model - Still Water Loads ..................................... 9
2.1.2. The Supplementary Ship 1D-Equivalent Beam Model Loads From Equivalent Quasi-
static Head Waves ............................................................................................................. 11
2.2. The Global - Local Ship Strengths Analysis Based on 3D-FEM Full Extended Models
.............................................................................................................................................. 13
2.2.1 The 3D-CAD of the Ship Hull Offset Lines ............................................................. 13
2.2.2. The 3D-CAD of the Ship Hull Structure ................................................................ 13
2.2.3 The 3D-FEM Mesh of the Ship Hull Structure ....................................................... 13
2.2.4 The Boundary Conditions on the 3D-FEM Model of the Ship Hull Structure ........ 14
2.2.5 The Loading Conditions. Numerical Analysis Based on 3D-FEM Models ............ 14
2.2.6. The Numerical Results Evaluation......................................................................... 16
2.3. The Two Cargo Hold Compartments 3D-FEM Model ................................................. 17
2.3.1. Vertical Deflection of the Ship Hull Based on the 1D-Equivalent Elastic Beam Model 17
2.3.2.Boundary Conditions on Two Cargo Holds Compartments Model ........................ 18
3.THE SHIP STRUCTURE DESCRIPTION, BASED ON THE CHEMICAL TANKER
4000 TONES PROTOTYPE SHIP .......................................................................................... 21
4. GENERATION OF 3D-CAD/FEM MODEL FULL EXTENDED ON THE SHIP'S
LENGTH.................................................................................................................................. 24
5. THE GLOBAL SHIP STRENGTHS ANALYSIS BASED ON 1D-EQUIVALENT BEAM
MODEL, UNDER EQUIVALENT QUASI - STATIC HEAD WAVES. .............................. 35
5.1. The 1D Equivalent Beam Model .................................................................................. 35
5.2. Results by the 1D Equivalent Beam Model Numerical Computation in Hogging Conditions
.............................................................................................................................................. 35
5.3. Results by the 1D Equivalent Beam Model Numerical Computation in Sagging Conditions
.............................................................................................................................................. 40
6. THE NUMERICAL ANALYSIS OF GLOBAL-LOCAL SHIP HULL STRENGTH, BASED
ON 3D-FEM MODEL FULL EXTENDED OVER THE SHIP LENGTH ................................. 44
6.1. Boundary and Loading Conditions ............................................................................... 44
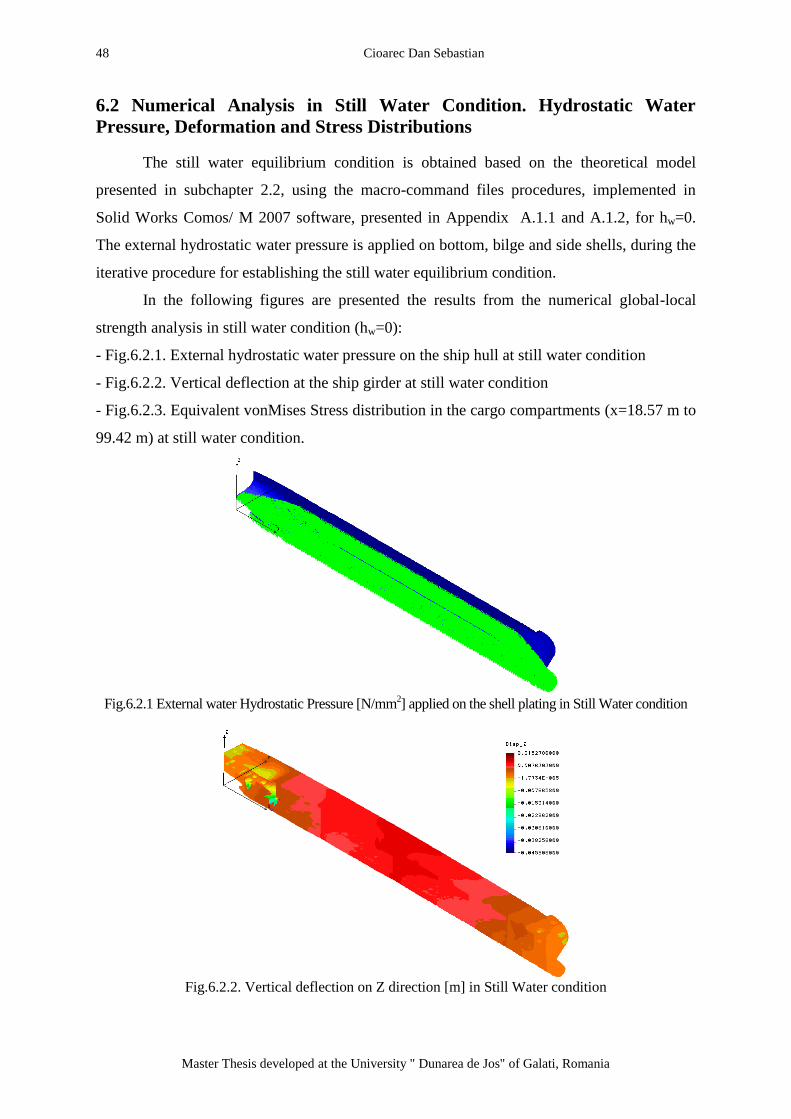
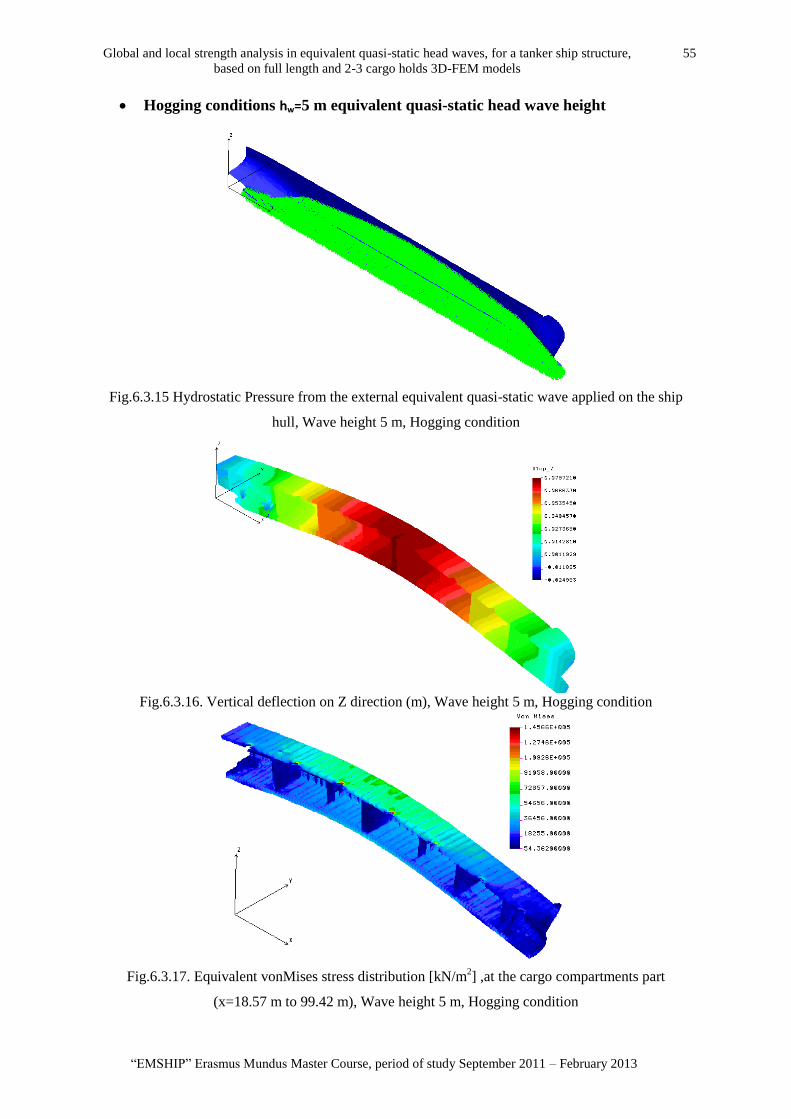
6.2 Numerical Analysis in Still Water Condition. Hydrostatic Water Pressure, Deformation
and Stress Distributions ....................................................................................................... 48
Page 3
Global and local strength analysis in equivalent quasi-static head waves, for a tanker ship structure,
based on full length and 2-3 cargo holds 3D-FEM models
3
“EMSHIP” Erasmus Mundus Master Course, period of study September 2011 – February 2013
6.3. Numerical Analysis in Hogging Conditions. Equivalent Quasi-static Wave Pressure,
Deformation and Stress Distributions (Wave height 0-8.123 m) .............................................. 49
6.4. Discussions and Conclusions for the Numerical Computation in Hogging Conditions,
Based on Full Extended 3D-FEM Model ............................................................................ 60
6.5. Numerical Analysis in Sagging Conditions. Equivalent Quasi-static Wave Pressure,
Deformation and Stress Distributions (Wave height 0-8.123 m) .............................................. 65
6.6. Discussions and Conclusions for the Numerical Computation in Sagging Conditions,
Based on Full Extended 3D-FEM Model ............................................................................ 75
7. THE GLOBAL - LOCAL SHIP HULL STRENGTH ANALYSIS BASED ON 3D-FEM
MODEL EXTENDED ON TWO CARGO HOLDS COMPARTMENTS (CENTRAL SHIP
PART, COARSE MESH SIZE). .............................................................................................. 80
7.1. Numerical Analysis in Still Water Condition. Hydrostatic Water Pressure,
Deformation and Stress Distributions .................................................................................. 83
7.2. Numerical Analysis in Hogging and Sagging Conditions. Equivalent Quasi-static
Wave Pressure, Deformation and Stress Distributions ........................................................ 84
7.3. Discussions and Conclusions for the Numerical Computation in Hogging and Sagging
Conditions, Two Cargo Holds Compartments 3D-FEM Model, With Coarse Size Mesh .. 87
8.THE GLOBAL - LOCAL SHIP HULL STRENGTH ANALYSIS BASED ON 3D-FEM
FINE MESH MODEL EXTENDED ON TWO CARGO HOLDS COMPARTMENTS
(CENTRAL SHIP PART)........................................................................................................ 96
8.1. Numerical Analysis in Still Water Condition. Hydrostatic Water Pressure,
Deformation and Stress Distributions .................................................................................. 96
8.2. Numerical Analysis in Hogging and Sagging Conditions. Equivalent Quasi-static
Wave Pressure, Deformation and Stress Distributions ........................................................ 98
8.3. Discussions and Conclusions for the Numerical Computation in Hogging and Sagging
Conditions, Two Cargo Holds Compartments 3D-FEM Model, With Fine Mesh Size .... 101
9.COMPARATIVE RESULTS AND CONCLUSIONS ....................................................... 113
10. ACKNOWLEDGEMENTS ............................................................................................. 118
11. REFERENCES ................................................................................................................ 119
12. APPENDIX ...................................................................................................................... 121
A1.1. Macro-command Files Procedures, Implemented in Solid Works Comos/ M 2007
Software "Press" Hogging/Sagging for Full Extended 3D-FEM Model (Equivalent Wave
Hydrostatic Pressure on the Hull Shell) ............................................................................. 121
A.1.2 Macro-command Files Procedures, Implemented in Solid Works Comos/ M 2007
Software "EL_DBS" to Select the Shell Plating for the Full Extended 3D FEM Model .. 123
A.1.3. The “Geomacro.mac” File GEO Procedures Library Developed for the Support of
GEO Macro-Commands Files ............................................................................................ 125
A.2.1 Macro-command Files Procedures, Implemented in Solid Works Comos/ M 2007
Software "EL_DBS_LE_TK" to Create the Selection of the Plating for the Two Cargo
Holds Compartments 3D-FEM Model............................................................................... 127
A.2.2. Macro-command Files Procedures, Implemented in Solid Works Comos/ M 2007
Software "Press" Hogging/Sagging for Two Cargo Holds Compartments 3D-FEM Model
(Equivalent Wave Hydrostatic Pressure on the Hull Shell) ............................................... 129
Page 4
4 Cioarec Dan Sebastian
Master Thesis developed at the University " Dunarea de Jos" of Galati, Romania
A.3.1 Macro-Command Files Procedures, Implemented in Solid Works Comos/ M 2007
Software "GPoint" to add Points in Nodes for Boundary Conditions (Two Cargo Holds
Compartments 3D-FEM Model) "GPOINT.GEO" ............................................................... 129
A.3.2. Macro-Command Files Procedures, Implemented in Solid Works Comos/ M 2007
Software "Curves.PP" Creates Lines Between Nodes for Two Cargo Holds Compartments
3D-FEM Model ................................................................................................................... 130
A.4. The Plate Thickness for Each Block of the 3D-CAD Model Generation, Chapter 4.130
A.5.1. Table Inputs for the 1D Equivalent Beam Model Numerical Computation ................... 138
A.5.2.Table Results of the 1D Equivalent Beam Model Numerical Computation in
Hogging Condition............................................................................................................. 142
A.5.3. Table Results of the 1D Equivalent Beam Model Numerical Computation in
Sagging Condition ............................................................................................................. 143
A.6.1. Table Results of the Numerical Computation in Hogging Conditions, Full Extended
3D-FEM Model .................................................................................................................. 144
A.6.2. Table Results of the Numerical Computation in Sagging Conditions, Full Extended
3D-FEM Model .................................................................................................................. 145
A.7. Tables Results for the Numerical Computation in Hogging and Sagging Conditions,
Two Cargo Holds Compartments 3D-FEM Model, With Coarse Size Mesh.................... 147
A.8. Tables Results for the Numerical Computation in Hogging and Sagging Conditions,
Two Cargo Holds Compartments 3D-FEM Model, With Fine Mesh Size........................ 149
Page 5
Global and local strength analysis in equivalent quasi-static head waves, for a tanker ship structure,
based on full length and 2-3 cargo holds 3D-FEM models
5
“EMSHIP” Erasmus Mundus Master Course, period of study September 2011 – February 2013
DECLARATION OF AUTHORSHIP
Declaration of Authorship
I declare that this thesis and the work presented in it are my own and have been generated by
me as the result of my own original research.
Where I have consulted the published work of others, this is always clearly attributed.
Where I have quoted from the work of others, the source is always given. With the exception
of such quotations, this thesis is entirely my own work.
I have acknowledged all main sources of help.
Where the thesis is based on work done by myself jointly with others, I have made clear
exactly what was done by others and what I have contributed myself.
This thesis contains no material that has been submitted previously, in whole or in part, for
the award of any other academic degree or diploma.
I cede copyright of the thesis in favour of the University "Dunarea de Jos", of Galati,
Romania
Date: 21.01.2013 Signature
Page 6
6 Cioarec Dan Sebastian
Master Thesis developed at the University " Dunarea de Jos" of Galati, Romania
ABSTRACT
Global and local strength analysis in equivalent quasi-static head waves, for a
tanker ship structure, based on full length and 2-3 cargo holds 3D-FEM models
By Cioarec Dan Sebastian
The main objective of the thesis is to provide the specific knowledge concerning the methods for global and local ship hull structure strength analysis, under equivalent quasi-static head wave loads. The numerical results have to stress out the adequacy of structural models, with different complexity levels, developed for ship hull strength assessment. For the analysis has been selected a chemical tanker ship with double hull, granted by the Ship Design Group, Galati, during the internship. The following ship data are required for the strengths analysis: hull offset lines, structural characteristics over several transversal sections, material characteristics, mass distribution over the ship length. The ship hull offset lines is based on the chemical tanker ship and the transversal sections structure scantlings are according to the Bureau Veritas Classification Society Hull Rules. The mass distribution is based on the full 3D-CAD/FEM model developed in the study (for hull steel mass group) and the prototype ship onboard masses groups. The ship hull model has been developed using three different modelling levels: a 3D-FEM model full extended over the ship length; a 3D-FEM model extended on the two cargo holds compartments from the ship central part (coarse and fine mesh size) and a 1D-Equivalent Beam model (as reference for the 3D-FEM Models). The global - local ship hull strength analysis based on 3D-FEM model full extended over the ship length, one sided, includes the following steps: the 3D-CAD of the ship hull offset lines, the 3D-CAD/FEM mesh (coarse) of the ship hull structure, the boundary conditions, the gravity loads from structure and other onboard masses, cargo and cargo tanks structure considered as local pressure applied on the double bottom shell in the cargo holds area, the equivalent quasi-static head wave pressure loads applied on the hull external shell, using an iterative procedure for the free floating and trim conditions equilibrium, implemented with user subroutines in the FEM solver. The results are obtained from the 3D-FEM model with post-processing user subroutines, as follows: normal, tangential and vonMises stresses. The strength assessment includes the safety factor in reference to the yield stress limit criteria. The 3D- FEM model has been developed with Solid Works Cosmos/M 2007 program, based on a 3D-CAD model developed with AutoCAD, with iterative analysis and post processing user subroutines developed for Cosmos/M solver, at Galati Naval Architecture Faculty. The global ship strengths analysis based on 1D-equivalent ship girder model, under equivalent quasi-static head waves, is carried on with an iterative algorithm for free floating and trim equilibrium conditions, using an in-house made code from Galati Naval Architecture Faculty. The global - local ship hull strength analysis based on 3D-FEM model extended on two cargo holds compartments (central ship part), with coarse mesh size, for cargo holds structural strength analysis, was performed with Solid Works Cosmos/M 2007, having the same local loads as the 3D-FEM Full extended model and at both model ends the global displacement and rotation are taken from the previous 1D-equivalent girder model. In order to apply the external pressure on the ship hull, from the equivalent quasi-static wave, and the global displacements and rotations at both model ends, there were used specific user subroutines implemented in Solid Works Cosmos/M 2007 Solver. The 3D-FEM Model extended on two cargo hold compartments has been refined, in order to include some selected structural details (hot-spots domains). The boundary condition and the global-local loads are the same as for the previous coarse mesh size model. The strength assessment includes also hot-spot factor evaluation for the deck and bottom structural panels. Comparison between deformations and stress values based on the four structural models, having different complexity levels, was performed. The numerical FEM analysis provides reliable data for the ship strength assessment, with a good concordance between the structural models developed in this study, taking into account the specific models sensitivity.
Page 7
Global and local strength analysis in equivalent quasi-static head waves, for a tanker ship structure,
based on full length and 2-3 cargo holds 3D-FEM models
7
“EMSHIP” Erasmus Mundus Master Course, period of study September 2011 – February 2013
1. INTRODUCTION
MASTER THESIS MAIN FLOWCHART
Chemical Tanker 4000 t Ship Hull Structure Input Data:
- offset lines and general arrangement plan;
- ship hull structure design data and material characteristics;
- on board and cargo mass groups (full cargo case).
Development of the 3D-CAD/FEM
hull model full extended on the ship
length with coarse mesh, according to
the global strength FEM analysis rule
requirements, with SHELL3T thick
shell triangular elements.
- natural CL boundary conditions;
- node NDaft and NDfore, simple
support constraints for reaction forces
objective functions definition;
- iterative user subroutine for
equivalent quasi-static loads and ship-
wave vertical inplane equilibrium (free
floating and trim), where the FEM
program is being used at each iteration
for reaction forces, deformations and
stress analysis (hogging and sagging).
1D - equivalent ship girder analysis
- ship hull equilibrium parameters
under head quasi-static wave, sagging
and hogging, hw=0-8.123m (step 1m),
by free floating and trim iterative proc.;
- bending moments and shear forces;
- vertical in plane deformations and
rotations from bending and shearing;
3D-CAD/FEM two cargo holds model,
with the same coarse mesh size, being
cuted directly from the full extended
3D-FEM model at centre part
- fore and aft model rigidbar elements
by two master nodes (n-n axis & CL);
- global displacement and rotations
applied on the two ends master nodes;
- natural CL boundary conditions;
- user subroutine for wave pressure
loads based on ship-wave 1D model
equilibrium parameters;
- deformation and stress analysis.
Maximum stress differences of -
6% to +3% between the two 3D-
FEM models with the same coarse
mesh, with specific boundary
conditions and different wave-ship
equilibrium implemented procedures.
User subroutines
for hull steel mass
distribution over
the ship’s length.
3D-FEM two cargo holds model finer mesh by auto-
refinement procedure implemented in the FEM program
for deck panel, having the CAD, EL-groups, boundary
conditions and loads as the coarse mesh model (global
strengths requirements). Carried out tests for the local
3D-FEM stress hot-spots preliminary evaluation.
Proposed further
studies of this work.
Systematic hot-spots
sensitivity evaluation
analysis by 3D-FEM
two cargo holds models
with different mesh
sizes.
Page 8
8 Cioarec Dan Sebastian
Master Thesis developed at the University " Dunarea de Jos" of Galati, Romania
The finite element method was initial applied to the aircrafts construction, the structures been
idealised through simple beam grids models. The finite element method knew a quick development in
tandem with the increase of the computational capacities and it has enforced as a general numerical
method of solving engineering problems from different areas, inclusively the ship structures domain.
Generally, a structural analysis has the following steps:
• the objectives settlement, the type and the size of the analysis;
• the modelling of structures and the boundary conditions;
• the settlement of type and the modelling of the loads;
• the analysis and the evaluation of the results.
The type and the size of the analysis depend on the nature of the structural response that is to be
obtained. Generally, for the global-local strength analysis are obtained the stresses and deformations
distributions, under dynamic or equivalent quasi-static wave loads.
The loads at the analysis of ship structures include: forces and external pressures, forces that
arise from own ship weight and from the cargo, external wave pressures, etc.
At the ship structures the deformations and the stresses can be divided in the following
categories, depending on the analysed problem:
• global deformations and stresses of the ships girder and main structural elements;
• local deformations and stresses of the main and secondary structural elements;
• hot-spot stress domains of the structural elements (details).
The requirements of the present day ship structural analyses impose to develop three-
dimensional (3D) models, based on the FEM - Finite Element Method (Frieze and Shenoi 2006). In
order to increase the accuracy of the global strength analysis of ship structure, a major step is to use the
3D-FEM full extended over the ship length models (Lehmann 1998, Rozbicki et al. 2001, Domnisoru
2006), instead of models extended only over several cargo holds (Hughes 1988, Domnisoru 2001,
Servis et al. 2003). In this study, the global-local strength analysis is carried on a chemical-tanker
ship, provided by the Ship Design Group, Galati Company, granted during the Internship activity. The
study is focused on the full cargo loading case, under equivalent quasi-static head wave external loads.
The numerical structural analyses are based on the following models: ship 1D-Equivalent Beam Model,
3D-FEM Full Extended Model (with coarse mesh) and also 3D-FEM two cargo holds compartments
model (with coarse and fine mesh), using in-house program codes (Domnisoru 2006) and SolidWorks
Cosmos/M (2007) FEM commercial program, involving also user subroutines for pre, post processing
and analysis.
Page 9
Global and local strength analysis in equivalent quasi-static head waves, for a tanker ship structure,
based on full length and 2-3 cargo holds 3D-FEM models
9
“EMSHIP” Erasmus Mundus Master Course, period of study September 2011 – February 2013
2.THEORETICAL BACKGROUND
In the following, there is presented the theoretical method for global strengths analysis
of the ship hull, in the vertical plane, under own weight, cargo, still water and equivalent
quasi-static head wave loads. There are considered three types of analysis models: the 1D-
equivalent ship girder, the 3D-FEM model extended on several cargo holds compartments at
the ship centre part and the 3D-FEM model full extended over the ship length. It is pointed
out that the 3D-FEM models make possible to obtain better results for the global - local stress
distribution at the ship strengths analysis and also it can reveal (locate) the hot-spot stress
domains (Carlos Guedes Soares, Purnendu K. Das, 2007; Frieze, Shenoi, 2006; Domnisoru,
2006).
2.1. The Global Ship Strengths Analysis Based on 1D-Equivalent Beam
Method
In this sub-chapter there is presented the 1D-Equivalent Beam ship hull model for
global strengths analysis (Domnisoru 2006), which is used for the comparison with the
methods based on 3D-FEM models.
2.1.1. The Ship 1D-Equivalent Beam Model - Still Water Loads
The ship weight distribution is obtained based on the ship mass distribution over the
ship length, with the following relation:
niggLLxxgxg ixix ,12,2 (2.1.1)
where: L ship length, g gravity acceleration, μ(x) mass distribution, n ship girder elements
over the 1D-beam model.
Obs. In order to simplify the integrals calculation with trapeze method, there are considered
the significant ship hull transversal sections disposed at the middle of the „n” elements.
1,1,22
11 nixxxxL
x ii
; nLx ;
n
i
i
L
L
xfxdxxf1
2
2
(2.1.2)
In order to obtain the ship still water equilibrium position it is necessary to use an
iterative algorithm for a given LBdcV B and xG (from x ), as following:
Page 10
10 Cioarec Dan Sebastian
Master Thesis developed at the University " Dunarea de Jos" of Galati, Romania
0
001
0
001
0
0
0
1
0
2
2
00
1
0
2
2
00
0000
22
;,10
R
xxx
Ldd
R
xxx
Ldd
V
MxAxxdxxAxMAxdxxAV
linesoffsetshipfromRxniAdditer
BGFpv
BGFpp
y
B
n
iiTi
L
L
Ty
n
iiT
L
L
T
FTii
k
k
yk
B
n
i
k
iTi
L
L
k
T
k
y
n
i
k
iT
L
L
k
T
k
kk
F
k
Tii
k
pp
k
pvk
pp
k
i
V
MxAxxdxxAxMAxdxxAV
linesoffsetshipfromRxniAL
xL
ddddkiter
1
2
21
2
2
;,12
k
k
BGk
Fk
WL
kkk
pv
k
pvk
k
BGk
Fk
WL
kkk
pp
k
ppR
xxx
L
A
VVdd
R
xxx
L
A
VVdd
2;
2
11
11
The convergence criteria are: LxxVVV k
BG
k 001.0004.0 (2.1.3)
and also the longitudinal trim angle is: Ldd k
pp
k
pv .
Obs. There are noted above (2.1.3) the following:
V
IRbxxdxxbxI
yn
i
ii
L
L
y
;1
2
2
2
2 WL
yWL
FA
Mx ;
2
2
2
2
;
L
L
x
L
L
xG dxxgdxxgxx
n
i
i
L
L
WL bxdxxbA1
2
2
n
i
ii
L
L
yWL bxxdxxbxM1
2
2
;
(2.1.4)
where: B ship breadth, d medium draught amidships, cB block coefficient, b(x) water plane
breadth, xG the gravity centre abscise.
The still water vertical force per unit length results from the following relation:
nigAaLLxxgAxa
k
iTcxiTcx ,12,2 (2.1.5)
The ship still water loads results from the following relation:
niagpLLxxaxgxp cxixicxicxxcx ,12,2)()( (2.1.6)
The still water shear forces and bending moments results from the following relations:
dxxpxT
x
L
cxc
2
; dxxTxM
x
L
cc
2
(2.1.7)
Page 11
Global and local strength analysis in equivalent quasi-static head waves, for a tanker ship structure,
based on full length and 2-3 cargo holds 3D-FEM models
11
“EMSHIP” Erasmus Mundus Master Course, period of study September 2011 – February 2013
2.1.2. The Supplementary Ship 1D-Equivalent Beam Model Loads From Equivalent Quasi-
static Head Waves
There are considered the loads from equivalent quasi-static head waves, with the wave
length equal to the ship length ( L ). The amplitude of the equivalent quasi-static wave
aw=hw/2, with Smith correction, based on Bureau Veritas, 2010 Rules, it results according to
the following expression:
mLmcL
h RWw 90;1.425
mLmcL
h RWw 30090;100
30075.10
23
(2.1.8)
where 60.066.075.090.000.1RWc is the zone navigation coefficient. In the case
of the studied chemical tanker ship cRW=1.
In order to take into account the real ship hull offset lines, analogue to the case of still
water, there it is used a non-linear iterative procedure with two steps.
In this case dm, dpp,dpv, trim become the parameters that can define the position of the
median plane of the equivalent quasi-static head wave, taking as reference the base plane of
the ship hull.
For the considered loading case there are known: , V, xG , L , the offset lines, the
ship hydrostatics, Bonjean diagram.
Obs. The coordinates system origin is considered at the aft ship Lx ,0 .
1,1,2
11 nixxxx
x ii
; nLx (2.1.9)
Step I – the floating condition
0
0
0
1
0
0
00
1
0
0
00
0000 ,12
cos2
00
V
MxAxxdxxAxMAxdxxAV
BonjeanfromniAL
xhddditer
y
B
n
iiTi
L
Ty
n
iiT
L
T
Tiiw
mim
k
k
yk
B
n
i
k
iTi
L
k
T
k
y
n
i
k
iT
L
k
T
k
k
Ti
iwk
m
k
i
k
m
k
m
V
MxAxxdxxAxMAxdxxAV
BonjeanfromniAL
xhddddkiter
1010
1 ,12
cos2
001.0
(2.1.10)
and the iteration is made until VV k )( .
The solution is refined, using the half domain method, so that at the last iteration „m”
it is achieved the convergence criteria VVV m 001.0 .
Page 12
12 Cioarec Dan Sebastian
Master Thesis developed at the University " Dunarea de Jos" of Galati, Romania
At the end of the first step, it results the following parameters:
I
wL
I
F
m
m
I
m
m
B
I
B Axddxx , (2.1.11)
Step II – the trim condition
00001.0 trimxx I
BG or 00001.0 trimxx I
BG trimtrimAAxxdditer I
wLwL
I
FF
I
mm 00000 00000000 trimxLddtrimxdd FmpvFmpp
0
0
0
1
0
0
00
1
0
0
00
00000 ,12
cos2
V
MxAxxdxxAxMAxdxxAV
BonjeanfromniAL
xh
L
xdddd
y
B
n
iiTi
L
Ty
n
iiT
L
T
Tiiwi
pppvppi
00001.00 trimxx BG or 00001.00 trimxx BG
trimtrimtrimAx
A
VVddkiter kkk
wL
k
Fk
wL
kk
m
k
m
1
1
1)1( ,
kk
F
k
m
k
pv
kk
F
k
m
k
pp trimxLddtrimxdd
k
k
yk
B
n
i
k
iTi
L
k
T
k
y
n
i
k
iT
L
k
T
k
k
Tiiwik
pp
k
pv
k
pp
k
i
V
MxAxxdxxAxMAxdxxAV
BonjeanfromniAL
xh
L
xdddd
1010
,12
cos2
00001.0 trimxx k
BG or 00001.0 trimxx k
BG
(2.1.12)
and it is iterated until trim is changing the sign.
The solution is refined with the half domain method, so that at the last iteration „m” there are
satisfied the convergence criteria: LxxVVV m
BG
m 001.0001.0 .
At the end of the second step there result the following data:
niAAtrimtrimdddddd m
TiTi
mm
pvpv
m
pppp
m
mm ,1,,,, (2.1.13)
The total vertical load from equivalent quasi-static head wave has the expression:
LxxpnigAgp xTixixi ,0,1 (2.1.14)
The total shear forces and bending moments from equivalent quasi-static head wave
have the following expressions:
dxxpxT
x
cx0
; LxdxxTxM
x
,00
(2.1.15)
Obs. In the above relations the sign make possible to select the hogging (+) and
sagging (-) wave loads cases. Based on the above 1D-Equivalent Beam Model, the in-house
program P_ACASV version 5, (Domnisoru, 2006) has been developed as a standalone code.
Page 13
Global and local strength analysis in equivalent quasi-static head waves, for a tanker ship structure,
based on full length and 2-3 cargo holds 3D-FEM models
13
“EMSHIP” Erasmus Mundus Master Course, period of study September 2011 – February 2013
2.2. The Global - Local Ship Strengths Analysis Based on 3D-FEM Full
Extended Models
The enhanced method of ship global - local strengths analysis is based on 3D-FEM
models developed over the full length of the ship (Domnisoru, 2006).
In compare to the 1D Equivalent Beam Model (Chapter 2.2.1) the approach based on
3D-FEM models has the following main advantages:
the real ship 3D structure is taken into account, with the corresponding geometries
and material proprieties;
reduced number of boundary conditions (compared to partial extended models);
the 3D stress and deformations distributions in the ship structure are obtained,
pointing out also the local hot-spots domains;
with no restrictions to the ship hull offset lines form, the floating and trim equilibrium
position is obtained at still water and equivalent quasi-static statistical head waves.
2.2.1 The 3D-CAD of the Ship Hull Offset Lines
In the first step there is developed the ship hull offset lines CAD, using specialized
program Rhinoceros, 2006. This CAD models are exported as neutral DXF files format.
2.2.2. The 3D-CAD of the Ship Hull Structure
The second step includes the 3D-CAD ship hull geometry modelling, extended over
the full ship length. This approach is based on the ship offset lines CAD files, which can be
developed on general CAD programs as AutoCAD, 2011(Autodesk), with export of DXF
files format, or directly using the FEM program CAD pre-processing procedures, as those
existing in Solid Works Cosmos/M 2007.
2.2.3 The 3D-FEM Mesh of the Ship Hull Structure
The third step of the ship strengths analysis includes the generation of the 3D-FEM
models, based on the parametric or auto-mesh options that are usual included in the FEM
programs.
Page 14
14 Cioarec Dan Sebastian
Master Thesis developed at the University " Dunarea de Jos" of Galati, Romania
2.2.4 The Boundary Conditions on the 3D-FEM Model of the Ship Hull Structure
At the fourth analysis step there are modelled the boundary conditions for the 3D-
FEM ship hull model full extended over the length, that are of two types:
the symmetry conditions at the nodes disposed in the centre line plane of the ship, the
model being developed only on one side (for head waves loads case);
the vertical support conditions at two nodes disposed at the ship hull structure
extremities (in the centre line plane), noted NDpp at the stern (aft) and NDpv at the
bow (fore). At the vertical equilibrium conditions, for still water or equivalent quasi-
static head waves, the reactions forces in the two vertical supports must become zero.
2.2.5 The Loading Conditions. Numerical Analysis Based on 3D-FEM Models
At the fifth analysis step there are considered the modelling of the loads conditions
and the effective numerical analysis of the 3D-FEM model developed over the full ship
length, in order to obtain the deformations and stress distributions at the ship global-local
strengths analysis.
The loads acting over the ship hull are of three types (considering Solid Works
Cosmos/M 2007 implementation):
the gravity loads from the own structures weight and other onboard mass components
of the displacement, except the cargo masses (and cargo tank independent structure);
the cargo loads plus the cargo tanks independent structure, considered as local
pressures uniform distributed over the double bottom shell;
the equivalent quasi-static head wave pressure loads for the following cases: hw =0
(still water) and hw ≠ 0 (according the statistical values from Classification Societies
Rules), using an iterative procedure for the free floating and trim condition
equilibrium (see Fig.2.2.1.), implemented with GEO macro-commands files in the
Solid Works Cosmos/M 2007 FEM program.
In figure 2.2.1 there is presented the principal flow chart of the GEO macro
commands files (Domnisoru 2006), where the Solid Works Cosmos/M 2007 FEM is used as
solver for linear static structural analysis of the 3D-FEM model at each iteration.
Page 15
Global and local strength analysis in equivalent quasi-static head waves, for a tanker ship structure,
based on full length and 2-3 cargo holds 3D-FEM models
15
“EMSHIP” Erasmus Mundus Master Course, period of study September 2011 – February 2013
Fig. 2.2.1 Flow chart of GEO macro-commands files (Domnisoru, 2006)
Page 16
16 Cioarec Dan Sebastian
Master Thesis developed at the University " Dunarea de Jos" of Galati, Romania
The iterative procedure includes two main parts:
the free floating condition, having as objective numerical function the sum of vertical
reaction forces at the two nodes at ship extremities that has to become zero;
the free trim and floating condition, having as objective numerical functions the
vertical reactions forces at each two nodes at ship extremities that have to become zero.
Based on the algorithm from figure 2.2.1, in the following appendixes there are
presented the numerical procedures developed using GEO macro-commands programming
language from the Solid Works Cosmos/M 2007 program.
in Appendix A.1.1 there is presented the “press_full.geo” file GEO macro-commands
for the iterative procedure of free floating and trim equilibrium;
in Appendix A.1.3 there is presented the “geomacro.mac” file GEO procedures
library developed for the support of GEO macro-commands “hst.geo” and
“press_full.geo” that must be located in the directory “c:\CosmosM”.
2.2.6. The Numerical Results Evaluation
At the sixth step of the global-local ship strengths analysis, based on 3D-FEM
Models, there are obtained the following numerical results:
the free floating & trim equilibrium parameters (draught and trim angle of the
reference plane, still water plane of wave medium plane);
the global and local deformations of the ship hull structure;
the global and local (hot-spots stress domains) stress distributions over the full ship
hull length.
For the ship deck (D) and bottom (B) shells (σz=0) 3D-FEM model, the equivalent
vonMises stress σvon results smaller as the longitudinal normal stress σx ( in global
coordinates), because the transversal normal stress has non-zero value σy < σx , correlated also
with almost zero tangential stresses 𝜏𝑥𝑦 ≈ 𝜏𝑦𝑧 ≈ 𝜏𝑥𝑧 ≈ 0 presented in equation (2.2.1). In the
side panels (neutral axis) the dominant stresses are the tangential components.
𝜎𝑣𝑜𝑛 |𝐷,𝐵 = 𝜎𝑥2 + 𝜎𝑦
2 − 𝜎𝑥 𝜎𝑦 + 3(𝜏𝑥𝑦
2 + 𝜏𝑦𝑧2 + 𝜏𝑥𝑧
2 )]1/2 ≤ 𝜎𝑥 𝐷,𝐵 (2.2.1)
For a selected panel of the 3D-FEM model (Deck, Bottom, Side) and a given
longitudinal section the maximum stress value result from the equation 2.2.2:
𝜎, 𝜏𝑚𝑎𝑥 = 𝑚𝑎𝑥 𝜎, 𝜏 𝑁𝑜𝑑𝑒𝑠 𝑝𝑎𝑛𝑒𝑙, 𝑠𝑒𝑐𝑡𝑖𝑜𝑛 (2.2.2.)
Page 17
Global and local strength analysis in equivalent quasi-static head waves, for a tanker ship structure,
based on full length and 2-3 cargo holds 3D-FEM models
17
“EMSHIP” Erasmus Mundus Master Course, period of study September 2011 – February 2013
2.3. The Two Cargo Hold Compartments 3D-FEM Model
In order to reduce the complexity of the 3D-FEM Model full extended over the ship
length, for practical purpose of global-local ship strength analysis in the centre part, the
classification society rules recommend the use of 3D-FEM Models partially extended over
the ship length, as those corresponding to the cargo hold compartments. In this case the
equilibrium condition (Ship-equivalent quasi-static wave) cannot be any longer obtained
directly on the two cargo holds structural model, as for 1D and 3D Models iterative
procedures (Sub-Chapters 2.1 and 2.2), being necessary to apply the requested global vertical
equilibrium position based on a previous 1D Equivalent Beam Model analysis results.
A coarse mesh size will be used, for cargo holds structural strength analysis, the same
as for the 3D-FEM Full Extended Model. The loads are based on the previous 1D-Equivalent
Beam Model (with the iterative algorithm for the vertical in-plane equilibrium).
The main advantage of partially extended 3D-FEM Models is that the structural model
can have also a finer mesh on several details, without involving excessive time resources for
supplementary equilibrium conditions calculations (Domnisoru et al., 2005)
2.3.1. Vertical Deflection of the Ship Hull Based on the 1D-Equivalent Elastic Beam Model
In order to compute the rotations and displacements conditions of the partially
extended 3D FEM Model, at both end extremities, the 1D-Equivalent Beam Model vertical
deflection analysis results are used. The ship girder is modelled with n beam elements as follows:
𝑥0 = 0, 𝑥𝑖+1 = 𝑥𝑖 + 𝛿𝑥 𝑖 = 0, 𝑛 − 1 𝑥𝑛 = 𝐿 (2.3.1)
We consider for deformation computation the shear forces T(x) and bending moment
M(x) in the vertical plane for the equivalent head wave condition (equation 2.1.15).
The total displacement resulting from the bending moment and the shearing force has
the following expression: 𝑤 𝑥 = 𝑤𝑚 𝑥 + 𝑤𝑡 𝑥 𝑥 ∈ 0, 𝐿 (2.3.2)
where: wm(x) is the vertical deflection from bending and wt(x) is the vertical deflection from
shearing.
On the basis of the equation for the bending and the shearing 1D equivalent beam
deflection, it results the following equations:
𝑤𝑚 𝑥 =1
𝐸
𝑥
0
𝑥
0
𝑀 𝑥
𝐼 𝑥 𝑑𝑥𝑑𝑥 −
𝑥
𝐿
𝐿
0
𝐿
0
𝑀 𝑥
𝐼 𝑥 𝑑𝑥𝑑𝑥
𝑥
0
𝑥
0
𝑀 𝑥
𝐼 𝑥 𝑑𝑥𝑑𝑥 = 𝑥
𝑥
0
𝑀 𝑥
𝐼 𝑥 𝑑𝑥𝑑𝑥 −
𝑥
0
𝑀 𝑥
𝐼 𝑥 𝑑𝑥 = 𝑥 ∙ 𝐼𝑛𝑡1 − 𝐼𝑛𝑡2
(2.3.3)
Page 18
18 Cioarec Dan Sebastian
Master Thesis developed at the University " Dunarea de Jos" of Galati, Romania
1
𝐿
𝐿
0
𝑥
0
𝑀 𝑥
𝐼 𝑥 𝑑𝑥𝑑𝑥 =
𝐿
0
𝑀 𝑥
𝐼 𝑥 𝑑𝑥 −
1
𝐿
𝐿
0
𝑀 𝑥
𝐼 𝑥 𝑑𝑥 = 𝛼
𝑤𝑚 𝑥 =1
𝐸 𝑥 ∙ 𝐼𝑛𝑡1 − 𝐼𝑛𝑡2 − 𝑥 ∙ 𝛼
𝑤𝑡 𝑥 =1
𝐺 𝑥
𝐿
𝐿
0
𝑇 𝑥
𝐴𝑓 𝑥 𝑑𝑥 −
𝑥
0
𝑇 𝑥
𝐴𝑓 𝑥 𝑑𝑥
𝑥
0
𝑇 𝑥
𝐴𝑓 𝑥 𝑑𝑥 = 𝐼𝑛𝑡3 ;
1
𝐿
𝐿
0
𝑇 𝑥
𝐴𝑓 𝑥 𝑑𝑥 = 𝛽
𝑤𝑡 𝑥 =1
𝐺 𝑥 ∙ 𝛽 − 𝐼𝑛𝑡3
Based on the elastic 1D Equivalent Beam Model deformation results, it is possible
also to have a preliminary check of the ship hull girder using the admissible values for the
maximum vertical deflection:
𝑤𝑚𝑎𝑥 = 𝑚𝑎𝑥𝑥∈ 0,𝐿
𝑤 𝑥 𝜇=0 ≤ 𝑤𝑎𝑑𝑚 =𝐿
500 (2.3.4)
Based on equations (2.3.2-3), through derivation operation the rotation angles
distribution is obtained over the length of the ship 1D-girder.
2.3.2.Boundary Conditions on Two Cargo Holds Compartments Model
The boundary conditions are of two types: symmetry condition (natural condition);
the rotation and displacement conditions from the global 1D-model at both model end
extremities (global condition).
The symmetry conditions is referring to all the nodes in the centre line plane, and this
condition is due to the fact that the 3D-FEM model of the ship was developed in Portside
only (head wave case).
The boundary conditions for the Aft part of the model are given by a single node,
ND_AFT, situated at specific coordinates: x at the AFT extremity point of the model, y=0
and z at the neutral axis position of the AFT extremity transversal section. Based on the user
subroutine presented in the Appendix A.3.1, points are created on all the nodes available in
the AFT part of the model. Afterwards based on the user subroutine in the Appendix A.3.2,
lines are created for all the nodes into connection with the previously created ND_AFT. The
CAD lines objects previously created will be meshed as rigid beam elements (RBAR type in
SolidWorks Cosmos/M). Similar rigid elements are developed for the Fore node, ND_FORE
placed at the FORE extremity of the model.
The boundary conditions at ND_AFT and ND_FORE are presented in table 2.3.2.
Page 19
Global and local strength analysis in equivalent quasi-static head waves, for a tanker ship structure,
based on full length and 2-3 cargo holds 3D-FEM models
19
“EMSHIP” Erasmus Mundus Master Course, period of study September 2011 – February 2013
Table.2.3.2. Boundary conditions applied on the two cargo holds compartments 3D FEM Model
Boundary Conditions
Restrictions Ux Uy Uz Rx Ry Rz
Nodes at symmetry plane - x - x - -
ND_AFT Aft model node x x - x - x
ND_FORE Aft model node - x - x - x
Figure.2.3.2. Nodes to apply the boundary conditions on the two cargo holds compartments 3D-FEM Model
The two cargo hold compartments 3D-FEM Model has the FEM structure and the
mass groups the same as for the 3D-FEM full extended model, selected for the central part
according to the model extension.
The global rotations and the displacements (Uzpp, Rypp and Uzpv, Rypv) applied on
the model in ND_AFT and ND_FORE nodes, are based on the 1D Equivalent Beam Model
vertical deformation analysis (chapter 2.3.1). On the external shell of the model, bottom,
bilge and side shells, the pressure is applied from the equivalent quasi-static wave, for the
parameters from global equilibrium in vertical plane calculated with the 1D Equivalent Beam
Model ( chapter 2.1), using the procedures presented in Appendix A3.1. and A.3.2. This type
of model has further refinements for some structural details, in order to obtain better
resolution of the maximum stress values in the selected hot-spot areas. Usually, it is expected
that the maximum stresses are obtained into the deck panel elements at hatchway or other
similar geometrical details (with significant geometric gradient).
On the basis of the equation (2.3.5), a linear extrapolation of the normal stresses and
equivalent vonMises stresses is made for a hot-spot area (Bureau Veritas,2010),
σhs=1.5σ0.5t-0.5σ1.5t (2.3.5)
where t is equal to maximum between t1 and t2 as it is presented in the figure 2.3.3.
Page 20
20 Cioarec Dan Sebastian
Master Thesis developed at the University " Dunarea de Jos" of Galati, Romania
Fig 2.3.3 Structural joint hotspot stress evaluation (Bureau Veritas,2010)
Based on the 3D-FEM partially extended model, with the same meshing element size
and the global equilibrium parameters along with the beam rotations and deformations
resulting from the 1D Equivalent Beam Model, if the geometry and the mass distributions are
modelled with accuracy for the analyzed ship model, it should result analogous stress
distributions and deformation as for the 3D-FEM full extended ship model, at the centre part.
For the analyzed chemical-tanker, the results from chapters 5, 6, 7 are pointing out this
correlation between the numerical results of the three structural models. In this case a 3D-
FEM partially extended model, having refinements of the mesh at several details, can be used
in order to obtain with higher sensitivity the hot-spots stress factors (see chapter 8).
Page 21
Global and local strength analysis in equivalent quasi-static head waves, for a tanker ship structure,
based on full length and 2-3 cargo holds 3D-FEM models
21
“EMSHIP” Erasmus Mundus Master Course, period of study September 2011 – February 2013
3.THE SHIP STRUCTURE DESCRIPTION, BASED ON THE
CHEMICAL TANKER 4000 TONES PROTOTYPE SHIP
The analysis carried on in this study are focused on a test ship type tanker with double
hull, based on the Chemical Tanker 4000 prototype ship, granted during the internship at Ship
Design Group, Galati.
The following ship data are required for the strength analysis: general arrangement, offset
lines, structural characteristics over several transversal and longitudinal sections, material
characteristics, mass distribution over the ship length, shell expansion.
The ship hull offset lines is based on the prototype ship and the transversal sections
structure scantlings are according to the Bureau Veritas, 2010 Rules. The mass distribution is
based on the full ship hull 3D-CAD/FEM model and the tanker prototype ship.
The ship main dimensions and the frame spacing are displayed below:
Main dimensions:
Length Over All : 109.62 m
Length Between Perpendiculars: 106.20 m
Breadth moulded: 13.50 m
Design draught: 5.45 m
Depth at side (moulded): 8.60 m
Frame spacing over the ship length (Table.3.1)
Table.3.1. Frame spacing ( Ship Design Group 2007)
FRAME mm FRAME mm
-4 26 600 78 80 760
26 29 570 80 81 805
29 46 706 81 113 706
46 47 805 113 114 805
47 77 706 114 135 706
77 78 805 135 143 625
143 158 600
Page 22
22 Cioarec Dan Sebastian
Master Thesis developed at the University " Dunarea de Jos" of Galati, Romania
Fig.3.1. General Arrangement (granted by Ship Design Group Galati, 2007)
As it can be observed from the General Arrangement (Fig.3.1.), the cylindrical part of
the ship is extended over 80 % of the ship length, covering the cargo holds compartments
area. The cargo bays area includes 7 cylindrical structural independent tanks for liquid cargo,
resulting a total of 3950.6 m3 Net Volume.
Fig.3.2. The 2D - Offset Lines (granted by Ship Design Group Galati, 2007)
Starting from the original 2D hull offset lines, I had developed the 3D offset lines,
using AutoCAD. Following, I have developed the external shell surfaces of the 3D-CAD
Model, providing the best accuracy for the geometry.
Page 23
Global and local strength analysis in equivalent quasi-static head waves, for a tanker ship structure,
based on full length and 2-3 cargo holds 3D-FEM models
23
“EMSHIP” Erasmus Mundus Master Course, period of study September 2011 – February 2013
Fig.3.3. The 3D-CAD Offset Lines
Fig.3.4. Chemical Tanker 4000 Tones prototype ship (granted by Ship Design Group 2007)
Fig.3.5. Chemical Tanker 4000 Tones prototype ship amidships a) normal frame transverse section
b) web frame transverse section (granted by Ship Design Group 2007)
Page 24
24 Cioarec Dan Sebastian
Master Thesis developed at the University " Dunarea de Jos" of Galati, Romania
4. GENERATION OF 3D-CAD/FEM MODEL FULL EXTENDED ON
THE SHIP'S LENGTH
In order to develop the 3D-CAD model, the entire length of the ship was divided into
7 main blocks, which are AFT block, Amidships area (block 2, 3, 4, 5, 6) and FORE block.
By using the initial scantlings information and the structural transversal and longitudinal
sections, the model was developed in the AutoCAD 2011 by using 3D faces and multiple
layers, according to the corresponding thickness of the plating.
Fig.4.1. Dividing the ship to blocks (Ship Design Group 2007)
All the layers used in the 3D-CAD modelling, with the corresponding thickness, will
be further used in the 3D-FEM model as geometric properties, in order to define the plates
thickness in the FEM Solid Works Cosmos/M 2007 program. Each layer was developed for a
specific component of the hull structure of the ship, with a thickness and a colour label
assigned, therefore it will facilitate the thickness description in Solid Works Cosmos/M 2007.
Each layer was exported as a DXF file, so the FEM software can import all the layers with
the correct thickness.
Fig.4.2.The 3D-CAD part of the Amidships section between two frames
a) Web Frame; b) Normal Frame
Page 25
Global and local strength analysis in equivalent quasi-static head waves, for a tanker ship structure,
based on full length and 2-3 cargo holds 3D-FEM models
25
“EMSHIP” Erasmus Mundus Master Course, period of study September 2011 – February 2013
In the following figures are presented 3D-CAD/FEM models, as well for the afferent tables
with the plate thickness for each block.
Table.4.1.Figures with 3D - CAD /FEM models of the ship, based on full extended model
Block 3D CAD Model 3D FEM Model Thickness table
1 (AFT) Fig.4.3. Fig.4.4. Appendix 4, Table.A.4.1.
2 Fig.4.5. Fig.4.6. Appendix 4, Table.A.4.2.
3 Fig.4.7. Fig.4.8. Appendix 4, Table.A.4.3.
4 Fig.4.9. Fig.4.10. Appendix 4, Table.A.4.4.
5 Fig.4.11. Fig.4.12. Appendix 4, Table.A.4.5.
6 Fig.4.13. Fig.4.14. Appendix 4, Table.A.4.6.
7 (Fore) Fig.4.15. Fig.4.16. Appendix 4, Table.A.4.7.
Full size Model Fig.4.17. Fig.4.19.
As ship structure materials are selected A and AH40-type grade steel (AH40 fore upper ship
flange panel), with the following characteristics, according to Bureau Veritas (2010):
Tab.4.2. The ship structure materials A, AH40-type grade Steel Characteristics
Property Name Symbol Value
Young's Modulus E 2.1 108 (kN/m
2)
Poisson Ratio υ 0.3
Density ρ 7.7 (t/m3)
Yield stress A ReH 235 MPa
Yield stress AH40 ReH 390 MPa
Admissible stress A adm_GS σ=175 MPa; τ=110 MPa
Admissible stress AH40 adm_GS σ=265 MPa; τ=165 MPa
The 3D - FEM model has been developed by Solid Works Cosmos/M 2007 program,
having NDmax=49508 nodes and ELmax=110558 Triangle Thick Shell elements (SHELL3T
element type, membrane and thick shell with Mindlin formulation). Each shell element has
the corresponding thickness, according to the tanker ship initial scantlings, defined as Real
Constants Sets in appendix A.4.
Page 26
26 Cioarec Dan Sebastian
Master Thesis developed at the University " Dunarea de Jos" of Galati, Romania
Fig.4.3. Aft block of the 3D - CAD model (PS only)
Fig.4.4. Aft block of the 3D - FEM model (PS only)
Page 27
Global and local strength analysis in equivalent quasi-static head waves, for a tanker ship structure,
based on full length and 2-3 cargo holds 3D-FEM models
27
“EMSHIP” Erasmus Mundus Master Course, period of study September 2011 – February 2013
Fig.4.5. Amidships block 2 of the 3D - CAD model (PS only)
Fig.4.6. Amidships block 2 of the 3D - FEM model (PS only)
Page 28
28 Cioarec Dan Sebastian
Master Thesis developed at the University " Dunarea de Jos" of Galati, Romania
Fig.4.7. Amidships block 3 of the 3D - CAD model (PS only)
Fig.4.8. Amidships block 3 of the 3D - FEM model (PS only)
Page 29
Global and local strength analysis in equivalent quasi-static head waves, for a tanker ship structure,
based on full length and 2-3 cargo holds 3D-FEM models
29
“EMSHIP” Erasmus Mundus Master Course, period of study September 2011 – February 2013
Fig.4.9. Amidships block 4 of the 3D - CAD model (PS only)
Fig.4.10. Amidships block 4 of the 3D - FEM model (PS only)
Page 30
30 Cioarec Dan Sebastian
Master Thesis developed at the University " Dunarea de Jos" of Galati, Romania
Fig.4.11. Amidships block 5 of the 3D - CAD model (PS only)
Fig.4.12. Amidships block 5 of the 3D - FEM model (PS only)
Page 31
Global and local strength analysis in equivalent quasi-static head waves, for a tanker ship structure,
based on full length and 2-3 cargo holds 3D-FEM models
31
“EMSHIP” Erasmus Mundus Master Course, period of study September 2011 – February 2013
Fig.4.13. Amidships block 6 of the 3D - CAD model (PS only)
Fig.4.14. Amidships block 6 of the 3D - FEM model (PS only)
Page 32
32 Cioarec Dan Sebastian
Master Thesis developed at the University " Dunarea de Jos" of Galati, Romania
Fig.4.15. Fore block 7 of the 3D - CAD model (PS only)
Fig.4.16. Fore block 7 of the 3D - FEM model (PS only)
Page 33
Global and local strength analysis in equivalent quasi-static head waves, for a tanker ship structure,
based on full length and 2-3 cargo holds 3D-FEM models
33
“EMSHIP” Erasmus Mundus Master Course, period of study September 2011 – February 2013
Fig.4.17. Full sized 3D - CAD model (PS only)
Fig.4.18. Full sized 3D - CAD model without shell plating (PS only)
Page 34
34 Cioarec Dan Sebastian
Master Thesis developed at the University " Dunarea de Jos" of Galati, Romania
Based on the 3D-FEM model previously generated (see Fig.4.4., Fig.4.6., Fig.4.8.,
Fig.4.10., Fig.4.12., Fig.4.14. and Fig.4.16.), each of the ship structural panels were checked,
in order to be in conformity with the geometry provided in the technical drawings, such as
transversal and longitudinal sections and shell expansion. For each block, a neutral GFM file
was created, including only the FEM objects of the block model. The total 3D-FEM model is
obtained in the Solid Works Cosmos/M 2007 program, by assembling all the GFM files,
corresponding to the block model FEM objects.
Fig.4.19. The 3D-FEM Model extended over the entire ship Length (PS only)
Page 35
Global and local strength analysis in equivalent quasi-static head waves, for a tanker ship structure,
based on full length and 2-3 cargo holds 3D-FEM models
35
“EMSHIP” Erasmus Mundus Master Course, period of study September 2011 – February 2013
5. THE GLOBAL SHIP STRENGTHS ANALYSIS BASED ON 1D-
EQUIVALENT BEAM MODEL, UNDER EQUIVALENT QUASI -
STATIC HEAD WAVES.
5.1. The 1D Equivalent Beam Model
The 1D Equivalent Beam Model for the ship hull is selected for an evaluation of the
global strength at the initial design stage, without the possibility to include the local hot-spots
stress domains.
The ship hull offset lines with geometrical nonlinearities (Fig.3.2. The 2D - Offset
Lines), require to obtain the equilibrium conditions of the ship girder in vertical plane using
an nonlinear iterative procedure (Domnisoru, 2006).
The ship girder is considered to have loads from equivalent quasi-static head waves
(having the length of the wave equal to the total length of the ship L), with the statistic height
of the wave in conformity with the classification societies rules (Bureau Veritas, 2010).
The numerical analysis is carried out based on the theoretical model, presented in
subchapter 2.1.
The 1D Equivalent Beam Model analysis is performed by P_ACASV program
(Domnisoru, 2006), developed at the Galati Naval Architecture Department (UGAL).
The input data for the 1D analysis is presented in Appendix 5.1, Table A.5.1, which
contains the mass distribution diagram along the ship's length and the equivalent beam
transversal sections strength characteristics. The height of the equivalent quasi-static head
wave is considered to be in the range hw = 0 – 8.123 m, with the step increment Δhw = 1 m.
The maximum height of the equivalent-quasi static head wave is hwmax = 8.123 m, in
conformity with the Bureau Veritas Rules, 2010, for analysis being selected the hogging and
sagging ship-wave relative positions cases.
5.2. Results by the 1D Equivalent Beam Model Numerical Computation in
Hogging Conditions
The iterative procedure at the global-local ship strength, based on 1D Equivalent
Beam Model, has converged to the following wave medium plane vertical position
parameters (see Table 5.2.1).
Page 36
36 Cioarec Dan Sebastian
Master Thesis developed at the University " Dunarea de Jos" of Galati, Romania
Table.5.2.1. Vertical position parameters of the wave medium plane, in hogging conditions,
based on 1D Equivalent Beam Model
Wave height case [m] Vertical position amidships [m] Trim in the longitudinal plane [rad]
0 4.41235 0.00280000
1 4.34453 0.00093000
2 4.26554 0.00005000
3 4.17685 0.00009000
4 4.07410 0.00121000
5 3.96386 0.00273000
6 3.84601 0.00448000
7 3.71806 0.00645000
8 3.57505 0.00870000
8.123 3.55606 0.00900000
In the following figures are presented the stress distributions obtained at the global-
local strength analysis based on the 1D-Equivalent Beam Model, under Hogging conditions.
- Fig.5.2.1 is presenting the Bending moment M for 1D computation in hogging wave
conditions
- Fig.5.2.2. is presenting the Shear force T for 1D computation in hogging wave conditions
- Fig.5.2.3. and Appendix A.5.2, Table.A.5.2.1. are presenting the Normal Deck Stresses, σX
[MPa] in Hogging wave conditions, 1D computation, and the stress check according to the
admissible stress limit adm_GS
- Fig.5.2.4. and Appendix A.5.2, Table.A.5.2.2. are presenting the Normal Bottom Stresses,
σX [MPa] in Hogging wave conditions, 1D computation, and the stress check according to
the admissible stress limit adm_GS
- Fig. 5.2.5. and Appendix A.5.2, Table. A.5.2.3. are presenting the Tangential side stresses
τxz [MPa] in Hogging wave conditions, 1D computation, and the stress check according to
the admissible stress limit adm_GS
Page 37
Global and local strength analysis in equivalent quasi-static head waves, for a tanker ship structure,
based on full length and 2-3 cargo holds 3D-FEM models
37
“EMSHIP” Erasmus Mundus Master Course, period of study September 2011 – February 2013
Fig.5.2.1. Bending moment M [kNm] for 1D computation in hogging wave conditions
Fig.5.2.2. Shear force T [kN] for 1D computation in hogging wave conditions
-5.00E+04
0.00E+00
5.00E+04
1.00E+05
1.50E+05
2.00E+05
2.50E+05
0.00 10.96 21.92 32.88 43.84 54.81 65.77 76.73 87.69 98.65 109.61
x [m]
M [KNm] 1D-Beam Model Hogging / Quasi-static Wave / CTK Full Load
hw=0m hw=1m hw=2m hw=3m hw=4m
hw=5m hw=6m hw=7m hw=8m hw=8.123m
-8.00E+03
-6.00E+03
-4.00E+03
-2.00E+03
0.00E+00
2.00E+03
4.00E+03
6.00E+03
8.00E+03
0.00 10.96 21.92 32.88 43.84 54.81 65.77 76.73 87.69 98.65 109.61
x [m]
T [KN] 1D-Beam Model Hogging / Quasi-static Wave / CTK Full Load
hw=0m hw=1m hw=2m hw=3m hw=4m
hw=5m hw=6m hw=7m hw=8m hw=8.123m
Page 38
38 Cioarec Dan Sebastian
Master Thesis developed at the University " Dunarea de Jos" of Galati, Romania
Fig.5.2.3. Normal Deck Stress, σX [MPa] in Hogging wave conditions, 1D computation
Fig.5.2.4. Normal Bottom Stress, σX [MPa] in Hogging wave conditions, 1D computation
-50.00
0.00
50.00
100.00
150.00
200.00
250.00
300.00
350.00
400.00
450.00
0.00 10.96 21.92 32.88 43.84 54.81 65.77 76.73 87.69 98.65 109.61
x [m]
SIGx [N/mm2] DECK 1D-beam Model Hogging / Quasi-static Wave / CTK Full Load
hw=0m hw=1m hw=2m hw=3m hw=4m hw=5m
hw=6m hw=7m hw=8m hw=8.123m adm_GS ReH
-250.00
-200.00
-150.00
-100.00
-50.00
0.00
50.00
0.00 10.96 21.92 32.88 43.84 54.81 65.77 76.73 87.69 98.65 109.61
x [m]
SIGx [N/mm2] BOTTOM 1D-beam Model Hogging / Quasi-static Wave / CTK Full Load
hw=0m hw=1m hw=2m hw=3m hw=4m hw=5m
hw=6m hw=7m hw=8m hw=8.123m adm_RH ReH
Page 39
Global and local strength analysis in equivalent quasi-static head waves, for a tanker ship structure,
based on full length and 2-3 cargo holds 3D-FEM models
39
“EMSHIP” Erasmus Mundus Master Course, period of study September 2011 – February 2013
Fig. 5.2.5. Tangential side stress τxz [MPa] in Hogging wave conditions, 1D computation
Based on the numerical data from the Appendix Table. A.5.1.1, A.5.1.2 and A.5.1.3. for the
reference wave height hwBV=8.123 m it results the following synthesis data:
Table.5.2.4. Maximum Hogging stresses based on 1D-Equivalent Beam Model, hw=8.123 m
Panel stress Stress max 1D
[MPa]
Stress adm_GS
[MPa] max/adm_GS
Maximum σx deck 98.25 265 0.37
Maximum σx bottom 71.27 175 0.41
Maximum τxz side 40.9 110 0.37
- The vertical position of the equivalent quasi-static head wave medium plane is changing
from 4.41235 m (hw=0 m) to 3.55606 m (hw=8.123 m), representing a typical condition for
the hogging case, having also an increase of the trim from 0.00280000 rad (hw=0 m) to
0.00900000 (hw=8.123 m).
- The maximum stresses are smaller than the admissible values, the highest ratio being
recorded for the bottom, max/admGS=0.41.
-150.00
-100.00
-50.00
0.00
50.00
100.00
150.00
0.00 10.96 21.92 32.88 43.84 54.81 65.77 76.73 87.69 98.65 109.61
x [m]
TAUxz [N/mm2] N-N 1D-beam Model Hogging / Quasi-static Wave / CTK Full Load
hw=0m hw=1m hw=2m hw=3m hw=4m hw=5m
hw=6m hw=7m hw=8m hw=8.123m adm_GS adm(-)
Page 40
40 Cioarec Dan Sebastian
Master Thesis developed at the University " Dunarea de Jos" of Galati, Romania
5.3. Results by the 1D Equivalent Beam Model Numerical Computation in
Sagging Conditions
The iterative procedure at the global-local ship strength, based on 1D Equivalent
Beam Model, has converged to the following wave medium plane vertical position
parameters.
Table.5.3.1. Vertical position parameters of the wave medium plane, in sagging conditions,
based on 1D Equivalent Beam Model
Wave height case [m] Vertical position amidships [m] Trim in the longitudinal plane [rad]
0 4.41235 0.00280000
1 4.46923 0.00508000
2 4.51777 0.00733000
3 4.55919 0.00942000
4 4.59453 0.01129000
5 4.62491 0.01292000
6 4.65089 0.01428000
7 4.67334 0.01542000
8 4.69267 0.01637000
8.123 4.69483 0.01648000
In the following figures are presented the stress distributions obtained at the global-
local strength analysis based on 1D-Equivalent Beam Model, under Sagging conditions.
- Fig.5.3.1 is presenting the Bending moment M for 1D computation in sagging wave
conditions
- Fig.5.3.2. is presenting the Shear force T for 1D computation in sagging wave conditions
- Fig.5.3.3. and Appendix A.5.3, Table.A.5.3.1. are presenting the Normal Deck Stresses, σX
[MPa] in Sagging wave conditions, 1D computation, and the stress check according to the
admissible stress limit adm_GS
- Fig.5.3.4. and Appendix A.5.3, Table.A.5.3.2. are presenting the Normal Bottom Stresses,
σX [MPa] in Sagging wave conditions, 1D computation, and the stress check according to the
admissible stress limit adm_GS
- Fig. 5.3.5. and Appendix A.5.3, Table. A.5.3.3. are presenting the Tangential side stresses
τxz [MPa] in Sagging wave conditions, 1D computation, and the stress check according to the
admissible stress limit adm_GS.
Page 41
Global and local strength analysis in equivalent quasi-static head waves, for a tanker ship structure,
based on full length and 2-3 cargo holds 3D-FEM models
41
“EMSHIP” Erasmus Mundus Master Course, period of study September 2011 – February 2013
Fig.5.3.1Bending moment M [kNm] for 1D computation in sagging wave conditions
Fig.5.3.2. Shear force T [kN] for 1D computation in sagging wave conditions
-3.00E+05
-2.50E+05
-2.00E+05
-1.50E+05
-1.00E+05
-5.00E+04
0.00E+00
5.00E+04
0.00 10.96 21.92 32.88 43.84 54.81 65.77 76.73 87.69 98.65 109.61
x [m]
M [KNm] 1D-Beam Model Sagging / Quasi-static Wave / CTK Full Load
hw=0m hw=1m hw=2m hw=3m hw=4m
hw=5m hw=6m hw=7m hw=8m hw=8.123m
-1.00E+04
-8.00E+03
-6.00E+03
-4.00E+03
-2.00E+03
0.00E+00
2.00E+03
4.00E+03
6.00E+03
8.00E+03
1.00E+04
0.00 10.96 21.92 32.88 43.84 54.81 65.77 76.73 87.69 98.65 109.61
x [m]
T [KN] 1D-Beam Model Sagging / Quasi-static Wave / CTK Full Load
hw=0m hw=1m hw=2m hw=3m hw=4m
hw=5m hw=6m hw=7m hw=8m hw=8.123m
Page 42
42 Cioarec Dan Sebastian
Master Thesis developed at the University " Dunarea de Jos" of Galati, Romania
Fig.5.3.3. Normal Deck Stress, σX [MPa] in Sagging wave conditions, 1D computation
Fig.5.3.4. Normal Bottom Stress, σX [MPa] in Sagging wave conditions, 1D computation
-450.00
-400.00
-350.00
-300.00
-250.00
-200.00
-150.00
-100.00
-50.00
0.00
50.00
0.00 10.96 21.92 32.88 43.84 54.81 65.77 76.73 87.69 98.65 109.61
x [m]
SIGx [N/mm2] DECK 1D-beam Model Sagging / Quasi-static Wave / CTK Full Load
hw=0m hw=1m hw=2m hw=3m hw=4m hw=5m
hw=6m hw=7m hw=8m hw=8.123m adm_GS ReH
-50.00
0.00
50.00
100.00
150.00
200.00
250.00
0.00 10.96 21.92 32.88 43.84 54.81 65.77 76.73 87.69 98.65 109.61
x [m]
SIGx [N/mm2] BOTTOM 1D-beam Model Sagging / Quasi-static Wave / CTK Full Load
hw=0m hw=1m hw=2m hw=3m hw=4m hw=5m
hw=6m hw=7m hw=8m hw=8.123m adm_GS ReH
Page 43
Global and local strength analysis in equivalent quasi-static head waves, for a tanker ship structure,
based on full length and 2-3 cargo holds 3D-FEM models
43
“EMSHIP” Erasmus Mundus Master Course, period of study September 2011 – February 2013
Fig. 5.3.5. Tangential side stress τxz [MPa] in Sagging wave conditions, 1D computation
Based on the numerical data from Appendix Tables. A.5.2.1, A.5.2.2 and A.5.2.3 for the
reference wave height hwBV=8.123 m it results the following synthesis data:
Table.5.3.4. Maximum Sagging stresses based on 1D-Equivalent Beam Model, hw=8.123 m
Panel stress Stress max 1D
[MPa]
Stress adm_GS
[MPa] max/adm_GS
Maximum σx deck 121.17 265 0.46
Maximum σx bottom 87.90 175 0.50
Maximum τxz side 48.27 110 0.44
- The vertical position of the equivalent quasi-static head wave medium plane is changing
from 4.41235 m (hw=0 m) to 4.69483m (hw=8.123 m), representing a typical condition for the
sagging case, having an increase of the trim from 0.00280000 rad (hw=0 m) to 0.01648000
(hw=8.123 m).
- The maximum stresses are smaller than the admissible values, the highest ratio being
recorded for the bottom, max/admGS=0.50.
-150.00
-100.00
-50.00
0.00
50.00
100.00
150.00
0.00 10.96 21.92 32.88 43.84 54.81 65.77 76.73 87.69 98.65 109.61
x [m]
TAUxz [N/mm2] N-N 1D-beam Model Sagging / Quasi-static Wave / CTK Full Load
hw=0m hw=1m hw=2m hw=3m hw=4m hw=5m
hw=6m hw=7m hw=8m hw=8.123m adm_GS adm(-)
Page 44
44 Cioarec Dan Sebastian
Master Thesis developed at the University " Dunarea de Jos" of Galati, Romania
6. THE NUMERICAL ANALYSIS OF GLOBAL-LOCAL SHIP HULL
STRENGTH, BASED ON 3D-FEM MODEL FULL EXTENDED OVER
THE SHIP LENGTH
According to the theoretical method presented in sub-chapter 2.2, the equivalent
quasi-static head wave pressure loads will be applied on the hull external shell using an
iterative procedure for the free floating and trim conditions equilibrium, implemented with
user subroutines in the FEM solver.
In order to extract the results from the 3D-FEM model post-processing user
subroutines are used for the following data: normal, tangential and vonMises stresses,
deformations, etc.
At the ship global strength analysis, compared as to the simplified method, based on
1D-Equivalent Beam Model, the approach based on 3D-FEM Model extended over the whole
ship length, has the main advantage of direct 3D results distribution.
6.1. Boundary and Loading Conditions
In order to proceed to the numerical analysis, the boundary conditions and the
loadings are defined. Since the model is developed only on Portside, taking into account the
head wave load condition, the following boundary conditions are considered:
Table.6.1. Boundary conditions definition 3D-FEM Full Extended Model
Boundary Conditions
Nodes Node nr. Constraints Type
ND_AFT 31067 UX Neutral
UZ Forced, for equilibrium objective function definition
ND_FORE 46022 UZ Forced, for equilibrium objective function definition
CENTRE PLANE All nodes UY; RX Symmetry, natural
The neutral boundary condition is referring to the AFT node, ND_AFT. Also for this
specific node, a forced boundary condition Uz was applied. For the Fore part of the ship, the
boundary conditions were applied to ND_FORE, forced condition with constraint on Uz
D.O.F. The symmetry condition (natural) is referring to all the nodes in the centre line plane
and this condition is due to the fact that the ship 3D-FEM model is developed only in
Portside (PS).
Page 45
Global and local strength analysis in equivalent quasi-static head waves, for a tanker ship structure,
based on full length and 2-3 cargo holds 3D-FEM models
45
“EMSHIP” Erasmus Mundus Master Course, period of study September 2011 – February 2013
Fig.6.1. Applying the Boundary Conditions on the 3D-FEM Full Extended Model
In order to obtain an accurate structural analysis, the appropriate loads have to be
applied on the 3D-FEM Model. The lightship mass diagram is obtained based on the steel
hull 3D-FEM full extended model and it is presented in Fig.6.2.
Fig.6.2. Lightship Mass distribution, based on 3D-FEM full extended model
The total light ship mass obtained based on the 3D-FEM Model is 1017.282 tones,
using the elements constitutive mass properties.
In order to obtain the entire Hull mass, the onboard mass groups presented in Table
6.2, have to be considered, applied on the 3D-FEM Model as equivalent uniform pressures
over the corresponding surfaces.
0.00000
5.00000
10.00000
15.00000
20.00000
25.00000
0.1
50
6.6
00
13
.20
0
19
.74
4
27
.47
6
35
.34
1
43
.10
7
50
.87
3
58
.94
5
66
.71
1
74
.47
7
82
.34
2
90
.10
8
97
.55
0
10
4.2
50
Mas
s p
er
un
it le
ngt
h (
t/m
)
x (m)
Mass distribution in Light Ship case (hull steel only)
Page 46
46 Cioarec Dan Sebastian
Master Thesis developed at the University " Dunarea de Jos" of Galati, Romania
Table.6.2. Equivalent pressures for onboard mass components
( according to prototype ship from Ship Design Group, Galati 2007)
Chapter Mass [t] Pressure P (kN/m2)
HULL Steel 1017.282
Cargo tanks and systems 271.3 6.79
Miscellaneous 64.3
Hull Outfitting 121.8 13.49
Machinery 68.1 22.31
Accommodation 85.7 5
Systems 71.1 5.5
Electrical 27.7 6.04
TOTAL 1727.282
All of the equivalent pressures from Table 6.2, are applied according to their specific
location, according to the ship's general arrangement plane (Fig.3.1.) and the stability
booklet. Also the weight of the liquid cargo plus the cargo tank structural independent is
applied as uniform pressure distributed on the corresponding supporting surfaces, on the
double bottom (according to the cylindrical cargo tanks geometry Fig.6.5.b). Since not all the
cargo tanks/compartments of the ship are the same , in Table 6.3. are presented the
corresponding pressures. In order to consider for analysis the model weight, the gravity
acceleration g=9.81 [m/s2] has to be included in the input data, in order to generate the
gravity loads.
Figure 6.4 presents the mass distribution over the ship length in the case of full cargo
loading. The ship's displacement at full cargo loading case is 5380.18 tones.
Figure 6.5. a) presents the equivalent pressure distribution over the 3D-FEM model,
for onboard and cargo masses modelling, corresponding to the full cargo loading case. Also it
can be noticed in detail the distribution surface for the cylindrical cargo tanks with
independent structure (Fig.6.5.b).
Fig.6.3. The cargo tanks position over the ship's length (Ship Design Group 2007)
Page 47
Global and local strength analysis in equivalent quasi-static head waves, for a tanker ship structure,
based on full length and 2-3 cargo holds 3D-FEM models
47
“EMSHIP” Erasmus Mundus Master Course, period of study September 2011 – February 2013
Table.6.3 The equivalent pressure from independent filled up structural cargo tanks
Position Mass (t) Pressure P (kN/m2)
CARGO Tank 1 326 62.6
CARGO Tank 2 679
61.1
CARGO Tank 3 679
CARGO Tank 4 679
CARGO Tank 5 679
CARGO Tank 6 679
CARGO Tank 7 679
Fig. 6.4. Mass distribution in Full cargo loading case, 3D-FEM Full Extended Model
Fig.6.5. a) Equivalent Pressure applied on 3D-FEM Model, for onboard and cargo masses modelling,
b) Distribution surface for the cylindrical cargo tanks
0.00000
10.00000
20.00000
30.00000
40.00000
50.00000
60.00000
70.00000
80.00000
90.00000
0.1
50
6.6
00
13
.20
0
19
.74
4
27
.47
6
35
.34
1
43
.10
7
50
.87
3
58
.94
5
66
.71
1
74
.47
7
82
.34
2
90
.10
8
97
.55
0
10
4.2…
Ma
ss p
er
un
it l
eg
th (
t/m
)
x (m)
Mass distribution in the Full cargo loading case
Page 48
48 Cioarec Dan Sebastian
Master Thesis developed at the University " Dunarea de Jos" of Galati, Romania
6.2 Numerical Analysis in Still Water Condition. Hydrostatic Water
Pressure, Deformation and Stress Distributions
The still water equilibrium condition is obtained based on the theoretical model
presented in subchapter 2.2, using the macro-command files procedures, implemented in
Solid Works Comos/ M 2007 software, presented in Appendix A.1.1 and A.1.2, for hw=0.
The external hydrostatic water pressure is applied on bottom, bilge and side shells, during the
iterative procedure for establishing the still water equilibrium condition.
In the following figures are presented the results from the numerical global-local
strength analysis in still water condition (hw=0):
- Fig.6.2.1. External hydrostatic water pressure on the ship hull at still water condition
- Fig.6.2.2. Vertical deflection at the ship girder at still water condition
- Fig.6.2.3. Equivalent vonMises Stress distribution in the cargo compartments (x=18.57 m to
99.42 m) at still water condition.
Fig.6.2.1 External water Hydrostatic Pressure [N/mm
2] applied on the shell plating in Still Water condition
Fig.6.2.2. Vertical deflection on Z direction [m] in Still Water condition
Page 49
Global and local strength analysis in equivalent quasi-static head waves, for a tanker ship structure,
based on full length and 2-3 cargo holds 3D-FEM models
49
“EMSHIP” Erasmus Mundus Master Course, period of study September 2011 – February 2013
Fig.6.2.3. Equivalent vonMises stress distribution [kN/m
2] in Still Water condition,
the cargo holds compartments part (x=18.57 m to 99.42 m)
6.3. Numerical Analysis in Hogging Conditions. Equivalent Quasi-static Wave
Pressure, Deformation and Stress Distributions (Wave height 0-8.123 m)
In the following figures are presented the numerical results obtained at the global-
local strength analysis based on the full extended 3D-FEM Model, under Hogging condition,
using the theoretical method with iterative procedure for ship-wave vertical equilibrium, from
subchapter 2.2. and the macro commands files from appendix A.1.1 and A.1.2 implemented
in the Solid Works Cosmos/M 2007 FEM software.
Table.6.3.1.Figures List with numerical results at the global local strength analysis in hogging
conditions, based on 3D-FEM full extended model
Wave height case [m] Wave pressure
distribution
Total vertical
deflection
vonMises stress
distributions
1 Fig.6.3.3 Fig.6.3.4 Fig.6.3.5
2 Fig.6.3.6 Fig.6.3.7 Fig.6.3.8
3 Fig.6.3.9 Fig.6.3.10 Fig.6.3.11
4 Fig.6.3.12 Fig.6.3.13 Fig.6.3.14
5 Fig.6.3.15 Fig.6.3.16 Fig.6.3.17
6 Fig.6.3.18 Fig.6.3.19 Fig.6.3.20
7 Fig.6.3.21 Fig.6.3.22 Fig.6.3.23
8 Fig.6.3.24 Fig.6.3.25 Fig.6.3.26
8.123 Fig.6.3.27 Fig.6.3.28 Fig.6.3.29
The iterative procedure at the global-local ship strength, based on 3D-FEM full extended
model, has converged to the following wave medium plane vertical position parameters (see
Table.6.3.2.)
Page 50
50 Cioarec Dan Sebastian
Master Thesis developed at the University " Dunarea de Jos" of Galati, Romania
Table.6.3.2. Vertical position parameters of the wave medium plane, in hogging conditions,
based on 3D-FEM full extended model
Wave height case [m] Vertical position amidships [m] Trim in the longitudinal plane [rad]
0 4.41196 0.00318826
1 4.34431 0.00141595
2 4.26268 0.000254517
3 4.17222 0.00047057
4 4.07518 0.0013809
5 3.97264 0.00263539
6 3.86422 0.00406041
7 3.74648 0.00567603
8 3.6132 0.00761187
8.123 3.59531 0.0078738
Fig.6.3.1. Vertical Position Amidships in Hogging and Sagging Wave conditions,
based on 3D-FEM full extended model
Fig.6.3.2. Trim in the Longitudinal Plane in Hogging and Sagging Wave conditions,
based on 3D-FEM full extended model
3.4
3.6
3.8
4
4.2
4.4
4.6
4.8
0 1 2 3 4 5 6 7 8 9
Ve
rtic
al p
osi
tio
n [
m]
Wave height [m]
Vertical Position Amidships
Hogging
Sagging
0
0.005
0.01
0.015
0.02
0 1 2 3 4 5 6 7 8 9
Trim
[rad
]
Wave height [m]
Trim in the Longitudinal Plane
Hogging
Sagging
Page 51
Global and local strength analysis in equivalent quasi-static head waves, for a tanker ship structure,
based on full length and 2-3 cargo holds 3D-FEM models
51
“EMSHIP” Erasmus Mundus Master Course, period of study September 2011 – February 2013
Hogging conditions hw=1 m equivalent quasi-static head wave height
Fig.6.3.3 Hydrostatic Pressure from the external equivalent quasi-static wave applied on the ship hull,
Wave height 1 m, Hogging condition
Fig.6.3.4. Vertical deflection on Z direction (m), Wave height 1 m, Hogging condition
Fig.6.3.5. Equivalent vonMises stress distribution [kN/m
2] ,at the cargo compartments part
(x=18.57 m to 99.42 m), Wave height 1 m, Hogging condition
Page 52
52 Cioarec Dan Sebastian
Master Thesis developed at the University " Dunarea de Jos" of Galati, Romania
Hogging conditions hw=2 m equivalent quasi-static head wave height
Fig.6.3.6. Hydrostatic Pressure from the external equivalent quasi-static wave applied on the ship hull,
Wave height 2 m, Hogging condition
Fig.6.3.7. Vertical deflection on Z direction (m), Wave height 2 m, Hogging condition
Fig.6.3.8. Equivalent vonMises stress distribution [kN/m
2] ,at the cargo compartments part
(x=18.57 m to 99.42 m), Wave height 2 m, Hogging condition
Page 53
Global and local strength analysis in equivalent quasi-static head waves, for a tanker ship structure,
based on full length and 2-3 cargo holds 3D-FEM models
53
“EMSHIP” Erasmus Mundus Master Course, period of study September 2011 – February 2013
Hogging conditions hw=3 m equivalent quasi-static head wave height
Fig.6.3.9 Hydrostatic Pressure from the external equivalent quasi-static wave applied on the ship hull,
Wave height 3 m, Hogging condition
Fig.6.3.10. Vertical deflection on Z direction (m), Wave height 3 m, Hogging condition
Fig.5.3.11. Equivalent vonMises stress distribution [kN/m2] ,at the cargo compartments part
(x=18.57 m to 99.42 m), Wave height 3 m, Hogging condition
Page 54
54 Cioarec Dan Sebastian
Master Thesis developed at the University " Dunarea de Jos" of Galati, Romania
Hogging conditions hw=4 m equivalent quasi-static head wave height
Fig.6.3.12. Hydrostatic Pressure from the external equivalent quasi-static wave applied on the ship
hull, Wave height 4 m, Hogging condition
Fig.6.3.13. Vertical deflection on Z direction (m), Wave height 4 m, Hogging condition
Fig.6.3.14. Equivalent vonMises stress distribution [kN/m
2] ,at the cargo compartments part
(x=18.57 m to 99.42 m), Wave height 4 m, Hogging condition
Page 55
Global and local strength analysis in equivalent quasi-static head waves, for a tanker ship structure,
based on full length and 2-3 cargo holds 3D-FEM models
55
“EMSHIP” Erasmus Mundus Master Course, period of study September 2011 – February 2013
Hogging conditions hw=5 m equivalent quasi-static head wave height
Fig.6.3.15 Hydrostatic Pressure from the external equivalent quasi-static wave applied on the ship
hull, Wave height 5 m, Hogging condition
Fig.6.3.16. Vertical deflection on Z direction (m), Wave height 5 m, Hogging condition
Fig.6.3.17. Equivalent vonMises stress distribution [kN/m2] ,at the cargo compartments part
(x=18.57 m to 99.42 m), Wave height 5 m, Hogging condition
Page 56
56 Cioarec Dan Sebastian
Master Thesis developed at the University " Dunarea de Jos" of Galati, Romania
Hogging conditions hw=6 m equivalent quasi-static head wave height
Fig.6.3.18. Hydrostatic Pressure from the external equivalent quasi-static wave applied on the ship
hull, Wave height 6 m, Hogging condition
Fig.6.3.19. Vertical deflection on Z direction (m), Wave height 6 m, Hogging condition
Fig.6.3.20. Equivalent vonMises stress distribution [kN/m2] ,at the cargo compartments part (x=18.57
m to 99.42 m), Wave height 6 m, Hogging condition
Page 57
Global and local strength analysis in equivalent quasi-static head waves, for a tanker ship structure,
based on full length and 2-3 cargo holds 3D-FEM models
57
“EMSHIP” Erasmus Mundus Master Course, period of study September 2011 – February 2013
Hogging conditions hw=7 m equivalent quasi-static head wave height
Fig.6.3.21. Hydrostatic Pressure from the external equivalent quasi-static wave applied on the ship
hull, Wave height 7 m, Hogging condition
Fig.6.3.22. Vertical deflection on Z direction (m), Wave height 7 m, Hogging condition
Fig.6.3.23. Equivalent vonMises stress distribution [kN/m2] ,at the cargo compartments part
(x=18.57 m to 99.42 m), Wave height 7 m, Hogging condition
Page 58
58 Cioarec Dan Sebastian
Master Thesis developed at the University " Dunarea de Jos" of Galati, Romania
Hogging conditions hw= 8 m equivalent quasi-static head wave height
Fig.6.3.24. Hydrostatic Pressure from the external equivalent quasi-static wave applied on the ship
hull, Wave height 8 m, Hogging condition
Fig.6.3.25. Vertical deflection on Z direction (m), Wave height 8 m, Hogging condition
Fig.6.3.26. Equivalent vonMises stress distribution [kN/m2] ,at the cargo compartments part
(x=18.57 m to 99.42 m), Wave height 8 m, Hogging condition
Page 59
Global and local strength analysis in equivalent quasi-static head waves, for a tanker ship structure,
based on full length and 2-3 cargo holds 3D-FEM models
59
“EMSHIP” Erasmus Mundus Master Course, period of study September 2011 – February 2013
Hogging conditions hw=8.123 m equivalent quasi-static head wave height
Fig.6.3.27. Hydrostatic Pressure from the external equivalent quasi-static wave applied on the ship
hull, Wave height 8.123 m, Hogging condition
Fig.6.3.28. Vertical deflection on Z direction (m), Wave height 8.123 m, Hogging condition
Fig.6.3.29. Equivalent vonMises stress distribution [kN/m2], at the cargo compartments part
(x=18.57 m to 99.42 m), Wave height 8.123 m, Hogging condition
Page 60
60 Cioarec Dan Sebastian
Master Thesis developed at the University " Dunarea de Jos" of Galati, Romania
6.4. Discussions and Conclusions for the Numerical Computation in
Hogging Conditions, Based on Full Extended 3D-FEM Model
In the following figures are presented the maximum values for stress distributions
obtained at the global- local strength analysis, based on the full extended 3D-FEM Model, in
Hogging conditions. For selected panels (Deck, Bottom, Side) and a given transversal section
the maximum stress value result from the equation 2.2.2:
- Fig. 6.4.1 and Appendix A.6.1, Table A.6.1.1. are presenting the Maximum Normal Deck
Stress, σx [MPa] in Hogging wave conditions, 3D-FEM full extended model, and the safety
coefficients Cs according to the yield stress limit ReH.
- Fig.6.4.2. and Appendix A.6.1, Table.A.6.1.2. are presenting the Maximum Equivalent
vonMises Deck Stress, σvon [MPa] in Hogging wave conditions, 3D-FEM full extended
model, and the safety coefficients Cs according to the yield stress limit ReH.
- Fig.6.4.3. and Appendix A.6.1, Table.A.6.1.3. are presenting the Maximum Normal Bottom
Stress, σx [MPa] in Hogging wave conditions, 3D-FEM full extended model, and the safety
coefficients Cs according to the yield stress limit ReH.
- Fig.6.4.4. and Appendix A.6.1, Table.A.6.1.4. are presenting the Maximum Equivalent
vonMises Bottom Stress, σvon [MPa] in Hogging wave conditions, 3D-FEM full extended
model, and the safety coefficients Cs according to the yield stress limit ReH.
- Fig.6.4.5. and Appendix A.6.1, Table.A.6.1.5. are presenting the Maximum Tangential side
stress τxz [MPa] in Hogging wave conditions, 3D-FEM full extended model.
Page 61
Global and local strength analysis in equivalent quasi-static head waves, for a tanker ship structure,
based on full length and 2-3 cargo holds 3D-FEM models
61
“EMSHIP” Erasmus Mundus Master Course, period of study September 2011 – February 2013
Fig.6.4.1. Maximum Normal Deck Stress, σX [MPa] in Hogging wave conditions,
3D-FEM full extended model
Fig.6.4.2. Maximum Equivalent vonMises Deck Stress, σvon [MPa] in Hogging wave conditions,
3D-FEM full extended model
-50.00
0.00
50.00
100.00
150.00
200.00
250.00
300.00
350.00
400.00
450.00
0.00 10.96 21.92 32.88 43.84 54.81 65.77 76.73 87.69 98.65 109.61
x [m]
SIGx [N/mm2] DECK max(max) 3D-FEM Model Hogging / Quasi-static Wave / CTK Full Load
hw=0m hw=1m hw=2m hw=3m hw=4m hw=5m
hw=6m hw=7m hw=8m hw=8.123m adm_GS ReH
0.00
50.00
100.00
150.00
200.00
250.00
300.00
350.00
400.00
450.00
0.00 10.96 21.92 32.88 43.84 54.81 65.77 76.73 87.69 98.65 109.61
x [m]
SIGVON [N/mm2] DECK max(max) 3D-FEM Model Hogging / Quasi-static Wave / CTK Full Load
hw=0m hw=1m hw=2m hw=3m hw=4m hw=5m
hw=6m hw=7m hw=8m hw=8.123m adm_GS ReH
Page 62
62 Cioarec Dan Sebastian
Master Thesis developed at the University " Dunarea de Jos" of Galati, Romania
Fig.6.4.3. Maximum Normal Bottom Stress, σX [MPa] in Hogging wave conditions,
3D-FEM full extended model
Fig.6.4.4. Maximum Equivalent vonMises Bottom Stress, σvon [MPa] in Hogging wave conditions,
3D-FEM full extended model
-250.00
-200.00
-150.00
-100.00
-50.00
0.00
50.00
0.00 10.96 21.92 32.88 43.84 54.81 65.77 76.73 87.69 98.65 109.61
x [m]
SIGx [N/mm2] BOTTOM max(max) 3D-FEM Model Hogging / Quasi-static Wave / CTK Full Load
hw=0m hw=1m hw=2m hw=3m hw=4m hw=5m
hw=6m hw=7m hw=8m hw=8.123m adm_GS ReH
0.00
50.00
100.00
150.00
200.00
250.00
0.00 10.96 21.92 32.88 43.84 54.81 65.77 76.73 87.69 98.65 109.61
x [m]
SIGVON [N/mm2] BOTTOM max(max) 3D-FEM Model Hogging / Quasi-static Wave / CTK Full Load
hw=0m hw=1m hw=2m hw=3m hw=4m hw=5m
hw=6m hw=7m hw=8m hw=8.123m adm_GS ReH
Page 63
Global and local strength analysis in equivalent quasi-static head waves, for a tanker ship structure,
based on full length and 2-3 cargo holds 3D-FEM models
63
“EMSHIP” Erasmus Mundus Master Course, period of study September 2011 – February 2013
Fig.6.4.5. Maximum Tangential side stress τxz [MPa] in Hogging wave conditions,
3D-FEM full extended model
Based on figures Fig.6.3.4; Fig.6.3.7; Fig.6.3.10; Fig.6.3.13; Fig.6.3.16; Fig.6.3.19;
Fig.6.3.22; Fig.6.3.25; Fig.6.3.28, in Table 6.4.6 the global vertical deflections are presented for the
ship hull structure in Hogging condition.
Table.6.4.6. Maximum vertical deflections based on 3D-FEM full extended model in Hogging condition
hw [m] wmax [m] wadm=L/500 [m] |wmax|/wadm
0 -0.0459
0.2192
0.209397
1 -0.0412 0.187956
2 0.0403 0.183832
3 0.0538 0.245413
4 0.0669 0.30517
5 0.0797 0.363558
6 0.0921 0.420122
7 0.1039 0.473949
8 0.1145 0.522302
8.123 0.1156 0.527319
The maximum deflection (Table 6.4.6) is smaller than the addmisible value (0.527 < 1).
Based on the numerical data from Appendix Tables A.6.1.1, A.6.1.2, A.6.1.3, A.6.1.4 and
A.6.1.5, for the reference wave height hwBV=8.123 m it results the following synthesis data:
-150.00
-100.00
-50.00
0.00
50.00
100.00
150.00
0.00 10.96 21.92 32.88 43.84 54.81 65.77 76.73 87.69 98.65 109.61
x[m]
TAUxz [N/mm2] N-N max(max) 3D-FEM Model Hogging / Quasi-static Wave / CTK Full Load
hw=0m hw=1m hw=2m hw=3m hw=4m hw=5m
hw=6m hw=7m hw=8m hw=8.123m adm_GS adm(-)
Page 64
64 Cioarec Dan Sebastian
Master Thesis developed at the University " Dunarea de Jos" of Galati, Romania
Table.6.4.7. Maximum Hogging stresses based on 3D-FEM full extended model, hw=8.123 m
Panel stress Stress 3D
[MPa]
ReH
[MPa] Cs=ReH/Stress_3D Stress 1D [MPa] 3D/1D
Maximum σx
deck 241.20 390 1.617 98.25 2.45
Maximum
σvonM deck 217.80 390 1.791 98.25 2.21
Maximum σx
bottom 94.89 235 2.477 71.27 1.33
Maximum
σvonM bottom 85.62 235 2.745 71.27 1.20
Panel stress 3D
[MPa]
adm
[MPa] 3D / adm
1D
[MPa] 3D/1D
Maximum τxz
side 34.70 110 0.315 40.09 0.86
where Cs represents the strength safety coefficient for deck (D) and bottom (B) panels, (on
upper and lower ship girder panels the normal stresses are dominant, equation 2.2.1) taking as
reference the steel yield stress ReH limit, for the resulting maximum 3D-FEM stresses.
Based on the numerical data from chapter 5.2., and tables (Table.6.4.6,
Table.6.4.7.and Table.6.3.2 with the equilibrium parameters) it results the following
conclusions at Hogging conditions:
- The vertical position of the equivalent quasi-static wave medium plane is changing from
4.412 m (hw=0 m) to 3.595 m (hw=8.123 m), representing a typical condition for the hogging
case, coupled with the increase of the trim from 0.003188 rad (hw=0 m) to 0.007873
(hw=8.123 m). Those values are in good agreement with the equilibrium parameters based on
1D Equivalent Beam model (chapter 5, Table.5.2.1.).
- The maximum vonMises stresses are smaller than the normal σx stresses in the ship extreme
fibre panels ( deck and bottom), according to equation 2.2.1. chapter 2.2.6.
- The maximum stresses result at the deck panel, with significant hot spots around the liquid
cargo tank hatch. More accurate hotspots stress factors will be computed based on a finer
mesh model (chapter 8).
- All the stress safety coefficients having the yield stress limit reference are higher than 1, the
smallest value being recorded for the deck around the hatch hotspot area 1.617>1.
- Comparing the maximum stresses between the 3D FEM full extended model and the 1D
Equivalent BEAM model, it results that the 3D - FEM Model stresses are 2.21 - 2.45 times
larger than the 1D model, for the deck, 1.20- 1.33 times larger for the bottom and smaller on
the tangential side stresses (without significant hotspots).
- The ratio between 3D/1D stress values are pointing clear that the deck panel has significant
hotspots areas, even if the 3D-FEM model has a coarse mesh size.
Page 65
Global and local strength analysis in equivalent quasi-static head waves, for a tanker ship structure,
based on full length and 2-3 cargo holds 3D-FEM models
65
“EMSHIP” Erasmus Mundus Master Course, period of study September 2011 – February 2013
6.5. Numerical Analysis in Sagging Conditions. Equivalent Quasi-static Wave
Pressure, Deformation and Stress Distributions (Wave height 0-8.123 m)
In the following figures are presented the numerical results obtained at the global-
local strength analysis based on the full extended 3D-FEM Model, under Sagging condition,
using the theoretical method with iterative procedure for ship-wave vertical equilibrium, from
subchapter 2.2, and the macro commands files from Appendix A.1.1 and A.1.2. implemented
in the SolidWorks Cosmos/M 2007 FEM software.
Table.6.5.1.Figures List with numerical results at the global local strength analysis in Sagging
conditions, based on 3D-FEM full extended model
Wave height case [m] Wave pressure
distribution
Total vertical
deflection
vonMises stress
distributions
1 Fig.6.5.1 Fig.6.5.2 Fig.6.5.3
2 Fig.6.5.4 Fig.6.5.5 Fig.6.5.6
3 Fig.6.5.7 Fig.6.5.8 Fig.6.5.9
4 Fig.6.5.10 Fig.6.5.11 Fig.6.5.12
5 Fig.6.5.13 Fig.6.5.14 Fig.6.5.15
6 Fig.6.5.16 Fig.6.5.17 Fig.6.5.18
7 Fig.6.5.19 Fig.6.5.20 Fig.6.5.21
8 Fig.6.5.22 Fig.6.5.23 Fig.6.5.24
8.123 Fig.6.5.25 Fig.6.5.26 Fig.6.5.27
The iterative procedure at the global-local ship strength, based on 3D-FEM full extended
model, has converged to the following wave medium plane vertical position parameters.
Table.6.5.2. Vertical position parameters of the wave medium plane, in sagging conditions,
based on 3D-FEM full extended model
Wave height case [m] Vertical position amidships
[m] Trim in the longitudinal plane[rad]
0 4.412 0.003
1 4.469 0.007
2 4.518 0.010
3 4.562 0.013
4 4.602 0.015
5 4.638 0.016
6 4.671 0.017
7 4.700 0.018
8 4.726 0.019
8.123 4.729 0.019
with graphical presentation in Fig.6.3.1 for Vertical position amidships and Fig.6.3.2 for
Trim in the longitudinal plane.
Page 66
66 Cioarec Dan Sebastian
Master Thesis developed at the University " Dunarea de Jos" of Galati, Romania
Sagging conditions hw=1 m equivalent quasi-static head wave height
Fig.6.5.1. Hydrostatic Pressure from the external equivalent quasi-static wave applied on the ship hull,
Wave height 1 m, Sagging condition
Fig.6.5.2. Vertical deflection on Z direction (m), Wave height 1 m, Sagging condition
Fig.6.5.3. Equivalent vonMises stress distribution [kN/m2] ,at the cargo compartments part
(x=18.57 m 99.42 m), Wave height 1 m, Sagging condition
Page 67
Global and local strength analysis in equivalent quasi-static head waves, for a tanker ship structure,
based on full length and 2-3 cargo holds 3D-FEM models
67
“EMSHIP” Erasmus Mundus Master Course, period of study September 2011 – February 2013
Sagging conditions hw=2 m equivalent quasi-static head wave height
Fig.6.5.4. Hydrostatic Pressure from the external equivalent quasi-static wave applied on the ship hull,
Wave height 2 m, Sagging condition
Fig.6.5.5. Vertical deflection on Z direction (m), Wave height 2 m, Sagging condition
Fig.6.5.6. Equivalent vonMises stress distribution [kN/m2] ,at the cargo compartments part
(x=18.57 m to 99.42 m), Wave height 2 m, Sagging condition
Page 68
68 Cioarec Dan Sebastian
Master Thesis developed at the University " Dunarea de Jos" of Galati, Romania
Sagging conditions hw=3 m equivalent quasi-static head wave height
Fig.6.5.7. Hydrostatic Pressure from the external equivalent quasi-static wave applied on the ship hull,
Wave height 3 m, Sagging condition
Fig.6.5.8. Vertical deflection on Z direction (m), Wave height 3 m, Sagging condition
Fig.6.5.9. Equivalent vonMises stress distribution [kN/m2] ,at the cargo compartments part
(x=18.57 m to 99.42 m), Wave height 3 m, Sagging condition
Page 69
Global and local strength analysis in equivalent quasi-static head waves, for a tanker ship structure,
based on full length and 2-3 cargo holds 3D-FEM models
69
“EMSHIP” Erasmus Mundus Master Course, period of study September 2011 – February 2013
Sagging conditions hw=4 m equivalent quasi-static head wave height
Fig.6.5.10. Hydrostatic Pressure from the external equivalent quasi-static wave applied on the ship
hull, Wave height 4 m, Sagging condition
Fig.6.5.11. Vertical deflection on Z direction (m), Wave height 4 m, Sagging condition
Fig.6.5.12. Equivalent vonMises stress distribution [kN/m2] ,at the cargo compartments part
(x=18.57 m to 99.42 m), Wave height 4 m, Sagging condition
Page 70
70 Cioarec Dan Sebastian
Master Thesis developed at the University " Dunarea de Jos" of Galati, Romania
Sagging conditions hw=5 m equivalent quasi-static head wave height
Fig.6.5.13. Hydrostatic Pressure from the external equivalent quasi-static wave applied on the ship
hull, Wave height 5 m, Sagging condition
Fig.6.5.14. Vertical deflection on Z direction (m), Wave height 5 m, Sagging condition
Fig.6.5.15. Equivalent vonMises stress distribution [kN/m2] ,at the cargo compartments part
(x=18.57 m to 99.42 m), Wave height 5 m, Sagging condition
Page 71
Global and local strength analysis in equivalent quasi-static head waves, for a tanker ship structure,
based on full length and 2-3 cargo holds 3D-FEM models
71
“EMSHIP” Erasmus Mundus Master Course, period of study September 2011 – February 2013
Sagging conditions hw=6 m equivalent quasi-static head wave height
Fig.6.5.16. Hydrostatic Pressure from the external equivalent quasi-static wave applied on the ship
hull, Wave height 6 m, Sagging condition
Fig.6.5.17. Vertical deflection on Z direction (m), Wave height 6 m, Sagging condition
Fig.6.5.18. Equivalent vonMises stress distribution [kN/m2] ,at the cargo compartments part
(x=18.57 m to 99.42 m), Wave height 6 m, Sagging condition
Page 72
72 Cioarec Dan Sebastian
Master Thesis developed at the University " Dunarea de Jos" of Galati, Romania
Sagging conditions hw=7 m equivalent quasi-static head wave height
Fig.6.5.19. Hydrostatic Pressure from the external equivalent quasi-static wave applied on the ship
hull, Wave height 7 m, Sagging condition
Fig.6.5.20. Vertical deflection on Z direction (m), Wave height 7 m, Sagging condition
Fig.6.5.21. Equivalent vonMises stress distribution [kN/m2] ,at the cargo compartments part
(x=18.57 m to 99.42 m), Wave height 7 m, Sagging condition
Page 73
Global and local strength analysis in equivalent quasi-static head waves, for a tanker ship structure,
based on full length and 2-3 cargo holds 3D-FEM models
73
“EMSHIP” Erasmus Mundus Master Course, period of study September 2011 – February 2013
Sagging conditions hw=8 m equivalent quasi-static head wave height
Fig.6.5.22. Hydrostatic Pressure from the external equivalent quasi-static wave applied on the ship
hull, Wave height 8 m, Sagging condition
Fig.6.5.23. Vertical deflection on Z direction (m), Wave height 8 m, Sagging condition
Fig.6.5.24. Equivalent vonMises stress distribution [kN/m2] ,at the cargo compartments part
(x=18.57 m to 99.42 m), Wave height 8 m, Sagging condition
Page 74
74 Cioarec Dan Sebastian
Master Thesis developed at the University " Dunarea de Jos" of Galati, Romania
Sagging conditions hw=8.123 m equivalent quasi-static head wave height
Fig.6.5.25. Hydrostatic Pressure from the external equivalent quasi-static wave applied on the ship
hull, Wave height 8.123 m, Sagging condition
Fig.6.5.26. Vertical deflection on Z direction (m), Wave height 8.123 m, Sagging condition
Fig.6.5.27. Equivalent vonMises stress distribution [kN/m2] ,at the cargo compartments part
(x=18.57 m to 99.42 m), Wave height 8.123 m, Sagging condition
Page 75
Global and local strength analysis in equivalent quasi-static head waves, for a tanker ship structure,
based on full length and 2-3 cargo holds 3D-FEM models
75
“EMSHIP” Erasmus Mundus Master Course, period of study September 2011 – February 2013
Fig.6.5.28. Equivalent vonMises stress distribution detail [kN/m2] ,at the cargo compartments part,
Wave height 8.123 m, Sagging condition
6.6. Discussions and Conclusions for the Numerical Computation in
Sagging Conditions, Based on Full Extended 3D-FEM Model
In the following figures are presented the maximum values for stress distributions
obtained at the global- local strength analysis based on the full extended 3D-FEM Model,
under Sagging conditions. For selected panels (Deck, Bottom, Side) and a given transversal
section the maximum stress value, according to equation 2.2.2.:
- Fig. 6.6.1 and Appendix A.6.2, Table A.6.2.1. are presenting the Maximum Normal Deck
Stress, σX [MPa] in Sagging wave conditions, 3D-FEM full extended model, and the safety
coefficients Cs according to the yield stress limit ReH.
- Fig.6.6.2. and Appendix A.6.2, Table.A.6.2.2. are presenting the Maximum Equivalent
vonMises Deck Stress, σvon [MPa] in Sagging wave conditions, 3D-FEM full extended model,
and the safety coefficients Cs according to the yield stress limit ReH.
- Fig.6.6.3. and Appendix A.6.2, Table.A.6.2.3. are presenting the Maximum Normal Bottom
Stress, σX [MPa] in Sagging wave conditions, 3D-FEM full extended model, and the safety
coefficients Cs according to the yield stress limit ReH.
- Fig.6.6.4. and Appendix A.6.2, Table.A.6.2.4. are presenting the Maximum Equivalent
vonMises Bottom Stress, σvon [MPa] in Sagging wave conditions, 3D-FEM full extended
model, and the safety coefficients Cs according to the yield stress limit ReH.
- Fig.6.6.5. and Appendix A.6.2, Table.A.6.2.5. are presenting the Maximum Tangential side
stress τxz [MPa] in Sagging wave conditions, 3D-FEM full extended model.
Page 76
76 Cioarec Dan Sebastian
Master Thesis developed at the University " Dunarea de Jos" of Galati, Romania
Fig.6.6.1. Maximum Normal Deck Stress, σX [MPa] in Sagging wave conditions,
3D-FEM full extended model
Fig.6.6.2. Maximum Equivalent vonMises Deck Stress, σvon [MPa] in Sagging wave conditions,
3D-FEM full extended model
-450.00
-400.00
-350.00
-300.00
-250.00
-200.00
-150.00
-100.00
-50.00
0.00
50.00
0.00 10.96 21.92 32.88 43.84 54.81 65.77 76.73 87.69 98.65 109.61
x [m]
SIGx [N/mm2] DECK max(max) 3D-FEM Model Sagging / Quasi-static Wave / CTK Full Load
hw=0m hw=1m hw=2m hw=3m hw=4m hw=5m
hw=6m hw=7m hw=8m hw=8.123m adm_GS ReH
0.00
50.00
100.00
150.00
200.00
250.00
300.00
350.00
400.00
450.00
0.00 10.96 21.92 32.88 43.84 54.81 65.77 76.73 87.69 98.65 109.61
x [m]
SIGVON [N/mm2] DECK max(max) 3D-FEM Model Sagging / Quasi-static Wave / CTK Full Load
hw=0m hw=1m hw=2m hw=3m hw=4m hw=5m
hw=6m hw=7m hw=8m hw=8.123m adm_GS ReH
Page 77
Global and local strength analysis in equivalent quasi-static head waves, for a tanker ship structure,
based on full length and 2-3 cargo holds 3D-FEM models
77
“EMSHIP” Erasmus Mundus Master Course, period of study September 2011 – February 2013
Fig.6.6.3. Maximum Normal Bottom Stress, σX [MPa] in Sagging wave conditions,
3D-FEM full extended model
Fig.6.6.4. Maximum Equivalent vonMises Bottom Stress, σvon [MPa] in Sagging wave conditions,
3D-FEM full extended model
-100.00
-50.00
0.00
50.00
100.00
150.00
200.00
250.00
300.00
0.00 10.96 21.92 32.88 43.84 54.81 65.77 76.73 87.69 98.65 109.61
x [m]
SIGx [N/mm2] BOTTOM max(max) 3D-FEM Model Sagging / Quasi-static Wave / CTK Full Load
hw=0m hw=1m hw=2m hw=3m hw=4m hw=5m
hw=6m hw=7m hw=8m hw=8.123m adm_GS ReH
0.00
50.00
100.00
150.00
200.00
250.00
0.00 10.96 21.92 32.88 43.84 54.81 65.77 76.73 87.69 98.65 109.61
x [m]
SIGVON [N/mm2] BOTTOM max(max) 3D-FEM Model Sagging / Quasi-static Wave / CTK Full Load
hw=0m hw=1m hw=2m hw=3m hw=4m hw=5m
hw=6m hw=7m hw=8m hw=8.123m adm_GS ReH
Page 78
78 Cioarec Dan Sebastian
Master Thesis developed at the University " Dunarea de Jos" of Galati, Romania
Fig.6.6.5. Maximum Tangential side stress τxz [MPa] in Sagging wave conditions,
3D-FEM full extended model
Based on figures (Fig.6.5.2; Fig.6.5.5; Fig.6.5.8; Fig.6.5.11; Fig.6.5.14; Fig.6.5.17;
Fig.6.5.20; Fig.6.5.23; Fig.6.5.26) in Table 6.6.6, the global vertical deflections are presented
for the ship hull structure in Sagging conditions.
Table.6.6.6. Maximum vertical deflections based on 3D-FEM full extended model in Sagging conditions
hw [m] wmax [m] wadm=L/500 [m] |wmax|/wadm
0 -0.045906
0.2192
0.20939
1 -0.053879 0.24579
2 -0.060812 0.27743
3 -0.067775 0.30919
4 -0.074589 0.34028
5 -0.088574 0.40408
6 -0.108070 0.49302
7 -0.127900 0.58349
8 -0.148170 0.67596
8.123 -0.150690 0.68745
Based on the numerical data from the tables( Appendix Table A.6.2.1, A.6.2.2,
A.6.2.3, A.6.2.4 and A.6.2.5) for the reference wave height hwBV=8.123 m it results the
following synthesis data:
-150.00
-100.00
-50.00
0.00
50.00
100.00
150.00
0.00 10.96 21.92 32.88 43.84 54.81 65.77 76.73 87.69 98.65 109.61
x[m]
TAUxz [N/mm2] N-N max(max) 3D-FEM Model Sagging / Quasi-static Wave / CTK Full Load
hw=0m hw=1m hw=2m hw=3m hw=4m hw=5m
hw=6m hw=7m hw=8m hw=8.123m adm_GS adm(-)
Page 79
Global and local strength analysis in equivalent quasi-static head waves, for a tanker ship structure,
based on full length and 2-3 cargo holds 3D-FEM models
79
“EMSHIP” Erasmus Mundus Master Course, period of study September 2011 – February 2013
Table.6.6.7. Maximum Sagging stresses based on 3D-FEM full extended model, hw=8.123 m
Panel stress Stress 3D
[MPa] ReH [MPa] Cs=ReH/Stress_3D
Stress 1D
[MPa] 3D/1D
Maximum σx
deck 329.90 390 1.18 121.17 2.72
Maximum
σvonM deck 297.90 390 1.30 121.17 2.46
Maximum σx
bottom 111.30 235 2.11 87.90 1.27
Maximum
σvonM bottom 106.50 235 2.207 87.90 1.21
Panel stress 3D
[MPa] adm [MPa] 3D / adm
1D
[MPa] 3D/1D
Maximum τxz
side 47.85 110 0.435 48.27 0.99
Based on the numerical data from chapter 5.3, and tables (Table.6.6.6, Table.6.6.7.
and Table.6.5.2 with the equilibrium parameters) it results the following conclusions at
Sagging conditions:
- The maximum deflection (Table 6.6.6) is smaller than the admissible value (0.687 < 1).
- The vertical position of the equivalent quasi-static wave medium plane is changing from
4.412 m (hw=0 m) to 4.729 m (hw=8.123 m), representing a typical condition for the sagging
case, coupled with the increase of the trim from 0.003188 rad (hw=0 m) to 0.019032
(hw=8.123 m). Those values are in good agreement with the equilibrium parameters based on
1D Equivalent Beam model (chapter 5, Table.5.3.1.).
- The maximum vonMises stresses are smaller than the normal σx stresses in the ship extreme
fibre panels ( deck and bottom) according to equation 2.2.1. chapter 2.2.6.
- The maximum stresses results in the deck panel, with significant hot spots around the liquid
cargo tank hatch. More accurate hotspots stress factors will be computed based on finer mesh
model (chapter 8).
- All the Cs stress safety coefficients, having the yield stress limit reference, are higher than
1, the smallest value being recorded for the deck around the hotspot area 1.18 - 1.30 > 1.
- Comparing the maximum stresses between the 3D-FEM full extended model and the 1D
Equivalent Beam model, it results that the 3D-FEM Model stresses are 2.46 - 2.72 times
larger than the 1D model, for the deck, 1.21- 1.27 times larger for the bottom and similar on
the tangential side stresses, with a value of 0.99 1.
- The ratio between 3D/1D stress values are pointing clear that the deck panel has significant
hatch hotspots areas, even if the 3D-FEM model has a coarse mesh size.
Page 80
80 Cioarec Dan Sebastian
Master Thesis developed at the University " Dunarea de Jos" of Galati, Romania
7. THE GLOBAL - LOCAL SHIP HULL STRENGTH ANALYSIS
BASED ON 3D-FEM MODEL EXTENDED ON TWO CARGO HOLDS
COMPARTMENTS (CENTRAL SHIP PART, COARSE MESH SIZE).
The model was developed by using two cargo holds compartments, each containing
two main cargo cylinders as in the figure below:
Fig. 7.1. The two cargo holds compartments of the Ship ( Ship Design Group 2007)
The longitudinal coordinates along X axis of the two cargo holds model are from
31.772 m to 80.224 m, including the bulkhead at the end of the second cargo hold. The model
was extracted from the full extended 3D - FEM, presented in the chapter 6, in order to
compare the new results by using the corresponding boundary conditions that are going to be
implemented on this two cargo holds compartments 3D-FEM model.
Fig.7.2. The 3D- FEM of the two cargo holds model
The boundary conditions (natural) for the symmetry will remain the same as in the full
extended 3D- FEM model, which is referring to all the nodes in the centre line plane. The
boundary conditions for the Aft part of the model are driven by a single nod, ND_AFT,
situated at the following coordinates: x=31.712 m, y=0 m and z=3.73167 m, where the z
value represents vertical position of the neutral axis location at amidships. The user
subroutine, presented in the Appendix A.3.1, creates points for all the nodes available in the x
coordinate of the Aft part of the model. Afterwards the user subroutine in the Appendix
A.3.2, creates lines from all the nodes, to the node previously created ND_AFT.
Page 81
Global and local strength analysis in equivalent quasi-static head waves, for a tanker ship structure,
based on full length and 2-3 cargo holds 3D-FEM models
81
“EMSHIP” Erasmus Mundus Master Course, period of study September 2011 – February 2013
Fig.7.3. Nodes and lines for the Boundary Conditions of the two cargo holds 3D-FEM model
Similar steps were applied for the Fore node, ND_FORE, with the longitudinal
coordinate x=80.224 m. Afterwards there was defined a new element group RigidBar for
those lines, in order to generate the link elements.
Fig.7.4. Elements RigidBar for the Boundary Conditions of the two cargo holds 3D-FEM model
The constraints to each node are displayed in the table 7.1., with the type of the
boundary condition displayed next to the node.
Table.7.1. Boundary conditions definition for two cargo holds 3D-FEM model
Boundary Conditions
Nodes Node nr. Constraints Type
ND_AFT 95436
UX Neutral
UY; RX Symmetry, Natural
RZ Neutral
ND_FORE 95437 RZ Neutral
UY; RX Symmetry, Natural
CENTRE LINE PLANE All nodes UY; RX Symmetry, Natural
Page 82
82 Cioarec Dan Sebastian
Master Thesis developed at the University " Dunarea de Jos" of Galati, Romania
Fig.7.5.Boundary conditions on the two Cargo holds 3D-FEM model
Similar pressures were applied, as in the case of the Full extended 3D FEM model.
Along the two cargo holds compartments model only the cargo pressure P =61.1 [kN/m2] and
the onboard equivalent pressure P=6.79 [kN/m2] were applied (from Table.6.3.).
Fig.7.6. Applying the equivalent pressure for onboard masses and cargo,
on the two cargo holds compartments 3D-FEM Model
As in the case of the full extended model, the equivalent quasi-static wave pressure
was applied using the updated user subroutine presented in Appendix A.2.2, and the
selection of the specific shell plating was performed with the user subroutine presented in
Appendix A.2.1.
Also displacements and rotations were imposed on the two cargo holds compartment
3D-FEM model, computed with the 1D-Equivalent Beam Model, chapter 5, from global
equilibrium condition, based on the controlling nodes, ND_AFT, ND_FORE (see Table.7.2.),
taking into account their longitudinal position over the ship length.
Page 83
Global and local strength analysis in equivalent quasi-static head waves, for a tanker ship structure,
based on full length and 2-3 cargo holds 3D-FEM models
83
“EMSHIP” Erasmus Mundus Master Course, period of study September 2011 – February 2013
Table.7.2. Displacements and Rotations applied as global constraints, on the two cargo holds compartments
3D-FEM Model, at the aft and fore peak reference nodes
Global conditions Still water Hogging wave height
8.123
Sagging wave height
8.123
Node location Node
AFT
Node
FORE Node AFT
Node
FORE Node AFT
Node
FORE
Coordinate [m] 31.712 80.224 31.712 80.224 31.712 80.224
Displacement w [m] 0.006580 0.005363 0.072170 0.067611 -0.095999 -0.084755
Rotation Ɵ[rad] 0.000089 0.000147 -0.001891 0.002052 0.002367 -0.002599
7.1. Numerical Analysis in Still Water Condition. Hydrostatic Water
Pressure, Deformation and Stress Distributions
The still water equilibrium condition is obtained based on the theoretical model
presented in subchapter 2.3, using the macro-command files procedures, implemented in
Solid Works Comos/ M 2007 software, presented in Appendix A.2.1 and A.2.2. The external
hydrostatic water pressure is applied on bottom, bilge and side shells, based on the global
equilibrium conditions presented in Table.7.2.
In the following figures are presented the results from the numerical global-local
strength analysis in still water condition:
- Fig 7.1.1. External hydrostatic water pressure on the ship hull at still water condition
- Fig.7.1.2. Vertical deflection at the ship girder at still water condition
-Fig 7.1.3. Equivalent vonMises Stress distribution in the cargo compartments (x=31.772 m
to 80.224 m)
Fig.7.1.1 External water Hydrostatic Pressure [N/mm2] applied on the shell plating in Still Water condition,
3D-FEM 2C model with coarse mesh size
Page 84
84 Cioarec Dan Sebastian
Master Thesis developed at the University " Dunarea de Jos" of Galati, Romania
Fig.7.1.2. Vertical deflection on Z direction [m] in Still Water condition, model with coarse mesh size
Fig.7.1.3. Equivalent vonMises stress distribution [kN/m
2] in Still Water condition, the cargo
compartments part (x=31.772 m to 80.224 m), 3D-FEM 2C model with coarse mesh size
7.2. Numerical Analysis in Hogging and Sagging Conditions. Equivalent
Quasi-static Wave Pressure, Deformation and Stress Distributions
In the following figures are presented the numerical results obtained at the global-
local strength analysis based on the two cargo holds compartments 3D-FEM Model, with
coarse mesh size, under Hogging and Sagging conditions, using the theoretical method for
the ship-wave vertical equilibrium, from subchapter 2.3, and the macro commands files from
appendix A.2.1. and A.2.2. implemented in the Solid Works Cosmos/M 2007 FEM software.
Table.7.2.1.Figure List with numerical results at the global local strength analysis in hogging
conditions, based on two cargo holds compartments 3D-FEM Model coarse mesh size
Wave height case [m] Wave pressure
distribution
Total vertical
deflection
vonMises stress
distributions
Hogging 8.123 Fig.7.2.1. Fig.7.2.2. Fig.7.2.3.
Sagging 8.123 Fig.7.2.4. Fig.7.2.5. Fig.7.2.6.
Page 85
Global and local strength analysis in equivalent quasi-static head waves, for a tanker ship structure,
based on full length and 2-3 cargo holds 3D-FEM models
85
“EMSHIP” Erasmus Mundus Master Course, period of study September 2011 – February 2013
Fig.7.2.1 Hydrostatic Pressure from the external equivalent quasi-static wave applied on the ship hull,
Wave height 8.123 m, Hogging condition, 3D-FEM 2C model with coarse mesh size
Fig.7.2.2. Vertical deflection on Z direction (m), Wave height 8.123 m, Hogging condition,
3D-FEM 2C model with coarse mesh size
Fig.7.2.3. Equivalent vonMises stress distribution [kN/m2] ,at the cargo compartments part
(x=31.772 m to 80.224 m), Wave height 8.123 m, Hogging condition,
3D-FEM 2C model with coarse mesh size
Page 86
86 Cioarec Dan Sebastian
Master Thesis developed at the University " Dunarea de Jos" of Galati, Romania
Fig.7.2.4 Hydrostatic Pressure from the external equivalent quasi-static wave applied on the ship hull,
Wave height 8.123 m, Sagging condition, 3D-FEM 2C model with coarse mesh size
Fig.7.2.5. Vertical deflection on Z direction (m), Wave height 8.123 m, Sagging condition,
3D-FEM 2C model with coarse mesh size
Fig.7.2.6. Equivalent vonMises stress distribution [kN/m2] ,at the cargo compartments part
(x=31.772 m to 80.224 m), Wave height 8.123 m, Sagging condition,
3D-FEM 2C model with coarse mesh size
Page 87
Global and local strength analysis in equivalent quasi-static head waves, for a tanker ship structure,
based on full length and 2-3 cargo holds 3D-FEM models
87
“EMSHIP” Erasmus Mundus Master Course, period of study September 2011 – February 2013
7.3. Discussions and Conclusions for the Numerical Computation in
Hogging and Sagging Conditions, Two Cargo Holds Compartments 3D-
FEM Model, With Coarse Size Mesh
In the following figures are presented the maximum values for stress distributions
obtained at the global- local strength analysis based on the two cargo holds compartments
3D-FEM Model (2C), with coarse mesh size, under Hogging and Sagging conditions. For
selected panels (Deck, Bottom, Side) and a given longitudinal section the maximum stress
value result from the equation 2.2.2.
- Fig.7.3.1. and Appendix A.7,Table A.7.1. are presenting the Maximum Normal Deck Stress,
σX [MPa] in Hogging wave conditions, two cargo holds compartments 3D-FEM model with
coarse mesh size, and the safety coefficients Cs according to the yield stress limit ReH.
- Fig.7.3.2. and Appendix A.7, Table.A.7.2. are presenting the Maximum Equivalent vonMises
Deck Stress, σvon [MPa] in Hogging wave conditions, two cargo holds compartments 3D-FEM
model with coarse mesh size, and the safety coefficients Cs according to the yield stress limit ReH.
- Fig.7.3.3. and Appendix A.7, Table.A.7.3. are presenting the Maximum Normal Bottom Stress,
σX [MPa] in Hogging wave conditions, two cargo holds compartments 3D-FEM model with coarse
mesh size, and the safety coefficients Cs according to the yield stress limit ReH.
- Fig.7.3.4. and Appendix A.7, Table.A.7.4. are presenting the Maximum Equivalent vonMises
Bottom Stress, σvon [MPa] in Hogging wave conditions, two cargo holds compartments 3D-FEM
model with coarse mesh size, and the safety coefficients Cs according to the yield stress limit ReH.
- Fig.7.3.5. and Appendix A.7, Table.A.7.5. are presenting the Maximum Tangential side stress τxz
[MPa] in Hogging wave conditions, two cargo holds compartments 3D-FEM model with coarse
mesh size.
- Fig. 7.3.6 and Appendix A.7, Table A.7.6. are presenting the Maximum Normal Deck Stress, σX
[MPa] in Sagging wave conditions, two cargo holds compartments 3D-FEM model with coarse
mesh size, and the safety coefficients Cs according to the yield stress limit ReH.
- Fig.7.3.7. and Appendix A.7, Table.A.7.7. are presenting the Maximum Equivalent vonMises
Deck Stress, σvon [MPa] in Sagging wave conditions, two cargo holds compartments 3D-FEM
model with coarse mesh size, and the safety coefficients Cs according to the yield stress limit ReH.
- Fig.7.3.8. and Appendix A.7, Table.A.7.8. are presenting the Maximum Normal Bottom Stress,
σX [MPa] in Sagging wave conditions, two cargo holds compartments 3D-FEM model with coarse
mesh size, and the safety coefficients Cs according to the yield stress limit ReH.
Page 88
88 Cioarec Dan Sebastian
Master Thesis developed at the University " Dunarea de Jos" of Galati, Romania
- Fig.7.3.9. and Appendix A.7, Table.A.7.9. are presenting the Maximum Equivalent vonMises
Bottom Stress, σvon [MPa] in Sagging wave conditions, two cargo holds compartments 3D-FEM
model with coarse mesh size, and the safety coefficients Cs according to the yield stress limit ReH.
- Fig.7.3.10. and Appendix A.7, Table.A.7.10. are presenting the Maximum Tangential side stress
τxz [MPa] in Sagging wave conditions, two cargo holds compartments 3D-FEM model with coarse
mesh size.
Fig.7.3.1. Maximum Normal Deck Stress,σX [MPa] in Hogging wave conditions,
two cargo holds compartments 3D-FEM model with coarse mesh size
Fig.7.3.2. Maximum Equivalent vonMises Deck Stress,σvon [MPa] in Hogging wave conditions,
two cargo holds compartments 3D-FEM model with coarse mesh size
-50.00
0.00
50.00
100.00
150.00
200.00
250.00
300.00
350.00
400.00
450.00
32.712 37.463 42.214 46.966 51.717 56.468 61.219 65.970 70.722 75.473 80.224
x [m]
SIGx [N/mm2] DECK max(max) 3D-FEM Model Hogging / Quasi-static Wave/ CTK Full / 2 COMP(N)
hw=0m hw=8.123m adm_GS ReH_AH40
-50.00
0.00
50.00
100.00
150.00
200.00
250.00
300.00
350.00
400.00
450.00
32.712 37.463 42.214 46.966 51.717 56.468 61.219 65.970 70.722 75.473 80.224
x [m]
SIGVON [N/mm2] DECK max(max) 3D-FEM Model Hogging / Quasi-static Wave/CTK Full /2COMP(N)
hw=0m hw=8.123m adm_GS ReH_AH40
Page 89
Global and local strength analysis in equivalent quasi-static head waves, for a tanker ship structure,
based on full length and 2-3 cargo holds 3D-FEM models
89
“EMSHIP” Erasmus Mundus Master Course, period of study September 2011 – February 2013
Fig. 7.3.3. Maximum Normal Bottom Stress, σX [MPa] in Hogging wave conditions,
two cargo holds compartments 3D-FEM model with coarse mesh size
Fig. 7.3.4. Maximum equivalent vonMises Bottom Stress, σvon [MPa] in Hogging wave conditions,
two cargo holds compartments 3D-FEM model with coarse mesh size
-250.00
-200.00
-150.00
-100.00
-50.00
0.00
50.00
32.712 37.463 42.214 46.966 51.717 56.468 61.219 65.970 70.722 75.473 80.224
x [m]
SIGx [N/mm2] BOTTOM max(max) 3D-FEM Model Hogging/Quasi-static Wave/CTK Full/ 2COMP(N)
hw=0m hw=8.123m adm_GS ReH_A
-50.00
0.00
50.00
100.00
150.00
200.00
250.00
32.712 37.463 42.214 46.966 51.717 56.468 61.219 65.970 70.722 75.473 80.224
x [m]
SIGVON [N/mm2] BOTTOM max(max) 3D-FEM Model Hogging/Quasi-static Wave/CTK Full/2COMP(N)
hw=0m hw=8.123m adm_GS ReH_A
Page 90
90 Cioarec Dan Sebastian
Master Thesis developed at the University " Dunarea de Jos" of Galati, Romania
Fig. 7.3.5. Maximum Tangential side stress τxz [MPa] in Hogging wave conditions,
two cargo holds compartments 3D-FEM model with coarse mesh size
Fig.7.3.6. Maximum Normal Deck Stress, σX [MPa] in Sagging wave conditions,
two cargo holds compartments 3D-FEM model with coarse mesh size
-150.00
-100.00
-50.00
0.00
50.00
100.00
150.00
32.712 37.463 42.214 46.966 51.717 56.468 61.219 65.970 70.722 75.473 80.224
x[m]
TAUxz [N/mm2] N-N max(max) 3D-FEM Model Hogging / Quasi-static Wave / CTK Full /2COMP(N)
hw=0m hw=8.123m adm_GS(+) adm_GS(-)
-450.00
-400.00
-350.00
-300.00
-250.00
-200.00
-150.00
-100.00
-50.00
0.00
50.00
32.712 37.463 42.214 46.966 51.717 56.468 61.219 65.970 70.722 75.473 80.224
x [m]
SIGx [N/mm2] DECK max(max) 3D-FEM Model Sagging / Quasi-static Wave /CTK Full / 2COMP(N)
hw=0m hw=8.123m adm_GS ReH_AH40
Page 91
Global and local strength analysis in equivalent quasi-static head waves, for a tanker ship structure,
based on full length and 2-3 cargo holds 3D-FEM models
91
“EMSHIP” Erasmus Mundus Master Course, period of study September 2011 – February 2013
Fig.7.3.7. Maximum Equivalent vonMises Deck Stress, σvon [MPa] in Sagging wave conditions,
two cargo holds compartments 3D-FEM model with coarse mesh size
Fig. 7.3.8. Maximum Normal Bottom Stress, σX [MPa] in Sagging wave conditions,
two cargo holds compartments 3D-FEM model with coarse mesh size
-50.00
0.00
50.00
100.00
150.00
200.00
250.00
300.00
350.00
400.00
450.00
32.712 37.463 42.214 46.966 51.717 56.468 61.219 65.970 70.722 75.473 80.224
x [m]
SIGVON [N/mm2] DECK max(max) 3D-FEM Model Sagging / Quasi-static Wave/CTK Full/ 2COMP(N)
hw=0m hw=8.123m adm_GS ReH_AH40
-50.00
0.00
50.00
100.00
150.00
200.00
250.00
32.712 37.463 42.214 46.966 51.717 56.468 61.219 65.970 70.722 75.473 80.224
x [m]
SIGx [N/mm2] BOTTOM max(max) 3D-FEM Model Sagging / Quasi-static Wave/CTK Full/2COMP(N)
hw=0m hw=8.123m adm_GS ReH_A
Page 92
92 Cioarec Dan Sebastian
Master Thesis developed at the University " Dunarea de Jos" of Galati, Romania
Fig. 7.3.9. Maximum Equivalent vonMises Bottom Stress, σvon [MPa] in Sagging wave conditions,
two cargo holds compartments 3D-FEM model with coarse mesh size
Fig. 7.3.10. Maximum Tangential side stress τxz [MPa] in Sagging wave conditions,
two cargo holds compartments 3D-FEM model with coarse mesh size
-50.00
0.00
50.00
100.00
150.00
200.00
250.00
32.712 37.463 42.214 46.966 51.717 56.468 61.219 65.970 70.722 75.473 80.224
x [m]
SIGVON [N/mm2] BOTTOM max(max) 3D-FEM Model Sagging/Quasi-static Wave/CTK Full/2COMP(N)
hw=0m hw=8.123m adm_GS ReH_A
-150.00
-100.00
-50.00
0.00
50.00
100.00
150.00
32.712 37.463 42.214 46.966 51.717 56.468 61.219 65.970 70.722 75.473 80.224
x[m]
TAUxz [N/mm2] N-N max(max) 3D-FEM Model Sagging / Quasi-static Wave / CTK Full /2COMP(N)
hw=0m hw=8.123m adm_GS(+) adm_GS(-)
Page 93
Global and local strength analysis in equivalent quasi-static head waves, for a tanker ship structure,
based on full length and 2-3 cargo holds 3D-FEM models
93
“EMSHIP” Erasmus Mundus Master Course, period of study September 2011 – February 2013
Based on the numerical data from the tables ( Appendix Table. A.7.1. to A.7.10) for
the reference wave height hwBV=8.123 m it results the following synthesis data:
Table.7.3.12. Maximum Hogging stresses based on two cargo holds compartments 3D-FEM model with
coarse mesh size, hw=8.123 m
Panel stress Stress 3D
[MPa] ReH [MPa] 𝑪𝒔 =
𝑹𝒆𝑯
𝑺𝒕𝒓𝒆𝒔𝒔𝟑𝑫
Stress 1D
[MPa]
𝟑𝑫
𝟏𝑫
Maximum σx
deck 257.90 390 1.512 98.25 2.624936
Maximum
σvonM deck 233.00 390 1.674 98.25 2.371501
Maximum σx
bottom 98.01 235 2.398 71.27 1.375193
Maximum
σvonM bottom 88.60 235 2.652 71.27 1.24316
Panel stress 3D
[MPa] adm [MPa] 3D / adm
1D
[MPa] 3D/1D
Maximum τxz
side 35.78 110 0.325 40.09 0.892492
Table.7.3.13. Maximum Sagging stresses based on two cargo holds compartments 3D-FEM model with
coarse mesh size, hw=8.123 m
Panel stress Stress 3D
[MPa] ReH [MPa] 𝑪𝒔 =
𝑹𝒆𝑯
𝑺𝒕𝒓𝒆𝒔𝒔𝟑𝑫
Stress 1D
[MPa]
𝟑𝑫
𝟏𝑫
Maximum σx
deck 321.30 390 1.214 121.17 2.65
Maximum σvonM
deck 290.10 390 1.344 121.17 2.39
Maximum σx
bottom 118.90 235 1.976 87.90 1.35
Maximum σvonM
bottom 105.46 235 2.230 87.90 1.20
Panel stress 3D
[MPa] adm [MPa] 3D / adm
1D
[MPa] 3D/1D
Maximum τxz
side 42.36 110 0.385 48.27 0.87
In order to validate the corresponding boundary conditions and loads that were
applied on the two cargo holds compartments 3D-FEM Model with coarse size mesh, a
comparison has been made with the Full extended 3D-FEM model (coarse mesh). All the
maximum values for σx , σvonM and τxz Stresses on the Deck, Bottom and Side were analysed
(see Table.7.3.13, Table.7.3.14 and Table.7.3.15 ).
Page 94
94 Cioarec Dan Sebastian
Master Thesis developed at the University " Dunarea de Jos" of Galati, Romania
Table.7.3.13. Maximum Hogging and Sagging stresses , on Deck elements, based on comparison between
the two cargo holds compartments 3D-FEM model and the Full extended 3D-FEM model, hw=8.123 m
hw
Maximu
m σx
Stress 3D
Full
[MPa]
Maximu
m σx
Stress 3D
2 Comp
[MPa]
𝝈𝒙 𝟑𝑫 𝑭𝒖𝒍𝒍
𝝈𝒙𝟐 𝑪𝒐𝒎𝒑
Maximu
m σvonM
Stress 3D
Full
[MPa]
Maximu
m σvonM
Stress 3D
2 Comp
[MPa]
𝛔𝐯𝐨𝐧𝐌 𝟑𝑫 𝑭𝒖𝒍𝒍
𝛔𝐯𝐨𝐧𝐌 𝟐 𝑪𝒐𝒎𝒑
Hoggin
g 8.123 241.20 257.90 0.94 217.80 233.00 0.93
Sagging
8.123 329.90 321.30 1.03 297.90 290.10 1.03
Table.7.3.14. Maximum Hogging and Sagging stresses , on Bottom elements, based on comparison between the
two cargo holds compartments 3D-FEM model and the Full extended 3D-FEM model, hw=8.123 m
hw
Maximum
σx Stress
3D Full
[MPa]
Maximum
σx Stress
3D 2 Comp
[MPa]
𝝈𝒙 𝟑𝑫 𝑭𝒖𝒍𝒍
𝝈𝒙𝟐 𝑪𝒐𝒎𝒑
Maximum
σvonM
Stress 3D
Full [MPa]
Maximum
σvonM Stress
3D 2 Comp
[MPa]
𝛔𝐯𝐨𝐧𝐌 𝟑𝑫 𝑭𝒖𝒍𝒍
𝛔𝐯𝐨𝐧𝐌 𝟐 𝑪𝒐𝒎𝒑
Hogging
8.123 94.89 98.01 0.97 85.62 88.60 0.97
Sagging
8.123 111.30 118.90 0.94 106.50 105.46 1.01
Table.7.3.15. Maximum Hogging and Sagging stresses , on Side elements, based on comparison between the two
cargo holds compartments 3D-FEM model and the Full extended 3D-FEM model, hw=8.123 m
hw Maximum τxz Stress 3D Full
[MPa]
Maximum τxz Stress 3D 2 Comp
[MPa]
𝛕𝐱𝐳 𝟑𝑫 𝑭𝒖𝒍𝒍
𝛕𝐱𝐳 𝟐 𝑪𝒐𝒎𝒑
Hogging 8.123 34.70 35.78 0.97
Sagging 8.123 47.85 42.36 1.13
As it can be observed from Table.7.3.13, Table.7.3.14 and Table.7.3.15, the
differences between the two model compared are very small, being ensured a very good
agreement between the two cargo holds compartments 3D-FEM coarse size mesh model and
the Full extended 3D-FEM model (see Fig.7.3.11, Fig.7.3.12 and Fig.7.3.13).
Fig 7.3.11. Hogging and Sagging stresses rapport , on Deck elements, based on comparison between
the two cargo holds compartments 3D-FEM model with coarse mesh size and the Full extended 3D-
FEM model, hw=8.123 m
Page 95
Global and local strength analysis in equivalent quasi-static head waves, for a tanker ship structure,
based on full length and 2-3 cargo holds 3D-FEM models
95
“EMSHIP” Erasmus Mundus Master Course, period of study September 2011 – February 2013
Fig 7.3.12. Hogging and Sagging stresses rapport , on Bottom elements, based on comparison
between the two cargo holds compartments 3D-FEM model with coarse mesh size and the Full
extended 3D-FEM model, hw=8.123 m
Fig 7.3.13. Hogging and Sagging stresses rapport , on Side elements, based on comparison between
the two cargo holds compartments 3D-FEM model with coarse mesh size and the Full extended 3D-
FEM model, hw=8.123 m
The differences of -6 % + 3 % for the stress values between the two 3D-FEM models,
having the same coarse mesh size may occur due to the following causes:
- for the two cargo holds compartments 3D-FEM model with coarse mesh size are used non-
linear equilibrium parameters, based on the 1D Equivalent Beam Model, and not directly
computed based on Full extended 3D-FEM model
- The equivalent transversal section's characteristics are used from the 1D model, and not
directly those from the 3D-FEM structure, in the phase of the vertical deflections
computation, used for the global constraints (aft and fore) of the two compartments model.
Due to the good agreement between the results obtained with full extended 3D-FEM
Model and the two cargo holds compartments 3D-FEM Model with coarse mesh size, in
chapter 8 for the partially extended model can be used the same boundary conditions and
loads set, but with a finer mesh size structure.
Page 96
96 Cioarec Dan Sebastian
Master Thesis developed at the University " Dunarea de Jos" of Galati, Romania
8.THE GLOBAL - LOCAL SHIP HULL STRENGTH ANALYSIS BASED
ON 3D-FEM FINE MESH MODEL EXTENDED ON TWO CARGO
HOLDS COMPARTMENTS (CENTRAL SHIP PART).
A finer mesh mode was developed between the longitudinal coordinates of x=31.772
m to 80.224 m. The model was realised by using triangle shell elements (membrane and thick
plates), having a total number of elements of 203171 and a total number of nodes of 95437.
The boundary conditions for the model remain as have been explained in detail in
chapter 7, Table.7.1
Fig. 8.1. Mesh size coparison between a) coarse mesh size in 3D FEM full extended model
and b) fine mesh size two cargo holds compartments 3D FEM Model
As in the case of the two cargo holds compartment 3D-FEM model with coarse mesh,
the equivalent hydrostatic pressure was applied by the user subroutine presented in the
Appendix A2.2, and the selection of the specific plating was performed with the Appendix
A.2.1.Identical to the analysis presented in chapter 7, displacements and rotations (Table.7.2)
were applied on the two cargo holds compartment 3D-FEM fine mesh model, being
computed with the 1D Equivalent Beam Model.
8.1. Numerical Analysis in Still Water Condition. Hydrostatic Water
Pressure, Deformation and Stress Distributions
The still water equilibrium condition is obtained based on the theoretical model
presented in subchapter 2.3, using the macro-command files procedures, implemented in
SolidWorks Comos/ M 2007 software, presented in Appendix A.2.1 and A.2.2. The external
hydrostatic water pressure (hw=0) is applied on bottom, bilge and side shells, based on the
1D-Equivalent Beam global equilibrium conditions (see table.7.2.).
Page 97
Global and local strength analysis in equivalent quasi-static head waves, for a tanker ship structure,
based on full length and 2-3 cargo holds 3D-FEM models
97
“EMSHIP” Erasmus Mundus Master Course, period of study September 2011 – February 2013
In the following figures are presented the results from the numerical global-local
strength analysis in still water condition:
- Fig 8.1.1. External hydrostatic water pressure on the ship hull at still water condition;
- Fig.8.1.2. Vertical deflection at the ship girder at still water condition;
- Fig 8.1.3. Equivalent vonMises Stress distribution in the cargo compartments (x=31.772 m
to 80.224 m).
Fig.8.1.1 External water Hydrostatic Pressure [N/mm2] applied on the shell plating in Still Water
condition, 3D-FEM 2D-F fine mesh model
Fig.8.1.2. Vertical deflection on Z direction [m] in Still Water condition,
3D-FEM 2D-F fine mesh model
Page 98
98 Cioarec Dan Sebastian
Master Thesis developed at the University " Dunarea de Jos" of Galati, Romania
Fig.8.1.3. Equivalent VonMises stress distribution [kN/m2] in Still Water condition,
the cargo compartments part (x=31.772 m to 80.224 m), 3D-FEM 2D-F fine mesh model
8.2. Numerical Analysis in Hogging and Sagging Conditions. Equivalent
Quasi-static Wave Pressure, Deformation and Stress Distributions
In the following figures are presented the numerical results obtained at the global-
local strength analysis based on the two cargo holds compartments 3D-FEM fine mesh
Model, under Hogging and Sagging conditions, using the macro commands files from
Appendix A.2.1 and A.2.2. implemented in the Solid Works Cosmos/M 2007 FEM software.
Table.8.2.1.Figures List with numerical results at the global local strength analysis in hogging
conditions, based on two cargo holds compartments 3D-FEM fine mesh Model
Wave height case [m] Wave pressure
distribution
Total vertical
deflection
VonMises stress
distributions
Hogging 8.123 Fig.8.2.1. Fig.8.2.2. Fig.8.2.3.
Sagging 8.123 Fig.8.2.4. Fig.8.2.5. Fig.8.2.6.
Page 99
Global and local strength analysis in equivalent quasi-static head waves, for a tanker ship structure,
based on full length and 2-3 cargo holds 3D-FEM models
99
“EMSHIP” Erasmus Mundus Master Course, period of study September 2011 – February 2013
Fig.8.2.1 Hydrostatic Pressure from the external equivalent quasi-static wave applied on the ship hull,
Wave height 8.123 m, Hogging condition, 3D-FEM 2D-F fine mesh model
Fig.8.2.2. Vertical deflection on Z direction (m), Wave height 8.123 m, Hogging condition,
3D-FEM 2D-F fine mesh model
Fig.8.2.3. Equivalent VonMises stress distribution [kN/m2] ,at the cargo compartments part
(x=31.772 m to 80.224 m), Wave height 8.123 m, Hogging condition, 3D-FEM 2D-F fine mesh model
Page 100
100 Cioarec Dan Sebastian
Master Thesis developed at the University " Dunarea de Jos" of Galati, Romania
Fig.8.2.4 Hydrostatic Pressure from the external equivalent quasi-static wave applied on the ship hull,
Wave height 8.123 m, Sagging condition, 3D-FEM 2D-F fine mesh model
Fig.8.2.5. Vertical deflection on Z direction (m), Wave height 8.123 m, Sagging condition,
3D-FEM 2D-F fine mesh model
Fig.8.2.6. Equivalent vonMises stress distribution [kN/m2] ,at the cargo compartments part
(x=31.772 m to 80.224 m), Wave height 8.123 m, Sagging condition, 3D-FEM 2D-F fine mesh model
Page 101
Global and local strength analysis in equivalent quasi-static head waves, for a tanker ship structure,
based on full length and 2-3 cargo holds 3D-FEM models
101
“EMSHIP” Erasmus Mundus Master Course, period of study September 2011 – February 2013
8.3. Discussions and Conclusions for the Numerical Computation in
Hogging and Sagging Conditions, Two Cargo Holds Compartments 3D-
FEM Model, With Fine Mesh Size
In the following figures are presented the maximum values for stress distributions
obtained at the global- local strength analysis based on the two cargo holds compartments
3D-FEM fine mesh Model, under Hogging and Sagging conditions. For selected panels
(Deck, Bottom, Side) and a given longitudinal section the maximum stress value result from
the equation 2.2.2:
- Fig. 8.3.1 and Appendix A.8, Table A.8.1. are presenting the Maximum Normal Deck
Stress, σX [MPa] in Hogging wave conditions, two cargo holds compartments 3D-FEM fine
mesh model, and the safety coefficients Cs according to the yield stress limit ReH.
- Fig.8.3.2. and Appendix A.8, Table.A.8.2. are presenting the Maximum Equivalent
vonMises Deck Stress, σvon [MPa] in Hogging wave conditions, two cargo holds
compartments 3D-FEM fine mesh model, and the safety coefficients Cs according to the
yield stress limit ReH.
- Fig.8.3.3. and Appendix A.8, Table.A.8.3. are presenting the Maximum Normal Bottom
Stress, σX [MPa] in Hogging wave conditions, two cargo holds compartments 3D-FEM fine
mesh model, and the safety coefficients Cs according to the yield stress limit ReH.
- Fig.8.3.4. and Appendix A.8, Table.A.8.4. are presenting the Maximum Equivalent
vonMises Bottom Stress, σvon [MPa] in Hogging wave conditions, two cargo holds
compartments 3D-FEM fine mesh model, and the safety coefficients Cs according to the
yield stress limit ReH.
- Fig.8.3.5. and Appendix A.8, Table.A.8.5. are presenting the Maximum Tangential side
stress τxz [MPa] in Hogging wave conditions, two cargo holds compartments 3D-FEM fine
mesh model.
- Fig.8.3.6 and Appendix A.8, Table A.8.6. are presenting the Maximum Normal Deck Stress,
σX [MPa] in Sagging wave conditions, two cargo holds compartments 3D-FEM fine mesh
model, and the safety coefficients Cs according to the yield stress limit ReH.
- Fig.8.3.7. and Appendix A.8, Table.A.8.7. are presenting the Maximum Equivalent
vonMises Deck Stress, σvon [MPa] in Sagging wave conditions, two cargo holds
compartments 3D-FEM fine mesh model, and the safety coefficients Cs according to the
yield stress limit ReH.
Page 102
102 Cioarec Dan Sebastian
Master Thesis developed at the University " Dunarea de Jos" of Galati, Romania
- Fig.8.3.8. and Appendix A.8, Table.A.8.8. are presenting the Maximum Normal Bottom
Stress, σX [MPa] in Sagging wave conditions, two cargo holds compartments 3D-FEM fine
mesh model, and the safety coefficients Cs according to the yield stress limit ReH.
- Fig.8.3.9. and Appendix A.8, Table.A.8.9. are presenting the Maximum Equivalent
vonMises Bottom Stress, σvon [MPa] in Sagging wave conditions, two cargo holds
compartments 3D-FEM fine mesh model, and the safety coefficients Cs according to the
yield stress limit ReH.
- Fig.8.3.10. and Appendix A.8, Table.A.8.10. are presenting the Maximum Tangential side
stress τxz [MPa] in Sagging wave conditions, two cargo holds compartments 3D-FEM fine
mesh model.
- Fig.8.3.11. and Appendix A.8, Table.A.8.11. are presenting the Maximum Normal Deck
Stress, σX [MPa] in Hogging wave conditions, two cargo holds compartments 3D-FEM fine
mesh model, and the safety coefficients Cs according to the yield stress limit ReH, with
HotSpot correction (equation 2.3.5)
- Fig.8.3.12. and Appendix A.8, Table.A.8.12 are presenting the Maximum Equivalent
vonMises Deck Stress, σvon [MPa] in Hogging wave conditions, two cargo holds
compartments 3D-FEM fine mesh model, and the safety coefficients Cs according to the
yield stress limit ReH, with HotSpot correction (equation 2.3.5)
- Fig.8.3.13. and Appendix A.8, Table.A.8.13. are presenting the Maximum Normal Deck
Stress, σX [MPa] in Sagging wave conditions, two cargo holds compartments 3D-FEM fine
mesh model, and the safety coefficients Cs according to the yield stress limit ReH. with
HotSpot correction (equation 2.3.5)
- Fig.8.3.14. and Appendix A.8, Table.A.8.14. are presenting the Maximum Equivalent
vonMises Deck Stress, σvon [MPa] in Sagging wave conditions, two cargo holds
compartments 3D-FEM fine mesh model, and the safety coefficients Cs according to the
yield stress limit ReH, with HotSpot correction (equation 2.3.5)
Page 103
Global and local strength analysis in equivalent quasi-static head waves, for a tanker ship structure,
based on full length and 2-3 cargo holds 3D-FEM models
103
“EMSHIP” Erasmus Mundus Master Course, period of study September 2011 – February 2013
Fig.8.3.1. Maximum Normal Deck Stress, σX [MPa] in Hogging wave conditions,
two cargo holds compartments 3D-FEM fine mesh model
Fig.8.3.2. Maximum Equivalent vonMises Deck Stress, σvon [MPa] in Hogging wave conditions,
two cargo holds compartments 3D-FEM fine mesh model
-50.00
0.00
50.00
100.00
150.00
200.00
250.00
300.00
350.00
400.00
450.00
32.712 37.463 42.214 46.966 51.717 56.468 61.219 65.970 70.722 75.473 80.224
x [m]
SIGx [N/mm2] DECK max(max) 3D-FEM Model Hogging / Quasi-static Wave/ CTK Full / 2 COMP(F)
hw=0m hw=8.123m adm_GS ReH_AH40
-50.00
0.00
50.00
100.00
150.00
200.00
250.00
300.00
350.00
400.00
450.00
32.712 37.463 42.214 46.966 51.717 56.468 61.219 65.970 70.722 75.473 80.224
x [m]
SIGVON [N/mm2] DECK max(max) 3D-FEM Model Hogging / Quasi-static Wave/CTK Full /2COMP(F)
hw=0m hw=8.123m adm_GS ReH_AH40
Page 104
104 Cioarec Dan Sebastian
Master Thesis developed at the University " Dunarea de Jos" of Galati, Romania
Fig.8.3.3. Maximum Normal Bottom Stress, σX [MPa] in Hogging wave conditions,
two cargo holds compartments 3D-FEM fine mesh model
Fig. 8.3.4. Maximum Equivalent vonMises Bottom Stress, σvon [MPa] in Hogging wave conditions,
two cargo holds compartments 3D-FEM fine mesh model
-250.00
-200.00
-150.00
-100.00
-50.00
0.00
50.00
32.712 37.463 42.214 46.966 51.717 56.468 61.219 65.970 70.722 75.473 80.224
x [m]
SIGx [N/mm2] BOTTOM max(max) 3D-FEM Model Hogging/Quasi-static Wave/CTK Full/ 2COMP(F)
hw=0m hw=8.123m adm_GS ReH_A
-50.00
0.00
50.00
100.00
150.00
200.00
250.00
32.712 37.463 42.214 46.966 51.717 56.468 61.219 65.970 70.722 75.473 80.224
x [m]
SIGVON [N/mm2]BOTTOM max(max) 3D-FEM Model Hogging/Quasi-static Wave /CTK Full/2COMP(F)
hw=0m hw=8.123m adm_GS ReH_A
Page 105
Global and local strength analysis in equivalent quasi-static head waves, for a tanker ship structure,
based on full length and 2-3 cargo holds 3D-FEM models
105
“EMSHIP” Erasmus Mundus Master Course, period of study September 2011 – February 2013
Fig. 8.3.5. Maximum Tangential side stress τxz [MPa] in Hogging wave conditions,
two cargo holds compartments 3D-FEM fine mesh model
Fig.8.3.6. Maximum Normal Deck Stress, σX [MPa] in Sagging wave conditions,
two cargo holds compartments 3D-FEM fine mesh model
-150.00
-100.00
-50.00
0.00
50.00
100.00
150.00
32.712 37.463 42.214 46.966 51.717 56.468 61.219 65.970 70.722 75.473 80.224
x[m]
TAUxz [N/mm2] N-N max(max) 3D-FEM Model Hogging / Quasi-static Wave / CTK Full /2COMP(F)
hw=0m hw=8.123m adm_GS(+) adm_GS(-)
-600.00
-500.00
-400.00
-300.00
-200.00
-100.00
0.00
100.00
32.712 37.463 42.214 46.966 51.717 56.468 61.219 65.970 70.722 75.473 80.224
x [m]
SIGx [N/mm2] DECK max(max) 3D-FEM Model Sagging / Quasi-static Wave/ CTK Full / 2 COMP(F)
hw=0m hw=8.123m adm_GS ReH_AH40
Page 106
106 Cioarec Dan Sebastian
Master Thesis developed at the University " Dunarea de Jos" of Galati, Romania
Fig.8.3.7. Maximum Equivalent vonMises Deck Stress, σvon [MPa] in Sagging wave conditions,
two cargo holds compartments 3D-FEM fine mesh model
Fig. 8.3.8. Maximum Normal Bottom Stress, σX [MPa] in Sagging wave conditions,
two cargo holds compartments 3D-FEM fine mesh model
-50.00
0.00
50.00
100.00
150.00
200.00
250.00
300.00
350.00
400.00
450.00
500.00
32.712 37.463 42.214 46.966 51.717 56.468 61.219 65.970 70.722 75.473 80.224
x [m]
SIGVON [N/mm2] DECK max(max) 3D-FEM Model Sagging / Quasi-static Wave/CTK Full /2COMP(F)
hw=0m hw=8.123m adm_GS ReH_AH40
-50.00
0.00
50.00
100.00
150.00
200.00
250.00
32.712 37.463 42.214 46.966 51.717 56.468 61.219 65.970 70.722 75.473 80.224
x [m]
SIGx [N/mm2] BOTTOM max(max) 3D-FEM Model Sagging/Quasi-static Wave/CTK Full/ 2COMP(F)
hw=0m hw=8.123m adm_GS ReH_A
Page 107
Global and local strength analysis in equivalent quasi-static head waves, for a tanker ship structure,
based on full length and 2-3 cargo holds 3D-FEM models
107
“EMSHIP” Erasmus Mundus Master Course, period of study September 2011 – February 2013
Fig. 8.3.9. Maximum Equivalent vonMises Bottom Stress, σvon [MPa] in Sagging wave conditions,
two cargo holds compartments 3D-FEM fine mesh model
Fig. 8.3.10. Maximum Tangential side stress τxz [MPa] in Sagging wave conditions,
two cargo holds compartments 3D-FEM fine mesh model
-50.00
0.00
50.00
100.00
150.00
200.00
250.00
32.712 37.463 42.214 46.966 51.717 56.468 61.219 65.970 70.722 75.473 80.224
x [m]
SIGVON [N/mm2]BOTTOM max(max) 3D-FEM Model Sagging/Quasi-static Wave /CTK Full/2COMP(F)
hw=0m hw=8.123m adm_GS ReH_A
-150.00
-100.00
-50.00
0.00
50.00
100.00
150.00
32.712 37.463 42.214 46.966 51.717 56.468 61.219 65.970 70.722 75.473 80.224
x[m]
TAUxz [N/mm2] N-N max(max) 3D-FEM Model Sagging / Quasi-static Wave / CTK Full /2COMP(F)
hw=0m hw=8.123m adm_GS(+) adm_GS(-)
Page 108
108 Cioarec Dan Sebastian
Master Thesis developed at the University " Dunarea de Jos" of Galati, Romania
As it can be observed from the previous figures, the maximum values for the σx and
σvonM components for the Deck elements exceed the yielding stress limit. In order to have the
correct reading and interpretation of the results, the stress hotspots have to be evaluated
according to Bureau Veritas 2010 rules, see equation 2.3.5, Figure.2.3.3. Therefore the
corrected hotspot stress values for the σx and σvon for the two cargo holds FEM fine mesh
model are presented in the following figures.
Fig.8.3.11. Maximum Normal Deck Stress, σX [MPa] in Hogging wave conditions,
two cargo holds compartments 3D-FEM fine mesh model, with Hotspot correction (eq 2.3.5.)
-50.00
0.00
50.00
100.00
150.00
200.00
250.00
300.00
350.00
400.00
450.00
32.712 37.463 42.214 46.966 51.717 56.468 61.219 65.970 70.722 75.473 80.224
x [m]
SIGx [N/mm2] DECK max(max) 3D-FEM Model Hogging/Quasi-static Wave/ CTK Full / 2COMP(F-HS)
hw=0m hw=8.123m adm_GS ReH_AH40
Page 109
Global and local strength analysis in equivalent quasi-static head waves, for a tanker ship structure,
based on full length and 2-3 cargo holds 3D-FEM models
109
“EMSHIP” Erasmus Mundus Master Course, period of study September 2011 – February 2013
Fig.8.3.12. Maximum Equivalent vonMises Deck Stress, σvon [MPa] in Hogging wave conditions,
two cargo holds compartments 3D-FEM fine mesh model, with Hotspot correction (eq 2.3.5.)
Fig.8.3.13. Maximum Normal Deck Stress, σX [MPa] in Sagging wave conditions,
two cargo holds compartments 3D-FEM fine mesh model, with Hotspot correction (eq 2.3.5.)
-50.00
0.00
50.00
100.00
150.00
200.00
250.00
300.00
350.00
400.00
450.00
32.712 37.463 42.214 46.966 51.717 56.468 61.219 65.970 70.722 75.473 80.224
x [m]
SIGVON[N/mm2] DECK max(max) 3D-FEM Model Hogging/Quasi-static Wave/CTK Full/2COMP(F-HS)
hw=0m hw=8.123m adm_GS ReH_AH40
-450.00
-400.00
-350.00
-300.00
-250.00
-200.00
-150.00
-100.00
-50.00
0.00
50.00
32.712 37.463 42.214 46.966 51.717 56.468 61.219 65.970 70.722 75.473 80.224
x [m]
SIGx [N/mm2] DECK max(max) 3D-FEM Model Sagging / Quasi-static Wave/ CTK Full/2COMP(F-HS)
hw=0m hw=8.123m adm_GS ReH_AH40
Page 110
110 Cioarec Dan Sebastian
Master Thesis developed at the University " Dunarea de Jos" of Galati, Romania
Fig.8.3.14. Maximum Equivalent vonMises Deck Stress, σvon [MPa] in Sagging wave conditions,
two cargo holds compartments 3D-FEM fine mesh model, with Hotspot correction (eq 2.3.5.)
Based on the numerical data from the tables (Appendix A8, Tables.A.8.3.1-A.8.3.14)
for the reference wave height hwBV=8.123 m it results the following synthesis data:
Table.8.3.16. Maximum Hogging stresses based on two cargo holds compartments
3D-FEM fine mesh model, hw=8.123 m, with Hotspot correction (eq 2.3.5.)
Panel stress Stress 3D
[MPa] ReH [MPa] 𝑪𝒔 =
𝑹𝒆𝑯
𝑺𝒕𝒓𝒆𝒔𝒔𝟑𝑫
Stress 1D
[MPa]
𝟑𝑫
𝟏𝑫
Maximum σx
deck 321.57 390 1.213 98.25 3.27
Maximum σvonM
deck 294.76 390 1.323 98.25 3.00
Maximum σx
bottom 109.30 235 2.150 71.27 1.53
Maximum σvonM
bottom 100.40 235 2.341 71.27 1.41
Panel stress 3D
[MPa] adm [MPa] 3D / adm
1D
[MPa] 3D/1D
Maximum τxz
side 36.52 110 0.332 40.09 0.91
In the Table.8.3.18, Table.8.3.19. and Table.8.3.20 , are compared the maximum
values for σx , σvonM and τxz Stresses at Deck, Bottom and Side, for the 3D FEM full extended
model and the two cargo holds compartments 3D-FEM mode with fine mesh size, with
Hotspot correction (eq 2.3.5.).
-50.00
0.00
50.00
100.00
150.00
200.00
250.00
300.00
350.00
400.00
450.00
32.712 37.463 42.214 46.966 51.717 56.468 61.219 65.970 70.722 75.473 80.224
x [m]
SIGVON [N/mm2] DECK max(max)3D-FEM Model Sagging/Quasi-static Wave/CTK Full/2COMP(F-HS)
hw=0m hw=8.123m adm_GS ReH_AH40
Page 111
Global and local strength analysis in equivalent quasi-static head waves, for a tanker ship structure,
based on full length and 2-3 cargo holds 3D-FEM models
111
“EMSHIP” Erasmus Mundus Master Course, period of study September 2011 – February 2013
Table.8.3.17. Maximum Sagging stresses based on two cargo holds compartments 3D-FEM fine mesh
model, hw=8.123 m, with Hotspot correction (eq 2.3.5.)
Panel stress Stress 3D
[MPa] ReH [MPa] 𝑪𝒔 =
𝑹𝒆𝑯
𝑺𝒕𝒓𝒆𝒔𝒔𝟑𝑫
Stress 1D
[MPa]
𝟑𝑫
𝟏𝑫
Maximum σx
deck 389.90 390 1.000 121.17 3.22
Maximum σvonM
deck 371.64 390 1.049 121.17 3.07
Maximum σx
bottom 120.70 235 1.947 87.90 1.37
Maximum σvonM
bottom 107.80 235 2.180 87.90 1.23
Panel stress 3D
[MPa] adm [MPa] 3D / adm
1D
[MPa] 3D/1D
Maximum τxz
side 42.41 110 0.386 48.27 0.87
Table.8.3.18. Maximum Hogging and Sagging stresses , on Deck elements, based on comparison between
the 2 cargo holds compartments 3D-FEM fine mesh and the full extended models, hw=8.123 m
hw
Max σx
Stress 3D
Full [MPa]
Max σx Stress
3D 2 Comp
Fine mesh
[MPa]
σx
Fine
2C/3D
Full
Max σvonM
Stress 3D
Full [MPa]
Max σvonM
Stress
3D 2
Comp
Fine mesh
[MPa]
σvonM
Fine
2C/3D
Full
Hogging
8.123 241.20 321.57 1.33 217.80 294.76 1.35
Sagging
8.123 329.90 389.90 1.18 297.90 371.64 1.25
Table.8.3.19. Maximum Hogging and Sagging stresses , on Bottom elements, based on comparison between
the two cargo holds compartments 3D-FEM fine mesh and the full extended models, hw=8.123 m
hw
Max σx
Stress
3D Full
[MPa]
Max σx Stress
3D 2 Comp
Fine mesh
[MPa]
σx
Fine
2C/3D
Full
Max σvonM
Stress 3D
Full [MPa]
Max σvonM
Stress
3D 2 Comp
Fine mesh
[MPa]
σvonM
Fine
2C/3D Full
Hogging 8.123 94.89 109.30 1.15 85.62 100.40 1.17
Sagging 8.123 111.30 120.70 1.08 106.50 107.80 1.01
Table.8.3.20. Maximum Hogging and Sagging stresses , on Side elements, based on comparison between the
two cargo holds compartments 3D-FEM fine mesh and the full extended models, hw=8.123m
hw
Maximum τxz
Stress 3D Full
[MPa]
Maximum τxz Stress 3D 2
Comp Fine Mesh [MPa]
𝛕𝐱𝐳 𝐅𝐢𝐧𝐞 𝐌𝐞𝐬𝐡 𝟐 𝑪𝒐𝒎𝒑
𝛕𝐱𝐳 𝟑𝑫 𝑭𝒖𝒍𝒍
Hogging 8.123 34.70 36.52 1.05
Sagging 8.123 47.85 42.41 0.89
Page 112
112 Cioarec Dan Sebastian
Master Thesis developed at the University " Dunarea de Jos" of Galati, Romania
From Tables 8.3.18, 8.3.19 and 8.3.20, comparing the two cargo holds compartments
3D-FEM fine mesh model, with Hotspot correction (eq 2.3.5.) and the Full extended 3D-
FEM model, it results higher stresses: deck 18-35%, bottom 1-17% and side -11 - 5%. The
maximum hotspots are again obtained for the deck liquid cargo inlet hatch, being the domain
where fatigue should be first analysed.
Fig 8.3.15. Hogging and Sagging stresses rapport , on Deck elements, based on comparison between the two
cargo holds compartments 3D-FEM fine mesh model and the Full extended 3D-FEM model, hw=8.123 m
Fig. 8.3.16. Hogging and Sagging stresses rapport , on Bottom elements, based on comparison between the
two cargo holds compartments 3D-FEM model and the Full extended 3D-FEM model, hw=8.123 m
Fig.8.3.17. Hogging and Sagging stresses rapport , on Side elements, based on comparison between the two
cargo holds compartments 3D-FEM model and the Full extended 3D-FEM model, hw=8.123 m
Page 113
Global and local strength analysis in equivalent quasi-static head waves, for a tanker ship structure,
based on full length and 2-3 cargo holds 3D-FEM models
113
“EMSHIP” Erasmus Mundus Master Course, period of study September 2011 – February 2013
9.COMPARATIVE RESULTS AND CONCLUSIONS
Based on the 1D Equivalent Beam Model and the 3D-FEM Full Extended and Two
Cargo Holds Compartments Models numerical analysis that were performed in the previous
chapters, the following main conclusions result:
The 1D Equivalent Beam Model does not take into account the hotspots areas, but it
high lines the most stressed panels in the ship model from the global strength criteria
point of view.
The 3D-FEM full extended model or the two cargo hold compartments model will
lead to similar results, using for equilibrium condition different approaches, if it is
used the same mesh-size, same local loads idealization and on the extremities ends of
the two cargo hold compartments model the corresponding equivalent global loads are
applied. For the two cargo holds compartments 3D-FEM model there were used
equilibrium parameters based on the 1D equivalent beam model, instead of directly
computed parameters based on full extended 3D-FEM model.
The data for a future research in terms of fatigue analysis can be prepared, for the
evaluation of the stress hotspot areas, based on the two cargo holds compartments 3D-
FEM model, with local refinements (finer mesh size) of the structural components in
the specific area.
A comparison between deformations and stress levels obtained with the structural
models, having different complexity levels, can be performed based on this study.
Note. In the following tables are used the next marks :
1D Beam Model refers to the numerical results from sub-chapter 5.2, 5.3. and
appendix A.5.2, A.5.3.
3D-FEM Full Extended Model refers to the numerical results from sub-chapter 6.4,
6.6. and appendix A.6.1, A.6.2.
3D-FEM Two Cargo Holds Compartments Model with Coarse Mesh (2C - coarse)
refers to the numerical results from sub-chapter 7.3. and appendix A.7.
3D-FEM Two Cargo Holds Compartments Model with Fine Mesh (2C – fine) refers
to the numerical results from sub-chapter 8.3. and appendix A.8.
Page 114
114 Cioarec Dan Sebastian
Master Thesis developed at the University " Dunarea de Jos" of Galati, Romania
Table.9.1. Maximum Hogging stresses based on 1D beam, 3D-FEM full extended and 3D-FEM two
cargo holds compartments, coarse and fine mesh, models comparison, reference wave hwmax=8.123 m
Panel stress
Stress
1D
Beam
[MPa]
Stress 3D
FEM Full
Extended
[MPa]
Stress
3D 2C
Coarse
Mesh
[MPa]
Stress
3D 2C
Fine
Mesh
[MPa]
3D-FEM
Full
Extended
and 1D
Beam
Stress
Ratio
3D-FEM
2C Coarse
Mesh
and 1D
Beam
Stress Ratio
3D-FEM
2C Fine
Mesh
and 1D
Beam
Stress
Ratio
Maximum
σx deck 98.25 241.20 257.90 321.57 2.45 2.62 3.27
Maximum
σvonM deck 98.25 217.80 233.00 294.76 2.21 2.37 3.00
Maximum
σx bottom 71.27 94.89 98.01 109.30 1.33 1.38 1.53
Maximum
σvonM
bottom
71.27 85.62 88.60 100.40 1.20 1.24 1.41
Maximum
τxz side 40.09 34.70 35.78 36.52 0.86 0.89 0.91
Fig.9.1. Stress comparison on all components for each numerical model analysed in wave Hogging
conditions, reference wave hwmax=8.123 m
Page 115
Global and local strength analysis in equivalent quasi-static head waves, for a tanker ship structure,
based on full length and 2-3 cargo holds 3D-FEM models
115
“EMSHIP” Erasmus Mundus Master Course, period of study September 2011 – February 2013
Table.9.2. Maximum Sagging stresses based on 1D beam, 3D-FEM full extended and 3D-FEM two
cargo holds compartments, coarse and fine mesh, models comparison, reference wave hwmax=8.123 m
Panel
stress
Stress
1D
Beam
[MPa]
Stress 3D
FEM
Full
Extended
[MPa]
Stress 3D
2C
Coarse
Mesh
[MPa]
Stress 3D
2C Fine
Mesh
[MPa]
3D-FEM
Full
Extended
and 1D
Beam
Stress
Ratio
3D-FEM
2C Coarse
Mesh
and 1D
Beam
Stress
Ratio
3D-FEM
2C Fine
Mesh
and 1D
Beam
Stress
Ratio
Maximum
σx deck 121.17 329.90 321.30 389.90 2.72 2.65 3.22
Maximum
σvonM deck 121.17 297.90 290.10 371.64 2.46 2.39 3.07
Maximum
σx bottom 87.90 111.30 118.90 120.70 1.27 1.35 1.37
Maximum
σvonM
bottom
87.90 106.50 105.46 107.80 1.21 1.20 1.23
Maximum
τxz side 48.27 47.85 42.36 42.41 0.99 0.88 0.88
Fig.9.2. Stress comparison on all components for each numerical model analysed in Sagging
conditions, reference wave hwmax=8.123 m
Page 116
116 Cioarec Dan Sebastian
Master Thesis developed at the University " Dunarea de Jos" of Galati, Romania
From Table.9.1., at the hogging condition, the stress ratio between 3D-FEM two cargo
holds compartment model, with coarse mesh size, and 3D-FEM full extended model are: 2.21
- 2.62 for deck, 1.20-1.38 for bottom, pointing out the hotspots occurrence. The side
tangential stress ratio is close to 1, values 0.86-0.89, due to the fact that the neutral axis
tangential stress coefficient in the 1D equivalent beam model has been obtained as an average
value on beam model and because the hot-spots at the side panels are reduced. Comparing the
3D-FEM two cargo holds compartments Coarse Mesh size and Fine mesh Size models, it
results that the stresses are higher for the fine mesh with 24.8-26.6 % at deck, 10.8-13.7 % at
bottom and very small changes 2.2 % at the side neutral axis (with less hot-spots).
From Table.9.2., at the sagging condition, the stress ratio between 3D-FEM two cargo
holds compartment model, with coarse mesh size, and 3D-FEM full extended model are:
2.39-2.72 for deck, 1.20-1.35 for bottom, pointing out the hot-spots occurrence. The side
tangential stress ratio is close to 1, values 0.88-0.99, due to the fact that the neutral axis
tangential stress coefficient in the 1D equivalent beam model has been obtained as an average
value on beam model and because the hot-spots in the side panels are very reduced.
Comparing the 3D-FEM two cargo holds compartments Coarse Mesh size and Fine Mesh
size models, it results that the stresses are higher for the fine mesh with 21.5-28.4 % at deck,
1.5-2.5 % at bottom and without changes at the side neutral axis (less hot-spots).
As it can be easily observed from the two Figures, 9.1. and 9.2., the results obtained
based on the 3D-FEM full extended model and the 3D FEM two cargo holds compartments
model, with coarse mesh size, they both have similar stress value for all the analysed
components, from deck, bottom and side panels. By this similarity of stresses the boundary
conditions and global-local loads used for the 3D FEM two cargo holds compartments model
are validated, being applied also for the analysis with 3D FEM two cargo holds
compartments model with fine mesh size.
The 3D FEM fine mesh size model is pointing out the hot-spots stress areas which
appear on the deck panels around the liquid cargo inlet hatch. The highest stress values were
obtain in both hogging and sagging wave condition cases, in the deck elements, the normal
stress σx components reaching 321.57 MPa in hogging conditions and 389.90 MPa in sagging
conditions. Also high values were obtained for the equivalent vonMises stress σvon, 294.76
MPa in hogging and 371.64 MPa in sagging conditions, both stress components values
resulting at the cargo inlet hatch stress hot-spots area.
The deck cargo inlet hatch structural region may require further analysis and improvement
of the structural elements, by adding additional stiffening and/or increasing the plate thickness.
Page 117
Global and local strength analysis in equivalent quasi-static head waves, for a tanker ship structure,
based on full length and 2-3 cargo holds 3D-FEM models
117
“EMSHIP” Erasmus Mundus Master Course, period of study September 2011 – February 2013
It can also be observed for the tangential stresses on the side panels that the results are
similar within all the analysis performed, including the 1D equivalent beam model. There are
minor differences because at the side panels the stress hot-spots are very reduced.
The 1D-equivalent beam model provides the global equilibrium parameters for the
3D-FEM two cargo holds compartments models, both fine and coarse mesh size, with very
similar equilibrium parameters values as for the 3D-FEM full extended model. Although it
does not include the stress hot-spot areas, the 1D equivalent beam model offers an
preliminary global strength analysis and reliable ship-wave equilibrium parameters.
In conclusion, by using the user subroutines developed with Solid Works Cosmos/M
2007 FEM software, the numerical FEM analysis provides reliable data for the ship strength
assessment (under equivalent quasi-static head waves), having a good concordance between
the structural models developed in this study. For further studies, as fatigue analysis, should
combine the advantages of the four structural models analysed in this work, taking into
account the sensitivity of the ship hull structure models, for higher risk panels identification.
This work will be further developed by systematic stress hot-spots sensitivity
evaluation, as required for local fatigue analysis, based on the 3D-FEM two cargo hold
compartments models, with different mesh sizes.
Page 118
118 Cioarec Dan Sebastian
Master Thesis developed at the University " Dunarea de Jos" of Galati, Romania
10. ACKNOWLEDGEMENTS
I would like to mention in the beginning that I am very grateful to be part of the
Erasmus Mundus Master programme, EMship, which provided me knowledge in ship
domain, upgrading from the mechanical engineering domain, and also for the financial
support during the studies, providing the scholarship. I would like to have the pleasure of
personally transmit my appreciation to all the founders and organisers of the EMship Master
course, especially to prof. Philippe Rigo and prof. Andre Hage at Universite de Liege, prof.
Pierre Ferrant and prof. Lionel Gentaz at Ecole Centrale du Nantes and prof. Adrian Lungu at
University Dunarea de Jos, Galati.
Also many sincere appreciations to my advisor of the master thesis, prof. Domnisoru
Leonard, for constant support, indications, advices and technical materials provided during
the master thesis development at the University "Dunarea de Jos", of Galati, Naval
Architecture Faculty.
I would like to thank to the internship supervisor, Dr. Ionas Ovidiu, for kindly guiding
me through the process of ship designing in different stages, and for the technical material
provided to develop the model used in the thesis, in the company Ship Design Group, Galati.
This thesis was developed in the frame of the European Master Course in “Integrated
Advanced Ship Design” named “EMSHIP” for “European Education in Advanced Ship
Design”, Ref.: 159652-1-2009-1-BE-ERA MUNDUS-EMMC.
Page 119
Global and local strength analysis in equivalent quasi-static head waves, for a tanker ship structure,
based on full length and 2-3 cargo holds 3D-FEM models
119
“EMSHIP” Erasmus Mundus Master Course, period of study September 2011 – February 2013
11. REFERENCES
[1] Baguley D.,Hose D.R.,1997. How to Interpret Finite Element Results, NAFEMS, Bell
and Bain Ltd, Glasgow
[2] Bathe K.J., 1990. Finite Elemente Methoden, Springer Verlag, Berlin
[3] Bidoae R., Ionas O., 2004. The Naval Architecture, The Didactic and Pedagogic
Publishing House, Bucharest
[4] Bureau Veritas, 2010. Shipbuilding Classification Society Rules
[5] Carlos Guedes Soares, Purnendu K. Das (Editors), 2007. Advancements in Marine
Structures, Taylor& Francis Group, London, ISBN978-0-415-43725-7
[6] Cook R.D.,Malkus D.S.,Plesha M.E., 1989. Concepts and Applications of Finite Element
Analysis, John Wiley & Sons Inc.,New York
[7] Domnisoru L., 2006. Structural Analysis and Hydroelasticity of Ships, The University
Foundation „Dunarea de Jos” Publishing House Galati
[8] Domnisoru L., 2001. The Finite Element Method in Shipbuilding, The Technical
Publishing House, Bucharest
[9] Domnisoru L., Stoicescu L., 2004-2005.The Analysis of the Global Ship Strengths in
Vertical Plane with 1D-Equivalent Girder and 3D-FEM Hull Models. Comparative Study of
the two Methods, WP.2 / Task 2.1.1 Advance Finite Element Modelling and Analysis, Grant
EU Marstruct-FP6 Network of Excellence on Marine Structures, Code TNE3-CT-2003-
506141
[10] Domnisoru L., Gavan E., Popovici O., 2005. The Analysis of the Ship Structures with the
Finite Element Method, The Didactic and Pedagogic Publishing House, Bucharest
[11] Frieze, P.A., Shenoi, R.A. (editors) , 2006. Proceedings of the 16-th International Ship
and Offshore Structures Congress - ISSC, University of Southampton
[12] Hage A.,2011. Lecture Notes of Ship Design, EMship Master Course, (University of
Liege, ANAST)
[13] Hughes, O.F.,1988. Ship structural design. A rationally-based, Computer-Aided
Optimization Approach, The Society of Naval Architects and Marine Engineers, New Jersey
[14] Ionas O., Domnisoru L.,Gavrilescu I.,Dragomir D. , 1999. Calculation Techniques in
Shipbuilding, The Evrika Publishing House, Braila
[15] Modiga M., Dimache A., Olaru D., 2005. Ship Structures Static, The Academic
Publishing House, Galati
Page 120
120 Cioarec Dan Sebastian
Master Thesis developed at the University " Dunarea de Jos" of Galati, Romania
[16] Obreja D., 2005. Ship Theory. Concepts and methods for the analyse of sailing
performances, The Didactic and Pedagogic Publishing House, Bucharest
[17] Reddy, J.N., 2006. An Introduction to the Finite Elemenent Method, McGraw-Hill, New
York
[18] Rigo P., Rizzuto E., Analysis and Design of Ship Structure, Chap 18 of " Ship Design
and Construction", Editor T Lamb, SNAME
[19] Rozbicki, M., Das Purnendu, K., Crow, A., 2001. The preliminary finite element
modelling of a full ship, International Shipbuilding Progress Delft 48(2), pp.213-225
[20] Servis, D., Voudouris, G., Samuelides, M., Papanikolaou, A., 2003. Finite element modelling
and strength analysis of hold no.1 of bulk carriers, Marine Structures 16, pp.601-626
[21] Stoicescu L., Domnisoru L., 2007. Global strength analysis in head waves, for a tanker
with longitudinal uniform structure, The Proceedings of MARSTRUCT 2007, International
Conference on Advancements in Marine Structures, Glasgow, Taylor & Francis Group,
London, pp.283-294
[22] Technical information regarding the Chemical Tanker 4000 tones prototype ship (2007)
Granted by Ship Design Group Galati (www.shipdesigngroup.eu)
[23] Tetsuya, Yao., 2003. Hull girder strength, Marine Structures 16, pp.1-13
[24] Zienkiewicz, O.C., Taylor, R.L. , 1988. The finite element method. Basic formulation
and linear problems, McGraw-Hill Book Company, London
[25] Zienkiewicz, O.C., Taylor, R.L., 1989. The Finite Element Method. Solid and Fluid
Mechanics. Dynamics and Non-Linearity, McGraw-Hill Book Company, London
Analysis Tools:
P_ACASV version 5, developed at “Dunarea de Jos” University of Galati (Domnisoru, 2006);
Rhinoceros 2006 - academic trial licence;
AutoCAD 2011- academic licence;
Artlantis Studio 4 - academic trial licence;
Solid Works Cosmos/M 2007 - licence at "Dunarea de Jos" University of Galati;
Page 121
Global and local strength analysis in equivalent quasi-static head waves, for a tanker ship structure,
based on full length and 2-3 cargo holds 3D-FEM models
121
“EMSHIP” Erasmus Mundus Master Course, period of study September 2011 – February 2013
12. APPENDIX
A1.1. Macro-command Files Procedures, Implemented in Solid Works
Comos/ M 2007 Software "Press" Hogging/Sagging for Full Extended 3D-
FEM Model (Equivalent Wave Hydrostatic Pressure on the Hull Shell)
C* **WITH TRIMM
parassign,Lenght,real,109.6108
parassign,xFw,real,-0.25
parassign,Hw,real,-8.123
parassign,dmax,real,8.6
parassign,NDpp,int,31061
parassign,NDpv,int,46016
CALLMACRO,IN_EL
C*
C* STEP 1 NO TRIMM
C* (dsw=0.0)
parassign,dsw,real,3.2
parassign,RFZpp,real,2.0
parassign,RFZpv,real,-1.0
parassign,REZEQ,real,1.0
parassign,REZEQ1,real,1E+15
#LABEL LAB1
#if (ABS(REZEQ)>0.1)
parassign,dsw,real,(dsw+0.05)
#if (dsw>dmax)
#GOTO LAB2
#endif
CALLMACRO,DEL_press
CALLMACRO,EG_press,dsw,Lenght,Hw
A_STATIC,G,
R_STATIC
parassign,RFZpp,real,RFZ(1|NDpp|0)
parassign,RFZpv,real,RFZ(1|NDpv|0)
parassign,REZEQ,real,(RFZpp+RFZpv)
parlist,*
#if (REZEQ<0)
parassign,dsw,real,(dsw-0.05)+0.05/(REZEQ-REZEQ1)*(0-REZEQ1)
CALLMACRO,DEL_press
CALLMACRO,EG_press,dsw,Lenght,Hw
A_STATIC,G,
R_STATIC
parassign,RFZpp,real,RFZ(1|NDpp|0)
parassign,RFZpv,real,RFZ(1|NDpv|0)
parassign,REZEQ,real,(RFZpp+RFZpv)
parassign,REZEQ1,real,REZEQ
#GOTO LAB2
#endif
parassign,REZEQ1,real,REZEQ
Page 122
122 Cioarec Dan Sebastian
Master Thesis developed at the University " Dunarea de Jos" of Galati, Romania
#else
#GOTO LAB2
#endif
#GOTO LAB1
#LABEL LAB2
parlist,*
C*
C* STEP 2 WITH TRIMM
parassign,RFZpv1,real,RFZpv
#if (RFZpv>RFZpp)
parassign,semn1,int,1
#endif
#if (RFZpv<RFZpp)
parassign,semn1,int,-1
#endif
#if ((ABS(RFZpv)<0.1) && (ABS(RFZpp)<0.1))
parassign,semn1,int,0
parassign,semn,int,0
#GOTO LAB3
#endif
C*
parassign,trimm,real,0.0
#LABEL LAB4
#if (RFZpv>RFZpp)
parassign,semn,int,1
#endif
#if (RFZpv<RFZpp)
parassign,semn,int,-1
#endif
#if ((ABS(RFZpv)<0.1)&&(ABS(RFZpp)<0.1))
parassign,semn,int,0
#GOTO LAB3
#endif
#if (semn!=semn1)
parassign,trimm,real,(trimm-0.001*semn1)+(0.001*semn1)/(RFZpv-RFZpv1)*(0-RFZpv1)
parassign,dpp,real,dsw-(Lenght/2+xFw)*trimm
parassign,dpv,real,dsw+(Lenght/2-xFw)*trimm
CALLMACRO,DEL_press
CALLMACRO,EG_press2,dpp,dpv,Lenght,Hw
A_STATIC,G,
R_STATIC
parassign,RFZpp,real,RFZ(1|NDpp|0)
parassign,RFZpv,real,RFZ(1|NDpv|0)
parassign,REZEQ,real,(RFZpp+RFZpv)
#GOTO LAB3
#endif
C*
parassign,RFZpv1,real,RFZpv
parassign,trimm,real,trimm+0.001*semn
#if (ABS(trimm)>0.5)
Page 123
Global and local strength analysis in equivalent quasi-static head waves, for a tanker ship structure,
based on full length and 2-3 cargo holds 3D-FEM models
123
“EMSHIP” Erasmus Mundus Master Course, period of study September 2011 – February 2013
#GOTO LAB3
#endif
parassign,dpp,real,dsw-(Lenght/2+xFw)*trimm
parassign,dpv,real,dsw+(Lenght/2-xFw)*trimm
CALLMACRO,DEL_press
CALLMACRO,EG_press2,dpp,dpv,Lenght,Hw
A_STATIC,G,
R_STATIC
parassign,RFZpp,real,RFZ(1|NDpp|0)
parassign,RFZpv,real,RFZ(1|NDpv|0)
parassign,REZEQ,real,(RFZpp+RFZpv)
parlist,*
#GOTO LAB4
#LABEL LAB3
parlist,*
CALLMACRO,OUT_EL
A.1.2 Macro-command Files Procedures, Implemented in Solid Works
Comos/ M 2007 Software "EL_DBS" to Select the Shell Plating for the Full
Extended 3D FEM Model
C* Group Deck 9,10
INITSEL,EL,1,1
ACTSET,SEL,1,
ESELPROP,RC,121,122,1,1
ESELPROP,RC,229,230,1,1
ESELPROP,RC,327,328,1,1
ESELPROP,RC,426,427,1,1
ESELPROP,RC,524,525,1,1
ESELPROP,RC,621,622,1,1
EGROUP,9,SHELL3T,0,0,0,0,0,0,0,0
EPROPCHANGE,1,ELMAX,1,EG,9,8
INITSEL,EL,1,1
ACTSET,SEL,1,
ESELPROP,RC,726,726,1,1
EGROUP,10,SHELL3T,0,0,0,0,0,0,0,0
EPROPCHANGE,1,ELMAX,1,EG,10,8
INITSEL,EL,1,1
C* Bottom 11
ACTSET,SEL,1,
ESELPROP,RC,101,102,1,1
ESELPROP,RC,202,203,1,1
ESELPROP,RC,209,209,1,1
ESELPROP,RC,302,303,1,1
ESELPROP,RC,353,353,1,1
ESELPROP,RC,402,403,1,1
ESELPROP,RC,453,453,1,1
ESELPROP,RC,502,503,1,1
ESELPROP,RC,543,543,1,1
ESELPROP,RC,602,603,1,1
Page 124
124 Cioarec Dan Sebastian
Master Thesis developed at the University " Dunarea de Jos" of Galati, Romania
ESELPROP,RC,604,604,1,1
ESELPROP,RC,701,702,1,1
EGROUP,11,SHELL3T,0,0,0,0,0,0,0,0
EPROPCHANGE,1,ELMAX,1,EG,11,8
C* Side 12
INITSEL,EL,1,2
ACTSET,SEL,2,
ESELPROP,RC,111,112,1,2
ESELPROP,RC,218,218,1,2
ESELPROP,RC,316,316,1,2
ESELPROP,RC,415,415,1,2
ESELPROP,RC,515,515,1,2
ESELPROP,RC,544,544,1,2
ESELPROP,RC,612,613,1,2
ESELPROP,RC,715,717,1,2
EGROUP,12,SHELL3T,0,0,0,0,0,0,0,0
EPROPCHANGE,1,ELMAX,1,EG,12,8
C*
INITSEL,EL,1,1
INITSEL,EL,1,2
C* Nodes selection
INITSEL,EL,1,1
ACTSET,SEL,1,
ESELPROP,EG,9,10,1,1
SELREF,ND,EL,1,ELMAX,1,1
INITSEL,EL,1,2
ACTSET,SEL,2,
ESELPROP,EG,11,11,1,2
SELREF,ND,EL,1,ELMAX,1,1
INITSEL,EL,1,3
ACTSET,SEL,3,
ESELPROP,EG,12,12,1,3
SELREF,ND,EL,1,ELMAX,1,1
C*
INITSEL,EL,1,4
ACTSET,SEL,4,
SELRANGE,EL,0,1,1,1,18.57,99.42,0,6.7504,0,10.0999,4
C*
Page 125
Global and local strength analysis in equivalent quasi-static head waves, for a tanker ship structure,
based on full length and 2-3 cargo holds 3D-FEM models
125
“EMSHIP” Erasmus Mundus Master Course, period of study September 2011 – February 2013
A.1.3. The “Geomacro.mac” File GEO Procedures Library Developed for
the Support of GEO Macro-Commands Files
C* ***Hydrostatic pressure
C* ***with flat free surface KN/m2
$macro,hst_press
parassign,Tief,real,0.0
parassign,density,real,1.025
parassign,sgn,int,1
CALLMACRO,hst_shell,Tief,density,sgn
$ENDM
$macro,hst_shell,Tief,density,sgn
parassign,csid,int,0
parassign,i,int,0
#loop LB1 ELMAX
parassign,i,int,i+1
#if (exist(EL|i) && listsel(EL|i))
parassign,fnum,int,0
parassign,z,real,ZELF(i|fnum|csid)
parassign,pval,real,((Tief-z)*density*9.81)
parassign,fnum,int,5
#if (pval>0)
parassign,pval,real,(pval*sgn)
PEL,i,pval,fnum,i,1,4
#endif
#endif
#label LB1
$ENDM
C* ***End Hydrostatic pressure
C* ***INOUT Elements Groups
$macro,IN_EL
INITSEL,EL,1,10
ESELPROP,EG,2,8,1,10
$ENDM
$macro,OUT_EL
INITSEL,EL,1,10
$ENDM
$macro,DEL_press
PEDEL,1,5,ELMAX,1
$ENDM
C* ***End INOUT Elements
C* ***FLUIDS_EQ1_WAVES (NO TRIMM)
$macro,EG_press,dsw,Lenght,Hw
parassign,sgn,int,1
CALLMACRO,sin_shell,dsw,Lenght,Hw,sgn
Page 126
126 Cioarec Dan Sebastian
Master Thesis developed at the University " Dunarea de Jos" of Galati, Romania
$ENDM
C* ***Hydrostatic pressure
C* ***sin free surface KN/m2
$macro,sin_press
parassign,dsw,real,0.0
parassign,Lenght,real,0.0
parassign,Hw,real,0.0
parassign,sgn,int,1
CALLMACRO,sin_shell,dsw,Lenght,Hw,sgn
$ENDM
$macro,sin_shell,dsw,Lenght,Hw,sgn
parassign,csid,int,0
parassign,i,int,0
#loop LB1 ELMAX
parassign,i,int,i+1
#if (exist(EL|i) && listsel(EL|i))
parassign,fnum,int,0
parassign,z,real,ZELF(i|fnum|csid)
parassign,x,real,XELF(i|fnum|csid)
parassign,Tief,real,(dsw+Hw/2*COS((2*PI*x/Lenght)))
parassign,pval,real,((Tief-z)*1.025*9.81)
parassign,fnum,int,5
#if (pval>0)
parassign,pval,real,(pval*sgn)
PEL,i,pval,fnum,i,1,4
#endif
#endif
#label LB1
$ENDM
C* ******End Fluids EQ1
C* ***FLUIDE_EQ2_WAVES (WITH TRIMM)
$macro,EG_press2,dpp,dpv,Lenght,Hw
parassign,sgn,int,1
CALLMACRO,sin_shell2,dpp,dpv,Lenght,Hw,sgn
$ENDM
C* ***Hydrostatic pressure (with trimm) sin free surface KN/m2
$macro,sin_press2
parassign,dpp,real,0.0
parassign,dpv,real,0.0
parassign,Lenght,real,0.0
parassign,Hw,real,0.0
parassign,sgn,int,1
CALLMACRO,sin_shell2,dpp,dpv,Lenght,Hw,sgn
$ENDM
$macro,sin_shell2,dpp,dpv,Lenght,Hw,sgn
Page 127
Global and local strength analysis in equivalent quasi-static head waves, for a tanker ship structure,
based on full length and 2-3 cargo holds 3D-FEM models
127
“EMSHIP” Erasmus Mundus Master Course, period of study September 2011 – February 2013
parassign,csid,int,0
parassign,i,int,0
#loop LB1 ELMAX
parassign,i,int,i+1
#if (exist(EL|i) && listsel(EL|i))
parassign,fnum,int,0
parassign,z,real,ZELF(i|fnum|csid)
parassign,x,real,XELF(i|fnum|csid)
parassign,Tief,real,dpp+(dpv-dpp)/Lenght*x
parassign,Tief,real,Tief+Hw/2*COS((2*PI*x/Lenght))
parassign,pval,real,((Tief-z)*1.025*9.81)
parassign,fnum,int,5
#if (pval>0)
parassign,pval,real,(pval*sgn)
PEL,i,pval,fnum,i,1,4
#endif
#endif
#label LB1
$ENDM
C* ******End Fluids EQ2
A.2.1 Macro-command Files Procedures, Implemented in Solid Works
Comos/ M 2007 Software "EL_DBS_LE_TK" to Create the Selection of the
Plating for the Two Cargo Holds Compartments 3D-FEM Model
C* Group Deck 11,12
INITSEL,EL,1,1
ACTSET,SEL,1,
ESELPROP,RC,121,122,1,1
ESELPROP,RC,229,230,1,1
ESELPROP,RC,327,328,1,1
ESELPROP,RC,426,427,1,1
ESELPROP,RC,524,525,1,1
ESELPROP,RC,621,622,1,1
EGROUP,11,SHELL3T,0,0,0,0,0,0,0,0
EPROPCHANGE,1,ELMAX,1,EG,11,8
INITSEL,EL,1,1
ACTSET,SEL,1,
ESELPROP,RC,726,726,1,1
EGROUP,12,SHELL3T,0,0,0,0,0,0,0,0
EPROPCHANGE,1,ELMAX,1,EG,12,8
INITSEL,EL,1,1
C* Bottom 13
ACTSET,SEL,1,
ESELPROP,RC,101,102,1,1
ESELPROP,RC,202,203,1,1
ESELPROP,RC,209,209,1,1
ESELPROP,RC,302,303,1,1
ESELPROP,RC,353,353,1,1
ESELPROP,RC,402,403,1,1
Page 128
128 Cioarec Dan Sebastian
Master Thesis developed at the University " Dunarea de Jos" of Galati, Romania
ESELPROP,RC,453,453,1,1
ESELPROP,RC,502,503,1,1
ESELPROP,RC,543,543,1,1
ESELPROP,RC,602,603,1,1
ESELPROP,RC,604,604,1,1
ESELPROP,RC,701,702,1,1
EGROUP,13,SHELL3T,0,0,0,0,0,0,0,0
EPROPCHANGE,1,ELMAX,1,EG,13,8
C* Side 14
INITSEL,EL,1,2
ACTSET,SEL,2,
ESELPROP,RC,111,112,1,2
ESELPROP,RC,218,218,1,2
ESELPROP,RC,316,316,1,2
ESELPROP,RC,415,415,1,2
ESELPROP,RC,515,515,1,2
ESELPROP,RC,544,544,1,2
ESELPROP,RC,612,613,1,2
ESELPROP,RC,715,717,1,2
EGROUP,14,SHELL3T,0,0,0,0,0,0,0,0
EPROPCHANGE,1,ELMAX,1,EG,14,8
C*
INITSEL,EL,1,1
INITSEL,EL,1,2
C* Nodes selection
INITSEL,EL,1,1
ACTSET,SEL,1,
ESELPROP,EG,11,12,1,1
SELREF,ND,EL,1,ELMAX,1,1
INITSEL,EL,1,2
ACTSET,SEL,2,
ESELPROP,EG,13,13,1,2
SELREF,ND,EL,1,ELMAX,1,1
INITSEL,EL,1,3
ACTSET,SEL,3,
ESELPROP,EG,14,14,1,3
SELREF,ND,EL,1,ELMAX,1,1
C*
Page 129
Global and local strength analysis in equivalent quasi-static head waves, for a tanker ship structure,
based on full length and 2-3 cargo holds 3D-FEM models
129
“EMSHIP” Erasmus Mundus Master Course, period of study September 2011 – February 2013
A.2.2. Macro-command Files Procedures, Implemented in Solid Works
Comos/ M 2007 Software "Press" Hogging/Sagging for Two Cargo Holds
Compartments 3D-FEM Model (Equivalent Wave Hydrostatic Pressure on
the Hull Shell)
C* **WITH TRIMM [KN,t,m]
C* - Hw hogg, +Hw sagg
parassign,Hw,real,0.0
parassign,dpp,real,4.26970
parassign,dpv,real,4.57661
C* xpp=0 model has correct position
parassign,Lenght,real,109.611
parassign,xpp,real,0.0
parassign,ro,real,1.025
parassign,NDpp,int,22451
parassign,NDpv,int,22452
C* xpp=31.712m UZpp=0.006580
DND,NDpp,UZ,0,NDpp,1;
DND,NDpp,RY,-0.000089,NDpp,1;
C* xpv=80.224m UZpv=0.005363
DND,NDpv,UZ,-0.001217,NDpv,1;
DND,NDpv,RY,0.000147,NDpv,1;
CALLMACRO,IN_EL
CALLMACRO,sin_shell,dpp,dpv,Lenght,xpp,ro,Hw
CALLMACRO,OUT_EL
A_STATIC,G,
R_STATIC
parlist,*
A.3.1 Macro-Command Files Procedures, Implemented in Solid Works Comos/
M 2007 Software "GPoint" to add Points in Nodes for Boundary Conditions
(Two Cargo Holds Compartments 3D-FEM Model) "GPOINT.GEO"
C* PUT POINTS IN NODES
parassign,i,int,0
parassign,j,int,PTMAX
#loop LB1 NDMAX
parassign,i,int,i+1
#if (exist(ND|i) && listsel(ND|i))
Page 130
130 Cioarec Dan Sebastian
Master Thesis developed at the University " Dunarea de Jos" of Galati, Romania
parassign,j,int,j+1
PTND,j,i
#endif
#label LB1
A.3.2. Macro-Command Files Procedures, Implemented in Solid Works
Comos/ M 2007 Software "Curves.PP" Creates Lines Between Nodes for
Two Cargo Holds Compartments 3D-FEM Model
C* PUT CURVES
parassign,PP,int,306
parassign,i,int,0
parassign,j,int,CRMAX
#loop LB1 PTMAX
parassign,i,int,i+1
#if (exist(PT|i) && listsel(PT|i))
parassign,j,int,j+1
CRLINE,j,PP,i
#endif
#label LB1
A.4. The Plate Thickness for Each Block of the 3D-CAD Model Generation,
Chapter 4.
Table.A.4.1. Layers and thickness of block 1
RC dxf 3D Face Gross thk.
no. file no. [mm]
Aft Block 1
101 Z1_102_Bottom_pl_10 184 10.0
102 Z1_103_Bottom_pl_15 31 15.0
103 Z1_110_DB_GD_pd_web_6 14 6.0
104 Z1_111_DB_GD_fl_15 4 15.0
105 Z1_130_DB_Gd_wb_12 38 12.0
106 Z1_131_DB_gd_fl_15 34 15.0
107 Z1_132_DB_Gd_wb_10 4 10.0
108 Z1_133_DB_gd_fl_12 4 12.0
109 Z1_134_DB_GD_wb_8 12 8.0
110 Z1_135_DB_gd_fl_10 24 10.0
111 Z1_201_Shell_pl_12 132 12.0
112 Z1_202_Shell_pl_10 32 10.0
113 Z1_210_Shell_Frame_HP160x9 40 9.0
114 Z1_211_Shel_frame_wb_10 87 10.0
115 Z1_212_Shell_frame_fl_120x12 80 12.0
116 Z1_213_Shell_frame_fl_100x12 20 12.0
117 Z1_214_Shell_frame_wb_12 4 12.0
Page 131
Global and local strength analysis in equivalent quasi-static head waves, for a tanker ship structure,
based on full length and 2-3 cargo holds 3D-FEM models
131
“EMSHIP” Erasmus Mundus Master Course, period of study September 2011 – February 2013
118 Z1_215_Shell_frame_fl_150x15 8 15.0
119 Z1_230_Shell_gd_wb_10 30 10.0
120 Z1_231_Shell_gd_fl_12 30 12.0
121 Z1_301_Mdk_pl_9 170 9.0
122 Z1_302_MDK_pl_12 31 12.0
123 Z1_310_MDK_fr_wb_10 173 10.0
124 Z1_311_MDK_fr_fl_120x12 72 12.0
125 Z1_320_MDK_GD_wb_10 37 10.0
126 Z1_321_MDK_GD_FL_12 143 12.0
127 Z1_322_MDK_GD_PD_wb_5 5 5.0
128 Z1_330_MDK_long_HP120x8 112 8.0
129 Z1_331_MDK_long_HP140x8 16 8.0
130 Z1_332_MDK_long_PD_HP120x8(pd) 9 4.0
131 z1_401_bhd_FR12_WALL_8 74 8.0
132 Z1_402_BHD_wall_12 61 12.0
133 Z1_403_BHD_Wall_10 336 10.0
134 Z1_404_BHD_wall_15 20 15.0
135 Z1_405_BHD_Wall_12 12 12.0
136 Z1_410_bhd_orizontal_PL_8 132 8.0
137 Z1_411_BHD_vertical_pl8 37 8.0
138 Z1_412_BHD_orizontal_pl_10 88 10.0
139 Z1_413_BHD_vertical_pl_10 28 10.0
140 Z1_414_BHD_vertical_pl_18 4 18.0
141 Z1_416_BHD_vertical_pl_12 4 12.0
142 Z1_417_BHD_vertical_PD_pl_5 15 5.0
143 Z1_420_BHD_frame_wb_8 21 8.0
144 Z1_430_BHD_vertical_HP160x9 98 9.0
145 Z1_431_BHD_vertical_HP120x8 24 8.0
146 Z1_432_BHD_oriz_HP120x8 10 8.0
147 Z1_433_BHD_vertical_PD_HP120x8(pd) 1 4.0
Table.A.4.2. Layers and thickness of block 2
RC DXF 3D Face Gross thk.
no. file no. [mm]
Midship Block 2
201 Z2_100_DB_top_pl_10 157 10.0
202 Z2_101_DB_Bilge_pl_10 58 10.0
203 Z2_102_DB_Bott_pl_10 144 10.0
204 Z2_103_DB_GDcent_12 3 12.0
205 Z2_104_DB_GD_9 55 9.0
206 Z2_105_DB__wall_pl_10 41 10.0
207 Z2_106_DB_Tank_pl_10 81 10.0
Page 132
132 Cioarec Dan Sebastian
Master Thesis developed at the University " Dunarea de Jos" of Galati, Romania
208 Z2_107_DB_GDcentPD_6 25 6.0
209 Z2_108_Bott_pl_12 21 12.0
210 Z2_120_DB_Frame_wb_10 41 10.0
211 Z2_122_DB_Frame_wb_9 388 9.0
212 Z2_130_DB_Bilge_longHP160x9 15 9.0
213 Z2_131_DB_bott_longHP_160x9 18 9.0
214 Z2_132_DB_longHp_180x9 100 9.0
215 Z2_133_DB_Bott_longHp_180x9 80 9.0
216 Z2_134_DB_longHP160x9 19 9.0
217 Z2_150_DB_bkt_15 3 15.0
218 Z2_201_Shell__pl_12 261 12.0
219 Z2_210_Shell_Frame_wb_15 239 15.0
220 Z2_211_Shell_Frame_fl_200x20 224 20.0
221 Z2_212_Shell_Frame_wb_12 38 12.0
222 Z2_213_Shell_Frame_fl_200x15 40 15.0
223 Z2_214_Shell_bhd_46_fr_wb_9 42 9.0
224 Z2_230_Shell_longHp160x9 196 9.0
225 Z2_231_Shell_Stringer_wb_12 52 12.0
226 Z2_232_Shell_Stringer_fl_15 24 15.0
227 Z2_250_Shell_Bkt_15 36 15.0
228 Z2_251_Shell_BKT_12 3 12.0
229 Z2_301_MDK_pl_9 119 9.0
230 Z2_302_MDK_pl_12 22 12.0
231 Z2_320_MDK_gd_wb_15 38 15.0
232 Z2_321_MDK_gd_fl_20 139 20.0
233 Z2_322_MDK_Gd_PDwb_7p5 11 7.5
234 Z2_330_MDK_longHP_140x8 91 8.0
235 Z2_340_MDK_Frame_wb_10 91 10.0
236 Z2_341_MDK_Frame_wb_12 93 12.0
237 Z2_342_MDK_Frame_wb_15 16 15.0
238 Z2_343_MDK_Frame_fl_150x12 152 12.0
239 Z2_344_MDK_Frame_fl_250x20 12 20.0
240 Z2_401_BHD_wall_fr46_8 98 8.0
241 Z2_407_BHD46_PL_10 60 10.0
242 Z2_420_BHD46_HP_180x9 38 9.0
243 Z2_421_BHD46_HP_140x8 10 8.0
244 Z2_431_BHD_46_gd_wb_12 7 12.0
245 Z2_432_BHD46_GD_fl_15 17 15.0
246 Z2_436_BHD46_GD_wb_15 7 15.0
247 Z2_437_BHD_46_GD_fl_20 14 20.0
248 Z2_438_BHD_PDweb_6 3 6.0
Page 133
Global and local strength analysis in equivalent quasi-static head waves, for a tanker ship structure,
based on full length and 2-3 cargo holds 3D-FEM models
133
“EMSHIP” Erasmus Mundus Master Course, period of study September 2011 – February 2013
Tab.A.4.3. Layers and thickness of block 3
RC DXF 3D Face Gross thk.
no. file no. [mm]
Midship Block 3
301 Z3_100_DB_top_pl_10 164 10.0
302 Z3_101_DB_Bilge_pl_10 132 10.0
303 Z3_102_DB_Bott_pl_10 211 10.0
304 Z3_103_DB_GDcent_12 2 12.0
305 Z3_104_DB_GD_9 49 9.0
306 Z3_106_DB_Tank_pl_10 143 10.0
307 Z3_107_DB_GDcentPD_6 36 6.0
308 Z3_120_DB_Frame_wb_10 89 10.0
309 Z3_121_DB_FR_WB_15 41 15.0
310 Z3_122_DB_Frame_wb_9 620 9.0
311 Z3_130_DB_Bilge_longHP160x9 33 9.0
312 Z3_131_DB_bott_longHP_160x9 47 9.0
313 Z3_132_DB_longHp_180x9 125 9.0
314 Z3_133_DB_Bott_longHp_180x9 103 9.0
315 Z3_134_DB_longHP160x9 49 9.0
316 Z3_201_Shell__pl_12 307 12.0
317 Z3_210_Shell_Frame_wb_15 403 15.0
318 Z3_211_Shell_Frame_fl_200x20 380 20.0
319 Z3_212_Shell_Frame_wb_12 52 12.0
320 Z3_213_Shell_Frame_fl_200x15 26 15.0
321 Z3_214_Shell_Frame_wb_9 84 9.0
322 Z3_230_Shell__longHp160x9 222 9.0
323 Z3_231_Shell_Stringer_wb_12 52 12.0
324 Z3_232_Shell_Stringer_fl_15 24 15.0
325 Z3_250_Shell_Bkt_15 59 15.0
326 Z3_251_Shell_BKT_12 2 12.0
327 Z3_301_MDK_pl_9 163 9.0
328 Z3_302_MDK_pl_12 38 12.0
329 Z3_320_MDK_gd_wb_15 58 15.0
330 Z3_321_MDK_gd_fl_20 209 20.0
331 Z3_322_MDK_gd__PDwb_7p5 14 7.5
332 Z3_330_MDK_longHP_140x8 120 8.0
333 Z3_340_MDK_Frame_wb_10 150 10.0
334 Z3_341_MDK_Frame_wb_12 119 12.0
335 Z3_342_MDK_frame_wb_15 29 15.0
336 Z3_343_MDK_Frame_fl_150x12 232 12.0
337 Z3_344_MDK_Frame_fl_250x20_BHD62 12 20.0
338 Z3_401_BHD_wall_fr78_8 85 8.0
339 Z3_402_BHD_wall_fr80_8 85 8.0
340 Z3_403_BHD_wall_fr62_8 33 8.0
Page 134
134 Cioarec Dan Sebastian
Master Thesis developed at the University " Dunarea de Jos" of Galati, Romania
341 Z3_404_BHD_wall_fr62_12 12 12.0
342 Z3_405_BHD_fr80_LG_pl_12 8 12.0
343 Z3_406_BHD_fr80_LG_pl_10 22 10.0
344 Z3_407_BHD_pl_fr80_10 110 10.0
345 Z3_408_BHD_fr80_LG_PD_6 8 6.0
346 Z3_420_BHD_fr78_80_Hp_180x9 57 9.0
347 Z3_421_BHD_fr78_80_Hp_140x8 98 8.0
348 Z3_422_BHD_fr62_HP_120x7 17 7.0
349 Z3_430_BHD_fr62__GD_wb_10 28 10.0
350 Z3_431_BHD_fr62__GD_wb_12 10 12.0
351 Z3_432_BHD_fr62_GD_fl_15 32 15.0
352 Z3_433_BHD_fr62_Frame_fl_250x20 6 20.0
353 Z3_Bott_pl_12 45 12.0
Tab.A.4.4. Layers and thickness of block 4
RC DXF 3D Face Gross thk.
no. file no. [mm]
Midship Block 4
401 Z4_100_DB_pl_10 168 10.0
402 Z4_101_DB_Bilge_pl_10 136 10.0
403 Z4_102_DB_Bott_pl_10 214 10.0
404 Z4_104_DB_GD_9 55 9.0
405 Z4_106_DB_Tank_pl_10 154 10.0
406 Z4_107_DB_GDcentPD_6 40 6.0
407 Z4_120_DB_frame_wb_10 40 10.0
408 Z4_121_DB_FR_WB_15 41 15.0
409 Z4_122_DB_Frame_wb_9 662 9.0
410 Z4_130_DB_Bilge_longHP160x9 34 9.0
411 Z4_131_DB_bott_longHP_160x9 48 9.0
412 Z4_132_DB_longHp_180x9 130 9.0
413 Z4_133_DB_Bott_longHp_180x9 104 9.0
414 Z4_134_DB_longHP160x9 48 9.0
415 Z4_201_Shell__pl_12 318 12.0
416 Z4_210_Shell_Frame_wb_15 444 15.0
417 Z4_211_Shell_Frame_fl_200x20 418 20.0
418 Z4_212_Shell_Frame_wb_12 53 12.0
419 Z4_213_Shell_Frame_fl_200x15 26 15.0
420 Z4_214_Shell_frame113_wb9 42 9.0
421 Z4_230_Shell__longHp160x9 225 9.0
422 Z4_231_Shell_Stringer_wb_12 64 12.0
423 Z4_232_Shell_Stringer_fl_15 30 15.0
424 Z4_250_Shell_Bkt_15 65 15.0
425 Z4_251_Shell_BKT_12 2 12.0
426 Z4_301_MDK_pl_9 168 9.0
Page 135
Global and local strength analysis in equivalent quasi-static head waves, for a tanker ship structure,
based on full length and 2-3 cargo holds 3D-FEM models
135
“EMSHIP” Erasmus Mundus Master Course, period of study September 2011 – February 2013
427 Z4_302_MDK_pl_12 37 12.0
428 Z4_320_MDK_gd_wb_15 60 15.0
429 Z4_321_MDK_gd_fl_20 228 20.0
430 Z4_322_MDK_gd__PDwb_7p5 15 7.5
431 Z4_330_MDK_longHP_140x8 129 8.0
432 Z4_340_MDK_Frame_wb_10 166 10.0
433 Z4_341_MDK_Frame_wb_12 133 12.0
434 Z4_342_MDK_frame_wb_15 29 15.0
435 Z4_343_MDK_Frame_fl_150x12 256 12.0
436 Z4_344_MDK_Frame_fl_250x20_BHD62 12 20.0
437 Z4_401_BHD_wall_fr113_8 104 8.0
438 Z4_403_BHD_wall_fr96_8 33 8.0
439 Z4_404_BHD_wall_fr96_12 12 12.0
440 Z4_407_BHD_fr113_pl_10 86 10.0
441 Z4_408_BHD_113_lg_PD_6 3 6.0
442 Z4_420_BHD_fr113_HP180x9 47 9.0
443 Z4_421_BHD_fr113_HP140x8 10 8.0
444 Z4_422_BHD_fr96_HP_120x7 17 7.0
445 Z4_430_BHD_fr96_GD_wb_10 28 10.0
446 Z4_431_BHD_fr96_GD_wb_12 10 12.0
447 Z4_432_BHD_fr96_GD_fl_15 32 15.0
448 Z4_433_BHD_fr96_Frame_fl_250x20 6 20.0
449 Z4_434_BHD_113_wb_12 7 12.0
450 Z4_435_BHD_113_fl_15 17 15.0
451 Z4_436_BHD_113_wb_15 7 15.0
452 Z4_437_BHD_113_fl_20 14 20.0
453 Z4_Bott_pl_12 45 12.0
Tab.A.4.5. Layers and thickness of block 5
RC DXF 3D Face Gross thk.
no. file no. [mm]
Midship Block 5
501 Z5_100_DB_top_pl_10 93 10.0
502 Z5_101_DB_Bilge_pl_10 68 10.0
503 Z5_102_DB_Bott_pl_10 120 10.0
504 Z5_103_DB_GDcent_12 1 12.0
505 Z5_104_DB_GD_9 28 9.0
506 Z5_106_DB_Tank_pl_10 77 10.0
507 Z5_107_DB_GDcentPD_6 20 6.0
508 Z5_120_DB_Frame130_wb_10 33 10.0
509 Z5_122_DB_Frame_wb_9 344 9.0
510 Z5_130_DB_Bilge_longHP160x9 17 9.0
511 Z5_131_DB_bott_longHP_160x9 16 9.0
Page 136
136 Cioarec Dan Sebastian
Master Thesis developed at the University " Dunarea de Jos" of Galati, Romania
512 Z5_132_DB_longHp_180x9 70 9.0
513 Z5_133_DB_Bott_longHp_180x9 62 9.0
514 Z5_134_DB_longHP160x9 16 9.0
515 Z5_201_Shell__pl_12 179 12.0
516 Z5_210_Shell_Frame_wb_15 242 15.0
517 Z5_211_Shell_Frame_fl_200x20 228 20.0
518 Z5_214_Shell_bhd130_fr_wb_9 50 9.0
519 Z5_230_Shell_longHp160x9 17 9.0
520 Z5_231_Shell_Stringer_wb_12 32 12.0
521 Z5_232_Shell_Stringer_fl_15 16 15.0
522 Z5_233_Shell_logHP_220x11 135 11.0
523 Z5_250_Shell_Bkt_15 36 15.0
524 Z5_301_MDK_pl_9 94 9.0
525 Z5_302_MDK_pl_12 16 12.0
526 Z5_320_MDK_gd_wb_15 33 15.0
527 Z5_321_MDK_gd_fl_20 121 20.0
528 Z5_322_MDK_gd__PDwb_7p5 9 7.5
529 Z5_330_MDK_longHP_140x8 72 8.0
530 Z5_340_MDK_Frame_wb_10 91 10.0
531 Z5_341_MDK_Frame_wb_12 67 12.0
532 Z5_342_MDK_frame_wb_15 13 15.0
533 Z5_343_MDK_Frame_fl_150x12 140 12.0
534 Z5_401_BHD_130_wall_8 83 8.0
535 Z5_407_BHD_130_pl_10 59 10.0
536 Z5_421_BHD_130_HP_140x8 21 8.0
537 Z5_423_BHD_130_HP160x8 23 8.0
538 Z5_434_BHD_130_wb_12 7 12.0
539 Z5_435_BHD_130_fl_15 17 15.0
540 Z5_436_BHD_130_wb_15 7 15.0
541 Z5_437_BHD_130_fl_20 14 20.0
542 Z5_438_BHD_130_wb_PD_6 3 6.0
543 Z5_Bott_pl_12 45 12.0
544 Z5_Shell_pl_12 63 12.0
Tab.A.4.6. Layers and thickness of block 6
RC DXF 3D Face Gross thk.
no. file no. [mm]
Midship Block 6
601 Z6_100_DB_top_pl_10 59 10.0
602 Z6_101_DB_Bilge_pl_10 24 10.0
603 Z6_102_DB_Bottom_pl_10 65 10.0
604 Z6_103_Bottom_pl_12 12 12.0
605 Z6_104_DB_GD_9 18 9.0
Page 137
Global and local strength analysis in equivalent quasi-static head waves, for a tanker ship structure,
based on full length and 2-3 cargo holds 3D-FEM models
137
“EMSHIP” Erasmus Mundus Master Course, period of study September 2011 – February 2013
606 Z6_106_DB_Tank_pl_10 61 10.0
607 Z6_107_DB_GDcentPD_6 13 6.0
608 Z6_122_DB_Frame_wb_9 155 9.0
609 Z6_123_DB_Frame_wb_12 34 12.0
610 Z6_132_DB_longHp_180x9 48 9.0
611 Z6_133_DB_Bott_longHp_180x9 43 9.0
612 Z6_201_Shell_pl_18 111 18.0
613 Z6_202_Shell_pl_10 54 10.0
614 Z6_210_Shell_Frame_wb_15 211 15.0
615 Z6_211_Shell_Frame_fl_200x20 198 20.0
616 Z6_230_Shell_longHp160x9 14 9.0
617 Z6_231_Shell_Stringer_wb_12 28 12.0
618 Z6_232_Shell_Stringer_fl_15 14 15.0
619 Z6_233_Shell_logHP_220x11 105 11.0
620 Z6_250_Shell_Bkt_15 24 15.0
621 Z6_301_MDK_pl_9 75 9.0
622 Z6_302_MDK_pl_12 13 12.0
623 Z6_320_MDK_gd_wb_15 26 15.0
624 Z6_321_MDK_gd_fl_20 91 20.0
625 Z6_322_MDK_gd__PDwb_7p5 5 7.5
626 Z6_330_MDK_longHP_140x8 50 8.0
627 Z6_340_MDK_Frame_wb_10 74 10.0
628 Z6_341_MDK_Frame_wb_12 62 12.0
629 Z6_343_MDK_Frame_fl_150x12 114 12.0
Tab.A.4.7. Layers and thickness of block 7
RC DXF 3D Face Gross thk.
no. file no. [mm]
Fore Block 7
701 Z7_102_bottom_pl_13p5 72 13.5
702 Z7_103_bottom_pl_18 17 18.0
703 Z7_104_DB_wb_10 77 10.0
704 Z7_105_DB_fl_150x15 69 15.0
705 Z7_107_DB_GD_PD_5 137 5.0
706 Z7_120_DB_frame_wb_10 36 10.0
707 Z7_121_DB_plate_10 52 10.0
708 Z7_150_transversal_HP140x8 164 8.0
709 Z7_151_transversal_HP160x9 15 9.0
710 z7_152_transversal_HP120x8 41 8.0
711 Z7_153_Shell_frame_HP_200x11 174 11.0
712 Z7_153_transversal_HP_180x9 8 9.0
713 Z7_170_DB_Bow_wb_12 17 12.0
714 Z7_171_DB_bow_fl_12 23 12.0
715 Z7_201_Shell_pl_18 407 18.0
Page 138
138 Cioarec Dan Sebastian
Master Thesis developed at the University " Dunarea de Jos" of Galati, Romania
716 Z7_202_Shell_pl_12 60 12.0
717 Z7_203_Shell_pl_10 43 10.0
718 Z7_210_Shell_frame_wb_10 18 10.0
719 Z7_211_Shell_frame_fl_120x12 50 12.0
720 Z7_212_Shell_frame_wb_12 31 12.0
721 Z7_213_Shell_frame_fl_200x15 10 15.0
722 Z7_214_Shell_frame_fl_150_15 16 15.0
723 Z7_220_Shell_pl_10 186 10.0
724 Z7_230_Shell_GD_wb_10 24 10.0
725 Z7_231_Shell_GD_fl_15 96 15.0
726 Z7_301_MDK_pl_9 90 9.0
727 Z7_310_MDK_gd_wb_10 43 10.0
728 z7_311_mdk_gd_fl_12 44 12.0
729 Z7_340_MDK_frame_wb_10 4 10.0
730 Z7_341_MDK_frame_fl_120x12 16 12.0
731 Z7_342_MDK_frame_wb_12 11 12.0
732 Z7_401_BHD_151_wall_10 20 10.0
733 Z7_402_BHD_155_wall_12 33 12.0
734 Z7_403_BHD_147_wall_10 77 10.0
735 Z7_404_BHD_143_wall_10 142 10.0
736 Z7_420_BHD_frame_wb_10 46 10.0
A.5.1. Table Inputs for the 1D Equivalent Beam Model Numerical
Computation
Table A.5.1. Numerical inputs for the 1D Equivalent Beam Mode computation
m m4 m
2 m
2 tm
2/m m
3 m
3 1/m
2
Nr.e x Iyy Afz A Jyy WD WB ktnn
1 0 3.01785 0.17165 0.33692 23.23747 0.70396 0.36392 6.22574
2 0.30 3.09697 0.17440 0.34232 23.84666 0.71781 0.39095 6.21832
3 0.90 3.25520 0.17990 0.35312 25.06503 0.74549 0.44502 6.20348
4 1.50 3.41343 0.18540 0.36391 26.28341 0.77317 0.49908 6.18865
5 2.10 3.57166 0.19090 0.37471 27.50179 0.80085 0.55314 6.17381
6 2.70 3.72989 0.19640 0.38550 28.72016 0.82854 0.60720 6.15897
7 3.30 3.88812 0.20190 0.39630 29.93854 0.85622 0.66127 6.14413
8 3.90 4.04635 0.20740 0.40710 31.15691 0.88390 0.71533 6.12930
9 4.50 4.20458 0.21290 0.41789 32.37529 0.91158 0.76939 6.11446
10 5.10 4.36281 0.21840 0.42869 33.59366 0.93927 0.82345 6.09962
11 5.70 4.52104 0.22390 0.43948 34.81204 0.96695 0.87752 6.08478
12 6.30 4.67927 0.22940 0.45028 36.03042 0.99463 0.93158 6.06995
13 6.90 4.83751 0.23490 0.46107 37.24879 1.02231 0.98564 6.05511
14 7.50 4.99574 0.24040 0.47187 38.46717 1.05000 1.03971 6.04027
15 8.10 5.15397 0.24590 0.48266 39.68554 1.07768 1.09377 6.02543
16 8.70 5.31220 0.25140 0.49346 40.90392 1.10536 1.14783 6.01060
17 9.30 5.47043 0.25690 0.50425 42.12229 1.13304 1.20189 5.99576
18 9.90 5.62866 0.26240 0.51505 43.34067 1.16073 1.25596 5.98092
Page 139
Global and local strength analysis in equivalent quasi-static head waves, for a tanker ship structure,
based on full length and 2-3 cargo holds 3D-FEM models
139
“EMSHIP” Erasmus Mundus Master Course, period of study September 2011 – February 2013
19 10.50 5.78689 0.26790 0.52585 44.55905 1.18841 1.31002 5.96608
20 11.10 5.94512 0.27340 0.53664 45.77742 1.21609 1.36408 5.95125
21 11.70 6.10335 0.27890 0.54744 46.99580 1.24377 1.41814 5.93641
22 12.30 6.26158 0.28440 0.55823 48.21417 1.27146 1.47221 5.92157
23 12.90 6.41981 0.28989 0.56903 49.43255 1.29914 1.52627 5.90673
24 13.50 6.57804 0.29539 0.57982 50.65092 1.32682 1.58033 5.89190
25 14.10 6.73627 0.30089 0.59062 51.86930 1.35450 1.63440 5.87706
26 14.70 6.89450 0.30639 0.60141 53.08768 1.38218 1.68846 5.86222
27 15.30 7.05273 0.31189 0.61221 54.30605 1.40987 1.74252 5.84738
28 15.90 7.21096 0.31739 0.62301 55.52443 1.43755 1.79658 5.83255
29 16.50 7.36920 0.32289 0.63380 56.74280 1.46523 1.85065 5.81771
30 17.10 7.52743 0.32839 0.64460 57.96118 1.49291 1.90471 5.80287
31 17.70 7.68566 0.33389 0.65539 59.17955 1.52060 1.95877 5.78803
32 18.29 7.83993 0.33926 0.66592 60.36747 1.54759 2.01148 5.77357
33 18.86 7.99025 0.34448 0.67617 61.52493 1.57389 2.06284 5.75947
34 19.43 8.14057 0.34971 0.68643 62.68238 1.60018 2.11420 5.74538
35 20.06 8.30882 0.35555 0.69791 63.97792 1.62962 2.17169 5.72960
36 20.77 8.49501 0.36203 0.71061 65.41155 1.66219 2.23530 5.71214
37 21.48 8.68119 0.36850 0.72331 66.84517 1.69477 2.29892 5.69468
38 22.18 8.86738 0.37497 0.73602 68.27879 1.72734 2.36253 5.67722
39 22.89 9.05356 0.38144 0.74872 69.71241 1.75991 2.42614 5.65976
40 23.59 9.21363 0.38818 0.76196 70.94493 1.79103 2.46904 5.65000
41 24.30 9.37369 0.39493 0.77519 72.17745 1.82214 2.51193 5.64024
42 25.01 9.53376 0.40167 0.78843 73.40997 1.85326 2.55483 5.63048
43 25.71 9.69383 0.40842 0.80167 74.64249 1.88437 2.59772 5.62071
44 26.42 9.85390 0.41516 0.81491 75.87501 1.91549 2.64062 5.61095
45 27.12 10.01396 0.42190 0.82814 77.10753 1.94660 2.68351 5.60119
46 27.83 10.17403 0.42865 0.84138 78.34005 1.97772 2.72640 5.59143
47 28.54 10.33410 0.43539 0.85462 79.57257 2.00883 2.76930 5.58166
48 29.24 10.49417 0.44213 0.86786 80.80509 2.03995 2.81219 5.57190
49 29.95 10.65423 0.44888 0.88109 82.03761 2.07107 2.85509 5.56214
50 30.65 10.81430 0.45562 0.89433 83.27012 2.10218 2.89798 5.55238
51 31.36 10.97437 0.46237 0.90757 84.50264 2.13330 2.94088 5.54261
52 32.11 11.14555 0.46958 0.92173 85.82071 2.16657 2.98675 5.53217
53 32.87 11.31695 0.47680 0.93590 87.14052 2.19989 3.03268 5.52172
54 33.58 11.31695 0.47680 0.93590 87.14052 2.19989 3.03268 5.52172
55 34.28 11.31695 0.47680 0.93590 87.14052 2.19989 3.03268 5.52172
56 34.99 11.31695 0.47680 0.93590 87.14052 2.19989 3.03268 5.52172
57 35.69 11.31695 0.47680 0.93590 87.14052 2.19989 3.03268 5.52172
58 36.40 11.31695 0.47680 0.93590 87.14052 2.19989 3.03268 5.52172
59 37.11 11.31695 0.47680 0.93590 87.14052 2.19989 3.03268 5.52172
60 37.81 11.31695 0.47680 0.93590 87.14052 2.19989 3.03268 5.52172
61 38.52 11.31695 0.47680 0.93590 87.14052 2.19989 3.03268 5.52172
62 39.22 11.31695 0.47680 0.93590 87.14052 2.19989 3.03268 5.52172
63 39.93 11.31695 0.47680 0.93590 87.14052 2.19989 3.03268 5.52172
64 40.64 11.31695 0.47680 0.93590 87.14052 2.19989 3.03268 5.52172
65 41.34 11.31695 0.47680 0.93590 87.14052 2.19989 3.03268 5.52172
66 42.05 11.31695 0.47680 0.93590 87.14052 2.19989 3.03268 5.52172
67 42.75 11.31695 0.47680 0.93590 87.14052 2.19989 3.03268 5.52172
68 43.46 11.31695 0.47680 0.93590 87.14052 2.19989 3.03268 5.52172
69 44.17 11.31695 0.47680 0.93590 87.14052 2.19989 3.03268 5.52172
70 44.87 11.31695 0.47680 0.93590 87.14052 2.19989 3.03268 5.52172
Page 140
140 Cioarec Dan Sebastian
Master Thesis developed at the University " Dunarea de Jos" of Galati, Romania
71 45.58 11.31695 0.47680 0.93590 87.14052 2.19989 3.03268 5.52172
72 46.28 11.31695 0.47680 0.93590 87.14052 2.19989 3.03268 5.52172
73 46.99 11.31695 0.47680 0.93590 87.14052 2.19989 3.03268 5.52172
74 47.70 11.31695 0.47680 0.93590 87.14052 2.19989 3.03268 5.52172
75 48.40 11.31695 0.47680 0.93590 87.14052 2.19989 3.03268 5.52172
76 49.11 11.31695 0.47680 0.93590 87.14052 2.19989 3.03268 5.52172
77 49.81 11.31695 0.47680 0.93590 87.14052 2.19989 3.03268 5.52172
78 50.52 11.31695 0.47680 0.93590 87.14052 2.19989 3.03268 5.52172
79 51.23 11.31695 0.47680 0.93590 87.14052 2.19989 3.03268 5.52172
80 51.93 11.31695 0.47680 0.93590 87.14052 2.19989 3.03268 5.52172
81 52.64 11.31695 0.47680 0.93590 87.14052 2.19989 3.03268 5.52172
82 53.34 11.31695 0.47680 0.93590 87.14052 2.19989 3.03268 5.52172
83 54.10 11.31695 0.47680 0.93590 87.14052 2.19989 3.03268 5.52172
84 54.88 11.31695 0.47680 0.93590 87.14052 2.19989 3.03268 5.52172
85 55.64 11.31695 0.47680 0.93590 87.14052 2.19989 3.03268 5.52172
86 56.43 11.31695 0.47680 0.93590 87.14052 2.19989 3.03268 5.52172
87 57.18 11.31695 0.47680 0.93590 87.14052 2.19989 3.03268 5.52172
88 57.89 11.31695 0.47680 0.93590 87.14052 2.19989 3.03268 5.52172
89 58.59 11.31695 0.47680 0.93590 87.14052 2.19989 3.03268 5.52172
90 59.30 11.31695 0.47680 0.93590 87.14052 2.19989 3.03268 5.52172
91 60.00 11.31695 0.47680 0.93590 87.14052 2.19989 3.03268 5.52172
92 60.71 11.31695 0.47680 0.93590 87.14052 2.19989 3.03268 5.52172
93 61.42 11.31695 0.47680 0.93590 87.14052 2.19989 3.03268 5.52172
94 62.12 11.31695 0.47680 0.93590 87.14052 2.19989 3.03268 5.52172
95 62.83 11.31695 0.47680 0.93590 87.14052 2.19989 3.03268 5.52172
96 63.53 11.31695 0.47680 0.93590 87.14052 2.19989 3.03268 5.52172
97 64.24 11.31695 0.47680 0.93590 87.14052 2.19989 3.03268 5.52172
98 64.95 11.31695 0.47680 0.93590 87.14052 2.19989 3.03268 5.52172
99 65.65 11.31695 0.47680 0.93590 87.14052 2.19989 3.03268 5.52172
100 66.36 11.31695 0.47680 0.93590 87.14052 2.19989 3.03268 5.52172
101 67.06 11.31695 0.47680 0.93590 87.14052 2.19989 3.03268 5.52172
102 67.77 11.31695 0.47680 0.93590 87.14052 2.19989 3.03268 5.52172
103 68.48 11.31695 0.47680 0.93590 87.14052 2.19989 3.03268 5.52172
104 69.18 11.31695 0.47680 0.93590 87.14052 2.19989 3.03268 5.52172
105 69.89 11.31695 0.47680 0.93590 87.14052 2.19989 3.03268 5.52172
106 70.59 11.31695 0.47680 0.93590 87.14052 2.19989 3.03268 5.52172
107 71.30 11.31695 0.47680 0.93590 87.14052 2.19989 3.03268 5.52172
108 72.01 11.31695 0.47680 0.93590 87.14052 2.19989 3.03268 5.52172
109 72.71 11.31695 0.47680 0.93590 87.14052 2.19989 3.03268 5.52172
110 73.42 11.31695 0.47680 0.93590 87.14052 2.19989 3.03268 5.52172
111 74.12 11.31695 0.47680 0.93590 87.14052 2.19989 3.03268 5.52172
112 74.83 11.31695 0.47680 0.93590 87.14052 2.19989 3.03268 5.52172
113 75.54 11.31695 0.47680 0.93590 87.14052 2.19989 3.03268 5.52172
114 76.24 11.31695 0.47680 0.93590 87.14052 2.19989 3.03268 5.52172
115 76.95 11.31695 0.47680 0.93590 87.14052 2.19989 3.03268 5.52172
116 77.65 11.31695 0.47680 0.93590 87.14052 2.19989 3.03268 5.52172
117 78.36 11.31695 0.47680 0.93590 87.14052 2.19989 3.03268 5.52172
118 79.07 11.31695 0.47680 0.93590 87.14052 2.19989 3.03268 5.52172
119 79.82 11.31695 0.47680 0.93590 87.14052 2.19989 3.03268 5.52172
120 80.58 11.31695 0.47680 0.93590 87.14052 2.19989 3.03268 5.52172
121 81.28 11.31695 0.47680 0.93590 87.14052 2.19989 3.03268 5.52172
122 81.99 11.31695 0.47680 0.93590 87.14052 2.19989 3.03268 5.52172
Page 141
Global and local strength analysis in equivalent quasi-static head waves, for a tanker ship structure,
based on full length and 2-3 cargo holds 3D-FEM models
141
“EMSHIP” Erasmus Mundus Master Course, period of study September 2011 – February 2013
123 82.70 11.31695 0.47680 0.93590 87.14052 2.19989 3.03268 5.52172
124 83.40 11.31695 0.47680 0.93590 87.14052 2.19989 3.03268 5.52172
125 84.11 11.31695 0.47680 0.93590 87.14052 2.19989 3.03268 5.52172
126 84.81 11.31695 0.47680 0.93590 87.14052 2.19989 3.03268 5.52172
127 85.52 11.31695 0.47680 0.93590 87.14052 2.19989 3.03268 5.52172
128 86.23 11.15462 0.46996 0.92248 85.89059 2.16834 2.98918 5.53162
129 86.93 10.99229 0.46312 0.90905 84.64067 2.13678 2.94568 5.54152
130 87.64 10.82997 0.45628 0.89563 83.39075 2.10523 2.90218 5.55142
131 88.34 10.66764 0.44944 0.88220 82.14082 2.07367 2.85868 5.56132
132 89.05 10.50531 0.44260 0.86878 80.89090 2.04212 2.81518 5.57122
133 89.76 10.34298 0.43577 0.85535 79.64098 2.01056 2.77168 5.58112
134 90.46 10.18066 0.42893 0.84193 78.39105 1.97901 2.72818 5.59102
135 91.17 10.01833 0.42209 0.82851 77.14113 1.94745 2.68468 5.60092
136 91.87 9.85600 0.41525 0.81508 75.89121 1.91590 2.64118 5.61082
137 92.58 9.69367 0.40841 0.80166 74.64129 1.88434 2.59768 5.62072
138 93.29 9.53135 0.40157 0.78823 73.39136 1.85279 2.55418 5.63062
139 93.99 9.36902 0.39473 0.77481 72.14144 1.82123 2.51068 5.64052
140 94.70 9.20669 0.38789 0.76138 70.89152 1.78968 2.46718 5.65042
141 95.36 9.05356 0.38144 0.74872 69.71241 1.75991 2.42614 5.65976
142 95.99 8.71599 0.37307 0.73230 67.11312 1.70587 2.33036 5.68459
143 96.61 8.37842 0.36471 0.71588 64.51383 1.65183 2.23458 5.70942
144 97.24 8.04085 0.35634 0.69946 61.91453 1.59779 2.13880 5.73424
145 97.86 7.70328 0.34798 0.68303 59.31524 1.54375 2.04301 5.75907
146 98.49 7.36571 0.33961 0.66661 56.71595 1.48971 1.94723 5.78390
147 99.11 7.02814 0.33124 0.65019 54.11666 1.43567 1.85145 5.80873
148 99.74 6.69057 0.32288 0.63377 51.51736 1.38163 1.75567 5.83355
149 100.35 6.36002 0.31469 0.61769 48.97214 1.32872 1.66188 5.85786
150 100.95 6.03595 0.30665 0.60192 46.47682 1.27684 1.56993 5.88170
151 101.55 5.71188 0.29862 0.58616 43.98150 1.22496 1.47798 5.90553
152 102.15 5.38781 0.29059 0.57039 41.48618 1.17308 1.38603 5.92936
153 102.75 5.06375 0.28256 0.55463 38.99085 1.12120 1.29407 5.95320
154 103.35 4.73968 0.27453 0.53887 36.49553 1.06932 1.20212 5.97703
155 103.95 4.41561 0.26650 0.52310 34.00021 1.01745 1.11017 6.00087
156 104.55 4.09154 0.25847 0.50734 31.50489 0.96557 1.01822 6.02470
157 105.15 3.76748 0.25043 0.49157 29.00957 0.91369 0.92627 6.04853
158 105.75 3.44341 0.24240 0.47581 26.51425 0.86181 0.83432 6.07237
159 106.35 3.11934 0.23437 0.46004 24.01893 0.80993 0.74237 6.09620
160 106.95 2.79527 0.22634 0.44428 21.52361 0.75805 0.65042 6.12004
161 107.55 2.47121 0.21831 0.42851 19.02829 0.70618 0.55847 6.14387
162 108.15 2.14714 0.21028 0.41275 16.53297 0.65430 0.46652 6.16770
163 108.75 1.82307 0.20225 0.39698 14.03765 0.60242 0.37456 6.19154
164 109.331 1.50927 0.19447 0.38172 11.62134 0.55218 0.28552 6.21462
165 109.611 1.35803 0.19072 0.37436 10.45686 0.52797 0.24261 6.22574
,where:
IY [m4] = Vertical bending moment of inertia
AF [m2]= Vertical Shearing area
Jyy [tm2/m]= the inertial mass moment per unit length
WD [m3] =strength modulus at the deck level
WB [m3] =strength modulus at the bottom level
ktnn [1/m2] = the coefficient of the tangential shear stress at the neutral axis
Page 142
142 Cioarec Dan Sebastian
Master Thesis developed at the University " Dunarea de Jos" of Galati, Romania
A.5.2.Table Results of the 1D Equivalent Beam Model Numerical
Computation in Hogging Condition
Table.A.5.2.1. Maximum Normal Deck Stress,σX [MPa] in Hogging wave conditions, 1D computation
hw
[m]
Stress max(max)
[MPa]
Stress adm_GS
[MPa]
ReH
[MPa]
max/adm_G
S
Cs=ReH/ma
x
0 8.45 265 390 0.032 46.132
1 19.46 265 390 0.073 20.039
2 32.05 265 390 0.121 12.170
3 44.26 265 390 0.167 8.812
4 55.76 265 390 0.210 6.995
5 66.91 265 390 0.252 5.829
6 77.65 265 390 0.293 5.022
7 87.84 265 390 0.331 4.440
8 97.18 265 390 0.367 4.013
8.123 98.25 265 390 0.371 3.969
Table.A.5.2.2. Maximum Normal Bottom Stress,σX [MPa] in Hogging wave conditions, 1D computation
hw
[m]
Stress max(max)
[MPa]
Stress adm_GS
[MPa]
ReH
[MPa]
max/adm_G
S
Cs=ReH/ma
x
0 6.70 175 235 0.038 35.050
1 14.12 175 235 0.081 16.646
2 23.25 175 235 0.133 10.110
3 32.10 175 235 0.183 7.320
4 40.45 175 235 0.231 5.810
5 48.53 175 235 0.277 4.842
6 56.33 175 235 0.322 4.172
7 63.72 175 235 0.364 3.688
8 70.50 175 235 0.403 3.334
8.123 71.27 175 235 0.407 3.297
Table. A.5.2.3. Maximum Tangential side stress τxz [MPa] in Hogging wave conditions, 1D computation
hw [m] Stress max(max) [MPa] Stress adm_GS [MPa] ReH [MPa] max/adm_GS Cs=ReH/max
0 6.34 110 235 0.058 37.052
1 8.90 110 235 0.081 26.405
2 13.75 110 235 0.125 17.087
3 18.48 110 235 0.168 12.720
4 22.98 110 235 0.209 10.228
5 27.37 110 235 0.249 8.587
6 31.65 110 235 0.288 7.426
7 35.77 110 235 0.325 6.570
8 39.64 110 235 0.360 5.928
8.123 40.09 110 235 0.364 5.861
Page 143
Global and local strength analysis in equivalent quasi-static head waves, for a tanker ship structure,
based on full length and 2-3 cargo holds 3D-FEM models
143
“EMSHIP” Erasmus Mundus Master Course, period of study September 2011 – February 2013
A.5.3. Table Results of the 1D Equivalent Beam Model Numerical
Computation in Sagging Condition Table.A.5.3.1. Maximum Normal Deck Stress,σX [MPa] in Sagging wave conditions, 1D computation
hw [m] Stress max(max) [MPa] Stress adm_GS [MPa] ReH [MPa] max/adm_GS Cs=ReH/max
0 8.45 265 390 0.032 46.132
1 8.62 265 390 0.033 45.249
2 22.96 265 390 0.087 16.984
3 37.90 265 390 0.143 10.290
4 53.36 265 390 0.201 7.309
5 69.28 265 390 0.261 5.630
6 85.56 265 390 0.323 4.558
7 102.18 265 390 0.385 3.817
8 119.07 265 390 0.449 3.275
8.123 121.17 265 390 0.457 3.219
Table.A.5.3.2. Maximum Normal Bottom Stress,σX [MPa] in Sagging wave conditions, 1D computation
hw [m] Stress max(max) [MPa] Stress adm_GS [MPa] ReH [MPa] max/adm_GS Cs=ReH/max
0 6.70 175 235 0.038 35.050
1 6.25 175 235 0.036 37.587
2 16.66 175 235 0.095 14.108
3 27.49 175 235 0.157 8.547
4 38.71 175 235 0.221 6.071
5 50.25 175 235 0.287 4.676
6 62.06 175 235 0.355 3.786
7 74.12 175 235 0.424 3.170
8 86.38 175 235 0.494 2.721
8.123 87.90 175 235 0.502 2.674
Table. A.5.3.3. Maximum Tangential side stress τxz [MPa] in Sagging wave conditions, 1D computation
hw [m] Stress max(max) [MPa] Stress adm_GS [MPa] ReH [MPa] max/adm_GS Cs=ReH/max
0 6.34 110 235 0.058 37.052
1 7.90 110 235 0.072 29.765
2 13.06 110 235 0.119 17.989
3 18.40 110 235 0.167 12.774
4 23.89 110 235 0.217 9.838
5 29.68 110 235 0.270 7.918
6 35.58 110 235 0.323 6.605
7 41.53 110 235 0.378 5.659
8 47.53 110 235 0.432 4.944
8.123 48.27 110 235 0.439 4.868
Page 144
144 Cioarec Dan Sebastian
Master Thesis developed at the University " Dunarea de Jos" of Galati, Romania
A.6.1. Table Results of the Numerical Computation in Hogging Conditions,
Full Extended 3D-FEM Model
Table.A.6.1.1. Maximum Normal Deck Stress,σX [MPa] in Hogging wave conditions,
3D-FEM full extended model, Safety coefficients Cs according to the yield stress limit ReH
hw
[m]
Stress max(max)
[MPa]
Stress adm_GS
[MPa]
ReH
[MPa]
max/adm_G
S
Cs=ReH/ma
x
0 22.15 265 390 0.084 17.607
1 43.37 265 390 0.164 8.992
2 75.39 265 390 0.284 5.173
3 105.10 265 390 0.396 3.711
4 133.70 265 390 0.504 2.917
5 161.60 265 390 0.609 2.413
6 188.80 265 390 0.712 2.066
7 214.60 265 390 0.809 1.817
8 238.40 265 390 0.899 1.636
8.123 241.20 265 390 0.910 1.617
Table.A.6.1.2. Maximum Equivalent vonMises Deck Stress, σvon [MPa] in Hogging wave conditions,
3D-FEM full extended model, Safety coefficients Cs according to the yield stress limit ReH
hw
[m]
Stress max(max)
[MPa]
Stress adm_GS
[MPa]
ReH
[MPa]
max/adm_G
S
Cs=ReH/ma
x
0 92.16 265 390 0.348 4.232
1 92.16 265 390 0.348 4.232
2 92.16 265 390 0.348 4.232
3 94.87 265 390 0.358 4.111
4 120.60 265 390 0.455 3.234
5 145.70 265 390 0.549 2.677
6 170.10 265 390 0.642 2.293
7 193.40 265 390 0.729 2.017
8 215.30 265 390 0.812 1.811
8.123 217.80 265 390 0.821 1.791
Table.A.6.1.3. Maximum Normal Bottom Stress,σX [MPa] in Hogging wave conditions,
3D-FEM full extended model, Safety coefficients Cs according to the yield stress limit ReH
hw [m] Stress max(max) [MPa] Stress adm_GS [MPa] ReH [MPa] max/adm_GS Cs=ReH/max
0 37.56 175 235 0.215 6.257
1 36.55 175 235 0.209 6.430
2 38.49 175 235 0.220 6.105
3 48.18 175 235 0.275 4.878
4 57.65 175 235 0.329 4.076
5 66.95 175 235 0.383 3.510
6 76.06 175 235 0.435 3.090
7 84.79 175 235 0.485 2.772
8 92.80 175 235 0.530 2.532
8.123 94.89 175 235 0.542 2.477
Page 145
Global and local strength analysis in equivalent quasi-static head waves, for a tanker ship structure,
based on full length and 2-3 cargo holds 3D-FEM models
145
“EMSHIP” Erasmus Mundus Master Course, period of study September 2011 – February 2013
Table.A.6.1.4. Maximum Equivalent vonMises Bottom Stress, σvon [MPa] in Hogging wave
conditions, 3D-FEM full extended model, Safety coefficients Cs according to the yield stress limit
ReH
hw
[m]
Stress max(max)
[MPa]
Stress adm_GS
[MPa]
ReH
[MPa]
max/adm_G
S
Cs=ReH/ma
x
0 38.96 175 235 0.223 6.032
1 36.73 175 235 0.210 6.398
2 34.84 175 235 0.199 6.745
3 43.69 175 235 0.250 5.379
4 52.39 175 235 0.299 4.486
5 60.96 175 235 0.348 3.855
6 69.36 175 235 0.396 3.388
7 77.40 175 235 0.442 3.036
8 84.78 175 235 0.484 2.772
8.123 85.62 175 235 0.489 2.745
Table.A.6.1.5. Maximum Tangential side stress τxz [MPa] in Hogging wave conditions,
3D-FEM full extended model, Safety coefficients Cs according to the yield stress limit ReH
hw [m] Stress max(max) [MPa] Stress adm_GS [MPa] ReH [MPa] max/adm_GS Cs=ReH/max
0 5.88 110 235 0.053 39.946
1 8.17 110 235 0.074 28.750
2 11.47 110 235 0.104 20.488
3 15.79 110 235 0.144 14.883
4 19.87 110 235 0.181 11.827
5 23.80 110 235 0.216 9.874
6 27.58 110 235 0.251 8.521
7 31.14 110 235 0.283 7.547
8 34.30 110 235 0.312 6.851
8.123 34.70 110 235 0.315 6.772
A.6.2. Table Results of the Numerical Computation in Sagging Conditions,
Full Extended 3D-FEM Model
Table.A.6.2.1. Maximum Normal Deck Stress,σX [MPa] in Sagging wave conditions,
3D-FEM full extended model, Safety coefficients Cs according to the yield stress limit ReH
hw [m] Stress max(max) [MPa] Stress adm_GS [MPa] ReH [MPa] max/adm_GS Cs=ReH/max
0 14.20 265 390 0.054 27.465
1 31.53 265 390 0.119 12.369
2 71.65 265 390 0.270 5.443
3 112.60 265 390 0.425 3.464
4 153.90 265 390 0.580 2.534
5 195.60 265 390 0.738 1.994
6 237.80 265 390 0.897 1.640
7 280.70 265 390 1.059 1.389
8 324.40 265 390 1.223 1.202
8.123 329.90 265 390 1.244 1.182
Page 146
146 Cioarec Dan Sebastian
Master Thesis developed at the University " Dunarea de Jos" of Galati, Romania
Table.A.6.2.2. Maximum Equivalent vonMises Deck Stress, σvon [MPa] in Sagging wave conditions,
3D-FEM full extended model, Safety coefficients Cs according to the yield stress limit ReH
hw [m] Stress max(max) [MPa] Stress adm_GS [MPa] ReH [MPa] max/adm_GS Cs=ReH/max
0 26.19 265 390 0.099 14.891
1 29.13 265 390 0.110 13.388
2 64.78 265 390 0.244 6.020
3 101.80 265 390 0.384 3.831
4 139.10 265 390 0.525 2.804
5 176.80 265 390 0.667 2.206
6 214.90 265 390 0.810 1.815
7 253.60 265 390 0.956 1.538
8 293.00 265 390 1.105 1.331
8.123 297.90 265 390 1.124 1.309
Table.A.6.2.3. Maximum Normal Bottom Stress,σX [MPa] in Sagging wave conditions,
3D-FEM full extended model, Safety coefficients Cs according to the yield stress limit ReH
hw [m] Stress max(max) [MPa] Stress adm_GS [MPa] ReH [MPa] max/adm_GS Cs=ReH/max
0 37.56 175 235 0.215 6.257
1 33.86 175 235 0.193 6.940
2 32.78 175 235 0.187 7.169
3 39.96 175 235 0.228 5.881
4 53.06 175 235 0.303 4.429
5 66.27 175 235 0.379 3.546
6 79.64 175 235 0.455 2.951
7 93.19 175 235 0.533 2.522
8 107.00 175 235 0.611 2.196
8.123 111.30 175 235 0.636 2.111
Table.A.6.2.4. Maximum Equivalent vonMises Bottom Stress, σvon [MPa] in Sagging wave
conditions,
3D-FEM full extended model, Safety coefficients Cs according to the yield stress limit ReH
hw [m] Stress max(max) [MPa] Stress adm_GS [MPa] ReH [MPa] max/adm_GS Cs=ReH/max
0 38.96 175 235 0.223 6.032
1 38.99 175 235 0.223 6.027
2 44.31 175 235 0.253 5.304
3 53.19 175 235 0.304 4.418
4 62.71 175 235 0.358 3.747
5 72.80 175 235 0.416 3.228
6 83.33 175 235 0.476 2.820
7 94.15 175 235 0.538 2.496
8 105.10 175 235 0.601 2.236
8.123 106.50 175 235 0.609 2.207
Page 147
Global and local strength analysis in equivalent quasi-static head waves, for a tanker ship structure,
based on full length and 2-3 cargo holds 3D-FEM models
147
“EMSHIP” Erasmus Mundus Master Course, period of study September 2011 – February 2013
Table.A.6.2.5. Maximum Tangential side stress τxz [MPa] in Sagging wave conditions,
3D-FEM full extended model, Safety coefficients Cs according to the yield stress limit ReH
hw [m] Stress max(max) [MPa] Stress adm_GS [MPa] ReH [MPa] max/adm_GS Cs=ReH/max
0 5.88 110 235 0.053 39.946
1 5.90 110 235 0.054 39.851
2 10.73 110 235 0.098 21.901
3 15.69 110 235 0.143 14.978
4 21.50 110 235 0.195 10.930
5 27.43 110 235 0.249 8.567
6 33.39 110 235 0.304 7.038
7 39.42 110 235 0.358 5.961
8 45.52 110 235 0.414 5.163
8.123 47.85 110 235 0.435 4.911
A.7. Tables Results for the Numerical Computation in Hogging and
Sagging Conditions, Two Cargo Holds Compartments 3D-FEM Model,
With Coarse Size Mesh
Table.A.7.1. Maximum Normal Deck Stress,σX [MPa] in Hogging wave conditions, two cargo holds
compartments 3D-FEM model With Coarse Size Mesh, Safety coefficients Cs according to the yield
stress limit ReH
hw [m] Stress max(max) [MPa] Stress adm_GS [MPa] ReH [MPa] max/adm_GS Cs=ReH/max
0 12.44 265 390 0.047 31.350
8.123 257.90 265 390 0.973 1.512
Table.A.7.2. Maximum Equivalent vonMises Deck Stress, σvon [MPa] in Hogging wave conditions,
two cargo holds compartments 3D-FEM model With Coarse Size Mesh, Safety coefficients Cs
according to the yield stress limit ReH
hw [m] Stress max(max) [MPa] Stress adm_GS [MPa] ReH [MPa] max/adm_GS Cs=ReH/max
0 11.32 265 390 0.043 34.452
8.123 233.00 265 390 0.879 1.674
Table. A.7.3. Maximum Normal Bottom Stress,σX [MPa] in Hogging wave conditions, two cargo
holds compartments 3D-FEM model With Coarse Size Mesh, Safety coefficients Cs according to the
yield stress limit ReH
hw [m] Stress max(max) [MPa] Stress adm_GS [MPa] ReH [MPa] max/adm_GS Cs=ReH/max
0 23.94 175 235 0.137 9.816
8.123 98.01 175 235 0.560 2.398
Table. A.7.4. Maximum Equivalent vonMises Bottom Stress, σvon [MPa] in Hogging wave conditions,
two cargo holds compartments 3D-FEM model With Coarse Size Mesh, Safety coefficients Cs
according to the yield stress limit ReH
hw
[m]
Stress max(max)
[MPa]
Stress adm_GS
[MPa]
ReH
[MPa]
max/adm_G
S
Cs=ReH/ma
x
0 21.49 175 235 0.123 10.935
8.123 88.60 175 235 0.506 2.652
Page 148
148 Cioarec Dan Sebastian
Master Thesis developed at the University " Dunarea de Jos" of Galati, Romania
Table. A.7.5. Maximum Tangential side stress τxz [MPa] in Hogging wave conditions, two cargo holds
compartments 3D-FEM model With Coarse Size Mesh, Safety coefficients Cs according to the yield
stress limit ReH
hw
[m]
Stress max(max)
[MPa]
Stress adm_GS
[MPa]
ReH
[MPa]
max/adm_G
S
Cs=ReH/ma
x
0 3.40 110 235 0.031 69.036
8.123 35.78 110 235 0.325 6.568
Table.A.7.6. Maximum Normal Deck Stress,σX [MPa] in Sagging wave conditions, two cargo holds
compartments 3D-FEM model With Coarse Size Mesh, Safety coefficients Cs according to the yield
stress limit ReH
hw
[m]
Stress max(max)
[MPa]
Stress adm_GS
[MPa]
ReH
[MPa]
max/adm_G
S
Cs=ReH/ma
x
0 12.44 265 390 0.047 31.350
8.123 321.30 265 390 1.212 1.214
Table.A.7.7. Maximum Equivalent vonMises Deck Stress, σvon [MPa] in Sagging wave conditions,
two cargo holds compartments 3D-FEM model With Coarse Size Mesh, Safety coefficients Cs
according to the yield stress limit ReH hw [m] Stress max(max) [MPa] Stress adm_GS [MPa] ReH [MPa] max/adm_GS Cs=ReH/max
0 11.32 265 390 0.043 34.452
8.123 290.10 265 390 1.094 1.344
Table. A.7.8. Maximum Normal Bottom Stress,σX [MPa] in Sagging wave conditions, 2 cargo holds
compartments 3D-FEM model With Coarse Size Mesh, Safety coefficients Cs according to the yield
stress limit ReH
hw [m] Stress max(max) [MPa] Stress adm_GS [MPa] ReH [MPa] max/adm_GS Cs=ReH/max
0 23.94 175 235 0.137 9.816
8.123 118.90 175 235 0.678 1.976
Table. A.7.9. Maximum Equivalent vonMises Bottom Stress, σvon [MPa] in Sagging wave conditions,
2 cargo holds compartments 3D-FEM model With Coarse Size Mesh, Safety coefficients Cs
according to the yield stress limit ReH
hw [m] Stress max(max) [MPa] Stress adm_GS [MPa] ReH [MPa] max/adm_GS Cs=ReH/max
0 21.49 175 235 0.123 10.935
8.123 105.40 175 235 0.602 2.230
Table. A.7.10. Maximum Tangential side stress τxz [MPa] in Sagging wave conditions, 2 cargo holds
compartments 3D-FEM model With Coarse Size Mesh, Safety coefficients Cs according to the yield
stress limit ReH
hw [m] Stress max(max) [MPa] Stress adm_GS [MPa] ReH [MPa] max/adm_GS Cs=ReH/max
0 3.40 110 235 0.031 69.036
8.123 42.36 110 235 0.385 5.548
Page 149
Global and local strength analysis in equivalent quasi-static head waves, for a tanker ship structure,
based on full length and 2-3 cargo holds 3D-FEM models
149
“EMSHIP” Erasmus Mundus Master Course, period of study September 2011 – February 2013
A.8. Tables Results for the Numerical Computation in Hogging and
Sagging Conditions, Two Cargo Holds Compartments 3D-FEM Model,
With Fine Mesh Size
Table.A.8.1. Maximum Normal Deck Stress, σX [MPa] in Hogging wave conditions, two cargo holds
compartments 3D-FEM fine mesh model, Safety coefficients Cs according to the yield stress limit ReH
hw [m] Stress max(max) [MPa] Stress adm_GS [MPa] ReH [MPa] max/adm_GS Cs=ReH/max
0 18.24 265 390 0.069 21.382
8.123 390.00 265 390 1.471 1.000
Table.A.8.2. Maximum Equivalent vonMises Deck Stress, σvon [MPa] in Hogging wave conditions, two
cargo holds compartments 3D-FEM fine mesh model, Safety coefficients Cs according to the yield stress
limit ReH
hw [m] Stress max(max) [MPa] Stress adm_GS [MPa] ReH [MPa] max/adm_GS Cs=ReH/max
0 16.51 265 390 0.062 23.622
8.123 356.30 265 390 1.344 1.095
Table. A.8.3. Maximum Normal Bottom Stress, σX [MPa] in Hogging wave conditions, two cargo holds
compartments 3D-FEM fine mesh model, Safety coefficients Cs according to the yield stress limit ReH
hw [m] Stress max(max) [MPa] Stress adm_GS [MPa] ReH [MPa] max/adm_GS Cs=ReH/max
0 28.79 175 235 0.165 8.163
8.123 109.30 175 235 0.625 2.150
Table. A.8.4. Maximum Equivalent vonMises Bottom Stress, σvon [MPa] in Hogging wave conditions, two
cargo holds compartments 3D-FEM fine mesh model, Safety coefficients Cs according to the yield stress
limit ReH
hw
[m]
Stress max(max)
[MPa]
Stress adm_GS
[MPa]
ReH
[MPa]
max/adm_G
S
Cs=ReH/ma
x
0 36.04 175 235 0.206 6.521
8.123 100.40 175 235 0.574 2.341
Table. A.8.5. Maximum Tangential side stress τxz [MPa] in Hogging wave conditions, two cargo holds
compartments 3D-FEM fine mesh model, Safety coefficients Cs according to the yield stress limit ReH
hw
[m]
Stress max(max)
[MPa]
Stress adm_GS
[MPa]
ReH
[MPa]
max/adm_G
S
Cs=ReH/ma
x
0 4.51 110 235 0.041 52.164
8.123 36.52 110 235 0.332 6.435
Table.A.8.6. Maximum Normal Deck Stress,σX [MPa] in Sagging wave conditions, two cargo holds
compartments 3D-FEM fine mesh model, Safety coefficients Cs according to the yield stress limit ReH
hw
[m]
Stress max(max)
[MPa]
Stress adm_GS
[MPa]
ReH
[MPa]
max/adm_G
S
Cs=ReH/ma
x
0 18.24 265 390 0.069 21.382
8.123 486.50 265 390 1.835 0.802
Table.A.8.7. Maximum Equivalent vonMises Deck Stress, σvon [MPa] in Sagging wave conditions, two cargo
holds compartments 3D-FEM fine mesh model, Safety coefficients Cs according to the yield stress limit ReH
hw
[m]
Stress max(max)
[MPa]
Stress adm_GS
[MPa]
ReH
[MPa]
max/adm_G
S
Cs=ReH/ma
x
0 16.51 265 390 0.062 23.622
8.123 435.40 265 390 1.642 0.896
Page 150
150 Cioarec Dan Sebastian
Master Thesis developed at the University " Dunarea de Jos" of Galati, Romania
Table. A.8.8. Maximum Normal Bottom Stress,σX [MPa] in Sagging wave conditions, two cargo holds
compartments 3D-FEM fine mesh model, Safety coefficients Cs according to the yield stress limit ReH
hw [m] Stress max(max) [MPa] Stress adm_GS [MPa] ReH [MPa] max/adm_GS Cs=ReH/max
0 28.79 175 235 0.165 8.163
8.123 120.70 175 235 0.690 1.947
Table. A.8.9. Maximum Equivalent vonMises Bottom Stress, σvon [MPa] in Sagging wave conditions, two
cargo holds compartments 3D-FEM fine mesh model, Safety coefficients Cs according to the yield stress
limit ReH
hw
[m]
Stress max(max)
[MPa]
Stress adm_GS
[MPa]
ReH
[MPa]
max/adm_G
S
Cs=ReH/ma
x
0 36.04 175 235 0.206 6.521
8.123 107.80 175 235 0.616 2.180
Table. A.8.10. Maximum Tangential side stress τxz [MPa] in Sagging wave conditions, two cargo holds
compartments 3D-FEM fine mesh model, Safety coefficients Cs according to the yield stress limit ReH
hw
[m]
Stress max(max)
[MPa]
Stress adm_GS
[MPa]
ReH
[MPa]
max/adm_G
S
Cs=ReH/ma
x
0 4.51 110 235 0.041 52.164
8.123 42.41 110 235 0.386 5.541
Table.A.8.11. Maximum Normal Deck Stress,σX [MPa] in Hogging wave conditions, two cargo holds
compartments 3D-FEM fine mesh model, Safety coefficients Cs according to the yield stress limit
ReH, with Hotspot correction
hw
[m]
Stress max(max)
[MPa]
Stress adm_GS
[MPa]
ReH
[MPa]
max/adm_G
S
Cs=ReH/ma
x
0 16.47 265 390 0.062 23.675
8.123 321.57 265 390 1.213 1.213
Table.A.8.12. Maximum Equivalent vonMises Deck Stress, σvon [MPa] in Hogging wave conditions,
two cargo holds compartments 3D-FEM fine mesh model, Safety coefficients Cs according to the
yield stress limit ReH, with Hotspot correction
hw
[m]
Stress max(max)
[MPa]
Stress adm_GS
[MPa]
ReH
[MPa]
max/adm_G
S
Cs=ReH/ma
x
0 16.19 265 390 0.061 24.089
8.123 294.76 265 390 1.112 1.323
Table.A.8.13. Maximum Normal Deck Stress,σX [MPa] in Sagging wave conditions, two cargo holds
compartments 3D-FEM fine mesh model, Safety coefficients Cs according to the yield stress limit
ReH, with Hotspot correction
hw [m] Stress max(max) [MPa] Stress adm_GS [MPa] ReH [MPa] max/adm_GS Cs=ReH/max
0 16.47 265 390 0.062 23.675
8.123 389.90 265 390 1.470 1.000
Table.A.8.14. Maximum Equivalent vonMises Deck Stress, σvon [MPa] in Sagging wave conditions,
two cargo holds compartments 3D-FEM fine mesh model, Safety coefficients Cs according to the
yield stress limit ReH, with Hotspot correction
hw
[m]
Stress max(max)
[MPa]
Stress adm_GS
[MPa]
ReH
[MPa]
max/adm_G
S
Cs=ReH/ma
x
0 16.19 265 390 0.061 24.089
8.123 371.64 265 390 1.402 1.049