36
GLOBAL ASSET ALLOCATION AND STOCK SELECTION ASSIGNMENT # 1 SMALL CAP LONG-SHORT STRATEGY FIRST-YEAR BRAVES Daniel Grundman, Kader Hidra, Damian Olesnycky, Jason Trujillo, Alex Volzhin
| Date post: | 24-Dec-2015 |
| Category: |
Documents |
| Upload: | philip-marshall |
| View: | 213 times |
| Download: | 0 times |

GLOBAL ASSET ALLOCATION AND STOCK
SELECTION
ASSIGNMENT # 1SMALL CAP LONG-SHORT STRATEGY
FIRST-YEAR BRAVESDaniel Grundman, Kader Hidra, Damian Olesnycky,
Jason Trujillo, Alex Volzhin
Methodology Goal: to identify long-short strategy for trading
US small cap stocks using Fact Set.
Universe Definition: US stocks with market cap from $300M to $2B.
Strategy: Buy 1st quintile, Short 5th quintile.
Benchmark: S&P 500
In-sample period: Jan, 1995 – Dec, 2004
Out-of-sample period: Jan-Dec, 2005

Factors We tested many factors but settled on
three:
One-month return
Six-month return
Current price to 52-week high
Additionally, we tried various combinations of these factors (two-factor and tree-factor models)
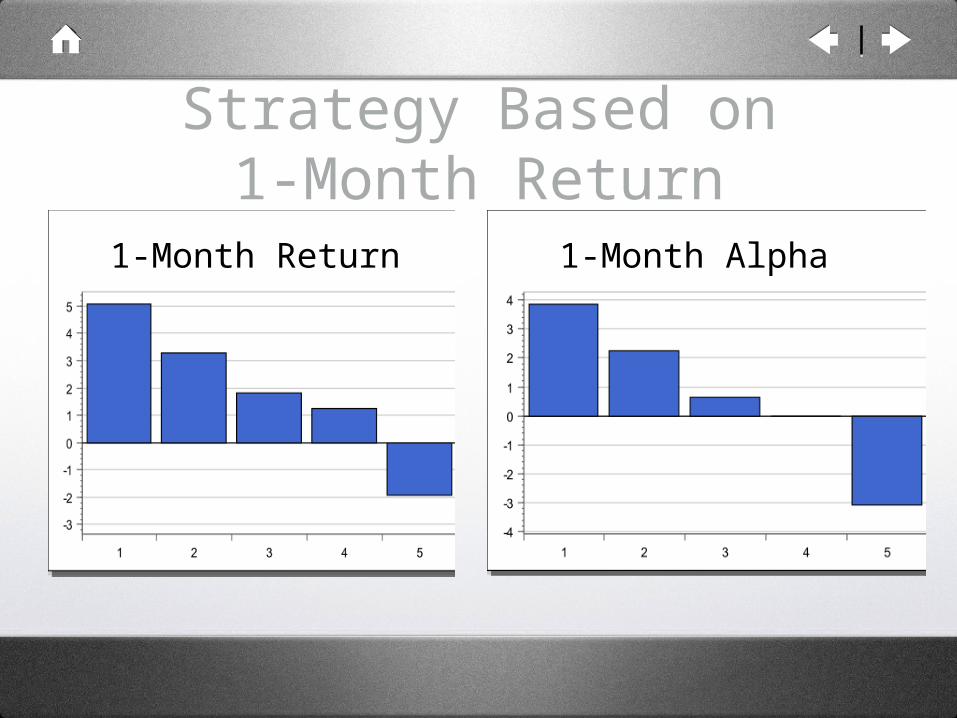
Strategy Based on1-Month Return
1-Month Return 1-Month Alpha

Strategy Based on6-Month Return
6-Month Return 6-Month Alpha

Current Price to 52-Week High
Price to 52-Week High Return Price to 52-Week High Alpha

Other Explored Factors In addition to the previous 3 factors, we tried
several other metrics:
Book to Market Price
Price to Earnings
Dividend Yield
Return on Equity
Revision Ratio
However, we found all of them to be of little value.

Book to Market Price
Book to Price Return Book to Price Alpha

Price to EarningsP/E Return P/E Alpha

Revision RatioRevision Ratio Return Revision Ratio Alpha
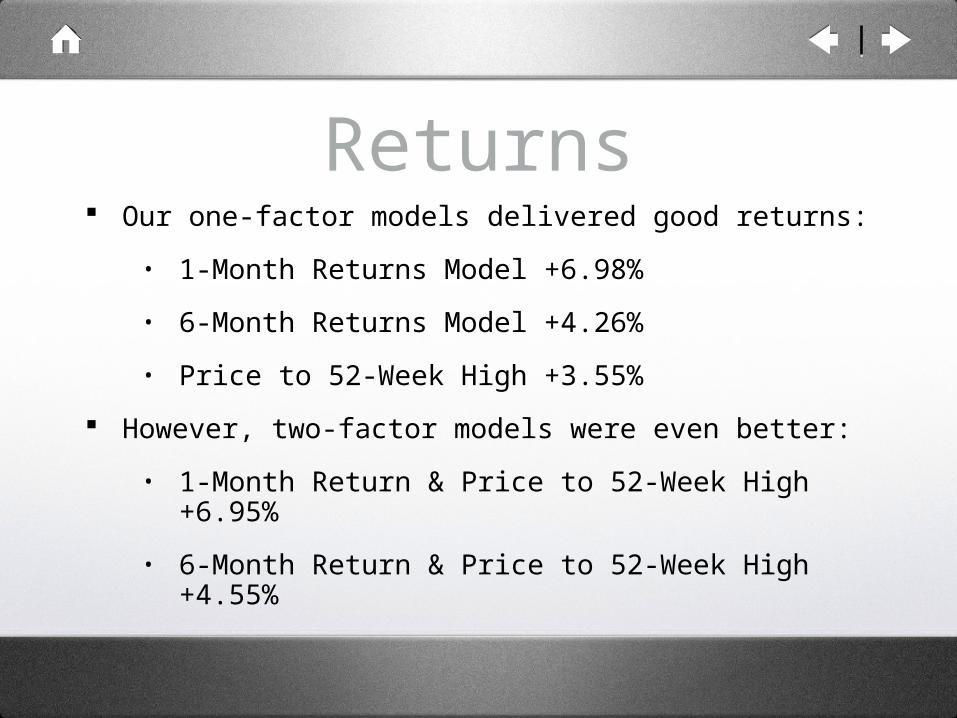
Returns Our one-factor models delivered good returns:
• 1-Month Returns Model +6.98%
• 6-Month Returns Model +4.26%
• Price to 52-Week High +3.55%
However, two-factor models were even better:
• 1-Month Return & Price to 52-Week High +6.95%
• 6-Month Return & Price to 52-Week High +4.55%

Bivariate Model: 1-Month Return & Price to 52-Week
High
Price to 52 Week High and 1 Month Return
-3
-2
-1
0
1
2
3
4
5
6
1 2 3 4 5Mon
thly
Ret
urn
Price to 52 Week High and 1 Month ReturnAlpha
-3
-2
-1
0
1
2
3
4
1 2 3 4 5
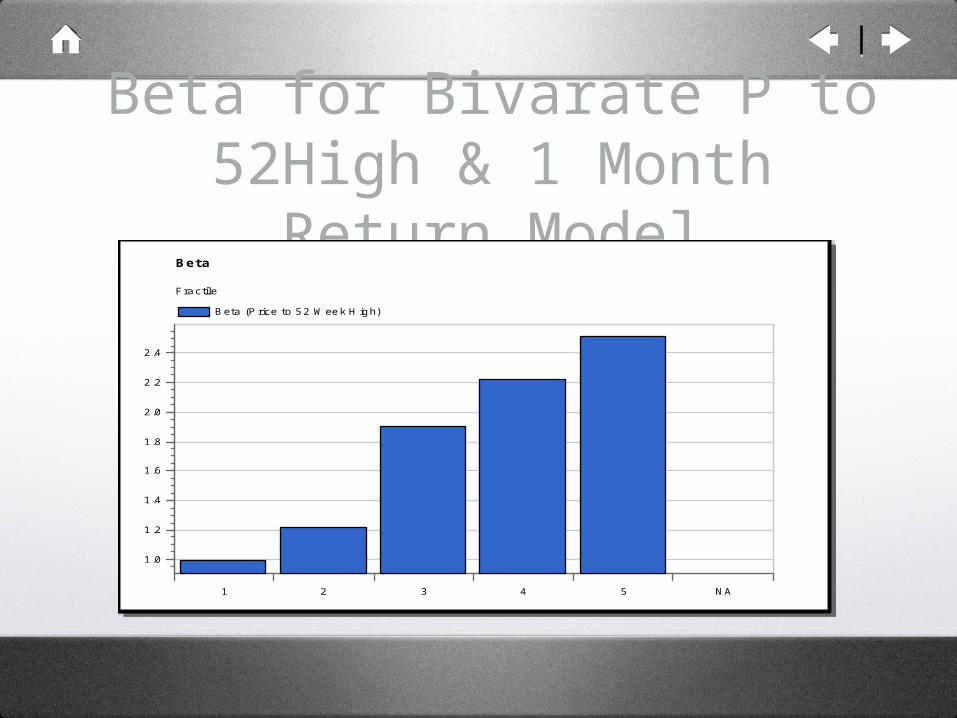
Beta for Bivarate P to 52High & 1 Month Return
Model
1 2 3 4 5 NA
1.0
1.2
1.4
1.6
1.8
2.0
2.2
2.4
Beta (Price to 52 Week High)
Beta
Fractile
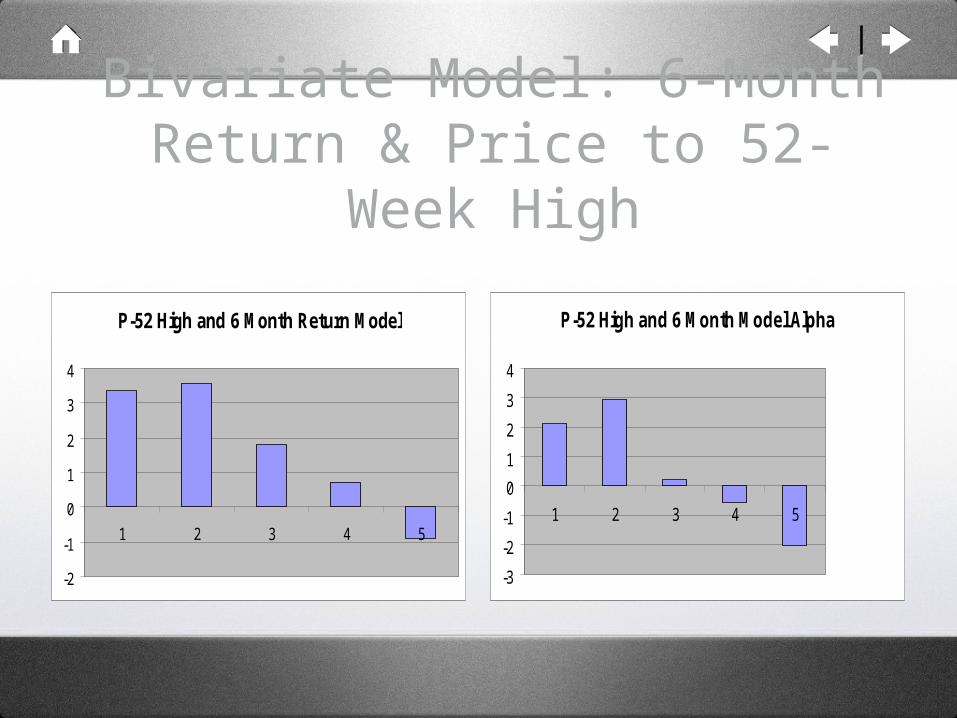
Bivariate Model: 6-Month Return & Price to 52-Week
High
P-52 High and 6 Month Return Model
-2
-1
0
1
2
3
4
1 2 3 4 5
P-52 High and 6 Month Model Alpha
-3
-2
-1
0
1
2
3
4
1 2 3 4 5

Multivariate Model
Multivariate Model Return Multivariate Model Alpha
Scoring We used scoring for bi-variate model (1-month
return and price to 52-week high)
For 1-month return:
• 1st quintile +5, 5th quintile -5
Price to 52-week high:
• 1st quintile +3, 5th quintile -3
More weight on 1-month return because single-factor model based on 1-month return is superior to that based on price to 52-week high.
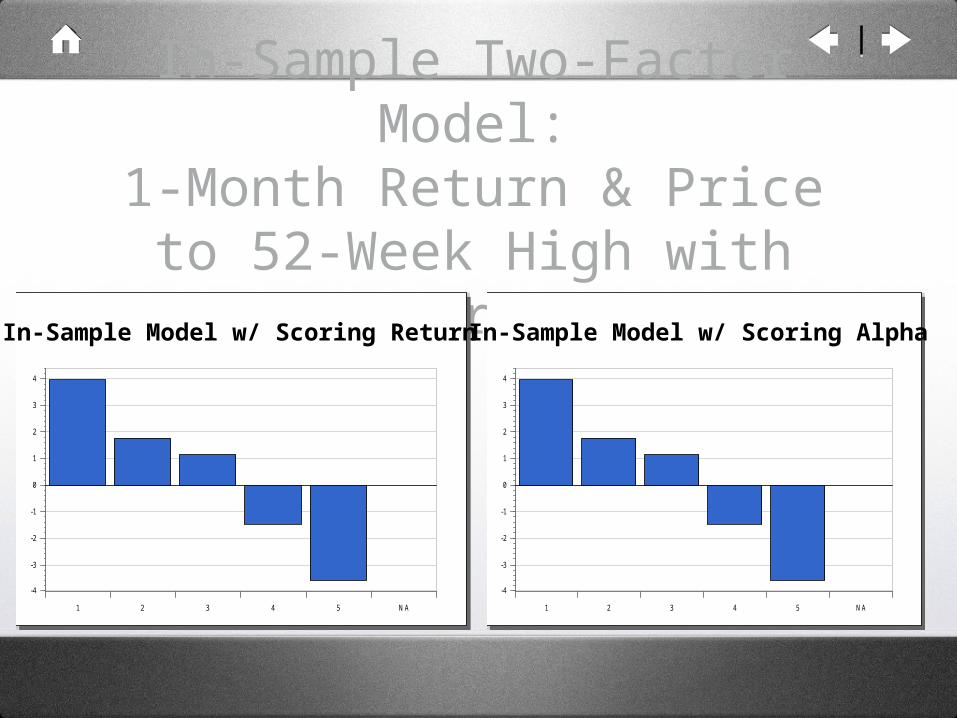
In-Sample Two-Factor Model:1-Month Return & Price to 52-Week High with Scoring
1 2 3 4 5 NA
-4
-3
-2
-1
0
1
2
3
4
Alpha (Total Quintile Score)
Alpha
Fractile
1 2 3 4 5 NA
-4
-3
-2
-1
0
1
2
3
4
Alpha (Total Quintile Score)
Alpha
FractileIn-Sample Model w/ Scoring Return In-Sample Model w/ Scoring Alpha

Beta for Bivarate 52-P and 1- Month Return Scoring
Model
1 2 3 4 5 NA
1.3
1.4
1.5
1.6
1.7
1.8
1.9
2.0
2.1
2.2
2.3
Beta (Total Quintile Score)
Beta
Fractile

Out-of-Sample Testing We used the period from January, 2005 to
December, 2005 for the out-of-sample testing of our best model (two-factor: 1-month return & current price to 52-week high).
Annualized Returns -
• Benchmark Return: 0.4%
• Our model without scoring: 11.79%
• Our model with scoring: 12.07%

Out-of-Sample Two-Factor Model: 1-Month Return & Price to 52-Week High w/o Scoring
1 2 3 4 5 NA
-3.0
-2.5
-2.0
-1.5
-1.0
-0.5
0.0
0.5
Alpha (Price to 52 Week High)
Alpha
FractileOut-of-Sample Model Return Out-of-Sample Model Alpha

Out-of-Sample Two-Factor Model Beta: 1-Month Return & Price to 52-Week High
without Scoring
1 2 3 4 5 NA
1.8
2.0
2.2
2.4
2.6
2.8
3.0
3.2
3.4
3.6
3.8Beta (Price to 52 Week High)
Beta
Fractile

Out-of-Sample Two-Factor Model: 1-Month Return &
Price to 52-Week High with Scoring
Out-of-Sample Model w/ Scoring Return Out-of-Sample Model w/ Scoring Alpha

Out-of-Sample Two-Factor Scoring Model Beta: 1-Month Return & P to 52-W High
with
1 2 3 4 5 NA
1.8
2.0
2.2
2.4
2.6
2.8
3.0
3.2
3.4
3.6
Beta (Total Quintile Score)
Beta
Fractile
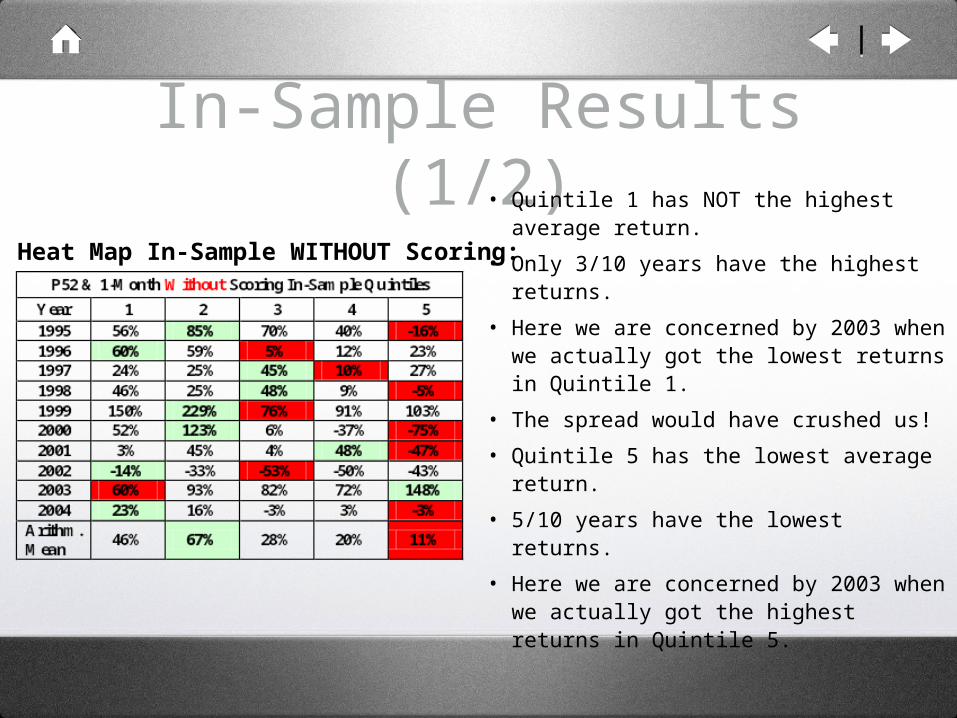
In-Sample Results (1/2)
Heat Map In-Sample WITHOUT Scoring:• Quintile 1 has NOT the highest average return.
• Only 3/10 years have the highest returns.
• Here we are concerned by 2003 when we actually got the lowest returns in Quintile 1.
• The spread would have crushed us!
• Quintile 5 has the lowest average return.
• 5/10 years have the lowest returns.
• Here we are concerned by 2003 when we actually got the highest returns in Quintile 5.

In-Sample Results (2/2)Heat Map In-Sample WITH Scoring:
The scoring screen alleviates our concerns:
• Fractile 1 has the highest average return.
• 8/10 years have the highest returns.
• The scoring eliminates the 2003 crush!
• Fractile 5 has the lowest average return.
• 10/10 years have the lowest returns.

Out-of-Sample Results (1/2)Heat Map Out of Sample WITHOUT Scoring:
• Quintile 1 has the highest average return.• Only 3/12 months have the highest returns.• Here we are concerned by these 2 months
where we actually got the lowest returns in
quintile 1.• Quintile 5 has the lowest average return.• 8/12 months have the lowest returns.• Here we are concerned by these 2 months
where we actually got the highest returns in
quintile 5.• The Long/Short spread is satisfactory: 36%
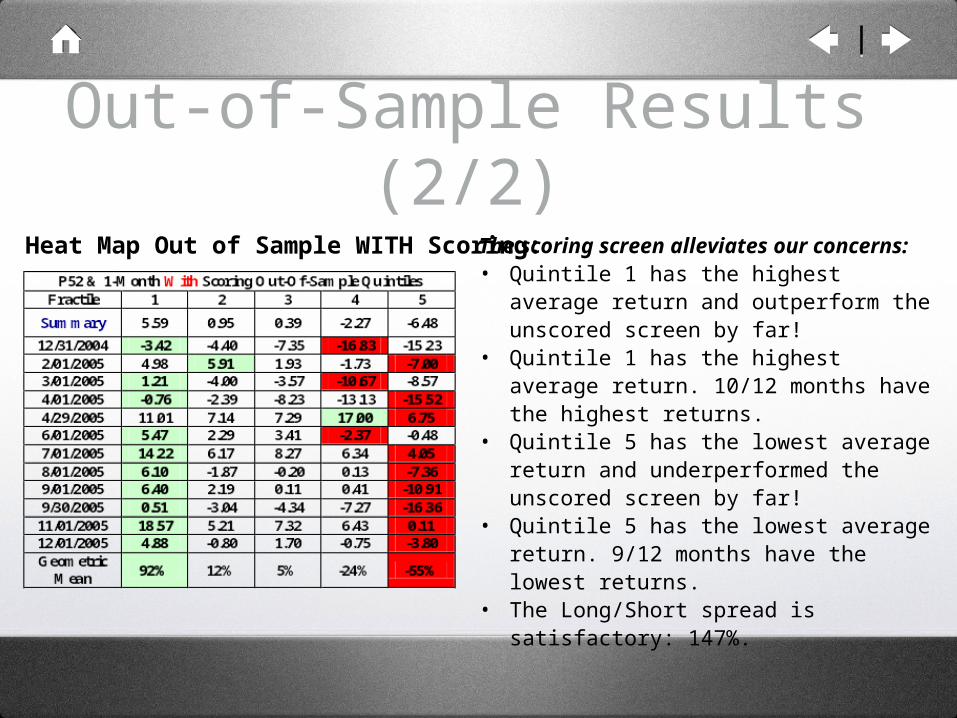
Out-of-Sample Results (2/2)
Heat Map Out of Sample WITH Scoring:
The scoring screen alleviates our concerns:• Quintile 1 has the highest average return
and outperform the unscored screen by far!• Quintile 1 has the highest average return.
10/12 months have the highest returns.• Quintile 5 has the lowest average return and
underperformed the unscored screen by far!• Quintile 5 has the lowest average return.
9/12 months have the lowest returns.• The Long/Short spread is satisfactory: 147%.

Long/Short DistributionsPositively Skewed After Scoring
Long/Short Returns DistributionP52-1Month In-Sample
0
5
10
15
20
25
30
35
-35% -30% -25% -20% -15% -10% -5% 0% 5% 10% 15% 20% 25% 30% 35% More
P52 - 1 Month P52 - 1 Month Scoring
Long/Short Returns DistributionP52-1Month Out-Of-Sample
0
1
2
3
4
5
-35% -30% -25% -20% -15% -10%
Returns RangeP52-1Month without scoring OOS P52-1Month with scoring OOS

Concerns Transaction Costs
Short Selling Constraints
Execution
Volatility/Exit Signals
Fact Set

Concerns
Monthly rebalancing
• Many months have >50% change in fractile components.
Large number of securities
• ~60 Stocks per fractile per month
Transaction Costs

Concerns
Dealing only with small cap securities.
May be limited opportunity to short sell some securities.
Short Selling Constraints

Concerns
How to execute as an actual trading strategy.
• When to run model?
• When do you make trades?
Execution

Concerns
Portfolios are not Beta neutral and overall betas are usually above 1.
No parameters set for liquidating portfolios.
• In sample we had several very bad months.
• Given the high volatility of small caps, there is the potential for very large losses.
Volatility and Exit Signals

Concerns
Limited knowledge of the tool.
Results seem almost too good.
In practice we would run tests to verify that what we believe is happening is actually happening.
Fact Set

LimitationsPrimary limitation is the fund size for which this is compatible.
• Relatively few securities
• Low market capitalizations
Solution: Change screen
• Wider market cap range
• Low trading volume requirement

SummaryWe find the results of our analysis to be very compelling.
The big challenge is efficient and proper execution.
Proper study of transaction costs is required.
We would also recommend a further review of the data before moving forward.


