51
Global Catholicism: Trends & Forecasts Center for Applied Research in the Apostolate (CARA) June 4, 2015
Global
Catholicism:
Trends &
Forecasts
Center for Applied Research in
the Apostolate (CARA)
June 4, 2015

CARA is a national, non-profit, Georgetown University affiliated research center that conducts social scientific studies about the Catholic Church. Founded in 1964, CARA has three major dimensions to its mission: to increase the Church's self-understanding, to serve the applied research needs of Church decision-makers, to advance scholarly research on religion, particularly Catholicism. CARA’s longstanding policy is to let research findings stand on their own and never take an advocacy position or go into areas outside its social science competence.
CARA Research Staff Thomas P. Gaunt, SJ, Ph.D., CARA Executive Director Mary L. Gautier, Ph.D., Editor, The CARA Report, Senior Research Associate Mark M. Gray, Ph.D., Director, CARA Catholic Polls (CCP), Senior Research Associate Jonathon C. Holland, M.A., Research Assistant Jonathon L. Wiggins, Ph.D.., Research Associate Other CARA Researchers Sr. Mary E. Bendyna, OP, Ph.D. Rev. Stephen Joseph Fichter, Ph.D Paul M. Perl, Ph.D. CARA Board of Directors Most Rev. Gerald F. Kicanas, D.D., Ph.D., Bishop of Tucson Most Rev. Gregory Aymond, D.D., Archbishop of New Orleans Sr. Janice Bader, CPPS, Executive Director, National Religious Retirement Office Rev. Allan F. Deck, S.J., Ph.D., Loyola Marymount University Susan Gibbs, President, Gibbs Media Works, LLC Chester Gillis, Ph.D., Dean of the College, Georgetown University Rev. Msgr. Ronald Jameson, Rector, St. Matthew Cathedral Veryl V. Miles, J.D., Dean, Columbus School of Law, The Catholic University of America Kathleen W. Murnion, M.B.A., President, Murnion & Associates, Inc. Joseph G. Sandman, Ph.D. John F. Wallerstedt, III, President, John F. Wallerstedt, LLC Philip J. Ward, J.D., Partner, Williams & Connolly Charles Zech, Ph.D., Director, Center for the Study of Church Management, Villanova University
©2015 Center for Applied Research in the Apostolate (CARA) at Georgetown University. Earth image from space courtesy of the National Aeronautics and Space Administration (https://www.flickr.com/photos/nasamarshall/). For information contact: Center for Applied Research in the Apostolate, 2300 Wisconsin Ave, NW, Suite 400A, Washington, D.C. 20007, telephone: 202-687-8080, facsimile: 202-687-8083, email: [email protected], website: cara.georgetown.edu

1
Methodology CARA transcribed Vatican data from the Annuarium Statisticum Ecclesiae (ASE) for 1980, 1990, 2000, 2010, and the most recent year available, 2012. Additionally, CARA referenced statistics in the Vatican’s Annuario Pontifico (AP) when necessary. Where possible, CARA also provides projections for data into the future using statistical forecasting.1 CARA also references data from publicly available surveys including: The World Values Survey, The Comparative Study of Electoral Systems, The International Social Survey Programme, the regional “barometer series” (e.g., Eurobarometer, Latinobarometer), as well as recent research from the Pew Research Center on Global Christianity.
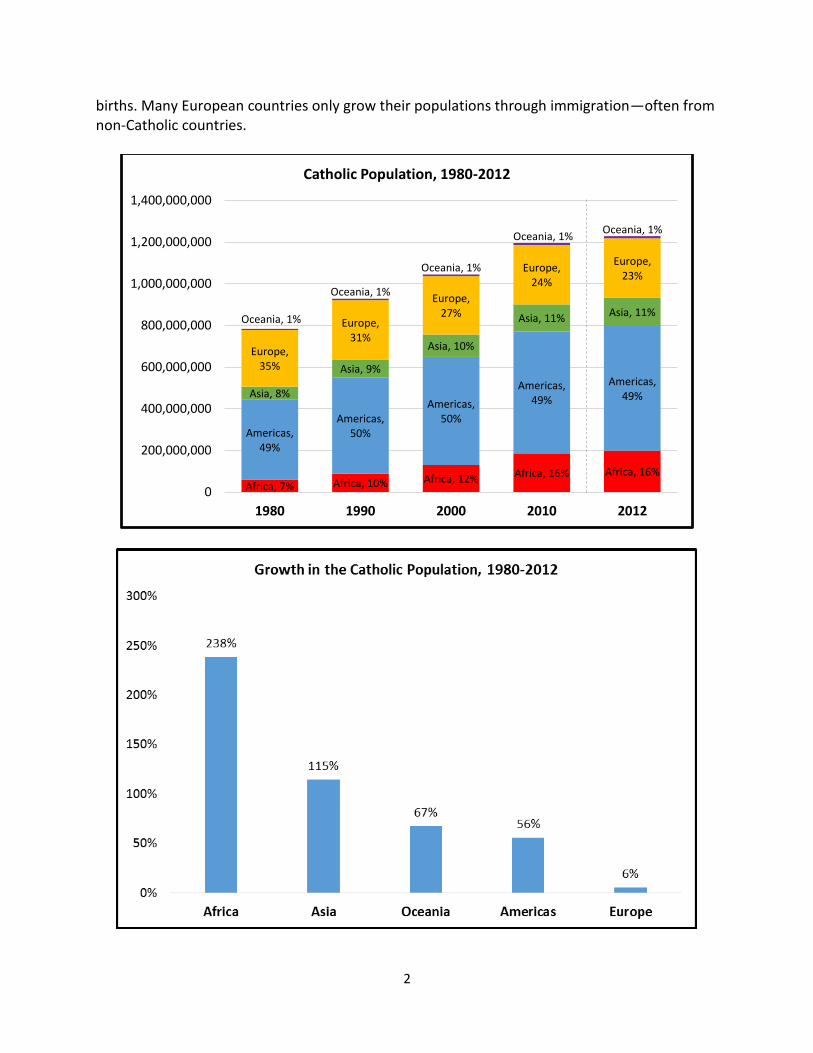
Global Overview This first section of the report presents a global overview of trends in the Catholic Church. Although the world is rapidly evolving in a digital age, it is still the case that Catholicism, more often than not, takes place in brick and mortar. The sacramental focus of Catholicism—especially the regular reception of the Eucharist—means that much of the faith “happens” among Catholics in parishes with priests. One cannot go to confession online or be married at the beach. Arguably, the three most important indicators of “vitality” for the Catholic Church are the number of Catholics, the number of parishes, and the number of priests. Catholic Population Overall, the global Catholic population has grown by 57 percent since 1980. However, this growth differs by region, with Europe’s Catholic population growing by just 6 percent while the number of Catholics in Africa grew by 238 percent. Differences between these two regions are largely attributable to differences in fertility rates over time.
Catholic Population
1980 1990 2000 2010 2012
Africa 58,676,000 88,899,000 130,018,000 185,620,000 198,587,000
Americas 384,816,000 461,264,000 519,391,000 585,998,000 598,819,000
Asia 62,713,000 86,012,000 107,302,000 129,661,000 134,641,000
Europe 271,649,000 285,294,000 280,144,000 284,924,000 286,868,000
Oceania 5,806,000 7,031,000 8,202,000 9,468,000 9,706,000
World 783,660,000 928,500,000 1,045,057,000 1,195,671,000 1,228,621,000
In 1980, the European total fertility rate (TFR or average births per woman over her lifetime) was 2.16. This is just above the replacement rate of 2.1 where two parents are replacing themselves in the population accounting for infant and maternal mortality. By 2012, the European TFR had dropped well below replacement rates to 1.72. In many countries, such as Germany and Italy, the number of deaths in a given year are greater than the number of
1 Various methods are employed including the simplest “if current trends continue” utilizing regressions or averages as well as population projections provided by the United Nations and the U.S. Census Bureau’s International Data Base (IDB).
2
births. Many European countries only grow their populations through immigration—often from non-Catholic countries.
Africa, 7% Africa, 10% Africa, 12% Africa, 16% Africa, 16%
Americas, 49%
Americas, 50%
Americas, 50%
Americas, 49%
Americas, 49%Asia, 8%
Asia, 9%
Asia, 10%
Asia, 11% Asia, 11%
Europe, 35%
Europe, 31%
Europe, 27%
Europe, 24%
Europe, 23%
Oceania, 1%
Oceania, 1%
Oceania, 1%
Oceania, 1%Oceania, 1%
0
200,000,000
400,000,000
600,000,000
800,000,000
1,000,000,000
1,200,000,000
1,400,000,000
1980 1990 2000 2010 2012
Catholic Population, 1980-2012

3
By comparison, in Sub-Saharan Africa the TFR in 1980 was 6.76. Here too, as nearly everywhere else in recent decades, fertility rates have declined. The most recent estimate in 2012 for Sub-Saharan Africa was a TFR of 5.15—still well above replacement. Thus, strong growth in the number of Catholics in Africa relative to in Europe is more a phenomenon of differential fertility than immigration or evangelization.
Latin America and the Caribbean have historically also had higher levels of fertility than
Europe and North America, leading to strong growth in the number of Catholics in this region. In 1980 the TFR for Latin America and the Caribbean was 4.2. By 2012, this had declined to 2.18—where Europe was in 1980. Population growth in Latin America and the Caribbean will also soon stall as its TFR will likely fall below the replacement rate in the coming decades.
Over the last 50 years the proportion of the global population who are Catholic has remained remarkably steady at about 17.5 percent. Most demographers anticipate a global population exceeding 10 billion by 2100, up from 7.3 billion now. The “engine” of population growth is no longer increasing numbers of children—it is extending life expectancies. The U.S. Census Bureau expects the global senior population (ages 65 and older) to increase from about 617,097,000 now to 1,565,844,000 in 2050. That is growth of 154 percent in just 35 years. The annual number of births worldwide is actually expected to decline during this period by 2 percent, numbering just over 130,000,000 each year. In 2000, the world reached an important milestone: “peak childhood.” From then to now and into the future we can expect there to be about 1.9 billion children (under age 15) around the world at any time. Some demographers do not expect that the global population will ever reach 10 billion. As Joseph Chamie, former director of the United Nations Population Division, has indicated, “The demographic patterns observed throughout Europe, East Asia and numerous other places during the past half century as well as the continuing decline in birth rates in other nations strongly points to one conclusion: The downward global trend in fertility may likely converge to below-replacement levels during this century. The implications of such a change in the assumptions regarding future fertility, affecting as it will consumption of food and energy, would be far reaching for climate change, biodiversity, the environment, water supplies and international migration. Most notably, the world population could peak sooner and begin declining well below the 10 billion currently projected for the close of the 21st century.”2 If current trends continue, we can expect the global Catholic population to increase by about 372 million from 2015 to 2050. This would represent 29 percent growth during this period and result in the 2050 Catholic population numbering 1.64 billion.
2 Chamie, Joseph. “Global Population of 10 Billion by 2100? – Not So Fast” in Yale Global, 26 October 2011.

4
Parishes
Since 1980, the Church has had a net gain of more than 15,200 parishes representing 7 percent growth. However, with the population growing by 57 percent during this period there has been a lag in constructing the brick and mortar of the Church. In 1980 there were 3,759 Catholics per parish in the world. This figure now stands at 5,541 Catholics per parish.
Catholic Parishes
1980 1990 2000 2010 2012
Africa 7,162 8,967 11,022 14,401 15,217
Americas 46,351 51,543 54,682 57,683 57,769
Asia 11,854 16,734 20,543 23,675 24,169
Europe 138,828 136,178 129,565 122,881 122,159
Oceania 2,308 2,383 2,384 2,415 2,426
World 206,503 215,805 218,196 221,055 221,740
Underlying the aggregate numbers, there are significant changes within regions. In Asia and Africa, where the fastest growth in the Catholic population has occurred, the number of parishes had doubled since 1980. In the Americas, the number of parishes has increased by 25 percent and in Oceania they have ticked up by 5 percent. In Europe, the number of parishes has declined by 12 percent with a net loss of 16,669 parishes since 1980.

5
The Church is currently undergoing a dramatic realignment due largely to these differential growth patterns. The parishes that served the Church for hundreds and hundreds of years are no longer closely aligned with the world’s Catholic population and certainly not its most
6
frequently Mass attending populations. However, there is no giant crane that can pick up a parish from Europe and relocate it to Africa. The process of realignment is slow given the autonomy of the Church’s diocesan and parish structures. Bishops and pastors do not always have the most current information globally on the changes in their population. Nor does closing parishes in one diocese present a “savings” to another diocese so that a new parish can be built. The Church does not function like a multinational corporation. To maintain the current ratio for Catholics per parish in 2050, the Church will need to increase its total number of global parishes by about 75,000 to approximately 300,000. Priests
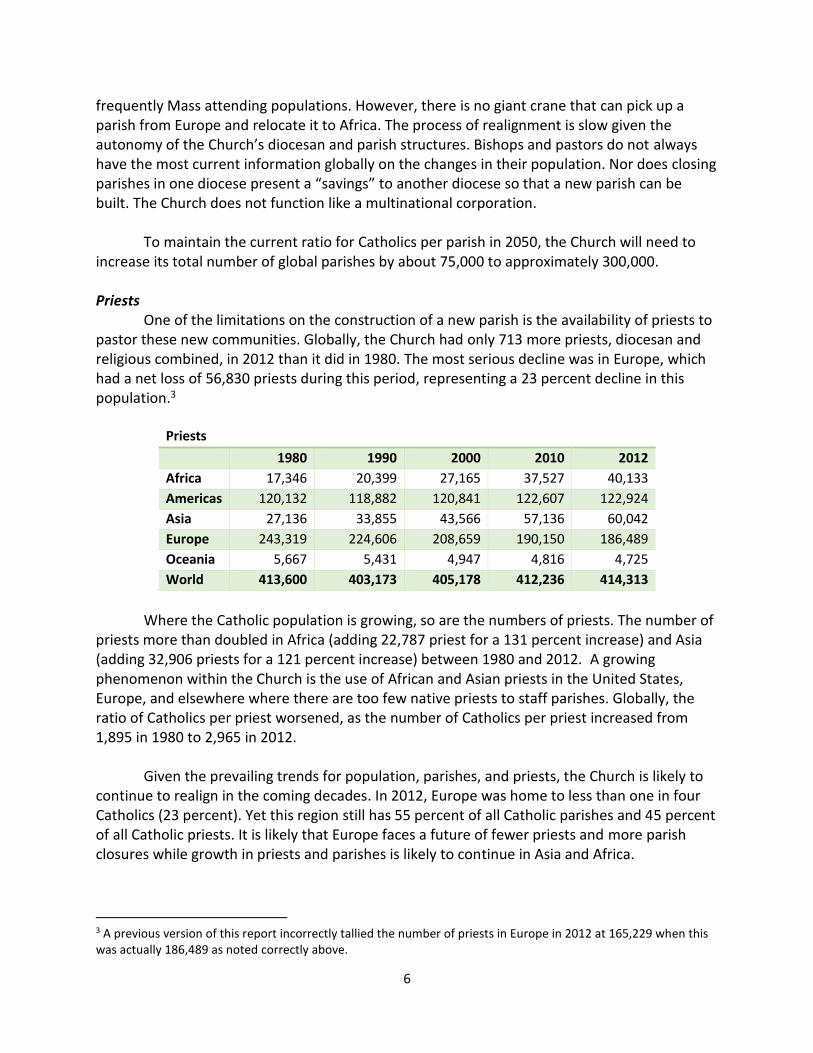
One of the limitations on the construction of a new parish is the availability of priests to pastor these new communities. Globally, the Church had only 713 more priests, diocesan and religious combined, in 2012 than it did in 1980. The most serious decline was in Europe, which had a net loss of 56,830 priests during this period, representing a 23 percent decline in this population.3
Priests
1980 1990 2000 2010 2012
Africa 17,346 20,399 27,165 37,527 40,133
Americas 120,132 118,882 120,841 122,607 122,924
Asia 27,136 33,855 43,566 57,136 60,042
Europe 243,319 224,606 208,659 190,150 186,489
Oceania 5,667 5,431 4,947 4,816 4,725
World 413,600 403,173 405,178 412,236 414,313
Where the Catholic population is growing, so are the numbers of priests. The number of
priests more than doubled in Africa (adding 22,787 priest for a 131 percent increase) and Asia (adding 32,906 priests for a 121 percent increase) between 1980 and 2012. A growing phenomenon within the Church is the use of African and Asian priests in the United States, Europe, and elsewhere where there are too few native priests to staff parishes. Globally, the ratio of Catholics per priest worsened, as the number of Catholics per priest increased from 1,895 in 1980 to 2,965 in 2012. Given the prevailing trends for population, parishes, and priests, the Church is likely to continue to realign in the coming decades. In 2012, Europe was home to less than one in four Catholics (23 percent). Yet this region still has 55 percent of all Catholic parishes and 45 percent of all Catholic priests. It is likely that Europe faces a future of fewer priests and more parish closures while growth in priests and parishes is likely to continue in Asia and Africa.
3 A previous version of this report incorrectly tallied the number of priests in Europe in 2012 at 165,229 when this was actually 186,489 as noted correctly above.

7
8
Other Major Findings Some of the additional major findings from analysis of the ASE database include:
The Catholic population of Europe in 2050 is expected to be about 5 percent smaller than it is today, due to sub-replacement rate fertility and immigration adding few Catholics to the overall population. Even with fewer Catholics and relatively low levels of weekly Mass attendance, the Church in Europe will struggle in the future to provide access to Masses and sacraments in its many parishes given its rapidly declining population of priests. This will likely negatively impact levels of sacramental practice that have already been ebbing in recent years.
Diocesan bishops, priests, and deacons are increasing in number in the Americas as the number of religious priests, brothers, and sisters decline. The Catholic population of this region is expected to grow from 598.8 million now to 690.1 million in 2040. This region is in need of many new parishes, with the ratio of Catholics per parish currently exceeding 10,000. Sacramental practice in the Americas has been waning and some of this may be related to issues of access to nearby parishes with available priests.
The strongest growth in the Church—across almost every indicator—is occurring in Africa and Asia.
In Africa, high fertility rates and expanding life expectancies will dramatically increase the number of Catholics from 198.6 million now to 460.4 million in 2040. Although the number of priests, religious sisters, and parishes are expanding quickly here, these will undoubtedly lag behind population growth. More parishes are needed as weekly Mass attendance levels among African Catholics averages 70 percent. The numbers of baptisms and first communions in Africa are rising annually but numbers of confirmations and marriages have recently leveled off.
In Asia, the Catholic population is expected to grow from 134.6 million now to 192.6 million in 2040. Here, a slight majority of Catholics, on average, report attending Mass every week and there is no evidence of decline in Mass attendance rates in recent years. There is strong growth in Asia in the numbers of religious priests, brothers, and sisters, as well as diocesan priests. New parishes are also increasing in number. Unlike most other regions, the Church in Asia has experienced growing numbers of marriages in the Church. In 1980 there were about 381,700 marriages celebrated in Asian parishes. In 2012, 626,380 marriages were celebrated here.
Trends in the Church in Oceania tend to fall between those of Europe and the Americas. Relative stability is expected here in the coming decades.

9
Regional Analyses This section of the report presents profiles of the Church based on Vatican statistics within five regions: Europe, The Americas, Africa, Asia, and Oceania. Europe
As previously noted in the global overview, the numbers of parishes and priests in Europe are declining as the number of Catholics in this region continues to grow slowly. Between 2014 and 2050 the total population of Europe is expected to decline by 5 percent, losing 36 million. This loss is primarily due to low fertility rates. The Catholic share of this population is expected to decline as well, with immigration reducing the share of the population affiliating with the faith and secularizing trends creating more “Nones” (those who are unaffiliated with any religion) in the population.
Europe: Catholics, Population, and Parishes
1980 1990 2000 2010 2012
Parishes 138,828 136,178 129,565 122,881 122,159
Catholic population 271,649,000 285,294,000 280,144,000 284,924,000 286,868,000
Total population 680,490,000 713,908,000 702,661,000 713,397,000 718,706,000
% Catholic 40% 40% 40% 40% 40%
Catholics per parish 1,957 2,095 2,162 2,319 2,348
10
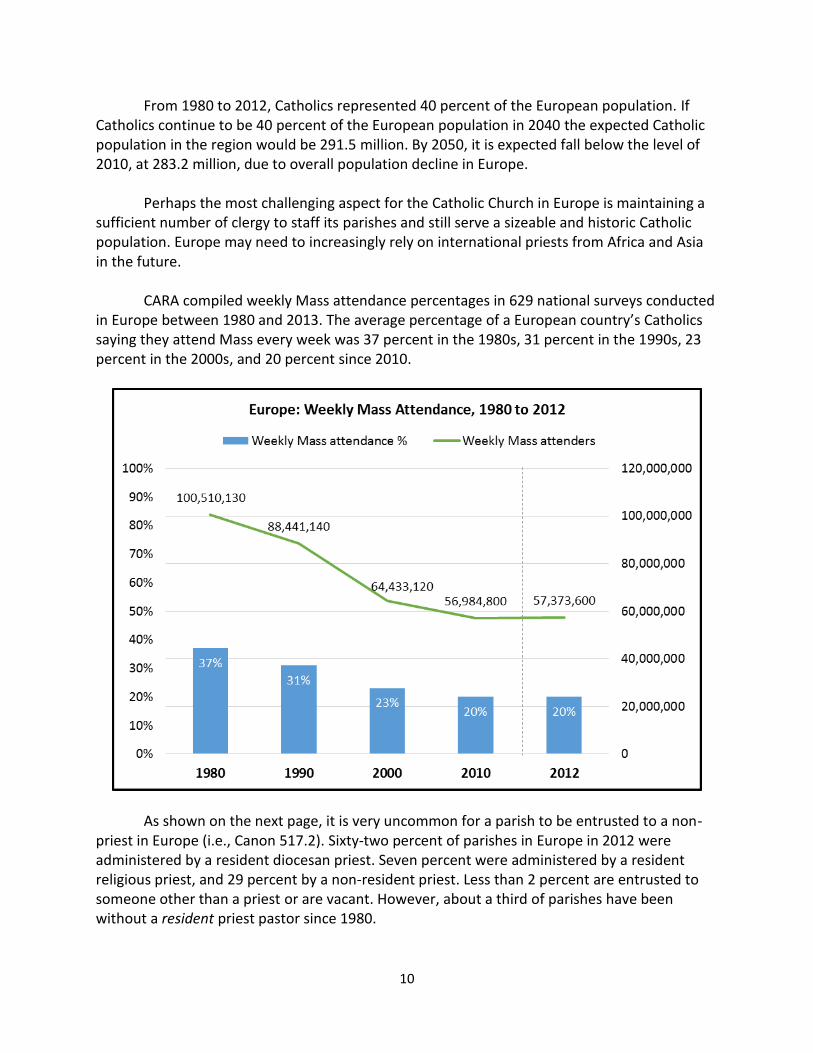
From 1980 to 2012, Catholics represented 40 percent of the European population. If Catholics continue to be 40 percent of the European population in 2040 the expected Catholic population in the region would be 291.5 million. By 2050, it is expected fall below the level of 2010, at 283.2 million, due to overall population decline in Europe. Perhaps the most challenging aspect for the Catholic Church in Europe is maintaining a sufficient number of clergy to staff its parishes and still serve a sizeable and historic Catholic population. Europe may need to increasingly rely on international priests from Africa and Asia in the future. CARA compiled weekly Mass attendance percentages in 629 national surveys conducted in Europe between 1980 and 2013. The average percentage of a European country’s Catholics saying they attend Mass every week was 37 percent in the 1980s, 31 percent in the 1990s, 23 percent in the 2000s, and 20 percent since 2010.
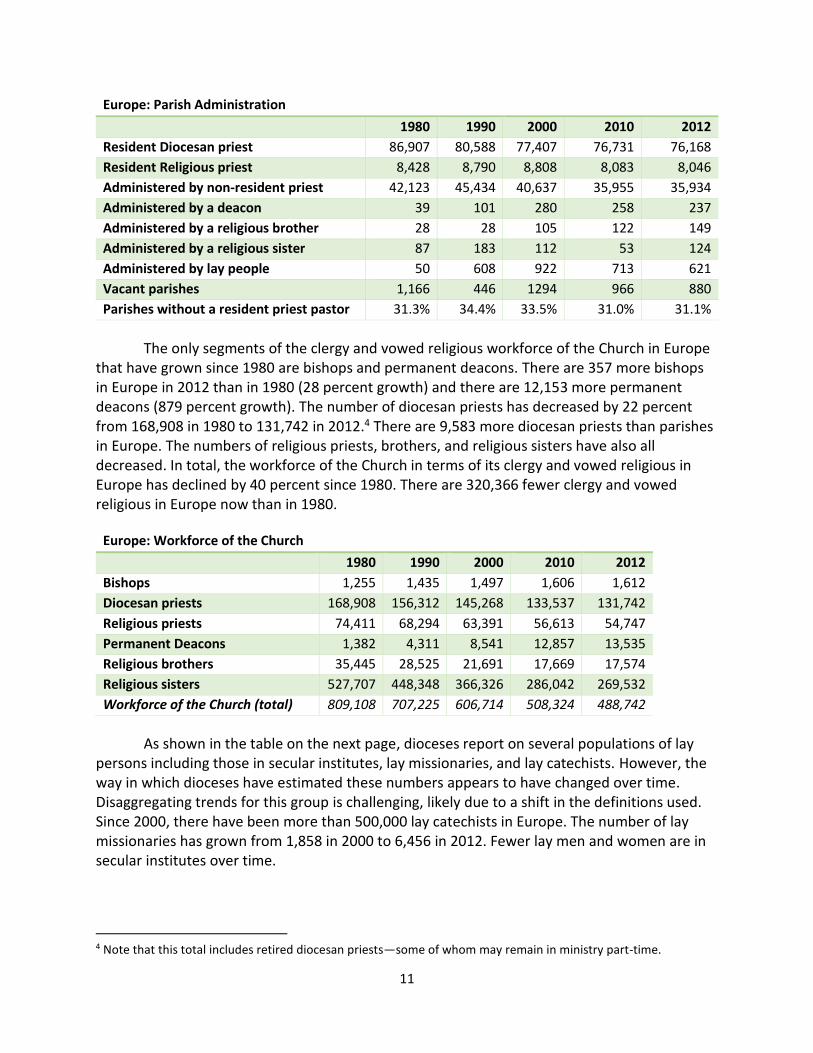
As shown on the next page, it is very uncommon for a parish to be entrusted to a non-priest in Europe (i.e., Canon 517.2). Sixty-two percent of parishes in Europe in 2012 were administered by a resident diocesan priest. Seven percent were administered by a resident religious priest, and 29 percent by a non-resident priest. Less than 2 percent are entrusted to someone other than a priest or are vacant. However, about a third of parishes have been without a resident priest pastor since 1980.
11
Europe: Parish Administration
1980 1990 2000 2010 2012
Resident Diocesan priest 86,907 80,588 77,407 76,731 76,168
Resident Religious priest 8,428 8,790 8,808 8,083 8,046
Administered by non-resident priest 42,123 45,434 40,637 35,955 35,934
Administered by a deacon 39 101 280 258 237
Administered by a religious brother 28 28 105 122 149
Administered by a religious sister 87 183 112 53 124
Administered by lay people 50 608 922 713 621
Vacant parishes 1,166 446 1294 966 880
Parishes without a resident priest pastor 31.3% 34.4% 33.5% 31.0% 31.1%
The only segments of the clergy and vowed religious workforce of the Church in Europe that have grown since 1980 are bishops and permanent deacons. There are 357 more bishops in Europe in 2012 than in 1980 (28 percent growth) and there are 12,153 more permanent deacons (879 percent growth). The number of diocesan priests has decreased by 22 percent from 168,908 in 1980 to 131,742 in 2012.4 There are 9,583 more diocesan priests than parishes in Europe. The numbers of religious priests, brothers, and religious sisters have also all decreased. In total, the workforce of the Church in terms of its clergy and vowed religious in Europe has declined by 40 percent since 1980. There are 320,366 fewer clergy and vowed religious in Europe now than in 1980.
Europe: Workforce of the Church
1980 1990 2000 2010 2012
Bishops 1,255 1,435 1,497 1,606 1,612
Diocesan priests 168,908 156,312 145,268 133,537 131,742
Religious priests 74,411 68,294 63,391 56,613 54,747
Permanent Deacons 1,382 4,311 8,541 12,857 13,535
Religious brothers 35,445 28,525 21,691 17,669 17,574
Religious sisters 527,707 448,348 366,326 286,042 269,532
Workforce of the Church (total) 809,108 707,225 606,714 508,324 488,742
As shown in the table on the next page, dioceses report on several populations of lay persons including those in secular institutes, lay missionaries, and lay catechists. However, the way in which dioceses have estimated these numbers appears to have changed over time. Disaggregating trends for this group is challenging, likely due to a shift in the definitions used. Since 2000, there have been more than 500,000 lay catechists in Europe. The number of lay missionaries has grown from 1,858 in 2000 to 6,456 in 2012. Fewer lay men and women are in secular institutes over time.
4 Note that this total includes retired diocesan priests—some of whom may remain in ministry part-time.

12
Europe: Laity in Ministry
1980 1990 2000 2010 2012
Lay males in secular institutes no data 438 421 377 367
Lay women in secular institutes no data 24,834 22,540 17,560 15,993
Lay missionaries no data 0 1,857 6,334 6,456
Catechists (lay persons) 209 334 502,352 556,528 549,878
Relative to its number of parishes, Europe has just more than one diocesan priest per parish. Ratios of Catholics per diocesan priest are rising over time.
One of the reasons the Church in Europe has had a declining number of diocesan priests is that it consistently ordains too few men each year compared to the total it loses to mortality and defection. Although in a better situation now then in 1980, the Church in Europe would need to ordain about 1,500 more diocesan priests each year to have stability in this population moving forward.
Europe: Components of Change in the Number of Diocesan Priests
1980 1990 2000 2010 2012
Ordinations of diocesan priests 1,682 2,456 2,321 1,727 1,717
Deaths of diocesan priests 3,151 3,350 3,291 2,992 3,034
Defections of diocesan priests 471 186 209 258 222
Net change in diocesan priests -1940 -1080 -1179 -1523 -1,539
13
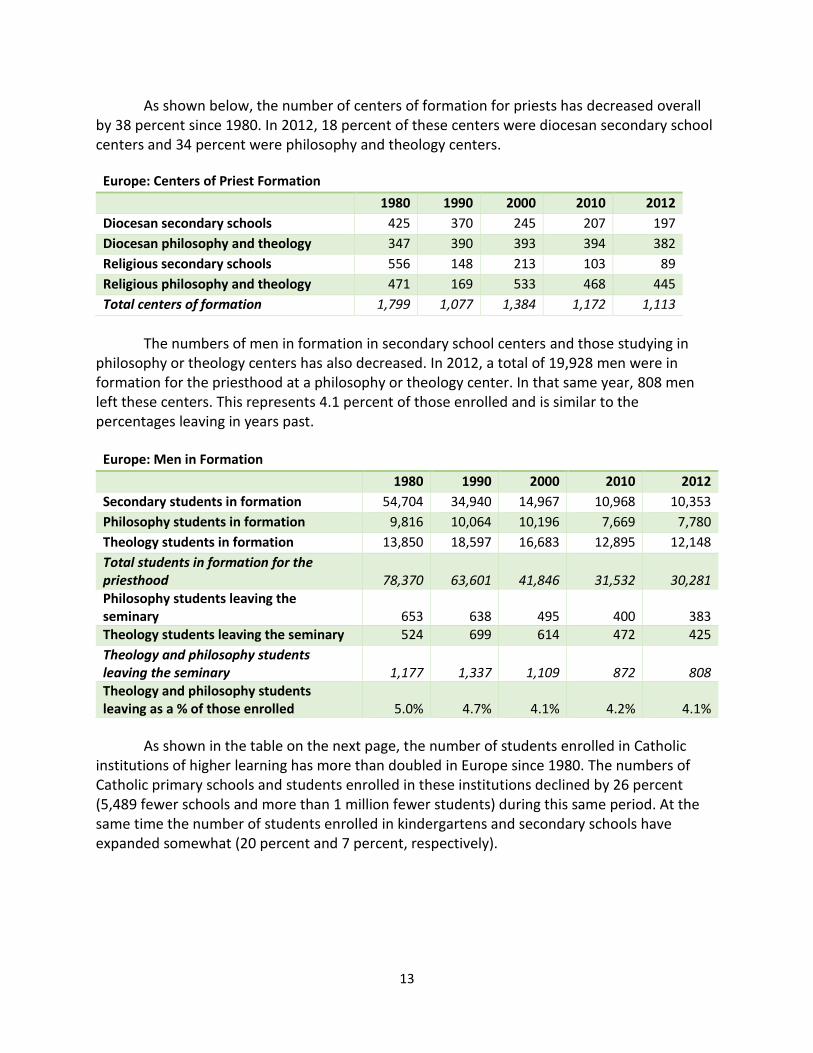
As shown below, the number of centers of formation for priests has decreased overall by 38 percent since 1980. In 2012, 18 percent of these centers were diocesan secondary school centers and 34 percent were philosophy and theology centers.
Europe: Centers of Priest Formation
1980 1990 2000 2010 2012
Diocesan secondary schools 425 370 245 207 197
Diocesan philosophy and theology 347 390 393 394 382
Religious secondary schools 556 148 213 103 89
Religious philosophy and theology 471 169 533 468 445
Total centers of formation 1,799 1,077 1,384 1,172 1,113
The numbers of men in formation in secondary school centers and those studying in philosophy or theology centers has also decreased. In 2012, a total of 19,928 men were in formation for the priesthood at a philosophy or theology center. In that same year, 808 men left these centers. This represents 4.1 percent of those enrolled and is similar to the percentages leaving in years past.
Europe: Men in Formation
1980 1990 2000 2010 2012
Secondary students in formation 54,704 34,940 14,967 10,968 10,353
Philosophy students in formation 9,816 10,064 10,196 7,669 7,780
Theology students in formation 13,850 18,597 16,683 12,895 12,148
Total students in formation for the priesthood
78,370
63,601
41,846
31,532
30,281
Philosophy students leaving the seminary
653
638
495
400
383
Theology students leaving the seminary 524 699 614 472 425
Theology and philosophy students leaving the seminary
1,177
1,337
1,109
872
808
Theology and philosophy students leaving as a % of those enrolled
5.0%
4.7%
4.1%
4.2%
4.1%
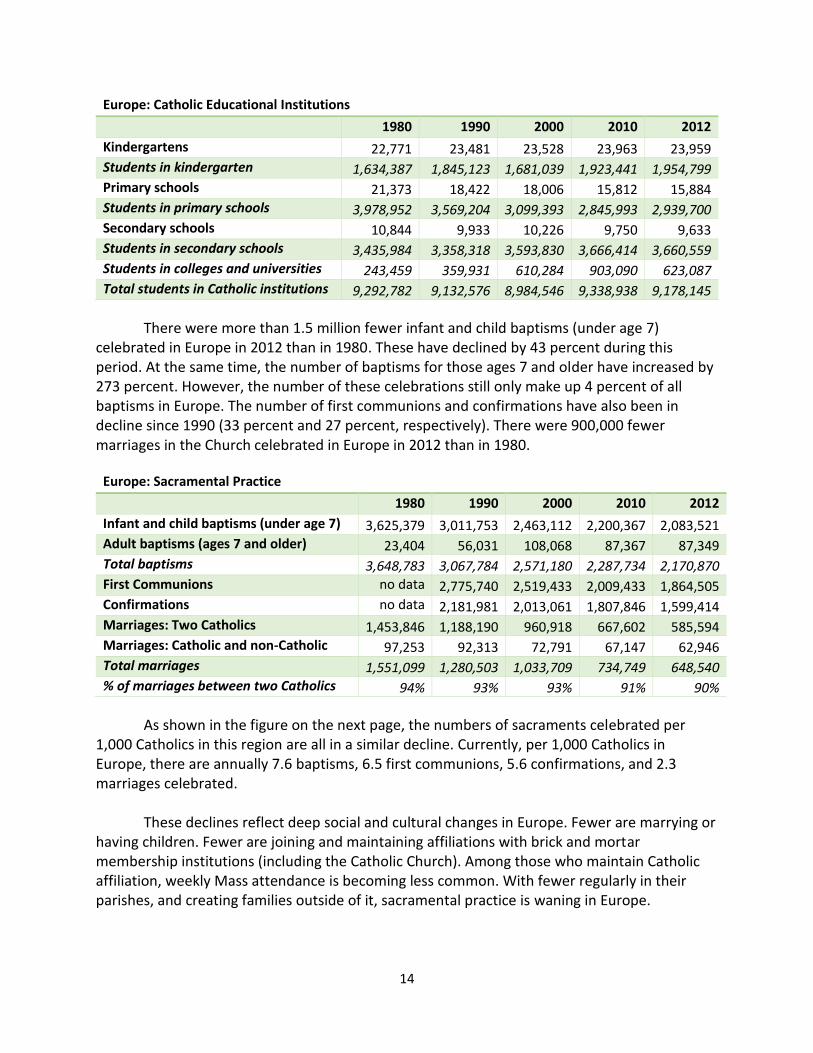
As shown in the table on the next page, the number of students enrolled in Catholic institutions of higher learning has more than doubled in Europe since 1980. The numbers of Catholic primary schools and students enrolled in these institutions declined by 26 percent (5,489 fewer schools and more than 1 million fewer students) during this same period. At the same time the number of students enrolled in kindergartens and secondary schools have expanded somewhat (20 percent and 7 percent, respectively).
14
Europe: Catholic Educational Institutions
1980 1990 2000 2010 2012
Kindergartens 22,771 23,481 23,528 23,963 23,959 Students in kindergarten 1,634,387 1,845,123 1,681,039 1,923,441 1,954,799 Primary schools 21,373 18,422 18,006 15,812 15,884 Students in primary schools 3,978,952 3,569,204 3,099,393 2,845,993 2,939,700 Secondary schools 10,844 9,933 10,226 9,750 9,633 Students in secondary schools 3,435,984 3,358,318 3,593,830 3,666,414 3,660,559 Students in colleges and universities 243,459 359,931 610,284 903,090 623,087 Total students in Catholic institutions 9,292,782 9,132,576 8,984,546 9,338,938 9,178,145
There were more than 1.5 million fewer infant and child baptisms (under age 7) celebrated in Europe in 2012 than in 1980. These have declined by 43 percent during this period. At the same time, the number of baptisms for those ages 7 and older have increased by 273 percent. However, the number of these celebrations still only make up 4 percent of all baptisms in Europe. The number of first communions and confirmations have also been in decline since 1990 (33 percent and 27 percent, respectively). There were 900,000 fewer marriages in the Church celebrated in Europe in 2012 than in 1980.
Europe: Sacramental Practice
1980 1990 2000 2010 2012
Infant and child baptisms (under age 7) 3,625,379 3,011,753 2,463,112 2,200,367 2,083,521 Adult baptisms (ages 7 and older) 23,404 56,031 108,068 87,367 87,349 Total baptisms 3,648,783 3,067,784 2,571,180 2,287,734 2,170,870 First Communions no data 2,775,740 2,519,433 2,009,433 1,864,505 Confirmations no data 2,181,981 2,013,061 1,807,846 1,599,414 Marriages: Two Catholics 1,453,846 1,188,190 960,918 667,602 585,594 Marriages: Catholic and non-Catholic 97,253 92,313 72,791 67,147 62,946 Total marriages 1,551,099 1,280,503 1,033,709 734,749 648,540 % of marriages between two Catholics 94% 93% 93% 91% 90%
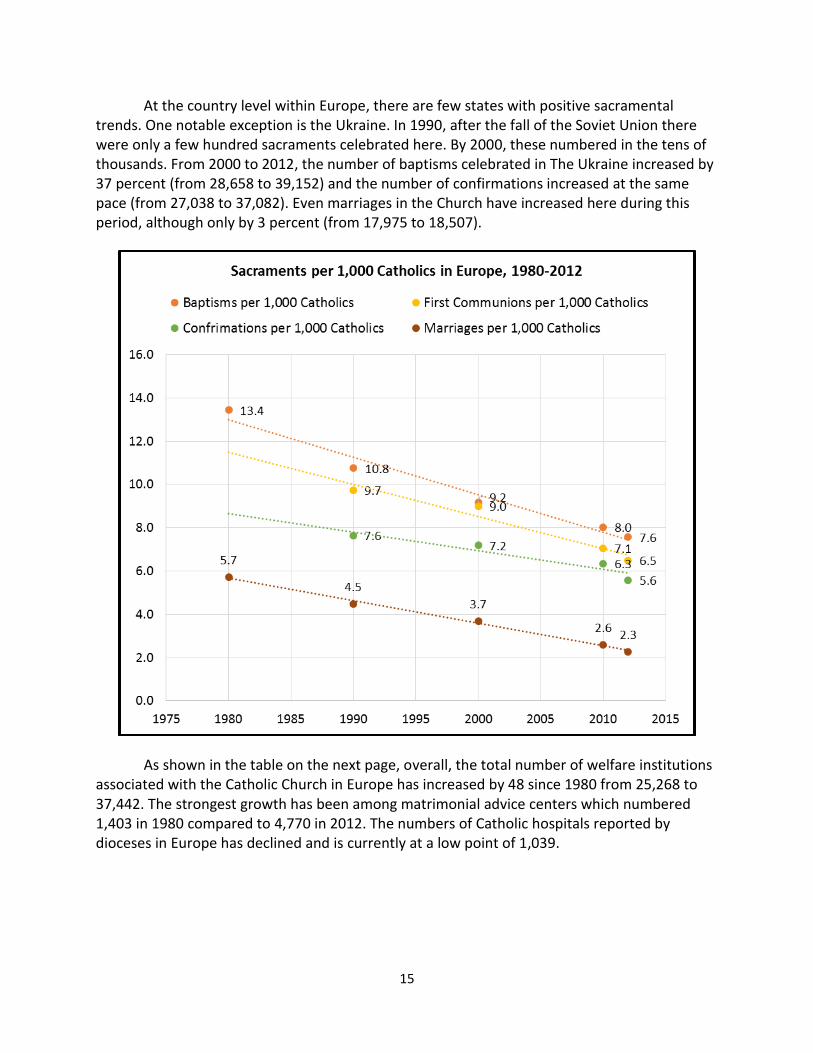
As shown in the figure on the next page, the numbers of sacraments celebrated per 1,000 Catholics in this region are all in a similar decline. Currently, per 1,000 Catholics in Europe, there are annually 7.6 baptisms, 6.5 first communions, 5.6 confirmations, and 2.3 marriages celebrated.
These declines reflect deep social and cultural changes in Europe. Fewer are marrying or
having children. Fewer are joining and maintaining affiliations with brick and mortar membership institutions (including the Catholic Church). Among those who maintain Catholic affiliation, weekly Mass attendance is becoming less common. With fewer regularly in their parishes, and creating families outside of it, sacramental practice is waning in Europe.
15
At the country level within Europe, there are few states with positive sacramental trends. One notable exception is the Ukraine. In 1990, after the fall of the Soviet Union there were only a few hundred sacraments celebrated here. By 2000, these numbered in the tens of thousands. From 2000 to 2012, the number of baptisms celebrated in The Ukraine increased by 37 percent (from 28,658 to 39,152) and the number of confirmations increased at the same pace (from 27,038 to 37,082). Even marriages in the Church have increased here during this period, although only by 3 percent (from 17,975 to 18,507).
As shown in the table on the next page, overall, the total number of welfare institutions associated with the Catholic Church in Europe has increased by 48 since 1980 from 25,268 to 37,442. The strongest growth has been among matrimonial advice centers which numbered 1,403 in 1980 compared to 4,770 in 2012. The numbers of Catholic hospitals reported by dioceses in Europe has declined and is currently at a low point of 1,039.

16
Europe: Welfare Institutions
1980 1990 2000 2010 2012
Hospitals 2,030 1,565 1,330 1,145 1,039
Dispensaries 2,418 2,564 2,893 2,643 2,637
Leprosaria 7 9 4 5 21
Homes for the old or disabled 6,485 6,812 7,679 8,021 8,200
Orphanages 2,709 2,257 2,411 2,078 2,194
Nurseries 2,561 1,643 1,939 2,458 2,285
Matrimonial advice centers 1,403 2,837 4,434 5,787 6,173
Centers for social education or re-education 964 1,963 8,514 11,720 1,141
Other institutions 6,691 11,301 1,604 3,159 13,752
Total welfare institutions 25,268 30,951 30,808 37,016 37,442

17
The Americas The Catholic population in the Americas grew by 56 percent from 1980 to 2012—
outpacing population growth in the region overall. There are 214 million more Catholics in the Americas now than in 1980. The Church has gained 11,418 Catholic parishes during this period. However, with 57,769 parishes overall in the region the number of Catholics per parish has grown to more than 10,000. In 1980 this figure stood at 8,300 Catholics per parish. The growth in parishes has lagged behind the growth in population (25 percent compared to 56 percent).
The Americas: Catholics, Population, and Parishes
1980 1990 2000 2010 2012
Parishes 46,351 51,543 54,682 57,683 57,769 Catholic population 384,816,000 461,264,000 519,391,000 585,998,000 598,819,000 Total population 616,807,000 723,648,000 826,554,000 927,021,000 946,971,000 % Catholic 62% 64% 63% 63% 63%
Catholics per parish 8,302 8,949 9,498 10,159 10,366
Catholics have consistently represented more than 60 percent of the population of the Americas. Population growth in the Americas is slowing as fertility rates fall. The total population is expected to grow by about 22 percent between now and 2040. If Catholics continue to be at least 60 percent of this population then the 2040 Catholic population in the region would be expected to number more than 690,500,000. If no new parishes were constructed there would be 11,953 Catholics per parish in the Americas in 2040.
18
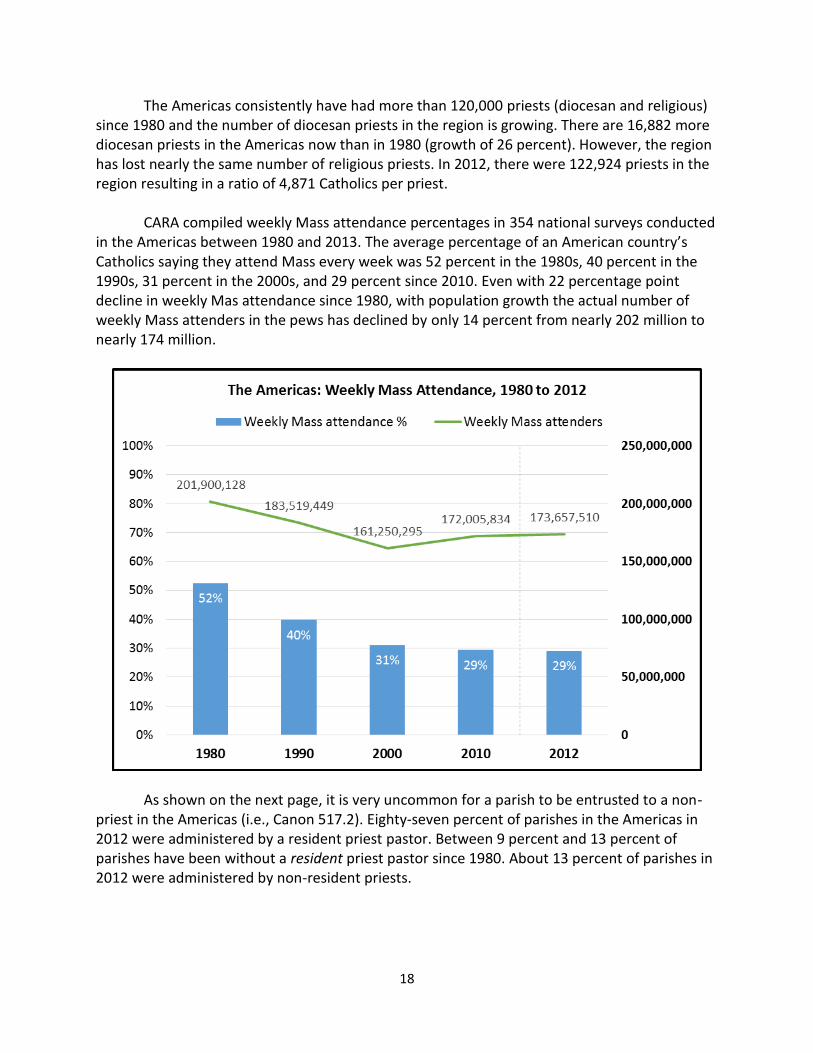
The Americas consistently have had more than 120,000 priests (diocesan and religious) since 1980 and the number of diocesan priests in the region is growing. There are 16,882 more diocesan priests in the Americas now than in 1980 (growth of 26 percent). However, the region has lost nearly the same number of religious priests. In 2012, there were 122,924 priests in the region resulting in a ratio of 4,871 Catholics per priest. CARA compiled weekly Mass attendance percentages in 354 national surveys conducted in the Americas between 1980 and 2013. The average percentage of an American country’s Catholics saying they attend Mass every week was 52 percent in the 1980s, 40 percent in the 1990s, 31 percent in the 2000s, and 29 percent since 2010. Even with 22 percentage point decline in weekly Mas attendance since 1980, with population growth the actual number of weekly Mass attenders in the pews has declined by only 14 percent from nearly 202 million to nearly 174 million.
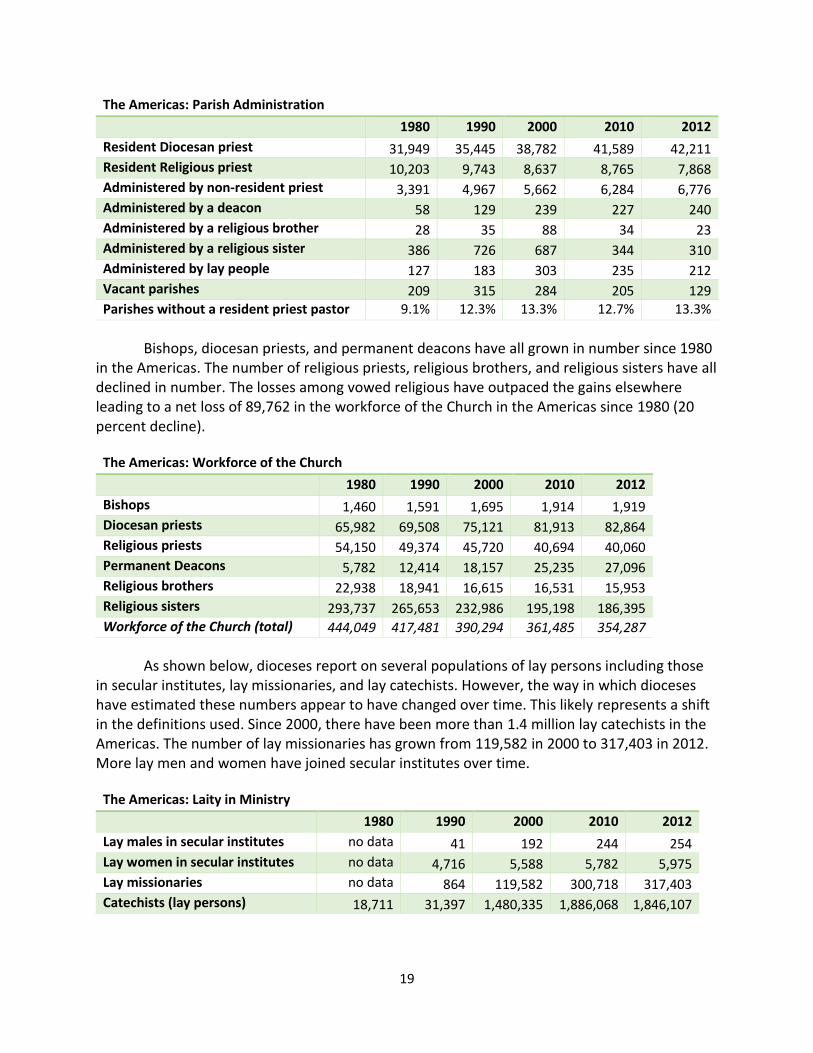
As shown on the next page, it is very uncommon for a parish to be entrusted to a non-priest in the Americas (i.e., Canon 517.2). Eighty-seven percent of parishes in the Americas in 2012 were administered by a resident priest pastor. Between 9 percent and 13 percent of parishes have been without a resident priest pastor since 1980. About 13 percent of parishes in 2012 were administered by non-resident priests.
19
The Americas: Parish Administration
1980 1990 2000 2010 2012
Resident Diocesan priest 31,949 35,445 38,782 41,589 42,211 Resident Religious priest 10,203 9,743 8,637 8,765 7,868 Administered by non-resident priest 3,391 4,967 5,662 6,284 6,776 Administered by a deacon 58 129 239 227 240 Administered by a religious brother 28 35 88 34 23 Administered by a religious sister 386 726 687 344 310 Administered by lay people 127 183 303 235 212 Vacant parishes 209 315 284 205 129 Parishes without a resident priest pastor 9.1% 12.3% 13.3% 12.7% 13.3%
Bishops, diocesan priests, and permanent deacons have all grown in number since 1980 in the Americas. The number of religious priests, religious brothers, and religious sisters have all declined in number. The losses among vowed religious have outpaced the gains elsewhere leading to a net loss of 89,762 in the workforce of the Church in the Americas since 1980 (20 percent decline).
The Americas: Workforce of the Church
1980 1990 2000 2010 2012
Bishops 1,460 1,591 1,695 1,914 1,919 Diocesan priests 65,982 69,508 75,121 81,913 82,864 Religious priests 54,150 49,374 45,720 40,694 40,060 Permanent Deacons 5,782 12,414 18,157 25,235 27,096 Religious brothers 22,938 18,941 16,615 16,531 15,953 Religious sisters 293,737 265,653 232,986 195,198 186,395 Workforce of the Church (total) 444,049 417,481 390,294 361,485 354,287
As shown below, dioceses report on several populations of lay persons including those in secular institutes, lay missionaries, and lay catechists. However, the way in which dioceses have estimated these numbers appear to have changed over time. This likely represents a shift in the definitions used. Since 2000, there have been more than 1.4 million lay catechists in the Americas. The number of lay missionaries has grown from 119,582 in 2000 to 317,403 in 2012. More lay men and women have joined secular institutes over time.
The Americas: Laity in Ministry
1980 1990 2000 2010 2012
Lay males in secular institutes no data 41 192 244 254 Lay women in secular institutes no data 4,716 5,588 5,782 5,975 Lay missionaries no data 864 119,582 300,718 317,403 Catechists (lay persons) 18,711 31,397 1,480,335 1,886,068 1,846,107

20
Relative to its number of parishes, American dioceses have sufficient numbers of diocesan priests—about three for every two parishes (1.4). Ratios of Catholics per diocesan priest are increasing slowly over time.
One of the reasons the Church in the Americas has had increasing numbers of diocesan priests over time is that it consistently ordains more men each year than it loses to mortality and defection. Currently the Church in the Americas adds more than 500 diocesan priests per year.
The Americas: Components of Change in the Number of Diocesan Priests
1980 1990 2000 2010 2012
Ordinations of diocesan priests 1,176 1,763 2,156 2,208 2,117 Deaths of diocesan priests 933 1,083 1,173 1,230 1,235 Defections of diocesan priests 319 282 264 325 311 Net change in diocesan priests -76 398 719 653 571
As shown in the table on the next page, the number of centers of formation for priests has numbered more than 2,000 since 1980 (currently there are 2,688). Numbers of religious secondary schools of formation are in decline with a loss of 34 centers since 1980. All other types of institutions have grown in number.

21
The Americas: Centers of Priest Formation
1980 1990 2000 2010 2012
Diocesan secondary schools 437 598 582 564 586 Diocesan philosophy and theology 341 538 594 643 646 Religious secondary schools 543 560 517 526 509 Religious philosophy and theology 679 927 881 975 947 Total centers of formation 2,000 2,623 2,574 2,708 2,688
The numbers of men in formation in secondary school centers have declined by 64 percent since 1980. In 2012, a total of 35,841 men were in formation for the priesthood at a philosophy or theology center. In that same year, 2,205 men left these centers. This represents 6.2 percent of those enrolled and is similar to the percentages leaving in years past.
The Americas: Men in Formation
1980 1990 2000 2010 2012
Secondary students in formation 38,324 25,044 20,884 14,021 13,965 Philosophy students in formation 11,612 15,792 19,558 18,795 18,804 Theology students in formation 11,088 15,257 16,834 17,676 17,037 Total students in formation for the priesthood
61,024
56,093
57,276
50,492
49,806
Philosophy students leaving the seminary 987 1,385 1,499 1,606 1,338 Theology students leaving the seminary 588 975 860 1,018 867 Theology and philosophy students leaving the seminary
1,575
2,360
2,359
2,624
2,205
Theology and philosophy students leaving as a % of those enrolled
6.9%
7.6%
6.5%
7.2%
6.2%
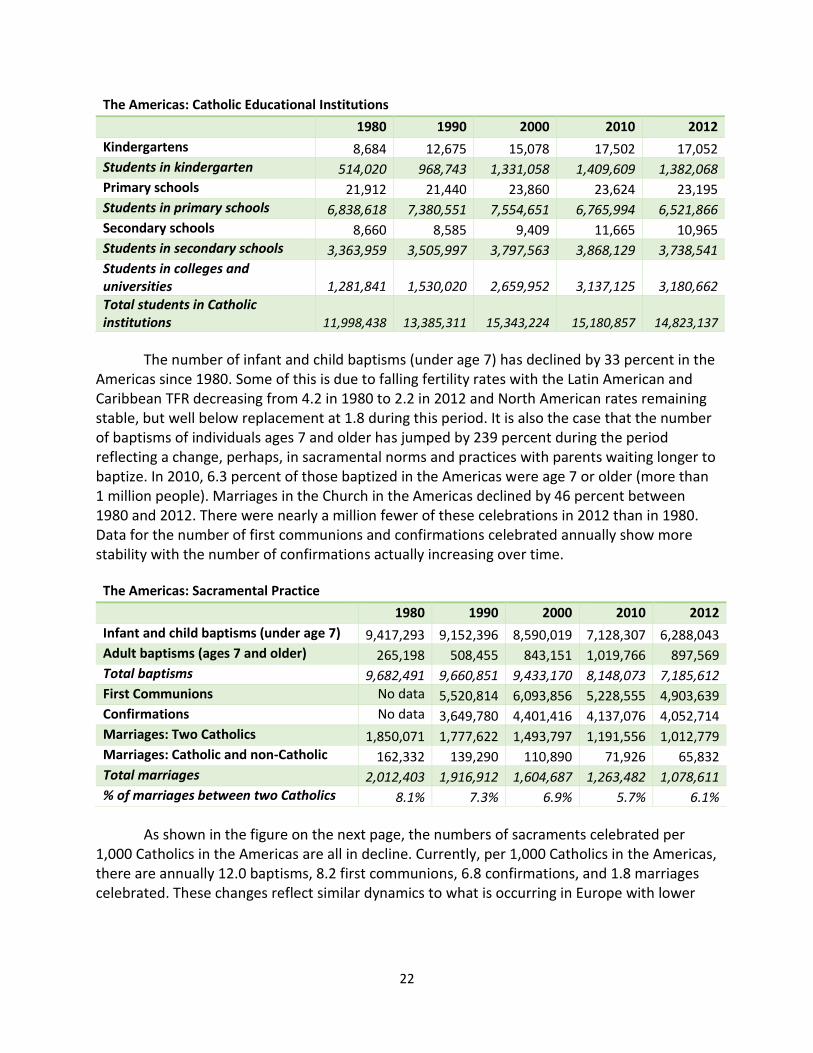
As shown in the table on the next page, the number of students enrolled in Catholic institutions of higher learning has more than doubled since 1980. The number of students enrolled in Catholic primary schools has declined by 5 percent (nearly 317,000 fewer students) during this same period. At the same time the numbers of students enrolled in kindergartens and secondary schools have increased. Overall, there are more than 14 million individuals in the Americas, 2.4 percent of the Catholic population in the region, enrolled in Catholic educational institutions.
22
The Americas: Catholic Educational Institutions
1980 1990 2000 2010 2012
Kindergartens 8,684 12,675 15,078 17,502 17,052 Students in kindergarten 514,020 968,743 1,331,058 1,409,609 1,382,068 Primary schools 21,912 21,440 23,860 23,624 23,195 Students in primary schools 6,838,618 7,380,551 7,554,651 6,765,994 6,521,866 Secondary schools 8,660 8,585 9,409 11,665 10,965 Students in secondary schools 3,363,959 3,505,997 3,797,563 3,868,129 3,738,541 Students in colleges and universities 1,281,841 1,530,020 2,659,952 3,137,125 3,180,662 Total students in Catholic institutions 11,998,438 13,385,311 15,343,224 15,180,857 14,823,137
The number of infant and child baptisms (under age 7) has declined by 33 percent in the Americas since 1980. Some of this is due to falling fertility rates with the Latin American and Caribbean TFR decreasing from 4.2 in 1980 to 2.2 in 2012 and North American rates remaining stable, but well below replacement at 1.8 during this period. It is also the case that the number of baptisms of individuals ages 7 and older has jumped by 239 percent during the period reflecting a change, perhaps, in sacramental norms and practices with parents waiting longer to baptize. In 2010, 6.3 percent of those baptized in the Americas were age 7 or older (more than 1 million people). Marriages in the Church in the Americas declined by 46 percent between 1980 and 2012. There were nearly a million fewer of these celebrations in 2012 than in 1980. Data for the number of first communions and confirmations celebrated annually show more stability with the number of confirmations actually increasing over time.
The Americas: Sacramental Practice
1980 1990 2000 2010 2012
Infant and child baptisms (under age 7) 9,417,293 9,152,396 8,590,019 7,128,307 6,288,043 Adult baptisms (ages 7 and older) 265,198 508,455 843,151 1,019,766 897,569 Total baptisms 9,682,491 9,660,851 9,433,170 8,148,073 7,185,612 First Communions No data 5,520,814 6,093,856 5,228,555 4,903,639 Confirmations No data 3,649,780 4,401,416 4,137,076 4,052,714 Marriages: Two Catholics 1,850,071 1,777,622 1,493,797 1,191,556 1,012,779 Marriages: Catholic and non-Catholic 162,332 139,290 110,890 71,926 65,832 Total marriages 2,012,403 1,916,912 1,604,687 1,263,482 1,078,611 % of marriages between two Catholics 8.1% 7.3% 6.9% 5.7% 6.1%
As shown in the figure on the next page, the numbers of sacraments celebrated per 1,000 Catholics in the Americas are all in decline. Currently, per 1,000 Catholics in the Americas, there are annually 12.0 baptisms, 8.2 first communions, 6.8 confirmations, and 1.8 marriages celebrated. These changes reflect similar dynamics to what is occurring in Europe with lower
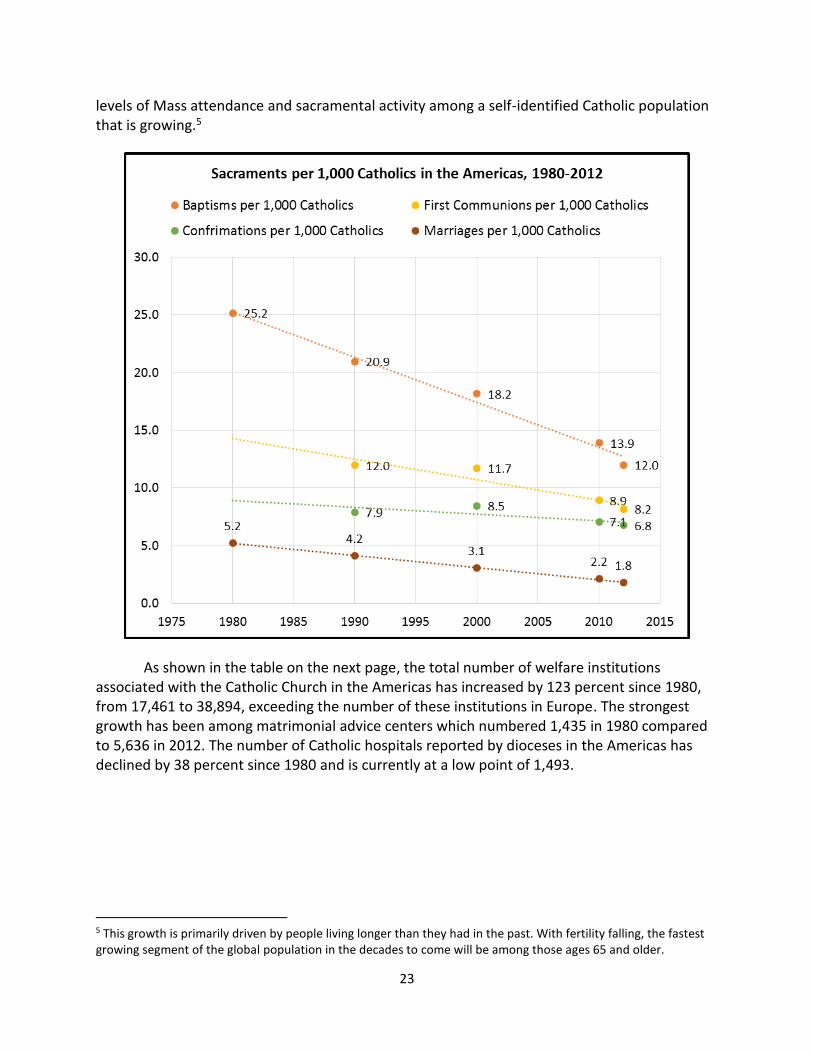
23
levels of Mass attendance and sacramental activity among a self-identified Catholic population that is growing.5
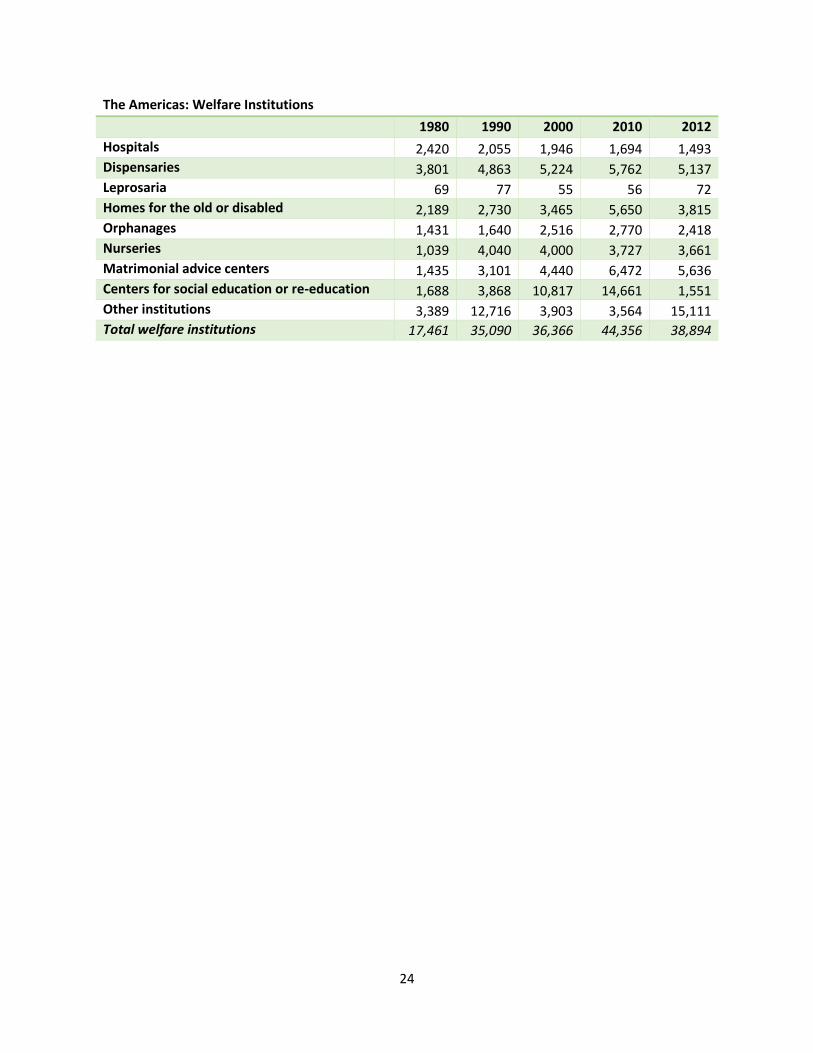
As shown in the table on the next page, the total number of welfare institutions associated with the Catholic Church in the Americas has increased by 123 percent since 1980, from 17,461 to 38,894, exceeding the number of these institutions in Europe. The strongest growth has been among matrimonial advice centers which numbered 1,435 in 1980 compared to 5,636 in 2012. The number of Catholic hospitals reported by dioceses in the Americas has declined by 38 percent since 1980 and is currently at a low point of 1,493.
5 This growth is primarily driven by people living longer than they had in the past. With fertility falling, the fastest growing segment of the global population in the decades to come will be among those ages 65 and older.
24
The Americas: Welfare Institutions
1980 1990 2000 2010 2012
Hospitals 2,420 2,055 1,946 1,694 1,493 Dispensaries 3,801 4,863 5,224 5,762 5,137 Leprosaria 69 77 55 56 72 Homes for the old or disabled 2,189 2,730 3,465 5,650 3,815 Orphanages 1,431 1,640 2,516 2,770 2,418 Nurseries 1,039 4,040 4,000 3,727 3,661 Matrimonial advice centers 1,435 3,101 4,440 6,472 5,636 Centers for social education or re-education 1,688 3,868 10,817 14,661 1,551 Other institutions 3,389 12,716 3,903 3,564 15,111 Total welfare institutions 17,461 35,090 36,366 44,356 38,894
25
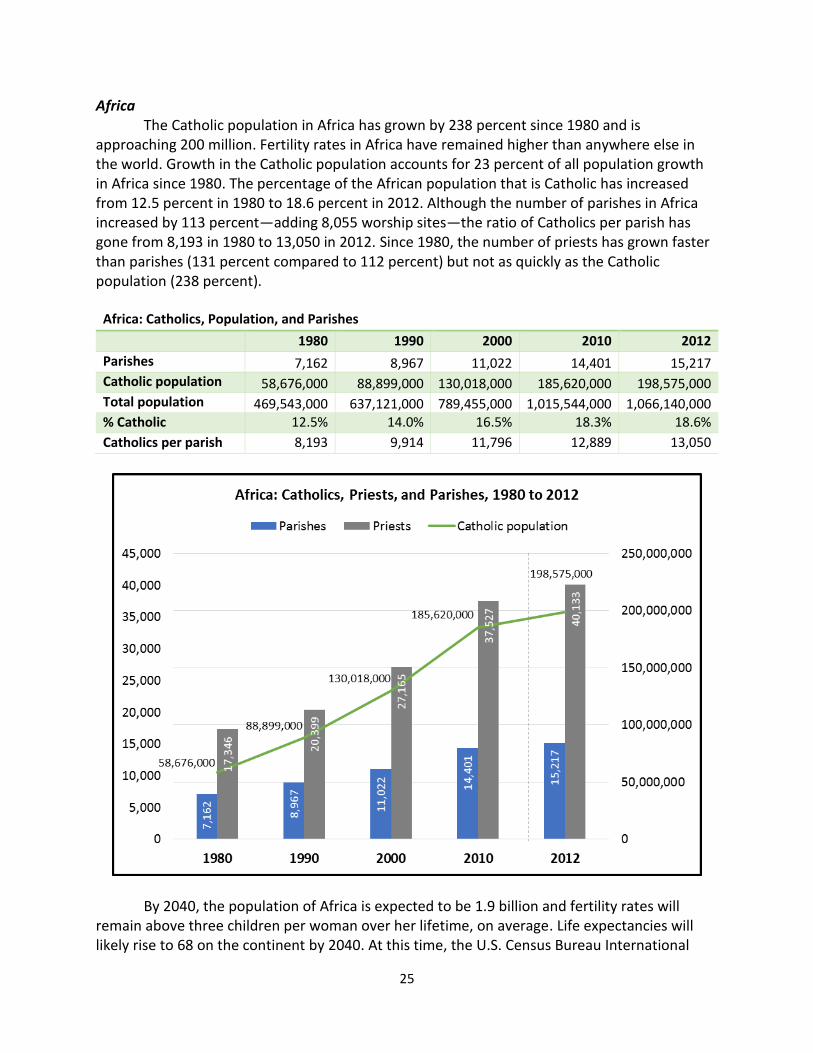
Africa The Catholic population in Africa has grown by 238 percent since 1980 and is
approaching 200 million. Fertility rates in Africa have remained higher than anywhere else in the world. Growth in the Catholic population accounts for 23 percent of all population growth in Africa since 1980. The percentage of the African population that is Catholic has increased from 12.5 percent in 1980 to 18.6 percent in 2012. Although the number of parishes in Africa increased by 113 percent—adding 8,055 worship sites—the ratio of Catholics per parish has gone from 8,193 in 1980 to 13,050 in 2012. Since 1980, the number of priests has grown faster than parishes (131 percent compared to 112 percent) but not as quickly as the Catholic population (238 percent).
Africa: Catholics, Population, and Parishes
1980 1990 2000 2010 2012
Parishes 7,162 8,967 11,022 14,401 15,217 Catholic population 58,676,000 88,899,000 130,018,000 185,620,000 198,575,000 Total population 469,543,000 637,121,000 789,455,000 1,015,544,000 1,066,140,000 % Catholic 12.5% 14.0% 16.5% 18.3% 18.6%
Catholics per parish 8,193 9,914 11,796 12,889 13,050
By 2040, the population of Africa is expected to be 1.9 billion and fertility rates will remain above three children per woman over her lifetime, on average. Life expectancies will likely rise to 68 on the continent by 2040. At this time, the U.S. Census Bureau International
26
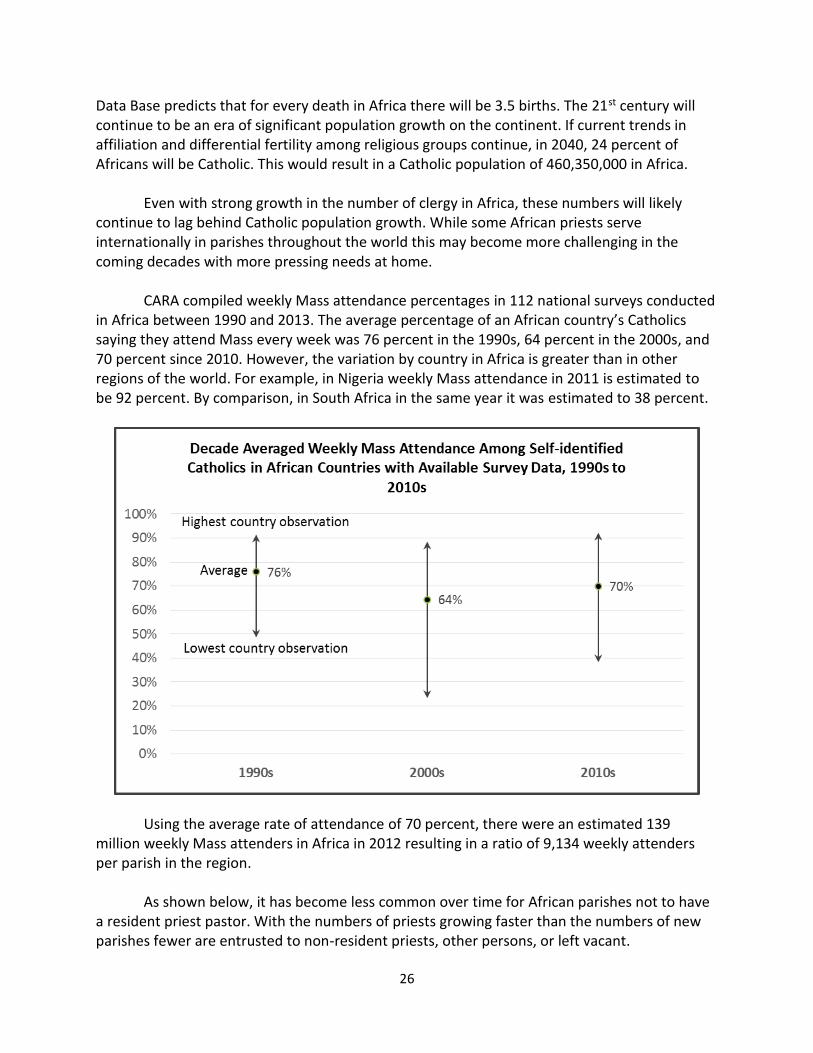
Data Base predicts that for every death in Africa there will be 3.5 births. The 21st century will continue to be an era of significant population growth on the continent. If current trends in affiliation and differential fertility among religious groups continue, in 2040, 24 percent of Africans will be Catholic. This would result in a Catholic population of 460,350,000 in Africa. Even with strong growth in the number of clergy in Africa, these numbers will likely continue to lag behind Catholic population growth. While some African priests serve internationally in parishes throughout the world this may become more challenging in the coming decades with more pressing needs at home. CARA compiled weekly Mass attendance percentages in 112 national surveys conducted in Africa between 1990 and 2013. The average percentage of an African country’s Catholics saying they attend Mass every week was 76 percent in the 1990s, 64 percent in the 2000s, and 70 percent since 2010. However, the variation by country in Africa is greater than in other regions of the world. For example, in Nigeria weekly Mass attendance in 2011 is estimated to be 92 percent. By comparison, in South Africa in the same year it was estimated to 38 percent.
Using the average rate of attendance of 70 percent, there were an estimated 139 million weekly Mass attenders in Africa in 2012 resulting in a ratio of 9,134 weekly attenders per parish in the region.
As shown below, it has become less common over time for African parishes not to have
a resident priest pastor. With the numbers of priests growing faster than the numbers of new parishes fewer are entrusted to non-resident priests, other persons, or left vacant.

27
Africa: Parish Administration
1980 1990 2000 2010 2012
Resident Diocesan priest 2,292 4,145 6,704 10,315 11,327 Resident Religious priest 3,841 3,395 2,848 2,910 2,989 Administered by non-resident priest 583 945 1,076 869 718 Administered by a deacon 11 21 25 22 21 Administered by a religious brother 7 15 4 44 5 Administered by a religious sister 43 82 38 21 28 Administered by lay people 201 236 218 196 107 Vacant parishes 184 128 109 24 22 Parishes without a resident priest pastor 14.4% 15.9% 13.3% 8.2% 5.9%
Every component of the vowed religious and clergy that make up the workforce of the
Church in Africa has been growing since 1980. The strongest growth is among diocesan priests where 21,441 clergy have been added for a growth rate of 354 percent. The number of deacons is up by 225 percent since 1980 and the overall workforce of the Church doubled between 1980 and 2012. In contrast to many other regions, there is growth here among religious institutes with women religious increasing by 33,004 (92.7 percent growth) and religious brothers by 3,281 (61.2 percent growth). Religious priests are growing the slowest at 11.9 percent. There are also now 252 more bishops in Africa than in 1980.
Africa: Workforce of the Church
1980 1990 2000 2010 2012
Bishops 448 494 601 697 700 Diocesan priests 6,052 10,287 16,962 25,434 27,493 Religious priests 11,294 10,112 10,203 12,093 12,640 Permanent Deacons 119 254 345 378 387 Religious brothers 5,364 5,963 7,256 8,564 8,645 Religious sisters 35,586 42,429 52,583 66,375 68,590 Workforce of the Church (total) 58,863 69,539 87,950 113,541 118,455
As shown in the table on the next page, dioceses report on several populations of lay persons including those in secular institutes, lay missionaries, and lay catechists. However, the way in which dioceses estimate these numbers appears to have changed over time. This likely represents a shift in the definitions used. As with the growth in clergy and vowed religious in Africa there is also growth in lay forms of ministry in all areas measured by the Vatican. There are now an estimated 393,580 catechists in Africa along with 7,195 lay missionaries, and 928 lay men and women in secular institutes.

28
Africa: Laity in Ministry
1980 1990 2000 2010 2012
Lay males in secular institutes no data 28 26 84 77 Lay women in secular institutes no data 423 418 782 851 Lay missionaries no data 1,329 1,222 6,372 7,195 Catechists (lay persons) 142,138 256,903 385,897 397,383 393,580
In 1980, Africa had fewer diocesan priests per parish than Europe does now. In 2012, there were nearly two diocesan priests per parish—providing the pastoral flexibility that few dioceses around the world could imagine. The number of Catholics per diocesan priest has declined from 9,695 in 1980 to 7,223 in 2012. Future expansions in the number of parishes will be needed given rising numbers of Catholics and high levels of weekly attendance. Many dioceses in Africa have sufficient numbers of diocesan priests to pastor in new parishes.
Growth in the number of new diocesan priests in Africa is not expected to slow. As shown in the table on the next page the number of new diocesan priests ordained annually on the continent is much larger than the numbers lost to mortality or defection. In recent years, there has been a net gain of more than 1,000 diocesan priests every year.
9,695
8,642
7,6657,298 7,223
0.8
1.1
1.5
1.8 1.8
0.0
0.2
0.4
0.6
0.8
1.0
1.2
1.4
1.6
1.8
2.0
0
2,000
4,000
6,000
8,000
10,000
12,000
1980 1990 2000 2010 2012
Catholics per Diocesan Priest and Diocesan Priests per Parish in Africa, 1980-2012
Catholics per diocesan priest Diocesan priests per parish
29
Africa: Components of Change in the Number of Diocesan Priests
1980 1990 2000 2010 2012
Ordinations of diocesan priests 397 716 1,177 1,572 1,535 Deaths of diocesan priests 43 87 202 200 222 Defections of diocesan priests 42 34 44 78 58 Net change in diocesan priests 312 595 931 1,294 1,255
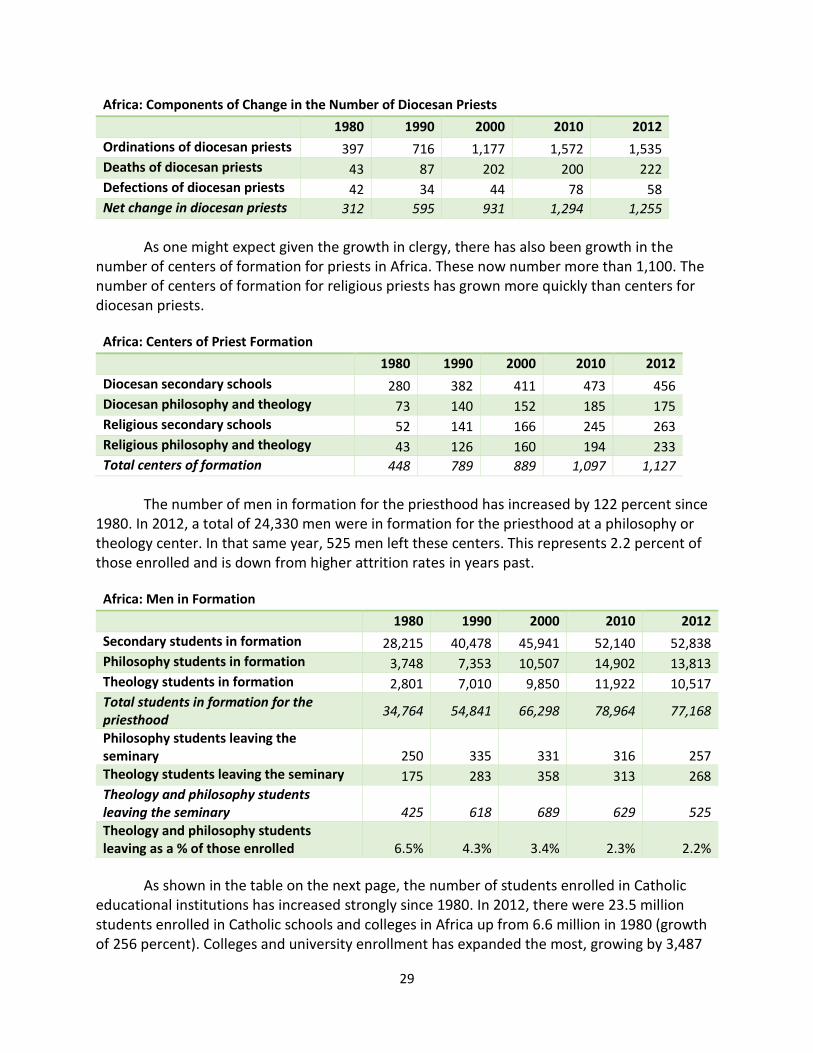
As one might expect given the growth in clergy, there has also been growth in the number of centers of formation for priests in Africa. These now number more than 1,100. The number of centers of formation for religious priests has grown more quickly than centers for diocesan priests.
Africa: Centers of Priest Formation
1980 1990 2000 2010 2012
Diocesan secondary schools 280 382 411 473 456 Diocesan philosophy and theology 73 140 152 185 175 Religious secondary schools 52 141 166 245 263 Religious philosophy and theology 43 126 160 194 233 Total centers of formation 448 789 889 1,097 1,127
The number of men in formation for the priesthood has increased by 122 percent since 1980. In 2012, a total of 24,330 men were in formation for the priesthood at a philosophy or theology center. In that same year, 525 men left these centers. This represents 2.2 percent of those enrolled and is down from higher attrition rates in years past.
Africa: Men in Formation
1980 1990 2000 2010 2012
Secondary students in formation 28,215 40,478 45,941 52,140 52,838 Philosophy students in formation 3,748 7,353 10,507 14,902 13,813 Theology students in formation 2,801 7,010 9,850 11,922 10,517 Total students in formation for the priesthood
34,764 54,841 66,298 78,964 77,168
Philosophy students leaving the seminary 250 335 331 316 257 Theology students leaving the seminary 175 283 358 313 268 Theology and philosophy students leaving the seminary
425
618
689
629
525
Theology and philosophy students leaving as a % of those enrolled
6.5%
4.3%
3.4%
2.3%
2.2%
As shown in the table on the next page, the number of students enrolled in Catholic educational institutions has increased strongly since 1980. In 2012, there were 23.5 million students enrolled in Catholic schools and colleges in Africa up from 6.6 million in 1980 (growth of 256 percent). Colleges and university enrollment has expanded the most, growing by 3,487

30
percent since 1980 from 8,337 students to 299,032 in 2012. The number of K-12 schools in Africa expanded by 166 percent since 1980—adding 39,532 campuses and now totaling 63,384 schools.
Africa: Catholic Educational Institutions
1980 1990 2000 2010 2012
Kindergartens 1,954 6,646 11,672 13,600 14,711 Students in kindergarten 162,370 484,574 1,147,902 1,277,500 1,444,069 Primary schools 18,654 23,650 30,245 34,238 36,613 Students in primary schools 5,610,700 8,393,845 10,158,438 15,821,318 16,472,059 Secondary schools 3,244 4,449 7,297 11,477 12,060 Students in secondary schools 806,533 1,275,210 2,267,086 4,540,937 5,241,057 Students in colleges and universities 8,337 10,298 69,651 196,087 299,032 Total students in Catholic institutions
6,587,940
10,163,627
13,643,077
21,835,842
23,456,217
As one might expect given the population growth and Mass attendance rates in Africa, there is substantial growth in sacramental practice as well on the continent. In 1980, there were just over 2 million baptisms in Africa. In 2012, there were 3.8 million new Catholics entering the faith. If there is any cause of concern it is that growth in the number of first communions and confirmations lags behind baptisms and confirmations have decreased in number slightly since 2000. Similar to baptisms, marriages have increased in number strongly with 99 percent growth since 1980.
Africa: Sacramental Practice
1980 1990 2000 2010 2012
Infant and child baptisms (under age 7) 1,413,847 1,853,757 2,265,897 2,442,522 2,577,280 Adult baptisms (ages 7 and older) 587,257 945,713 1,308,322 1,197,253 1,262,564 Total baptisms 2,001,104 2,799,470 3,574,219 3,639,775 3,839,844
First Communions No data 1,446,170 1,707,460 1,687,951 1,886,907 Confirmations No data 1,187,663 1,503,878 1,475,941 1,475,184 Marriages: Two Catholics 152,798 203,546 326,173 310,520 310,728 Marriages: Catholic and non-Catholic 24,887 40,901 42,480 40,740 43,368 Total marriages 177,685 244,447 368,653 351,260 354,096
% of marriages between two Catholics 86.0% 83.3% 88.5% 88.4% 87.0%
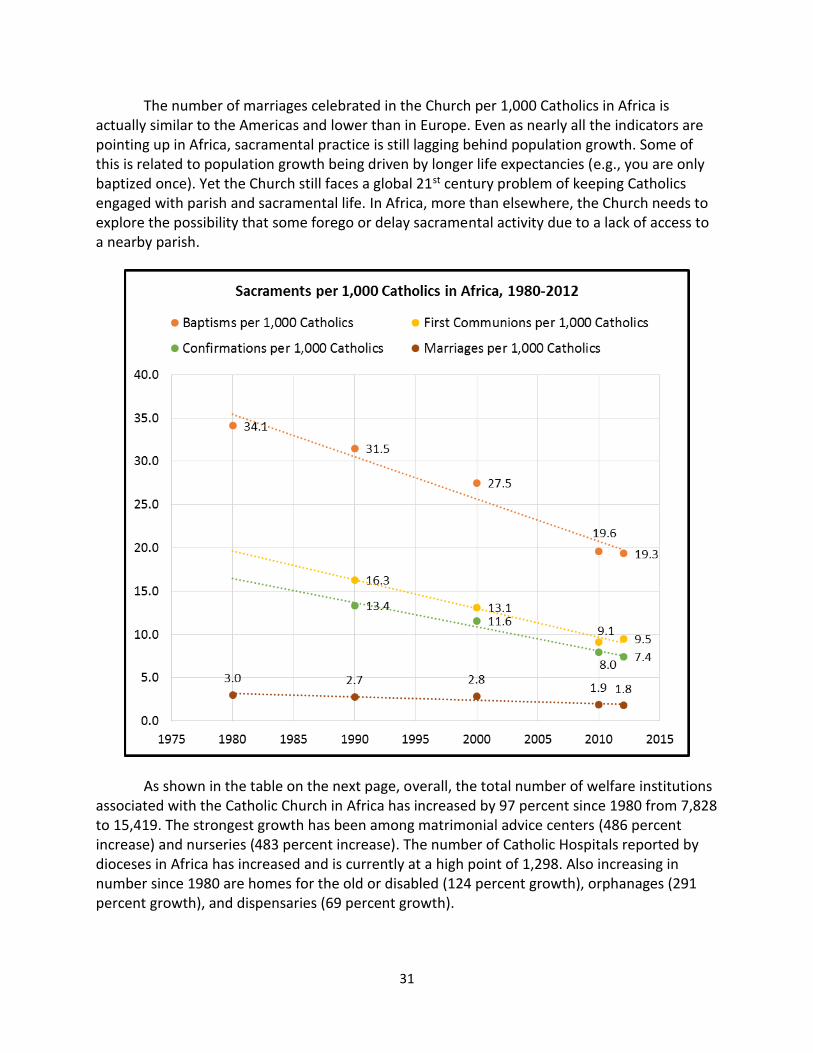
As shown in the figure on the next page, the numbers of sacraments celebrated per 1,000 Catholics in Africa are surprisingly on declining trends controlling for the growth and size of the population over time. Currently, per 1,000 Catholics in Africa, there are annually 19.3 baptisms, 9.5 first communions, 7.4 confirmations, and 1.8 marriages celebrated.
31
The number of marriages celebrated in the Church per 1,000 Catholics in Africa is actually similar to the Americas and lower than in Europe. Even as nearly all the indicators are pointing up in Africa, sacramental practice is still lagging behind population growth. Some of this is related to population growth being driven by longer life expectancies (e.g., you are only baptized once). Yet the Church still faces a global 21st century problem of keeping Catholics engaged with parish and sacramental life. In Africa, more than elsewhere, the Church needs to explore the possibility that some forego or delay sacramental activity due to a lack of access to a nearby parish.
As shown in the table on the next page, overall, the total number of welfare institutions associated with the Catholic Church in Africa has increased by 97 percent since 1980 from 7,828 to 15,419. The strongest growth has been among matrimonial advice centers (486 percent increase) and nurseries (483 percent increase). The number of Catholic Hospitals reported by dioceses in Africa has increased and is currently at a high point of 1,298. Also increasing in number since 1980 are homes for the old or disabled (124 percent growth), orphanages (291 percent growth), and dispensaries (69 percent growth).

32
Africa: Welfare Institutions
1980 1990 2000 2010 2012
Hospitals 978 898 819 1,150 1,298 Dispensaries 3,115 3,591 4,715 5,312 5,256 Leprosaria 283 238 378 198 229 Homes for the old or disabled 281 402 890 655 632 Orphanages 358 533 859 1,345 1,398 Nurseries 360 617 1,760 1,918 2,099 Matrimonial advice centers 295 955 1,503 1,812 1,728 Centers for social education or re-education 780 1,169 2,105 2,508 223 Other institutions 1,378 4,775 1,167 1,250 2,556 Total welfare institutions 7,828 13,178 14,196 16,148 15,419
33
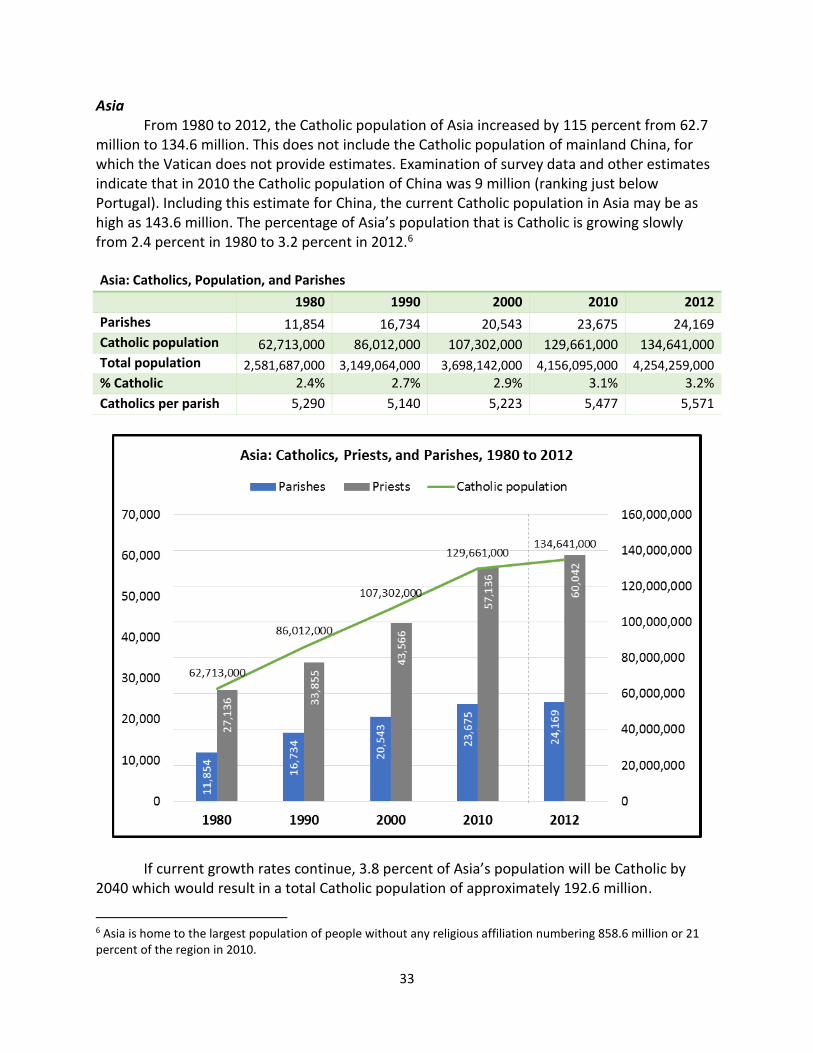
Asia From 1980 to 2012, the Catholic population of Asia increased by 115 percent from 62.7
million to 134.6 million. This does not include the Catholic population of mainland China, for which the Vatican does not provide estimates. Examination of survey data and other estimates indicate that in 2010 the Catholic population of China was 9 million (ranking just below Portugal). Including this estimate for China, the current Catholic population in Asia may be as high as 143.6 million. The percentage of Asia’s population that is Catholic is growing slowly from 2.4 percent in 1980 to 3.2 percent in 2012.6 Asia: Catholics, Population, and Parishes
1980 1990 2000 2010 2012
Parishes 11,854 16,734 20,543 23,675 24,169 Catholic population 62,713,000 86,012,000 107,302,000 129,661,000 134,641,000 Total population 2,581,687,000 3,149,064,000 3,698,142,000 4,156,095,000 4,254,259,000
% Catholic 2.4% 2.7% 2.9% 3.1% 3.2%
Catholics per parish 5,290 5,140 5,223 5,477 5,571
If current growth rates continue, 3.8 percent of Asia’s population will be Catholic by 2040 which would result in a total Catholic population of approximately 192.6 million.
6 Asia is home to the largest population of people without any religious affiliation numbering 858.6 million or 21 percent of the region in 2010.

34
CARA compiled weekly Mass attendance percentages in 75 national surveys conducted in Asia between 1990 and 2013. The average percentage of an Asian country’s Catholics saying they attend Mass every week was 55 percent in the 1990s, 52 percent in the 2000s, and 53 percent since 2010. There is considerable variation in weekly Mass attendance rates by country in Asia. Some 15 percent of Catholics in China reported weekly attendance in 2006. By comparison, 93 percent of Catholics in Singapore reported weekly attendance during the same year.
If current trends continue and Mass attendance rates remain stable, there would be about 102 million weekly Mass attenders in Asia in 2040. If dioceses in Asia did not construct any new parishes or close any existing sites this would lead to an estimated 4,223 Mass attending Catholics per parish at this point in time.
As shown on the next page, 91 percent of parishes in Asia have resident priest pastors.
Additionally, 8 percent are administered by non-resident priests. Entrusting the parish to deacons or lay persons is uncommon (i.e., Canon 517.2). However, one recent change is a growing number of parishes entrusted to religious sisters. In 2010, only 11 parishes were entrusted to religious sisters and two years later 95 parishes were entrusted as such.
Over time the percentage of parishes without resident priest pastors has steadily
declined from 17 percent in 1990 to 8.9 percent in 2012.

35
Asia: Parish Administration
1980 1990 2000 2010 2012
Resident Diocesan priest 7,188 10,562 13,763 17,472 17,941 Resident Religious priest 3,057 3,322 3,496 4,046 4,080 Administered by non-resident priest 1,447 2,381 2,939 1,923 1,891 Administered by a deacon 18 15 6 2 11 Administered by a religious brother 12 36 36 61 31 Administered by a religious sister 33 35 72 10 95 Administered by lay people 47 45 141 96 84 Vacant parishes 52 338 90 65 36 Parishes without a resident priest pastor 13.6% 17.0% 16.0% 9.1% 8.9%
The workforce of the Church, in terms of vowed religious and clergy, has expanded broadly in recent decades. Since 1980 the number of priests (diocesan and religious) in Asia has increased by 121 percent from 27,136 to 60,042 in 2012. Numbers of religious brothers and sisters have nearly doubled. There are 231 more bishops in Asia in 2012 than in 1980 as well. Overall the workforce of the Church has essentially doubled from 121,710 to 242,264 since 1980. This is near the same rate of growth occurring in the Catholic population.
Asia: Workforce of the Church
1980 1990 2000 2010 2012
Bishops 535 584 627 758 766 Diocesan priests 13,555 18,799 25,716 33,318 34,731 Religious priests 13,581 15,056 17,850 23,818 25,311 Permanent Deacons 33 52 87 190 178 Religious brothers 6,117 6,637 7,659 10,461 11,688 Religious sisters 87,889 112,127 138,195 165,308 169,590 Workforce of the Church (total) 121,710 153,255 190,134 233,853 242,264
Dioceses report on several populations of lay persons including those in secular institutes, lay missionaries, and lay catechists. However, the way in which dioceses have estimated these numbers appear to have changed over time. These data indicate growth in Asia among all lay ministry populations measured by the Vatican.
Asia: Laity in Ministry
1980 1990 2000 2010 2012
Lay males in secular institutes no data 31 79 41 72 Lay women in secular institutes no data 861 1,378 1,881 1,839 Lay missionaries no data 352 3,597 21,726 31,341 Catechists (lay persons) 52,422 83,638 260,961 304,774 365,720

36
With strong growth in the number of clergy in recent decades the number of Catholics per diocesan priest in Asia has been falling and the number of diocesan priests per parish rising. There are now about three diocesan priests for every two parishes.
The number of diocesan priests are growing in Asia because the number ordained each year by far exceeds the numbers lost to death or defections. Since 2000, more than 1,000 priests have been ordained annually in Asia.
Asia: Components of Change in the Number of Diocesan Priests
1980 1990 2000 2010 2012
Ordinations of diocesan priests 562 959 1,094 1,287 1,156 Deaths of diocesan priests 172 188 254 318 301 Defections of diocesan priests 51 48 58 61 91 Net change in diocesan priests 339 723 782 908 764
As shown in the table on the next page, the total numbers of centers of formation for priests have increased by 232 percent since 1980. The number of centers for religious clergy are growing more quickly than those for diocesan clergy. There are 1,482 more centers in 2012 than in 1980.

37
Asia: Centers of Priest Formation
1980 1990 2000 2010 2012
Diocesan secondary schools 223 339 390 461 470 Diocesan philosophy and theology 94 150 291 224 241 Religious secondary schools 176 299 402 615 720 Religious philosophy and theology 147 270 405 638 691 Total centers of formation 640 1,058 1,488 1,938 2,122
The numbers of men in formation in all types of centers of formation have increased since 1980. In 2012, a total of 35,481 men were in formation for the priesthood at a philosophy or theology center. In that same year, 618 men left these centers. This represents 1.7 percent of those enrolled and is slightly below the trend since 1980.
Asia: Men in Formation
1980 1990 2000 2010 2012
Secondary students in formation 16,624 21,048 24,745 24,930 25,065 Philosophy students in formation 6,729 11,035 13,911 19,004 20,333 Theology students in formation 5,461 10,253 12,095 15,240 15,148 Total students in formation for the 28,814 42,336 50,751 59,174 60,546
Philosophy students leaving the seminary 249 329 311 190 320 Theology students leaving the seminary 210 243 262 143 298 Theology and philosophy students leaving the seminary
459
572
573
333
618
Theology and philosophy students leaving as a % of those enrolled
3.8%
2.7%
2.2%
1.0%
1.7%
As shown in the table on the next page, the number of students enrolled in Catholic institutions of higher learning and kindergartens tripled since 1980. Overall, the number of students enrolled has expanded by 83 percent since 1980 adding more than 7.1 million students enrolled to total 15.3 million in Catholic educational institutions in 2012. The number of schools has expanded along with enrollments.

38
Asia: Catholic Educational Institutions
1980 1990 2000 2010 2012
Kindergartens 4,889 8,000 10,905 13,935 14,064 Students in kindergarten 606,985 1,058,582 1,369,762 1,761,085 1,875,272 Primary schools 11,108 12,608 14,625 15,877 16,097 Students in primary schools 3,752,622 4,286,949 4,668,907 5,023,844 5,675,312 Secondary schools 6,207 7,572 7,976 10,015 10,450 Students in secondary schools 3,150,892 3,982,112 4,017,422 5,291,981 5,801,336 Students in colleges and universities 622,199 924,365 1,333,202 1,800,752 1,888,974 Total students in Catholic institutions
8,154,902
10,280,188
11,389,293
13,917,489
15,281,505
The number of infant and child baptisms (under age 7) increased by 16.6 percent from
1980 to 2012. Adult baptisms (ages 7 and older) expanded much more by 79.9 percent. Overall, entries into the Church have increased by 23.9 percent from 1980 to 2012. Declines in infant and child baptisms coincide with falling fertility in Asia. In East Asia and the Pacific the total fertility rate has fallen from 3.05 in 1980 to below replacement, 1.82, in 2012. Fertility is slightly higher in South Asia but still fell here from 5.01 in 1980 to 2.59 in 2012. The numbers of first communions and confirmations celebrated annually have been increasing over time. The total number of marriages in the Church in Asia has grown from 381,697 in 1980 to 626,380 in 2012 (growth of 64.1 percent).
Asia: Sacramental Practice
1980 1990 2000 2010 2012
Infant and child baptisms (under age 7) 1,842,145 2,109,025 2,256,942 2,397,869 2,147,877 Adult baptisms (ages 7 and older) 241,244 354,197 444,613 427,439 434,024 Total baptisms 2,083,389 2,463,222 2,701,555 2,825,308 2,581,901
First Communions No data 1,495,574 1,819,766 1,717,188 1,696,831 Confirmations No data 930,792 1,248,515 1,288,680 1,371,401 Marriages: Two Catholics 345,963 442,187 635,898 527,622 562,442 Marriages: Catholic and non-Catholic 35,734 56,789 60,942 59,332 63,938 Total marriages 381,697 498,976 696,840 586,954 626,380
% of marriages between two Catholics 90.6% 88.6% 91.3% 89.9% 89.8%
As shown in the figure on the next page, the numbers of sacraments celebrated per
1,000 Catholics in Asia are declining over time. Currently, per 1,000 Catholics in Asia, there are annually 19.2 baptisms, 12.6 first communions, 10.2 confirmations, and 4.7 marriages celebrated.
Baptismal rates per 1,000 Catholics in Asia are similar to those in Africa. However, for
rates of celebration for first communions, confirmations, and marriage, Asia leads the world. Marriage rates are significantly higher here than in other regions.

39
There are also a few Asian countries with marriage rates even higher than other countries in this region. In 2012 these included: Vietnam (12.2 marriages per 1,000 Catholics), Cambodia (8.5 marriages per 1,000 Catholics), and Laos (7.5 marriages per 1,000 Catholics).
As shown in the table on the next page, the total number of welfare institutions associated with the Catholic Church in Asia has increased by 119 percent since 1980. The strongest growth has been among nurseries (increasing by 295 percent) and among homes for the old and disabled (increasing by 386 percent). In contrast to other regions, matrimonial advice centers grew only modestly at 10 percent during this period. The numbers of Catholic Hospitals reported by dioceses in Asia have fluctuated but are consistently over 1,000.

40
Asia: Welfare Institutions
1980 1990 2000 2010 2012
Hospitals 1,089 1,005 1,584 1,126 1,137 Dispensaries 2,241 3,117 3,427 3,884 3,760 Leprosaria 266 405 348 285 322 Homes for the old or disabled 519 835 1,548 2,346 2,520 Orphanages 1,629 2,165 2,851 3,606 3,980 Nurseries 872 1,530 2,849 3,175 3,441 Matrimonial advice centers 847 882 945 987 933 Centers for social education or re-education 868 3,105 6,084 4,867 581 Other institutions 1,467 4,288 889 1,252 4,751 Total welfare institutions 9,798 17,332 20,525 21,528 21,425

41
Oceania The Catholic population in Oceania has grown at the same rate as the total population in
the region since 1980 and in 2012 totaled 9.7 million. With a stable number of parishes during this period, this growth has meant that the number of Catholics per parish has gone from 2,516 in 1980 to 4,001 in 2012.
Oceania: Catholics, Population, and Parishes
1980 1990 2000 2010 2012
Parishes 2,308 2,383 2,384 2,415 2,426 Catholic population 5,806,000 7,031,000 8,202,000 9,468,000 9,706,000 Total population 22,739,000 26,497,000 30,566,000 36,492,000 37,301,000 % Catholic 25.5% 26.5% 26.8% 25.9% 26.0%
Catholics per parish 2,516 2,950 3,440 3,920 4,001
From 1980 to 2012, Catholics represented 26 percent of the population of Oceania. If Catholics continue to be 26 percent of the Oceanic population in 2040 there will be approximately 12 million Catholics in the region. As shown on the next page, CARA compiled weekly Mass attendance percentages in 51 national surveys conducted in Australia and New Zealand between 1990 and 2012. The average percentage of Catholics saying they attend Mass weekly in these two countries was 28 percent in the 1990s, 25 percent in the 2000s, and 21 percent since 2010.

42
Weekly Mass attendance in Australia and New Zealand is similar to levels in Europe. To the degree these two countries reflect all of Oceania, it is expected that about 2 million Catholics in the region attend Mass weekly resulting in 866 weekly attenders per parish.
As shown in the table below, the percentage of parishes without a resident priest pastor
have grown from 6.0 percent in 1980 to 19.3 percent in 2012. Thus, eight in ten parishes have a resident priest pastor and an additional 14 percent are administered by non-resident priests. The numbers of parishes entrusted to lay people (Canon 517.2) have grown from 47 in 1980 to 65 in 2012.
Oceania: Parish Administration
1980 1990 2000 2010 2012
Resident Diocesan priest 1,571 1,617 1,537 1,460 1,463 Resident Religious priest 598 534 485 512 494 Administered by non-resident priest 71 151 261 322 349 Administered by a deacon 7 12 16 21 19 Administered by a religious brother 5 0 4 0 0 Administered by a religious sister 3 15 31 16 18 Administered by lay people 47 30 46 62 65 Vacant parishes 6 24 4 22 18 Parishes without a resident priest pastor 6.0% 9.7% 15.2% 17.5% 19.3%

43
The only segments of the clergy and vowed religious workforce of the Church in Oceania that have grown since 1980 are bishops and permanent deacons. There are 35 more bishops in the region in 2012 than in 1980 (35 percent growth) and there are 322 more permanent deacons (671 percent growth). The number of diocesan priests has decreased by 9 percent from 2,912 in 1980 to 2,731 in 2012. There are 305 more diocesan priests than parishes in Oceania. The numbers of religious priests, brothers, and religious sisters have also all decreased. In total, the workforce of the Church in terms of its clergy and vowed religious in Oceania has declined by 40 percent since 1980. There are 10,007 fewer clergy and vowed religious in Oceania now than in 1980.
Oceania: Workforce of the Church
1980 1990 2000 2010 2012
Bishops 101 106 121 129 136 Diocesan priests 2,912 2,790 2,714 2,807 2,731 Religious priests 2,755 2,641 2,233 2,009 1,994 Permanent Deacons 48 89 176 344 370 Religious brothers 3,226 2,460 1,836 1,440 1,454 Religious sisters 16,072 13,554 11,095 9,012 8,422 Workforce of the Church (total) 25,114 21,640 18,175 15,741 15,107
As shown in the table below, dioceses report on several populations of lay persons including those in secular institutes, lay missionaries, and lay catechists. However, the way in which dioceses have estimated these numbers appear to have changed over time. This likely represents a shift in the definitions used. Since 2000, there have been more than 12,000 lay catechists in Oceania. The number of lay missionaries has declined from 220 in 1990 to 90 in 2012. Very few lay men or women are involved in secular institutes in Oceania.
Oceania: Laity in Ministry
1980 1990 2000 2010 2012
Lay males in secular institutes no data 1 1 1 1 Lay women in secular institutes no data 46 44 48 44 Lay missionaries no data 220 107 352 90 Catechists (lay persons) 4,735 6,232 12,343 15,875 15,358
As shown in the figure on the next page, the ratio of diocesan priests per parish in
Oceania have been decreasing over time and is nearing parity. The ratio of Catholics per diocesan priest is rising over time as well.

44
In a typical year there are more than 40 men ordained as diocesan priests in Oceania. Sometimes this exceeds the number of diocesan priests lost to mortality or defection and sometimes it does not. As noted previously, the number of diocesan priests is in decline in this region.
Oceania: Components of Change in the Number of Diocesan Priests
1980 1990 2000 2010 2012
Ordinations of diocesan priests 43 44 66 49 52 Deaths of diocesan priests 46 31 61 49 62 Defections of diocesan priests 18 12 13 7 12 Net change in diocesan priests -21 1 -8 -7 -22
Oceania has had 70 or more centers for priestly formation since 1980.
Oceania: Centers of Priest Formation
1980 1990 2000 2010 2012
Diocesan secondary schools 17 16 24 24 20 Diocesan philosophy and theology 13 17 26 19 21 Religious secondary schools 4 7 7 11 9 Religious philosophy and theology 40 30 21 20 21 Total centers of formation 74 70 78 74 71
45
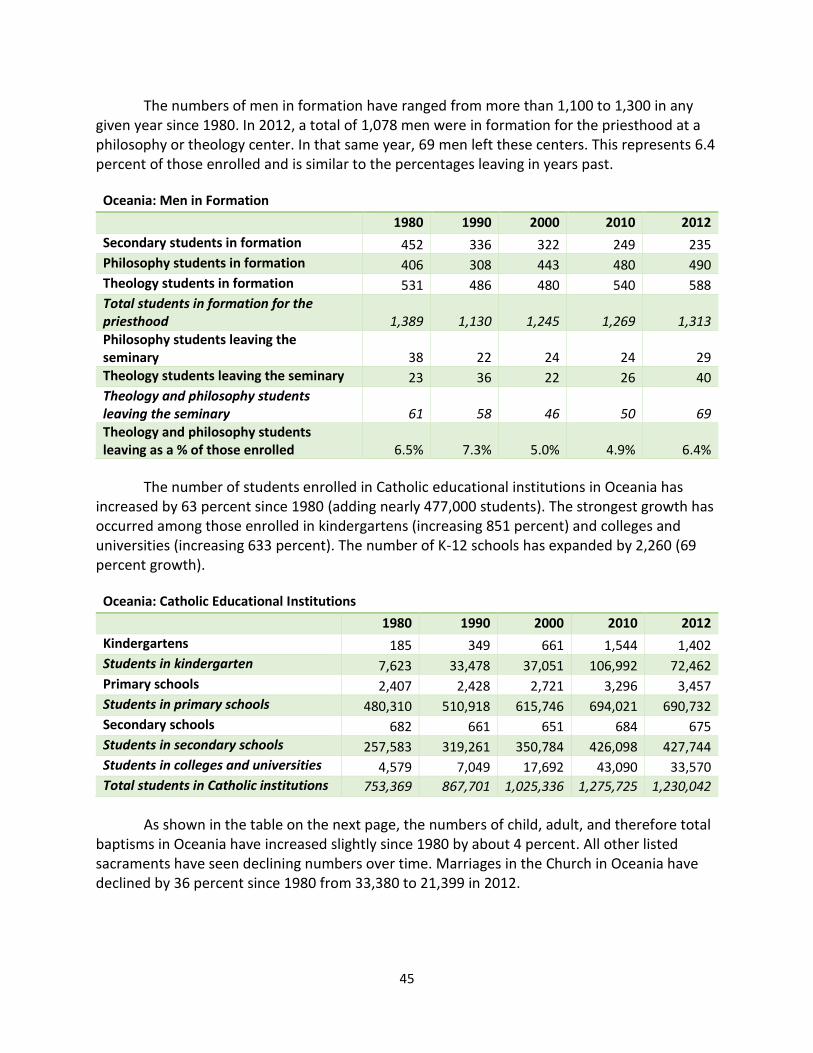
The numbers of men in formation have ranged from more than 1,100 to 1,300 in any given year since 1980. In 2012, a total of 1,078 men were in formation for the priesthood at a philosophy or theology center. In that same year, 69 men left these centers. This represents 6.4 percent of those enrolled and is similar to the percentages leaving in years past.
Oceania: Men in Formation
1980 1990 2000 2010 2012
Secondary students in formation 452 336 322 249 235 Philosophy students in formation 406 308 443 480 490 Theology students in formation 531 486 480 540 588 Total students in formation for the priesthood
1,389
1,130
1,245
1,269
1,313
Philosophy students leaving the seminary 38 22 24 24 29 Theology students leaving the seminary 23 36 22 26 40 Theology and philosophy students leaving the seminary
61
58
46
50
69
Theology and philosophy students leaving as a % of those enrolled
6.5%
7.3%
5.0%
4.9%
6.4%
The number of students enrolled in Catholic educational institutions in Oceania has increased by 63 percent since 1980 (adding nearly 477,000 students). The strongest growth has occurred among those enrolled in kindergartens (increasing 851 percent) and colleges and universities (increasing 633 percent). The number of K-12 schools has expanded by 2,260 (69 percent growth).
Oceania: Catholic Educational Institutions
1980 1990 2000 2010 2012
Kindergartens 185 349 661 1,544 1,402 Students in kindergarten 7,623 33,478 37,051 106,992 72,462 Primary schools 2,407 2,428 2,721 3,296 3,457 Students in primary schools 480,310 510,918 615,746 694,021 690,732 Secondary schools 682 661 651 684 675 Students in secondary schools 257,583 319,261 350,784 426,098 427,744 Students in colleges and universities 4,579 7,049 17,692 43,090 33,570 Total students in Catholic institutions 753,369 867,701 1,025,336 1,275,725 1,230,042
As shown in the table on the next page, the numbers of child, adult, and therefore total baptisms in Oceania have increased slightly since 1980 by about 4 percent. All other listed sacraments have seen declining numbers over time. Marriages in the Church in Oceania have declined by 36 percent since 1980 from 33,380 to 21,399 in 2012.

46
Oceania: Sacramental Practice
1980 1990 2000 2010 2012
Infant and child baptisms (under age 7) 111,497 125,507 114,062 114,197 116,000 Adult baptisms (ages 7 and older) 13,900 14,635 13,890 15,739 14,375 Total baptisms 125,397 140,142 127,952 129,936 130,375
First Communions No data 90,952 96,147 84,819 84,594 Confirmations No data 82,563 89,893 84,573 84,270 Marriages: Two Catholics 17,784 21,311 16,211 14,198 13,943 Marriages: Catholic and non-Catholic 15,596 17,913 10,812 7,811 7,456 Total marriages 33,380 39,224 27,023 22,009 21,399
% of marriages between two Catholics 53.3% 54.3% 60.0% 63.7% 65.2%
As shown below, the numbers of sacraments celebrated per 1,000 Catholics in Oceania are all in a similar decline. Currently, per 1,000 Catholics in Oceania, there are annually 13.4 baptisms, 8.7 first communions, 8.7 confirmations, and 2.2 marriages celebrated.
47
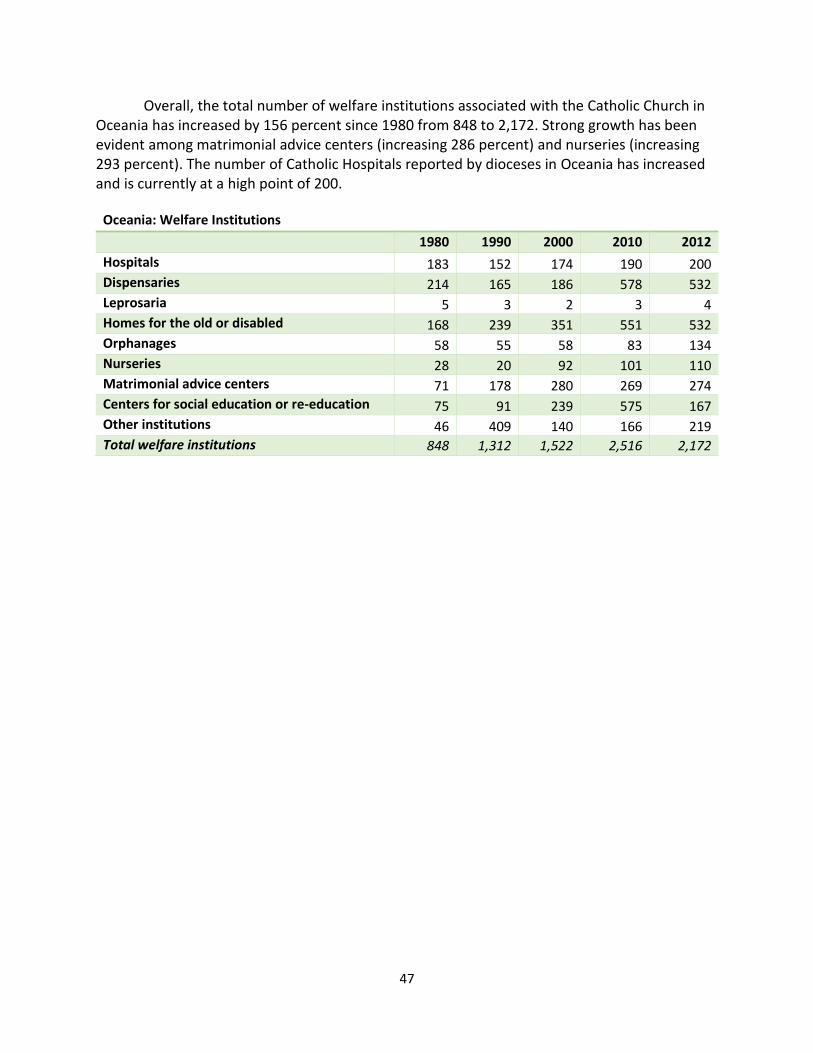
Overall, the total number of welfare institutions associated with the Catholic Church in Oceania has increased by 156 percent since 1980 from 848 to 2,172. Strong growth has been evident among matrimonial advice centers (increasing 286 percent) and nurseries (increasing 293 percent). The number of Catholic Hospitals reported by dioceses in Oceania has increased and is currently at a high point of 200.
Oceania: Welfare Institutions
1980 1990 2000 2010 2012
Hospitals 183 152 174 190 200 Dispensaries 214 165 186 578 532 Leprosaria 5 3 2 3 4 Homes for the old or disabled 168 239 351 551 532 Orphanages 58 55 58 83 134 Nurseries 28 20 92 101 110 Matrimonial advice centers 71 178 280 269 274 Centers for social education or re-education 75 91 239 575 167 Other institutions 46 409 140 166 219 Total welfare institutions 848 1,312 1,522 2,516 2,172

48
Appendix The Vatican included the following countries within these regions for 2012: Africa Algeria, Angola, Benin, Botswana, Burkina Faso, Burundi, Cameroon, Cape Verde, Central African Republic, Chad, Comoros, Congo, Cote d'Iviore, Dem. Republic of the Congo, Djibouti, Egypt, Eritrea, Ethiopia, Gabon, Gambia, Ghana, Guinea-Bissau, Equatorial Guinea, Guinea, Kenya, Lesotho, Liberia, Libya, Madagascar, Malawi, Mali, Mauritania, Mauritius, Morocco, Mozambique, Namibia, Niger, Nigeria, Réunion, Rwanda, Saint Helena, Sao Tome and Principe, Senegal, Seychelles, Sierra Leone, Somalia, South Africa, South Sudan, Sudan, Swaziland, Tanzania, Togo, Tunisia, Uganda, Western Sahara, Zambia, Zimbabwe Americas—Central America Antilles Anguilla, Antigua and Barbuda, Aruba, Bahamas, Barbados, Cayman Islands, Cuba, Dominica, Dominican Republic, Grenada, Guadeloupe, Haiti, Jamaica, Martinique, Montserrat, Netherlands Antilles, Puerto Rico, Saint Kitts and Nevis, Saint Lucia, St. Vincent and the Grenadines, Trinidad and Tobago, Turks and Caicos Islands, Virgin Islands (GBA), Virgin Islands (USA) Americas—Central America Mainland
Belize, Costa Rica, El Salvador, Guatemala, Honduras, Mexico, Nicaragua, Panama
Americas—North America
Bermuda, Canada, Greenland, St. Pierre and Miquelon, United States Americas—South America
Argentina, Bolivia, Brazil, Chile, Colombia, Ecuador, Falkland Islands, French Guiana, Guyana Paraguay, Peru, Suriname, Uruguay, Venezuela Asia—South East, Far East Asia Bahrain, Bangladesh, Bhutan, Brunei Darussalam, Cambodia, China (Mainland), Taiwan, Hong Kong SAR, India, Indonesia, Japan, Kazakhstan, Dem. People's Republic of Korea, Republic of Korea, Kuwait, Kyrgyzstan, Lao Peoples Dem. Rep., Macao SAR, Malaysia, Maldives, Mongolia, Myanmar, Nepal, Oman, Pakistan, Philippines, Qatar, Russian Federation (in Asia), Saudi Arabia, Singapore, Sri Lanka, Tajikistan, Thailand, East Timor, Turkmenistan, United Arab Emirates, Uzbekistan, Viet Nam, Yemen Asia—Middle East Asia Afghanistan, Cyprus, Iran, Iraq, Israel, Jordan, Lebanon, Syrian Arab Republic, Turkey Europe Albania, Andorra, Armenia, Austria, Azerbaijan, Belarus, Belgium, Bosnia and Herzegovina, Bulgaria, Croatia, Czech Republic, Denmark, Estonia, Faeroe Islands, Finland, France, Georgia, Germany, Gibraltar, Great Britain, Greece, Hungary, Iceland, Ireland, Italy, Kosovo, Latvia,
49
Liechtenstein, Lithuania, Luxembourg, Macedonia, Malta, Republic of Moldova, Monaco, Republic of Montenegro, Netherlands, Norway, Poland, Portugal, Romania, Russian Fed. (In Europe), San Marino, Serbia, Slovakia, Slovenia, Spain, Svalbard and Jan Mayen Is., Sweden, Switzerland, Ukraine Oceania American Samoa, Australia, Cook Islands, Fiji, Guam, Kiribati, Marshall Islands, Micronesia, N. Mariana Islands, Nauru, New Caledonia, New Zealand, Niue, Palau, Papua New Guinea, Polynesia, Samoa, Solomon Islands, Tokelau, Tonga, Tuvalu, Vanuatu, Wallis and Futuna Islands


