Global Cleantech Report 2012 COPENHAGEN CLEANTECH CLUSTER May, 2012 - EXECUTIVE PRESENTATION - A SNAPSHOT OF FUTURE GLOBAL MARKETS www.quartzco.com DENMARK Ryesgade 3A 2200 Copenhagen T: +45 33 17 00 00 NORWAY Wergelandsveien 21 0167 Oslo T: +47 22 59 36 00 SWEDEN Birger Jarlsgatan 7 111 45 Stockholm T: +46 (0)8 614 19 00 DOWNLOAD REPORT cphcleantech.com/global-cleantech-report
Transcript
Global Cleantech Report 2012 COPENHAGEN CLEANTECH CLUSTER
May, 2012
- EXECUTIVE PRESENTATION -
A SNAPSHOT OF FUTURE GLOBAL MARKETS
www.quartzco.com
DENMARK
Ryesgade 3A
2200 Copenhagen
T: +45 33 17 00 00
NORWAY
Wergelandsveien 21
0167 Oslo
T: +47 22 59 36 00
SWEDEN
Birger Jarlsgatan 7
111 45 Stockholm
T: +46 (0)8 614 19 00
DOWNLOAD REPORT
cphcleantech.com/global-cleantech-report
3
Table of contents
1) Executive Summary
The cleantech platforms and global markets: a sector in growth
• The cleantech sector will continue to grow towards 2015 with green buildings, smart grid and offshore wind as the fastest-growing platforms
• The “centre of gravity” for cleantech growth is moving East and West
• The megacities are the main growth engines as ECO-city ambitions and principles seem to be "the new normal"
• The world's urbanisation rate will continue to be rapid, and large investments will be made in developing megacities and suburb areas
• The six megacity cleantech clusters – including the four American Hotspots and the two Great Turks – will account for the majority of the cleantech growth
The global cleantech challenge: a complex value system
• To unleash the full global potential, the cleantech sector must cross the cost of energy chasm and accelerate the industrialisation
• Complex value-creation models need to be investigated and developed in order to meet the demand for competitive integrated solutions with local content
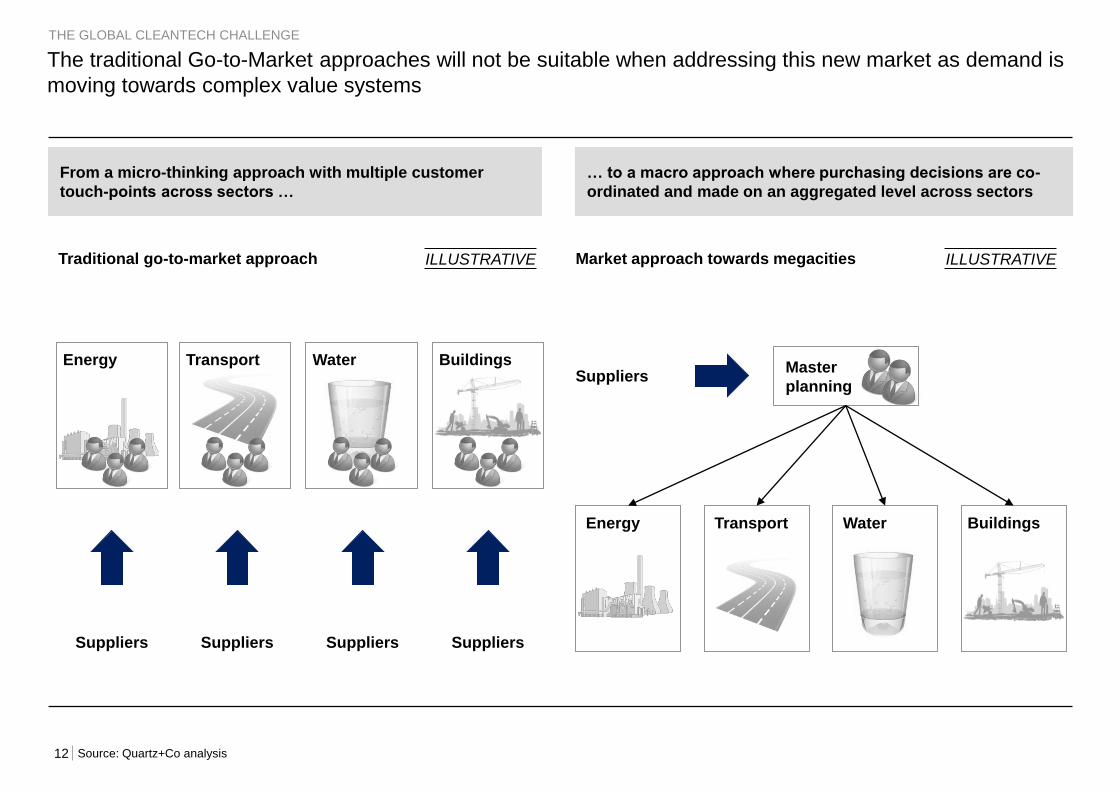
• The traditional Go-to-Market approaches will not be suitable when addressing this new market as demand is moving towards complex value systems
• Large Public-Private Partnerships (PPP) will be a cornerstone to overcome shortage in capital and competences in the "greening" of megacities
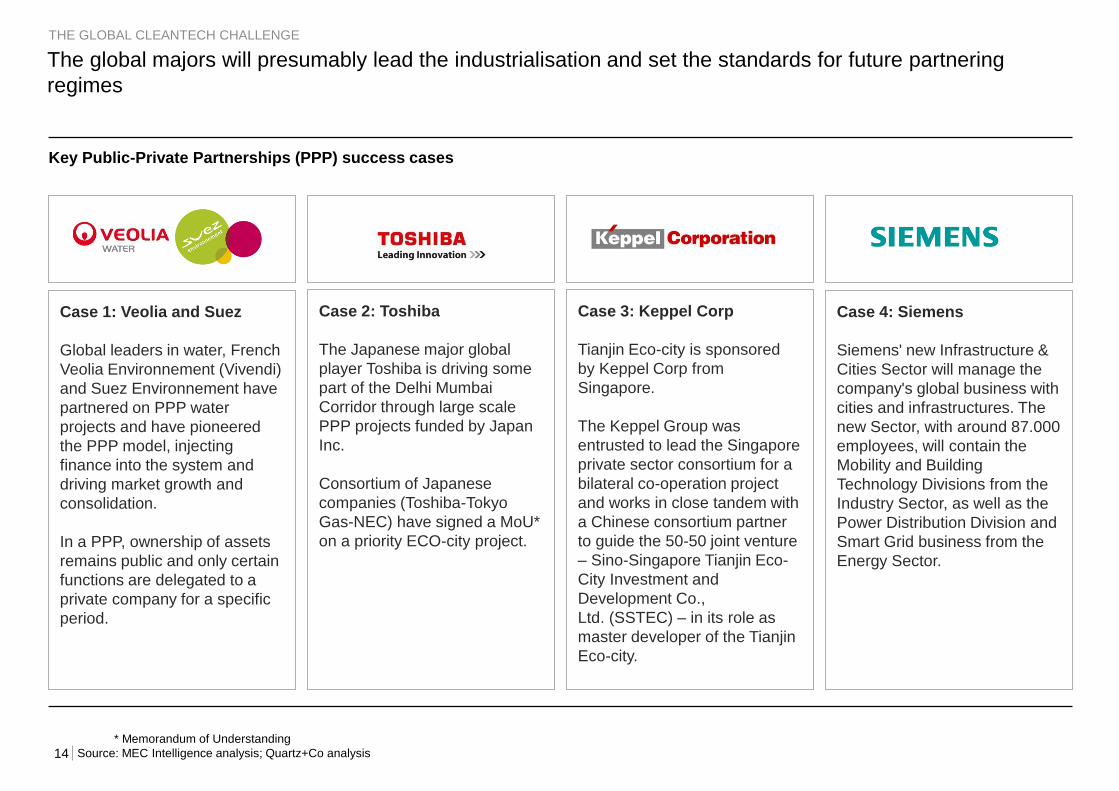
• The global majors will presumably lead the industrialisation and set the standards for future partnering regimes
The cleantech sector in a Danish context: an opportunity or a threat?
• Today, Danish companies are well-positioned to capture value in the attractive parts of the cleantech sector
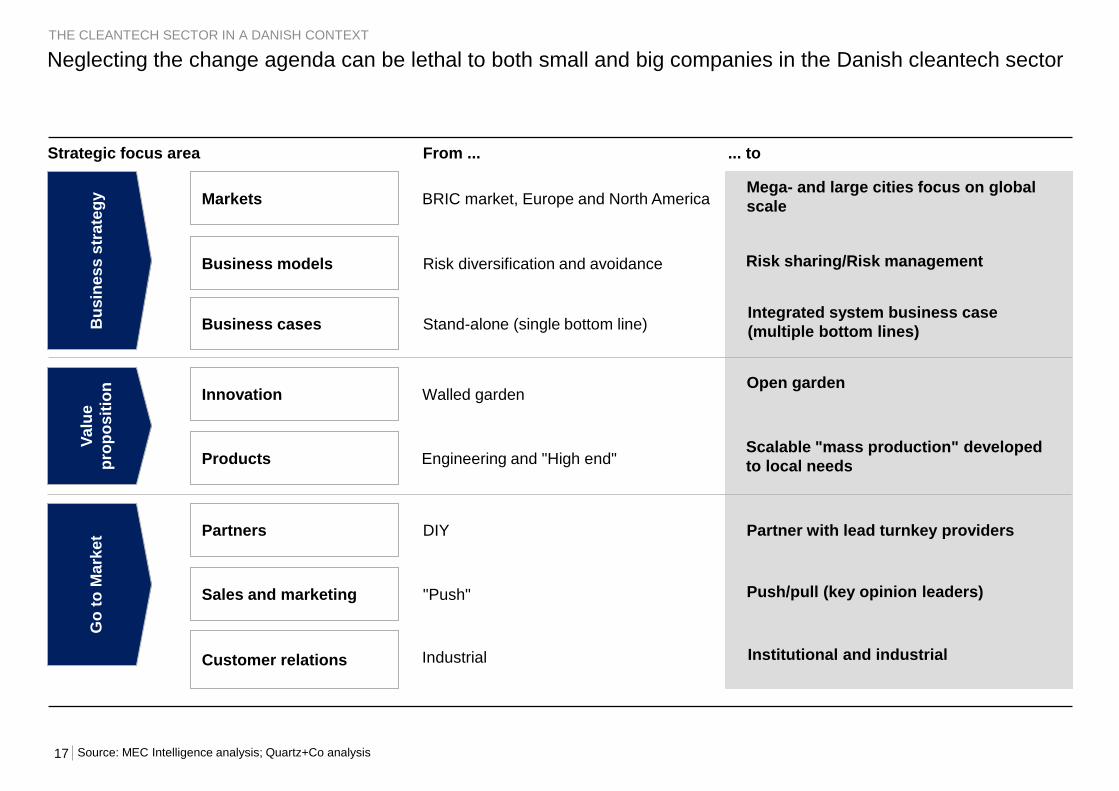
• Neglecting the change agenda can be lethal to both small and big companies in the Danish cleantech sector
• In the near future, new and more decisive intervention strategies must be developed to win the battle of the cleantech sector
2) Appendix
EXECUTIVE PRESENTATION
p. 3
p. 4
p. 5
p. 6
p. 7
p. 9
p. 10
p. 11
p. 12
p. 13
p. 15
p. 16
p. 17
p. 18
4
The cleantech sector will continue to grow towards 2015 with green buildings, smart grid and offshore wind
as the fastest-growing platforms
2010 Market
2015 Growth
7% 84% CAGR
Cleantech plaforms – market size (USD billions)
Note: Markets include all major CAPEX but not operations or commodities. Total may vary due to roundings
Sources: MEC Intelligence; Quartz+Co analysis
28% 39% 3% -7% 26% 4% 66% 74% 6% 18%
THE CLEANTECH PLATFORMS AND GLOBAL MARKETS
113 15
63
59
-28
72
13 8
Geothermal
5
2 1 3
Energy
storage
7
1 6
Maritime
cleantech
8
Clean road
transport
13
1
Bioenergy
13
10 4
Solid waste
31
26
5
Offshore
wind
73
14
Solar PV
(2011-2015)
79
107
Smart grid
89
26
Onshore
wind
110
95
Building
efficiency
materials
160
47
Clean water
243
171
5
The “centre of gravity” for cleantech growth is moving East and West
Note: “centre of gravity” is used as a metaphorical term in this context
Top-200 large cities' growth trajectories, 2012-2020
American
Hotspots
9
Table of contents
EXECUTIVE PRESENTATION
1) Executive summary
The cleantech platforms and global markets: a sector in growth
• The cleantech sector will continue to grow towards 2015 with green buildings, smart grid and offshore wind as the fastest-growing platforms
• The “centre of gravity” for cleantech growth is moving East and West
• The megacities are the main growth engines as ECO-city ambitions and principles seem to be "the new normal"
• The world's urbanisation rate will continue to be rapid, and large investments will be made in developing megacities and suburb areas
• The six megacity cleantech clusters – including the four American Hotspots and the two Great Turks – will account for the majority of the cleantech growth
The global cleantech challenge: a complex value system
• To unleash the full global potential, the cleantech sector must cross the cost of energy chasm and accelerate the industrialisation
• Complex value-creation models need to be investigated and developed in order to meet the demand for competitive integrated solutions with local content
• The traditional Go-to-Market approaches will not be suitable when addressing this new market as demand is moving towards complex value systems
• Large Public-Private Partnerships (PPP) will be a cornerstone to overcome shortage in capital and competences in the "greening" of megacities
• The global majors will presumably lead the industrialisation and set the standards for future partnering regimes
The cleantech sector in a Danish context: an opportunity or a threat?
• Today, Danish companies are well-positioned to capture value in the attractive parts of the cleantech sector
• Neglecting the change agenda can be lethal to both small and big companies in the Danish cleantech sector
• In the near future, new and more decisive intervention strategies must be developed to win the battle of the cleantech sector
2) Appendix
p. 3
p. 4
p. 5
p. 6
p. 7
p. 9
p. 10
p. 11
p. 12
p. 13
p. 15
p. 16
p. 17
p. 18
10
So far, no cleantech or clean energy industry has managed
to cross the cost of energy chasm without legislative support
through incentives or codes
In order to become a viable global industry, cleantech must
reduce cost of energy to become independent of governmental
support
To unleash the full global potential, the cleantech sector must cross the cost of energy chasm and accelerate
the industrialisation
In 2035, subsidies to renewables reach almost USD 250
billion in the New Policies Scenario. Onshore wind becomes
competitive around 2020 in the European Union … All other
technologies require continuing subsidies
World Energy Outlook 2011
243Offshore wind
Coal 109
… smart grid and building energy efficiency equipment and
services are the most probable ones crossing the cost of
energy chasm since they are able to reduce alternative
investments in infrastructure while reducing the operating cost
The Global Cleantech Report 2012
* Estimated for plants entering into service in 2016. Unit is 2012 USD
** The extra cost varies between countries due to difference in local build culture, certification programmes and green build material production
Source: World Energy Outlook; Reuters; World Business Council Sustainable Development – BCI Survey; Quartz+Co analysis; MEC Intelligence analysis
Time M
ark
et p
en
etr
ation
Cost of energy chasm
5 6
7
8 9
1
2 3
4
5
6
7
8
9
1
2
3
4
Green buildings
Solar PV
Solid waste
Offshore wind
Onshore wind
Bioenergy
Smart grid
Geothermal
Clean road transport
Coal Gas Oil
Next gen.
cleantech
THE GLOBAL CLEANTECH CHALLENGE
Sample technology maturity curve EXAMPLES ILLUSTRATIVE Coal vs. wind – global average costs* (USD/MWh)
"Non-green" vs. green building – extra up-front cost for green building**
Green building – China 28%
Green building – Germany 17%
Green building – US 16%
11
Complex value-creation models need to be investigated and developed in order to meet the demand for
competitive integrated solutions with local content
Transport infrastructure CAPEX saving
Water utility CAPEX saving
Energy/water subsidy saving
Energy infrastructure CAPEX saving
Green building extra CAPEX
0
Net benefit
Retaining attractive population
Attractive lucrative jobs
Job creation from local content
0 0
Affordable Greening - e.g. Lagos Comfort Evolution - e.g. Mexico City Branded City - e.g. London
$Business case = (utility CAPEX saving) + (OPEX saving) + (job creation) + (less CO2 emissions) + .... Complex value creation
Financial Societal Environmental
THE GLOBAL CLEANTECH CHALLENGE
City segment
Value (USD)
Savings from integrated "One System" solutions across city segments
The cleantech platforms and global markets: a sector in growth
• The cleantech sector will continue to grow towards 2015 with green buildings, smart grid and offshore wind as the fastest-growing platforms
• The “centre of gravity” for cleantech growth is moving East and West
• The megacities are the main growth engines as ECO-city ambitions and principles seem to be "the new normal"
• The world's urbanisation rate will continue to be rapid, and large investments will be made in developing megacities and suburb areas
• The six megacity cleantech clusters – including the four American Hotspots and the two Great Turks – will account for the majority of the cleantech growth
The global cleantech challenge: a complex value system
• To unleash the full global potential, the cleantech sector must cross the cost of energy chasm and accelerate the industrialisation
• Complex value-creation models need to be investigated and developed in order to meet the demand for competitive integrated solutions with local content
• The traditional Go-to-Market approaches will not be suitable when addressing this new market as demand is moving towards complex value systems
• Large Public-Private Partnerships (PPP) will be a cornerstone to overcome shortage in capital and competences in the "greening" of megacities
• The global majors will presumably lead the industrialisation and set the standards for future partnering regimes
The cleantech sector in a Danish context: an opportunity or a threat?
• Today, Danish companies are well-positioned to capture value in the attractive parts of the cleantech sector
• Neglecting the change agenda can be lethal to both small and big companies in the Danish cleantech sector
• In the near future, new and more decisive intervention strategies must be developed to win the battle of the cleantech sector
2) Appendix
16
Clean water 1. Grundfos
2. Novozymes
3. 7T
1. Top 50
2. Top 100
3. Top 50
Green buildings
1. Rockwool
2. VKR
3. Grundfos
4. Danfoss
5. Kamstrup
1. Top 5
2. Top 10
3. Top 10
4. Top 10
5. Top 50
Onshore wind
1. Vestas
2. Siemens
3. AH industries
4. Hydratech
1. Top 10
2. Top 10
3. Top 10
4. Top 10
Smart grid 1. DONG Energy
2. EnergiNet
1. Top 50
2. Top 50
Solar 1. Danfoss Power Electronics 1. Top 50
Offshore wind
1. Vestas/Siemens
2. DONG Energy
3. A2Sea
4. NKT
5. Bladt
1. Top 5
2. Top 5
3. Top 5
4. Top 10
5. Top 10
Solid waste 1. DONG Energy
2. Kommune Kemi
3. Hårslev Industries
1. Top 50
2. Top 50
3. Top 10
Bioenergy 1. Babcock
2. Novozymes
3. DONG Energy
1. Top 10
2. Top 10
3. Top 50
Clean road transport 1. Better Place
2. Danfoss
1. Top 10
2. Top 20
Maritime cleantech 1. Desmi
2. Alfa Laval Aalborg
3. AP Møller Maersk
1. Top 10
2. Top 5
3. Top 5
Today, Danish companies are well-positioned to capture value in the attractive parts of the cleantech sector
* Indicative global rating in niche market, e.g. Rockwool in the insulation market or Grundfos in the water utility equipment market based on MEC Intelligence analysis
As the largest and fastest-growing market globally, Asia dominates the water market as key developed
markets mature
Clean water – CAPEX and OPEX made by Utilities, Municipalities and Industries – Global market across regions, 2010-2015E
(USD billions)
~2% % CAGR (2010-2015)
~5%
~6%
~5%
~7%
Government support
Addressable market
Solution attractiveness
Five-year market growth potential
Market accessibility
Profit opportunity
Government support
Addressable market
Solution attractiveness
Five-year market growth potential
Market accessibility
Profit opportunity
Government support
Addressable market
Solution attractiveness
Five-year market growth potential
Market accessibility
Profit opportunity
Government support
Addressable market
Solution attractiveness
Five-year market growth potential
Market accessibility
Profit opportunity
~3%
Source: MEC Intelligence; Quartz+Co analysis
High/Large
Low/Small
2520
Africa
2015 2010
160
Asia
2015
220
2010
3124
Australia
2015 2010
159140
Europe
2015 2010
157142
North America
2015 2010
3325
South America
2015 2010
APPENDIX
ESTIMATE
Government support
Addressable market
Solution attractiveness
Five-year market growth potential
Market accessibility
Profit opportunity
Government support
Addressable market
Solution attractiveness
Five-year market growth potential
Market accessibility
Profit opportunity
21
The capital expenditure in the water sector is expected to grow from USD ~170 billion in 2010 to USD
~245 billion in 2015 or nearly 30-35% of the total water market
Clean water – CAPEX Water and Waste Water Infrastructure – Global market across regions, 2010-2015E (USD billions)
~5%
~8% ~9%
~8%
~10%
~6%
Source: MEC Intelligence; Quartz+Co analysis
107
Africa
2015 2010
85
54
Asia
2015 2010
128
Australia
2015 2010
62
47
Europe
2015 2010
61
48
North America
2015 2010
13
8
South America
2015 2010
APPENDIX
% CAGR (2010-2015)
High/Large
Low/Small
ESTIMATE
Government support
Addressable market
Solution attractiveness
Five-year market growth potential
Market accessibility
Profit opportunity
Government support
Addressable market
Solution attractiveness
Five-year market growth potential
Market accessibility
Profit opportunity
Government support
Addressable market
Solution attractiveness
Five-year market growth potential
Market accessibility
Profit opportunity
Government support
Addressable market
Solution attractiveness
Five-year market growth potential
Market accessibility
Profit opportunity
Government support
Addressable market
Solution attractiveness
Five-year market growth potential
Market accessibility
Profit opportunity
Government support
Addressable market
Solution attractiveness
Five-year market growth potential
Market accessibility
Profit opportunity
22
Europe is projected to be the largest market for green buildings in 2015 followed by North America and
Asia – Asia is expected to grow at almost double the rate of Europe
Green building materials – CAPEX Global market across regions, 2010-2015E (USD billions)
~32%
425
107
2015 2010
563
202
2015 2010
00
2015 2010
81
2015 2010
35
6
2015 2010
321
60
2015 2010
North
America
South
America
Europe
Africa and
Middle East
Asia
Australia
N.a. ~52%
~42%
~40%
~23%
Source: MEC Intelligence; Quartz+Co analysis
APPENDIX
% CAGR (2010-2015)
High/Large
Low/Small
ESTIMATE
Government support
Addressable market
Solution attractiveness
Five-year market growth potential
Market accessibility
Profit opportunity
Government support
Addressable market
Solution attractiveness
Five-year market growth potential
Market accessibility
Profit opportunity
Government support
Addressable market
Solution attractiveness
Five-year market growth potential
Market accessibility
Profit opportunity
Government support
Addressable market
Solution attractiveness
Five-year market growth potential
Market accessibility
Profit opportunity
Government support
Addressable market
Solution attractiveness
Five-year market growth potential
Market accessibility
Profit opportunity
Government support
Addressable market
Solution attractiveness
Five-year market growth potential
Market accessibility
Profit opportunity
23
Value-wise, the key onshore wind markets are large and stagnant. Growth is coming from new regions
Onshore wind – CAPEX Global market across regions, 2010-2015E (USD billions)
~3%
2219
2015 2010
2524
2015 2010
32
2015 2010
92
2015 2010
41
2015 2010
4747
2015 2010
North
America
South
America
Europe
Africa
Asia
Australia
~11%
~31%
~25%
~0%*
~1%
* Global price-erosion of 5% p.a., based on sample analysis of key turbine manufacturers, balancing out increase in number of GW installed p.a. in Asia
Source: MEC Intelligence; Quartz+Co analysis
APPENDIX
% CAGR (2010-2015)
High/Large
Low/Small
ESTIMATE
Government support
Addressable market
Solution attractiveness
Five-year market growth potential
Market accessibility
Profit opportunity
Government support
Addressable market
Solution attractiveness
Five-year market growth potential
Market accessibility
Profit opportunity
Government support
Addressable market
Solution attractiveness
Five-year market growth potential
Market accessibility
Profit opportunity
Government support
Addressable market
Solution attractiveness
Five-year market growth potential
Market accessibility
Profit opportunity
Government support
Addressable market
Solution attractiveness
Five-year market growth potential
Market accessibility
Profit opportunity
Government support
Addressable market
Solution attractiveness
Five-year market growth potential
Market accessibility
Profit opportunity
24
Asia (China) is expected to become the predominant smart grid market by 2015 growing rapidly from 2010
to 2015 and outpacing both Europe and North America
Smart grid – CAPEX Global market across regions, 2010-2015E (USD billions)
~11%
74
2015 2010
94
2015 2010
00
2010 2015
21
2015 2010
71
19
2010 2015
North
America
South
America
Europe
Africa
Asia
Australia
NA ~21%
NA
~31%
~22%
Source: MEC Intelligence; Quartz+Co analysis
APPENDIX
00
2015 2010
% CAGR (2010-2015)
High/Large
Low/Small
ESTIMATE
INDICATIVE
Government support
Addressable market
Solution attractiveness
Five-year market growth potential
Market accessibility
Profit opportunity
Government support
Addressable market
Solution attractiveness
Five-year market growth potential
Market accessibility
Profit opportunity
Government support
Addressable market
Solution attractiveness
Five-year market growth potential
Market accessibility
Profit opportunity
Government support
Addressable market
Solution attractiveness
Five-year market growth potential
Market accessibility
Profit opportunity
Government support
Addressable market
Solution attractiveness
Five-year market growth potential
Market accessibility
Profit opportunity
Government support
Addressable market
Solution attractiveness
Five-year market growth potential
Market accessibility
Profit opportunity
25
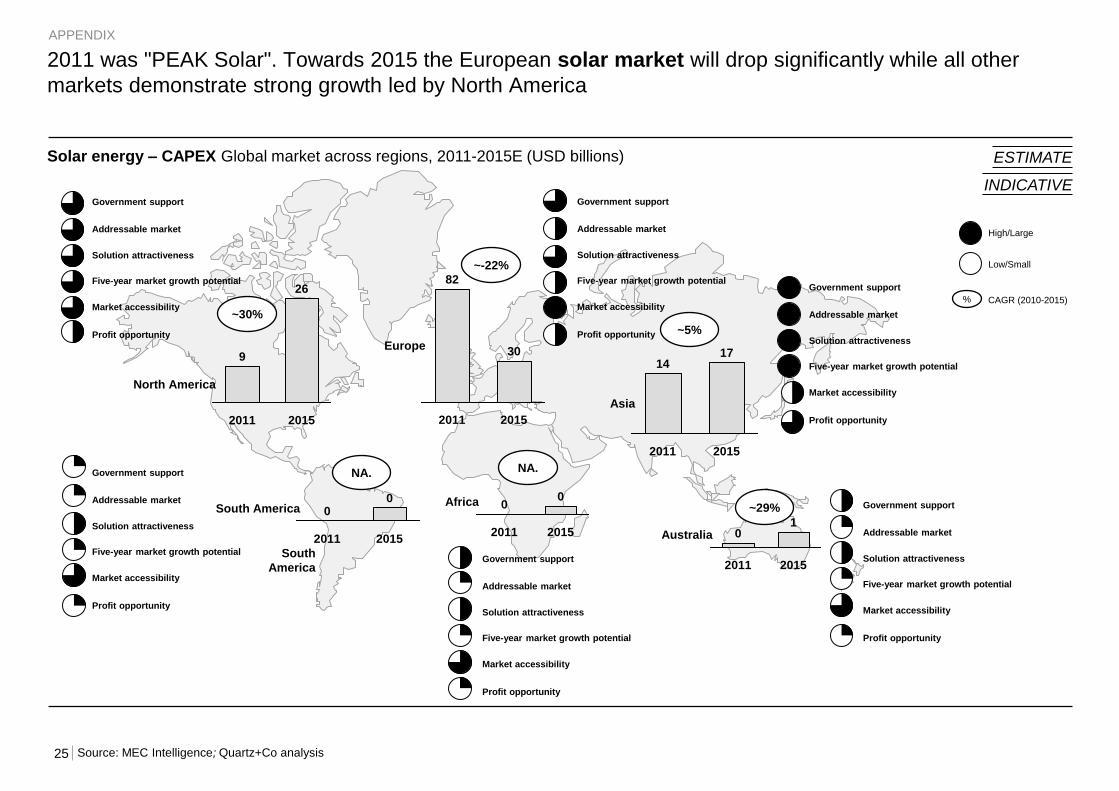
2011 was "PEAK Solar". Towards 2015 the European solar market will drop significantly while all other
markets demonstrate strong growth led by North America
Solar energy – CAPEX Global market across regions, 2011-2015E (USD billions)
South
America
~29%
~5%
~-22%
Source: MEC Intelligence; Quartz+Co analysis
2011 2015
Asia
14 17
2011 2015
Australia 0 1
2011 2015
Africa 0 0
2011 2015
Europe
82
30
2011 2015
North America
9
26
~30%
2011 2015
South America 0 0
NA. NA.
APPENDIX
% CAGR (2010-2015)
High/Large
Low/Small
ESTIMATE
INDICATIVE
Government support
Addressable market
Solution attractiveness
Five-year market growth potential
Market accessibility
Profit opportunity
Government support
Addressable market
Solution attractiveness
Five-year market growth potential
Market accessibility
Profit opportunity
Government support
Addressable market
Solution attractiveness
Five-year market growth potential
Market accessibility
Profit opportunity
Government support
Addressable market
Solution attractiveness
Five-year market growth potential
Market accessibility
Profit opportunity
Government support
Addressable market
Solution attractiveness
Five-year market growth potential
Market accessibility
Profit opportunity
Government support
Addressable market
Solution attractiveness
Five-year market growth potential
Market accessibility
Profit opportunity
26
Northern Europe is projected to maintain its status as the largest offshore wind market in 2015 and Asia,
North America and South America is projected to experience rapid growth
Offshore wind – CAPEX Global market across regions, 2010-2015E (USD billions)
~72%
12
0
2015 2010
38
14
2015 2010
00
2015 2010
20
2010 2015
00
2015 2010
21
0
2015 2010
North
America
South
America
Europe
Africa
Asia
Australia
NA. ~60%
NA.
~74%
~22%
Source: MEC Intelligence; Quartz+Co analysis
% CAGR (2012-2015)
APPENDIX
% CAGR (2010-2015)
High/Large
Low/Small
ESTIMATE
INDICATIVE
Government support
Addressable market
Solution attractiveness
Five-year market growth potential
Market accessibility
Profit opportunity
Government support
Addressable market
Solution attractiveness
Five-year market growth potential
Market accessibility
Profit opportunity
Government support
Addressable market
Solution attractiveness
Five-year market growth potential
Market accessibility
Profit opportunity
Government support
Addressable market
Solution attractiveness
Five-year market growth potential
Market accessibility
Profit opportunity
Government support
Addressable market
Solution attractiveness
Five-year market growth potential
Market accessibility
Profit opportunity
Government support
Addressable market
Solution attractiveness
Five-year market growth potential
Market accessibility
Profit opportunity
27
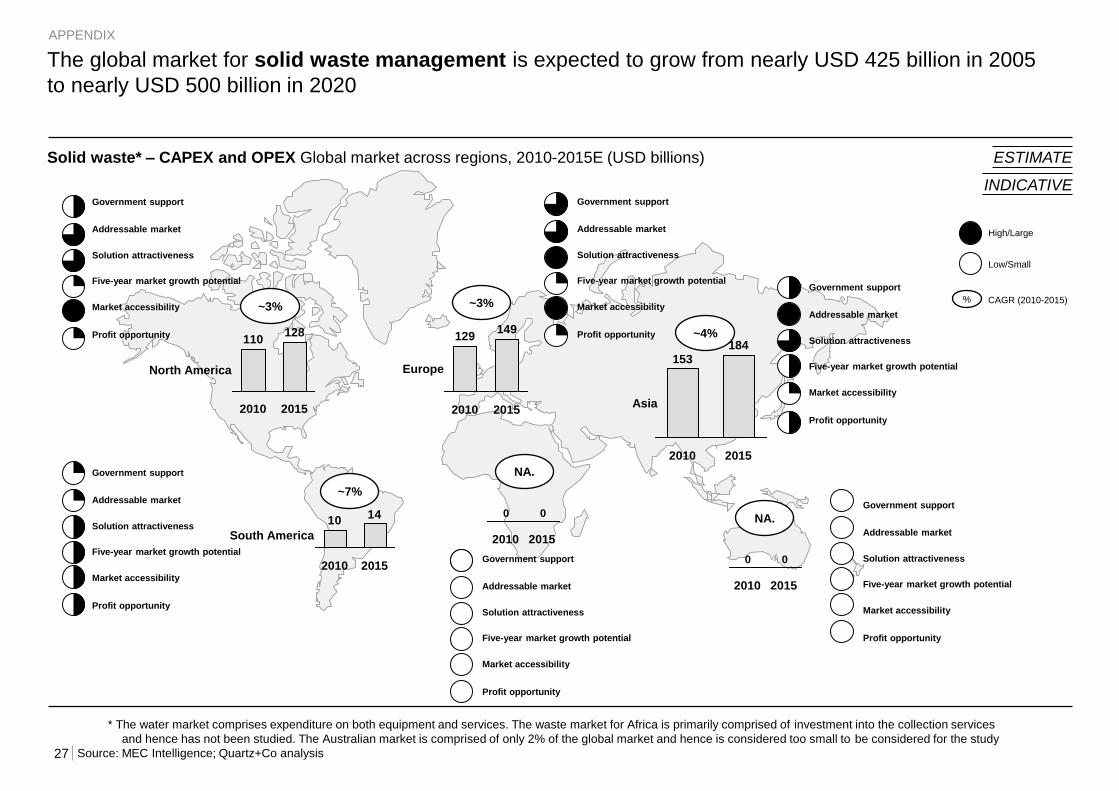
The global market for solid waste management is expected to grow from nearly USD 425 billion in 2005
to nearly USD 500 billion in 2020
Solid waste* – CAPEX and OPEX Global market across regions, 2010-2015E (USD billions)
~3%
~7%
~4%
~3%
* The water market comprises expenditure on both equipment and services. The waste market for Africa is primarily comprised of investment into the collection services
and hence has not been studied. The Australian market is comprised of only 2% of the global market and hence is considered too small to be considered for the study
Source: MEC Intelligence; Quartz+Co analysis
2010
153
2015
184
Asia 2010 2015
Europe
129 149
2010 2015
North America
110 128
1410
2010 2015
South America
APPENDIX
00
2015 2010
00
2015 2010
NA.
NA.
% CAGR (2010-2015)
High/Large
Low/Small
ESTIMATE
INDICATIVE
Government support
Addressable market
Solution attractiveness
Five-year market growth potential
Market accessibility
Profit opportunity
Government support
Addressable market
Solution attractiveness
Five-year market growth potential
Market accessibility
Profit opportunity
Government support
Addressable market
Solution attractiveness
Five-year market growth potential
Market accessibility
Profit opportunity
Government support
Addressable market
Solution attractiveness
Five-year market growth potential
Market accessibility
Profit opportunity
Government support
Addressable market
Solution attractiveness
Five-year market growth potential
Market accessibility
Profit opportunity
Government support
Addressable market
Solution attractiveness
Five-year market growth potential
Market accessibility
Profit opportunity
28
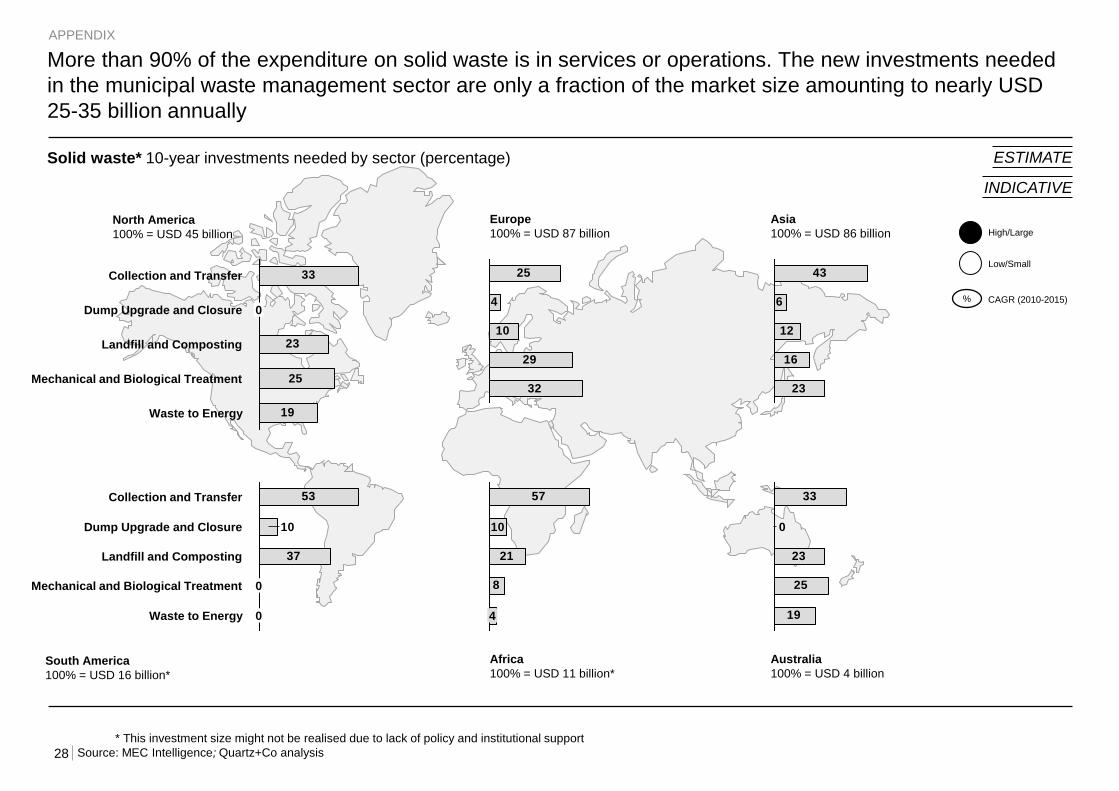
More than 90% of the expenditure on solid waste is in services or operations. The new investments needed
in the municipal waste management sector are only a fraction of the market size amounting to nearly USD
25-35 billion annually
Solid waste* 10-year investments needed by sector (percentage)
* This investment size might not be realised due to lack of policy and institutional support
Source: MEC Intelligence; Quartz+Co analysis
57
21
8
10
4
Africa
100% = USD 11 billion*
43
12
16
23
6
Asia
100% = USD 86 billion
25
4
10
29
32
Australia
100% = USD 4 billion
Europe
100% = USD 87 billion
53
37
10
0
Mechanical and Biological Treatment
Waste to Energy
Dump Upgrade and Closure
Landfill and Composting
0
Collection and Transfer
South America
100% = USD 16 billion*
33
23
25
19
0
Landfill and Composting
Mechanical and Biological Treatment
Waste to Energy
Dump Upgrade and Closure
Collection and Transfer
North America
100% = USD 45 billion
33
23
25
19
0
APPENDIX
% CAGR (2010-2015)
High/Large
Low/Small
ESTIMATE
INDICATIVE
29
North America to be the largest bioenergy market in 2015 followed by South America and Europe –
Australia is growing rapidly
Bioenergy – CAPEX Global market across regions, 2010-2015E (USD billions)
~5%
North
America
South
America
Europe
Africa
Asia
Australia
~19%
~5%
~4%
~10%
~7%
Source: MEC Intelligence; Quartz+Co analysis
19
26
2010 2015
41 52
2015 2010
2010 2015
0 1
2015 2010
5 9
2010 2015
21 27
2010 2015
0 0
Biomass electricity production
Biofuel
APPENDIX
% CAGR (2010-2015)
High/Large
Low/Small
ESTIMATE
INDICATIVE
Government support
Addressable market
Solution attractiveness
Five-year market growth potential
Market accessibility
Profit opportunity
Government support
Addressable market
Solution attractiveness
Five-year market growth potential
Market accessibility
Profit opportunity
Government support
Addressable market
Solution attractiveness
Five-year market growth potential
Market accessibility
Profit opportunity
Government support
Addressable market
Solution attractiveness
Five-year market growth potential
Market accessibility
Profit opportunity
Government support
Addressable market
Solution attractiveness
Five-year market growth potential
Market accessibility
Profit opportunity
Government support
Addressable market
Solution attractiveness
Five-year market growth potential
Market accessibility
Profit opportunity
30
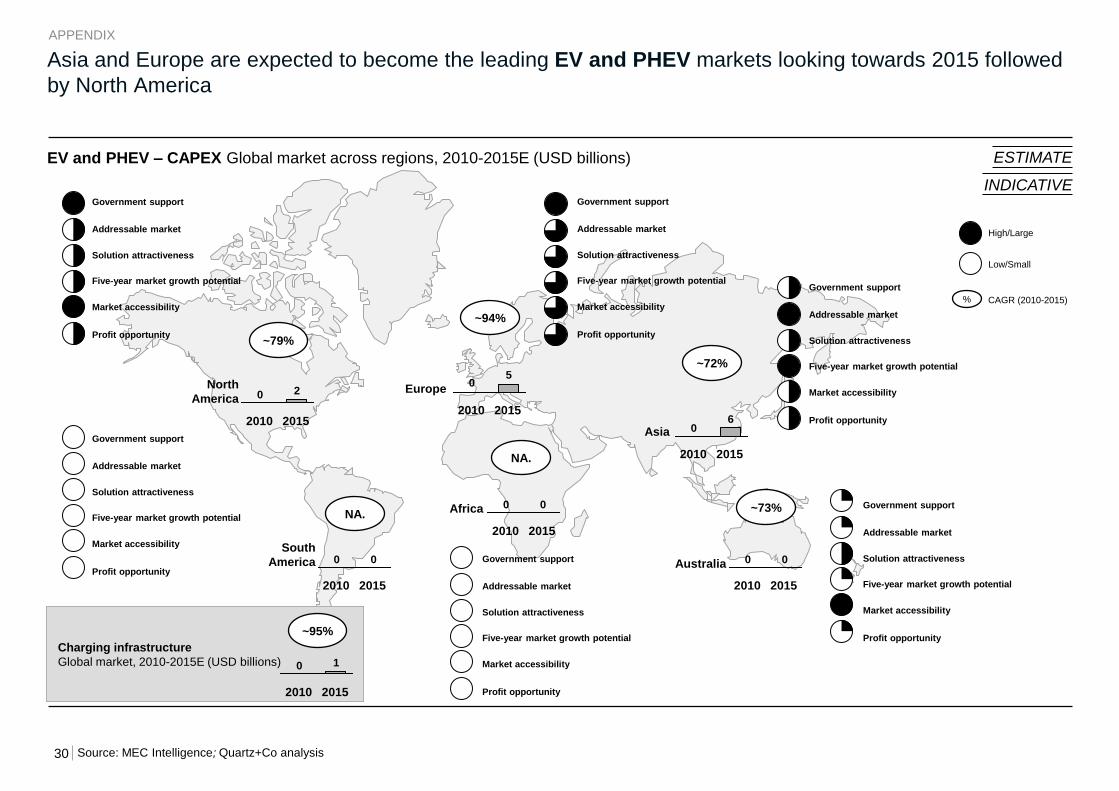
Asia and Europe are expected to become the leading EV and PHEV markets looking towards 2015 followed
by North America
EV and PHEV – CAPEX Global market across regions, 2010-2015E (USD billions)
~79%
20
2015 2010
50
2015 2010
00
2015 2010
00
2015 2010
00
2015 2010
60
2015 2010
North
America
South
America
Europe
Africa
Asia
Australia
~73% NA.
NA.
~72%
~94%
Source: MEC Intelligence; Quartz+Co analysis
Charging infrastructure
Global market, 2010-2015E (USD billions) 10
2015 2010
~95%
APPENDIX
% CAGR (2010-2015)
High/Large
Low/Small
ESTIMATE
INDICATIVE
Government support
Addressable market
Solution attractiveness
Five-year market growth potential
Market accessibility
Profit opportunity
Government support
Addressable market
Solution attractiveness
Five-year market growth potential
Market accessibility
Profit opportunity
Government support
Addressable market
Solution attractiveness
Five-year market growth potential
Market accessibility
Profit opportunity
Government support
Addressable market
Solution attractiveness
Five-year market growth potential
Market accessibility
Profit opportunity
Government support
Addressable market
Solution attractiveness
Five-year market growth potential
Market accessibility
Profit opportunity
Government support
Addressable market
Solution attractiveness
Five-year market growth potential
Market accessibility
Profit opportunity
31
Asia is poised to become the largest geothermal market in 2015 followed by North America and Europe
Geothermal – CAPEX Global market across regions, 2010-2015E (USD millions)
~11%
899
2015
1.530
2010
336
2015
1.096
2010
142
61
2015 2010
00
2015 2010
00
2010 2015
778
2015
1.922
2010
North
America
South
America
Europe
Africa
Asia
Australia
~18%
NA.
NA.
~20%
~27%
Source: MEC Intelligence; Quartz+Co analysis
APPENDIX
% CAGR (2010-2015)
High/Large
Low/Small
ESTIMATE
INDICATIVE
Government support
Addressable market
Solution attractiveness
Five-year market growth potential
Market accessibility
Profit opportunity
Government support
Addressable market
Solution attractiveness
Five-year market growth potential
Market accessibility
Profit opportunity
Government support
Addressable market
Solution attractiveness
Five-year market growth potential
Market accessibility
Profit opportunity
Government support
Addressable market
Solution attractiveness
Five-year market growth potential
Market accessibility
Profit opportunity
Government support
Addressable market
Solution attractiveness
Five-year market growth potential
Market accessibility
Profit opportunity
Government support
Addressable market
Solution attractiveness
Five-year market growth potential
Market accessibility
Profit opportunity
32
The top-30 megacities can be divided into six cleantech clusters with the Great Turks growing at the same
pace as Great BRIC+
Segment Cities
Rapid
urbanisation
Lagos
Karaci
Jakarta
Wuhan
Chongqing
Indian
megagrowth
Delhi
Mumbai Kolkotta
Wealth
creators
New York
Beijing
Tokyo
Shanghai
London
Seoul
Great BRIC+
Shenzen
Sao Paolo
Hong Kong
Moscow
Mexico City
Bangkok
Tianjin
Guangzhou
Hangzhou
Bangalore
Great Turks Istanbul
Izmir
American
Hotspots
Los Angeles
Houston
Chicago
Washington
APPENDIX
Note: The majority of these cities have set Eco city targets for e.g. emissions and have Eco city projects under way