105
Global cost benchmarking of cash equity clearing and settlement services Prepared for ASX Clear Pty Ltd and ASX Settlement Pty Ltd June 2014 www.oxera.com

Global cost benchmarking of cash equity clearing and settlement services
Prepared for ASX Clear Pty Ltd and ASX Settlement Pty Ltd
June 2014
www.oxera.com

Oxera Consulting LLP is a limited liability partnership registered in England No. OC392464, registered office: Park Central, 40/41 Park End Street, Oxford, OX1 1JD, UK. The Brussels office, trading as Oxera Brussels, is registered in Belgium, SETR Oxera Consulting Limited 0883 432 547, registered office: Stephanie Square Centre, Avenue Louise 65, Box 11, 1050 Brussels, Belgium. Oxera Consulting GmbH is registered in Germany, no. HRB 148781 B (Local Court of Charlottenburg), registered office: Torstraße 138, Berlin 10119, Germany.
Although every effort has been made to ensure the accuracy of the material and the integrity of the analysis presented herein, the Company accepts no liability for any actions taken on the basis of its contents.
No Oxera entity is either authorised or regulated by the Financial Conduct Authority or the Prudential Regulation Authority. Anyone considering a specific investment should consult their own broker or other investment adviser. We accept no liability for any specific investment decision, which must be at the investor’s own risk.
© Oxera, 2014. All rights reserved. Except for the quotation of short passages for the purposes of criticism or review, no part may be used or reproduced without permission.
Global cost benchmarking of cash equity clearing and settlement services Oxera

Global cost benchmarking of cash equity clearing and settlement services Oxera
Overview
ASX Clear Pty Ltd and ASX Settlement Pty Ltd (‘ASX’) commissioned Oxera to benchmark the costs of using its cash equity post-trading (clearing and settlement) services against the costs of using the services provided by other financial market infrastructures (FMIs).
A ‘user-profile’ approach was adopted to assess the costs. This involved designing profiles representative of investors and brokers in the Australian cash equity market, and applying these profiles to FMIs’ fee schedules. The profiles were consulted upon with the Business Committee and other local Australian stakeholders. In the case of ASX, the cost estimates have been verified through analysis of ASX’s clearing and settlement revenues, which in the financial year of 2012/13 totalled: A$42m and A$40m respectively.
The sample of comparator FMIs is not intended to be exhaustive, but has been selected to include FMIs operating at a larger scale than ASX, and to cover a range of financial centres across Asia-Pacific, Europe, and the Americas.
The overall conclusion from this analysis is that the fees charged by ASX for post-trading services—of 0.3–0.6 basis points (bp) relative to the value traded for institutional investors, and 0.9–2.0bp for retail investors—are within the range that FMIs of a comparable size charge to investors with the same trading characteristics.
In relation to the nine FMIs that charge separately for CCP-type and CSD-type services, ASX is at the low end of the range for fees charged for CSD services and at the high end of the range for fees charged for CCP services. There are two likely reasons for the latter: the FMIs for which CCP fees are distinct operate at a greater scale than ASX; and ASX has more of its own funds at risk than all of the comparators. Once the contribution of ASX to the default fund is taken into account, the overall cost to users of ASX Clear is closer to the middle of the range observed elsewhere.

Global cost benchmarking of cash equity clearing and settlement services Oxera
Executive summary
Objectives and methodology
ASX Clear Pty Ltd and ASX Settlement Pty Ltd (ASX) commissioned Oxera to benchmark the costs of using its cash equity post-trading (clearing and settlement) services against the costs of using the services provided by a range of other financial market infrastructures (FMIs). (Section 1 sets out the full scope of this report.)
A ‘user-profile’ approach was adopted to assess the costs. This involved designing profiles representative of investors and brokers active in the focal market (in this case, the Australian cash equity market), and applying these profiles to the FMIs’ fee schedules. The result is an estimate, from an Australian user perspective, of the costs of using the trading and post-trading services of the various FMIs.
This is a well-established approach and has been used by Oxera, regulatory authorities, and FMIs in previous studies of securities trading and post-trading, as well as in studies in other sectors. Section 2 of this report describes the methodology, and section 3 presents the results.
To ensure robustness of the analysis and its conclusions, a number of complementary pieces of analysis were conducted.
Revenue analysis—for Australia, the unit cost estimates based on the user-profile analysis were cross-checked with participant- and aggregate-level billing information from ASX. ASX’s clearing and settlement revenues at a participant and aggregate level were divided by the associated value of trading to provide a top-down estimate of the unit cost.
A sensitivity analysis was undertaken to test whether the results of the user-profile analysis are robust to changes in the assumptions about how investors and intermediaries trade.
A service comparison of the post-trading services across financial centres was undertaken to assess whether there are any significant differences in service offerings and/or cost differences to users of FMIs over and above those arising from variations in the explicit fees charged.
A number of standard financial metrics were analysed to put the cost benchmarking analysis into a wider context and to assess the significance of other potential revenue streams.
Although the analysis is based on a well-established methodology, considers a wide range of financial centres, and uses various sources of information, any analysis is inevitably subject to a number of limitations. For example, while ASX now publishes separate financial accounts for its cash equities clearing and settlement activities (as part of its commitments under the Code of Practice), in general other FMIs do not, so a revenue analysis across FMIs for post-trading services alone is not possible.
Results of the international cost benchmarking
Figures 1 and 2 below present the costs of trading and post-trading services provided by each FMI to a typical Australian institutional and retail investor, relative to the total value of trades cleared and settled by the associated trading platform.

Global cost benchmarking of cash equity clearing and settlement services Oxera
Explanatory note: Figure 1 presents the results for a small long-only fund managerusing medium-sized intermediaries, and Figure 3 presents the results for a frequent retail investor using an online broker. This analysis, which is repeated for alternative Australian institutional and retail profiles (see Appendix 3), shows that there is not much variation in the results for institutional investors. The same does not hold for Australian retail investors, which vary more significantly in terms of their trading velocity and order size. As such, the costs for post-trading services can differ more materially between investors at the same FMI. The results for the frequent retail investor are presented here, given that, for this profile, ASX appears higher in cost than for the other retail investor profiles considered (owing to the smaller order size).
Figure 1 Relationship between the fees for FMI trading and post-trading services (for institutional investors) and the value of trades
Source: Oxera analysis.

Global cost benchmarking of cash equity clearing and settlement services Oxera
Figure 2 Relationship between the fees for FMI trading and post-trading services (for retail investors) and the value of trades
Source: Oxera analysis.
Figures 3 and 4 repeat this analysis, but present the costs for post-trading services only.
Figure 3 Relationship between the fees for FMI post-trading services (for institutional investors) and the value of trades
Source: Oxera analysis.
Australia
Hong Kong
Singapore
Japan
Korea
Brazil
Canada
Germany
France
UK (EuroCCP)
UK (LCH.Clearnet)
Spain
Switzerland
Denmark
0
2
4
6
8
10
12
14
16
18
20
0 500 1,000 1,500 2,000 2,500 3,000 3,500 4,000
Tra
din
g a
nd
po
st-
tra
din
g f
ees (b
p)
Value of trading (AU$ bn)
USA (AU$13.6tn, 0.33bp)
Australia
Hong Kong
Singapore
Japan
Korea
Brazil
CanadaGermany
France
UK (EuroCCP)
UK (LCH.Clearnet)
Spain
Switzerland
Denmark
0.0
0.5
1.0
1.5
2.0
2.5
3.0
3.5
4.0
4.5
5.0
0 500 1,000 1,500 2,000 2,500 3,000 3,500
Po
st-
tra
din
g fe
es (b
p)
Value of trading (AU$ bn)
USA (AU$13.6tn, 0.03bp)
Po
st-
tra
din
g fe
es (b
p)
Value of trading (AU$ bn)

Global cost benchmarking of cash equity clearing and settlement services Oxera
Figure 4 Relationship between the fees for FMI post-trading services (for retail investors) and the value of trades
Source: Oxera analysis.
Figures 1 to 4 highlight two key findings:
there is some evidence of economies of scale in the provision of trading and post-trading services—the costs of services provided by FMIs generally decrease as the total value of trades cleared and settled increases. This trend is visible when trading and post-trading costs are considered together (Figures 1 and 2) and when post-trading costs are considered in isolation (Figures 3 and 4);
holding user characteristics constant, the fees charged by ASX are within the range charged by FMIs of a comparable size. This finding is consistent when trading and post-trading costs are considered together and when post-trading costs are considered in isolation.
Figure 5 and Figure 6 present the total post-trading fees for the full set of Australian-based institutional and retail investors, with the FMIs listed in ascending order of fees. (Both figures have been truncated to allow for easier comparison of the results for FMIs closer in price to ASX.)
Australia
Hong Kong
Singapore
Japan
Korea
Brazil
Canada
Germany
France
UK (EuroCCP) UK (LCH.Clearnet)
Spain
Switzerland
Denmark
0
1
2
3
4
5
6
0 500 1,000 1,500 2,000 2,500 3,000 3,500 4,000
Po
st-
tra
din
g fe
es (b
p)
Value of trading (AU$ bn)
USA (AU$13.6tn, 0.15bp)

Global cost benchmarking of cash equity clearing and settlement services Oxera
Figure 5 Total post-trading fees (basis points, bp) for four Australian institutional investor profiles
Note: The results in the figure are truncated at 2bp. FMIs in the shaded area have fees exceeding this value. See Figure 3.6a in the main report for the full results.
Source: Oxera analysis.
Figure 5 shows that, for Australian-based institutional investors, the fees of post-trading services provided by the FMIs appear to fall into three groups:
those with fees in excess of 2bp—FMIs in Singapore, Brazil and Spain;
those with fees between around 0.2bp and 1.2bp—this is the largest group, covering FMIs in Australia, Hong Kong, Japan, France, Germany, Canada, Denmark and the UK (EuroCCP and LCH.Clearnet);
those with fees well below 0.2bp—FMIs in Korea and the USA.
Global cost benchmarking of cash equity clearing and settlement services Oxera
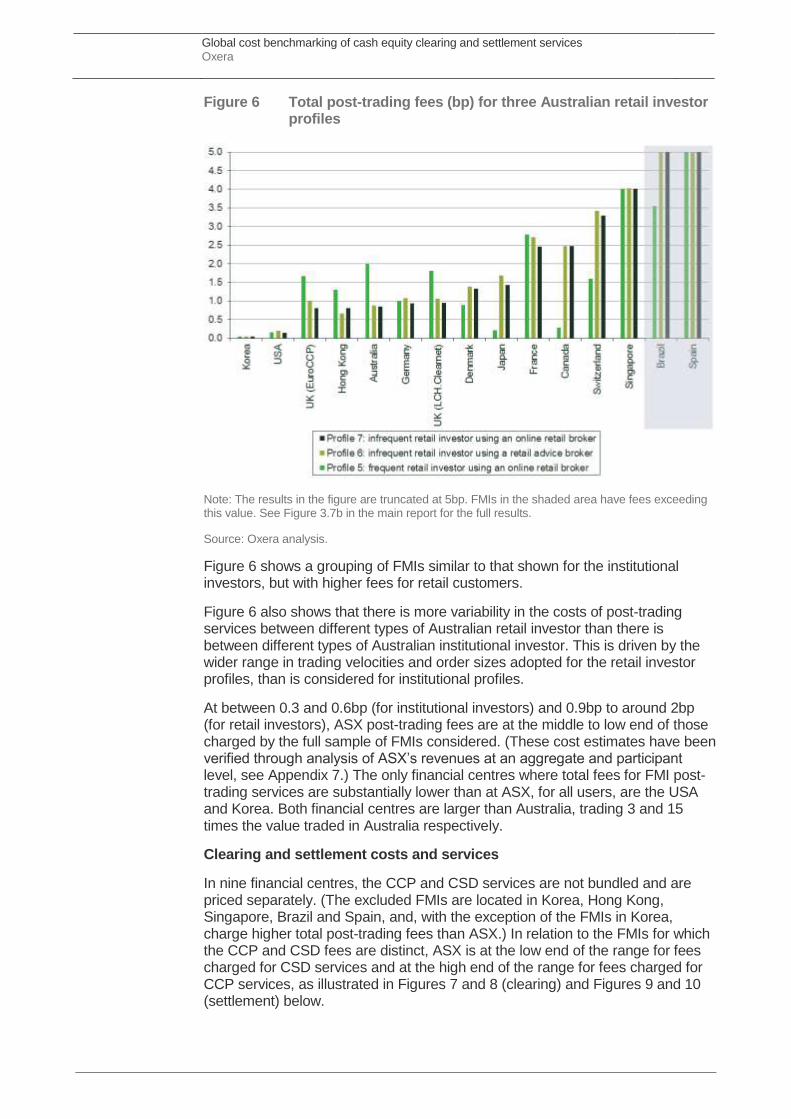
Figure 6 Total post-trading fees (bp) for three Australian retail investor profiles
Note: The results in the figure are truncated at 5bp. FMIs in the shaded area have fees exceeding this value. See Figure 3.7b in the main report for the full results.
Source: Oxera analysis.
Figure 6 shows a grouping of FMIs similar to that shown for the institutional investors, but with higher fees for retail customers.
Figure 6 also shows that there is more variability in the costs of post-trading services between different types of Australian retail investor than there is between different types of Australian institutional investor. This is driven by the wider range in trading velocities and order sizes adopted for the retail investor profiles, than is considered for institutional profiles.
At between 0.3 and 0.6bp (for institutional investors) and 0.9bp to around 2bp (for retail investors), ASX post-trading fees are at the middle to low end of those charged by the full sample of FMIs considered. (These cost estimates have been verified through analysis of ASX’s revenues at an aggregate and participant level, see Appendix 7.) The only financial centres where total fees for FMI post-trading services are substantially lower than at ASX, for all users, are the USA and Korea. Both financial centres are larger than Australia, trading 3 and 15 times the value traded in Australia respectively.
Clearing and settlement costs and services
In nine financial centres, the CCP and CSD services are not bundled and are priced separately. (The excluded FMIs are located in Korea, Hong Kong, Singapore, Brazil and Spain, and, with the exception of the FMIs in Korea, charge higher total post-trading fees than ASX.) In relation to the FMIs for which the CCP and CSD fees are distinct, ASX is at the low end of the range for fees charged for CSD services and at the high end of the range for fees charged for CCP services, as illustrated in Figures 7 and 8 (clearing) and Figures 9 and 10 (settlement) below.

Global cost benchmarking of cash equity clearing and settlement services Oxera
Clearing
Figures 7 and 8 show the relative positions of ASX on the price of clearing services for institutional and retail investors respectively, annotated with an indication of the impact of ASX’s funding of the default fund on user costs. (The value of trades at the relevant trading platform is reported to account for the variations in scale of operations.)
Figure 7 Fees for CCP services (bp)—institutional profiles
Source: Oxera.
Figure 8 Fees for CCP services (bp)—retail profiles
Source: Oxera.
0.00
0.05
0.10
0.15
0.20
0.25
0.30
0.35
0.40U
SA
A$
13
.6 tn
Ca
na
da
A$
1.3
tn
UK
(E
uro
CC
P)
A$
0.7
tn
De
nm
ark
A$
0.6
tn
Sw
itze
rla
nd
A$
0.6
tn
Ge
rma
ny
A$
1.3
tn
Fra
nce
A$
0.9
tn
Ja
pa
nA
$3
.1 tn
UK
(L
CH
.Cle
arn
et)
A$
1.2
tn
Au
str
alia
A$
0.9
tn
Profile 1 Profile 2 Profile 3 Profile 4
Estimate of user cost savings from
default fund arrangements
0.00
0.05
0.10
0.15
0.20
0.25
0.30
0.35
US
AA
$1
3.6
tn
Ca
na
da
A$
1.3
tn
De
nm
ark
A$
0.6
tn
UK
(E
uro
CC
P)
A$
0.7
tn
Ja
pa
nA
$3
.1 tn
Fra
nce
A$
0.9
tn
Sw
itze
rla
nd
A$
0.6
tn
Ge
rma
ny
A$
1.3
tn
Au
str
alia
A$
0.9
tn
UK
(L
CH
.Cle
arn
et)
A$
1.2
tn
Profile 5 Profile 6 Profile 7
Estimate of user cost savings from
default fund arrangements

Global cost benchmarking of cash equity clearing and settlement services Oxera
Although ASX is at the high end of pricing for CCP services, the service comparison (in section 4) shows that ASX Clear has more of its own funds at risk than all of the comparator CCPs. This in turn reduces the risks and costs faced by users of ASX. Once the contribution of ASX to the default fund is taken into account, the overall cost to users of ASX Clear is closer to the middle of the range observed elsewhere. The benefit to CCP users of ASX’s commitment to the default fund is conservatively estimated at between 0.04bp and 0.07bp. This is based on an assumed net cost of debt financing of between 2.7% and 5.2%. Applying a cost of equity to this capital would result in a higher estimate. (See Appendix 6 for the underlying calculations and assumptions.) ASX’s contribution to the default fund is consistent with its ranking based on return on equity being lower than when based on operating margins.
The service comparison identifies two other ways in which clearing services differ between FMIs. While these differences can have a material impact on users’ costs, they do not change the overall conclusions about the position of ASX in the cost benchmarking.
For trades executed on the BME (in Spain), no CCP or netting service is currently provided. For trades cleared at the CDS (the Canadian CCP), the timing of novation is the intended settlement date.
In addition to revenues from clearing fees, CCPs may earn revenues on the difference between the interest they earn on margins received from participants and what they themselves pay participants (‘net interest earned on participants’ margins’). However, for most CCPs (or FMIs with a CCP), the net interest earned on participants’ margins is small—for ASX Clear, for example, it is estimated to account for 2% of clearing revenues—and some CCPs (e.g. EuroCCP) have a policy of returning all interest to participants. This confirms that the approach taken within this report—of not adjusting for any net interest margin on participants’ margins and drawing user cost comparisons based on fee schedules—will not result in a materially different ranking of FMIs.
Settlement
Figures 9 and 10 below show the relative positions of ASX on settlement services for institutional and retail investors respectively. ASX tends to be towards the bottom of the range observed. (The value of trades at the relevant trading platform is reported to account for the variations in scale of operations.)

Global cost benchmarking of cash equity clearing and settlement services Oxera
Figure 9 Fees for CSD services (bp)—institutional profiles
Source: Oxera.
Figure 10 Fees for CSD services (bp)—retail profiles
Source: Oxera.
The relatively broad range of settlement costs can be explained by ASX’s fee of AU$1.30 per institutional settlement (i.e. the DvP message: message type 101) for institutional investors, and AU$0.90 per transfer to a sponsoring broker’s entrepot for retail investors. For order sizes of AU$400,000 (as assumed for the large long-only fund manager and large hedge fund profiles), ASX’s fee of AU$1.30 as a proportion of value traded is relatively low at 0.03bp, but increases to 0.22bp for order sizes of AU$60,000 (as assumed for the small hedge fund profile).
0.0
0.2
0.4
0.6
0.8
1.0
1.2
US
AA
$1
3.6
tn
Au
str
alia
A$
0.9
tn
De
nm
ark
A$
0.6
tn
Ge
rma
ny
A$
1.3
tn
UK
(L
CH
.Cle
arn
et)
A$
1.2
tn
UK
(E
uro
CC
P)
A$
0.7
tn
Ja
pa
nA
$3
.1 tn
Ca
na
da
A$
1.3
tn
Fra
nce
A$
0.9
tn
Sw
itze
rla
nd
A$
0.6
tn
Profile 1 Profile 2 Profile 3 Profile 4
0.0
0.5
1.0
1.5
2.0
2.5
3.0
3.5
US
AA
$1
3.6
tn
Au
str
alia
A$
0.9
tn
UK
(L
CH
.Cle
arn
et)
A$
1.2
tn
Ge
rma
ny
A$
1.3
tn
UK
(E
uro
CC
P)
A$
0.7
tn
De
nm
ark
A$
0.6
tn
Ja
pa
nA
$3
.1 tn
Fra
nce
A$
0.9
tn
Ca
na
da
A$
1.3
tn
Sw
itze
rla
nd
A$
0.6
tn
Profile 5 Profile 6 Profile 7

Global cost benchmarking of cash equity clearing and settlement services Oxera
Although the analysis has identified some differences in the settlement services provided by the FMIs, these do not materially change the conclusions about ASX’s position in the benchmarking.
Variations in netting efficiencies and fail rates between financial centres will have the most significant impact on user costs owing to the materiality of settlement, fail fees and buy-in costs. However, much of the variation in these metrics is driven by user characteristics (e.g. for netting efficiencies, the concentration of trading within a small number of stocks and/or a small number of brokers; and for fail rates, the efficiencies of the brokers’ and custodians’ back-office systems), rather than the FMI’s own efficiencies, which is the focus of the analysis in this study.
Conclusions from the sensitivity analysis
The user characteristic that most affects the cost of ASX’s post-trading services when considered as a proportion of the investor’s trade value is the size of the client’s order. As explained in the text below Figure 8, as the client’s order size increases, ASX’s fees (AU$1.30 per institutional settlement and AU$0.90 per transfer to a sponsoring broker’s entrepot account) become less material. This finding is not isolated to ASX; it affects other FMIs that charge for the transfer from the client’s (custodian’s) account to their broker’s account on a per-transaction basis (including, for example, Euroclear).
The sensitivity analysis also highlights that, owing to the volume discounts and fee caps available at various European CCPs and CSDs, the size (activity) of the intermediary can affect how the cost of post-trading services provided by ASX compares with the cost of services provided by other FMIs. For example, while clearing fees at ASX are not out of line with those charged by LCH.Clearnet Ltd for smaller brokers, for larger intermediaries ASX’s fees compare less favourably.
The final main finding from the sensitivity analysis is that the estimates for post-trading costs in Spain and trading costs in Switzerland are particularly sensitive to changes in the assumptions about how investors and intermediaries trade. The cost estimates for Spain and Switzerland are significantly lower when the average trade size of the broker is not based on the profile of Australian investors and brokers, but increased to a level that is more in line with what is observed in these markets.
Concluding remarks
The overall conclusion is that when taking into account the scale of trading, the costs of post-trading services in Australia are in line with the costs of similar services provided in financial centres of a comparable size. The revenue and sensitivity analysis, and the service comparison and financial metrics analysis, provide useful additional insights. Importantly, they do not change the overall conclusion of the cost benchmarking analysis.

Global cost benchmarking of cash equity clearing and settlement services Oxera
Contents
1 Introduction 1
1.1 Overview of report and information sources 1 1.2 Scope 3
2 International cost benchmarking methodology 4
2.1 Introduction 4 2.2 Identification of relevant services 5
2.3 Identifying relevant fees and translating them into costs 7 2.4 User profiles 10 2.5 Financial centres analysed 12
3 International cost benchmarking results 15
3.1 Economies of scale in FMI post-trading services 15
3.2 Costs for trading and post-trading services for different investors 25 3.3 Breakdown in costs between trading, CCP-type and CSD-type
services 28 3.4 Main results from sensitivity analysis 34
3.5 Conclusion: overview of ASX’s position based on user-profile analysis 41
4 Comparison of clearing and settlement systems 43
4.1 Risk management services 43
4.2 Settlement services 50 4.3 Conclusion 54
5 Analysis of financials 56
5.1 Objectives and scope 56
5.2 Overview of FMI businesses 56 5.3 Analysis of operating margins 57 5.4 Analysis of returns 59
5.5 Conclusions 61
A1 Interpretation of ASX’s cash equity clearing and settlement pricing schedules 63
A2 Overview of pricing schedules 65
A3 Economies of scale: additional charts 68
A3.1 Charts based on institutional profile 1 68
A3.2 Charts based on institutional profile 2 70 A3.3 Charts based on institutional profile 4 71
A3.4 Charts based on retail profile 6 73 A3.5 Charts based on retail profile 7 74
A4 Data tables 76
A5 Overview of market structures 79
A6 Calculation of the default fund cost 83
A7 ASX revenue analysis 86

Global cost benchmarking of cash equity clearing and settlement services Oxera
Box 4.1 Impact of different default waterfalls on user costs 44
Table 2.1 Types of services included and excluded from the user-profile
analysis 7 Table 2.2 Characteristics of investors 11 Table 2.3 Characteristics of intermediaries 12 Table 2.4 Investors and associated intermediaries 12 Table 2.5 Overview of FMIs considered 13 Table 2.6 Key characteristics of FMIs considered 14 Table 3.1 Main cost drivers 35 Table 4.1 Protection for non-defaulting participants funds 46 Table 4.2 Overview of netting efficiencies 52 Table 4.3 Overview of settlement dates and failure rates 53 Table 5.1 Total revenue and proportion of cash business 57 Table A1.1 Definition of relevant messages and fees 64 Table A2.1 Overview of pricing schedules—trading platforms 65 Table A2.2 Overview of pricing schedules—CCPs/CHs 66 Table A2.3 Overview of pricing schedules—CSDs 67 Table A4.1 Data for Figures 3.1 to 3.3 76 Table A4.2 Estimated trading, post-trading and total costs (bp) for
institutional profiles 1 to 4 76 Table A4.3 Estimated trading, post-trading and total costs (bp) for retail
profiles 5 to 7 77 Table A6.1 Calculation of the cost of the default fund for Australia 83
Figure 3.1a Relationship between the cost of FMI trading and post-trading
and value of trades—based on Australian user profile 3 16 Figure 3.1b Relationship between the cost of FMI trading and post-trading
and value of trades—based on local user profile 3 17 Figure 3.2 Relationship between the cost of post-trading (for institutional
investors) and the value of trades 19 Figure 3.3 Relationship between the cost of post-trading (for institutional
investors) and the number of trades 20 Figure 3.4 Relationship between the cost of trading and post-trading (for
retail investors) and the value of trades 22 Figure 3.5 Relationship between the cost of post-trading (for retail
investors) and the value of trades 23 Figure 3.6 Relationship between the cost of post-trading (for retail
investors) and the number of trades 24 Figure 3.7a Total trading and post-trading fees (bp) for four institutional
investor profiles 25 Figure 3.7b Total trading and post-trading fees (bp) for institutional
investor profiles—truncated axis 26 Figure 3.8a Total trading and post-trading fees (bp) for three retail investor
profiles 27 Figure 3.8b Total trading and post-trading fees (bp) for three retail investor
profiles—truncated axis 28 Figure 3.9a Trading (dark shading) and post-trading (light shading) fees
(bp) for institutional investors 29 Figure 3.9b Trading (dark shading) and post-trading (light shading) fees
(bp) for institutional investors—truncated axis 29 Figure 3.10a Trading (dark shading) and post-trading (light shading) fees
(bp) for retail investors 30 Figure 3.10b Trading (dark shading) and post-trading (light shading) fees
(bp) for retail investors—truncated axis 31

Global cost benchmarking of cash equity clearing and settlement services Oxera
Figure 3.11 Breakdown of fees between CCP-type services (dark shading) and CSD-type services (light shading) fee for institutional investors (bp) 32
Figure 3.12 Breakdown of fees between CCP-type services (dark shading) and CSD-type services (light shading) fee for retail investors (bp) 32
Figure 3.13a Variation in total trading and post-trading costs according to the investor’s order size (bp) 36
Figure 3.13b Variation in total trading and post-trading costs according to the investor’s order size (bp)—truncated 36
Figure 3.14a Variation in total trading and post-trading costs according to the velocity of investor (bp) 37
Figure 3.14b Variation in total trading and post-trading costs according to the velocity of investor (bp)—truncated 38
Figure 3.15a Variation in total trading and post-trading costs according to the average trade size of broker (bp) 39
Figure 3.15b Variation in total trading and post-trading costs according to the average trade size of broker (bp)—truncated 39
Figure 3.16a Variation in total trading and post-trading costs according to the size of the broker (bp) 40
Figure 3.16b Variation in total trading and post-trading costs according to the size of the broker (bp)—truncated 41
Figure 4.1 Settlement processes at omnibus and end-investor account CSDs 51
Figure 5.1 Post-tax net earning margins 59 Figure 5.2 Post-tax return on equity 60 Figure 5.3 Profit after tax relative to tangible assets 61 Figure A1.1 Post-trading services provided by ASX for institutional clients 63 Figure A1.2 Post-trading services provided by ASX for retail clients 63 Figure A3.1 Total cost of trading and post-trading relative to value of
trading for institutional profile 1 68 Figure A3.2 Post-trading costs relative to value of trading for institutional
profile 1 69 Figure A3.3 Post-trading costs relative to the number of trades for
institutional profile 1 69 Figure A3.4 Total costs of trading and post-trading relative to value of
trading for institutional profile 2 70 Figure A3.5 Post-trading costs relative to value of trading for institutional
profile 2 70 Figure A3.6 Post-trading costs relative to the number of trades for
institutional profile 2 71 Figure A3.7 Total costs of trading and post-trading relative to value of
trading for institutional profile 4 71 Figure A3.8 Post-trading costs relative to value of trading for institutional
profile 4 72 Figure A3.9 Post-trading costs relative to the number of trades for
institutional profile 4 72 Figure A3.10 Total costs of trading and post-trading relative to value of
trading for retail profile 6 73 Figure A3.11 Post-trading costs relative to value of trading for retail profile 6 73 Figure A3.12 Post-trading costs relative to the number of trades for retail
profile 6 74 Figure A3.13 Total costs of trading and post-trading relative to value of
trading for retail profile 7 74 Figure A3.14 Post-trading costs relative to value of trading for retail profile 7 75

Global cost benchmarking of cash equity clearing and settlement services Oxera
Figure A3.15 Post-trading costs relative to the number of trades for retail profile 7 75
Figure A5.1 Types of market structure 79 Figure A7.1 Comparison of ASX clearing revenues from various
participants and user-profile results 86 Figure A7.2 Comparison of ASX settlement revenues from various
participants and user-profile results 87
Global cost benchmarking of cash equity clearing and settlement services Oxera
1
1 Introduction
In December 2012, the Council of Financial Regulators in Australia (the Council) prepared a report for the Australian government analysing responses to a discussion paper on competition in the clearing and settlement of Australian cash equities.1 The Council found mixed views on whether competition in clearing would deliver net benefits to the Australian financial system, and therefore recommended a cautious approach to the introduction of competition. In particular, it advised that a decision on any licence application from a central counterparty (CCP) seeking to compete in the Australian cash equities market be deferred.
During this two-year period, the Australian Securities Exchange (ASX) has worked with stakeholders to develop a code of practice for clearing and settlement of cash equities in Australia (the Code).2 The Code is based on three principles: i) user input to governance, ii) transparent and non-discriminatory pricing and iii) access to clearing and settlement services.
One of the commitments made by ASX within the Code was to commission an independent consultancy to benchmark the cash equity costs of clearing and settlement (i.e. post-trading) services provided by ASX Clear and Settlement, and to publish the results on the ASX website. Oxera was selected to deliver this analysis, and this report presents the results of the research.
1.1 Overview of report and information sources
This report focuses on international cost benchmarking of ASX’s post-trading services. For completeness, trading services have also been considered.
The costs of using trading and post-trading services were assessed by taking a user-profile approach: profiles representative of investors and brokers active in the Australian cash equity market were designed and then applied to the fee schedules of financial market infrastructure providers (FMIs) to give an estimate of the costs of using trading and post-trading service from an Australian user perspective.
This approach is well-established and has been used by Oxera, regulatory authorities and FMIs in studies of securities trading and post-trading, as well as in studies in other sectors.3 Section 2 describes the methodology and section 3 presents the results.
To ensure robustness of the analysis and its conclusions, a number of complementary pieces of analysis were conducted.
Revenue analysis—for Australia, the unit cost estimates based on the user-profile analysis were cross-checked by undertaking a revenue analysis, whereby the revenues in relation to trading and post-trading services were divided by the relevant value of transactions. The user-profile analysis was consistent with this revenue analysis (see Appendix 7).
1 Council of Financial Regulators (2012), ‘Competition in clearing Australian cash equities: conclusions’, December.
2 ASX (2013), ‘Code of Practice for Clearing and Settlement of Cash Equities in Australia’, 9 August,
3 See, for example, Oxera (2012), ‘What would be the costs and benefits of changing the competitive structure of the market for trading and post-trading services in Brazil?’, prepared for Comissão de Valores Mobiliários, June; Oxera (2010), ‘Costs of securities trading and post-trading—UK equities’, prepared for Euroclear, 26 February; and Oxera (2006), ‘The price of banking: an international comparison’, report prepared for British Bankers’ Association, November.

Global cost benchmarking of cash equity clearing and settlement services Oxera
2
A sensitivity analysis was undertaken to test whether the results of the user-profile analysis are robust to changes in the assumptions about how investors and intermediaries trade (section 3.4).
A comparison of the services and market structure across financial centres was undertaken to assess whether there are any significant cost differences to users of FMIs over and above those arising from variations in the explicit fees charged (section 4).
A number of standard financial metrics were analysed to put the cost benchmarking analysis into a wider context and assess the significance of potential other revenue streams (section 5).
Oxera’s analysis has been informed by a range of data sources and interviews.
In order to inform the design of the user profiles, ASX provided data on the number of trades, settlement instructions and value of trades cleared. Billing information aggregated at a participant level was also provided to verify the results of the user-profile analysis with average fees paid by different participant types (Appendix 7).
Interviews were held with a range of firms providing brokerage, clearing and settlement services in the Australian cash equity market. These firms included international participants and firms predominately servicing the needs of retail or institutional clients. The interviews were valuable in informing the design of user profiles representative of Australian cash equity market participants, and in identifying the features that distinguish the ASX settlement system from other global systems.
Discussions were held with the FMIs included in the analysis. These discussions were valuable in understanding the nuances of the clearing and settlement services and systems in each jurisdiction and how to interpret each FMI’s pricing schedule and financial statements. The discussions also provided an opportunity to verify the results of the user-profile analysis and review the main cost drivers.
In the case of ASX, these discussions, and the subsequent provision of non-public data, indicated that the previous Oxera analysis for ASX in 2013 and for SEC Brazil in 20124 had applied overly conservative assumptions to the estimation of ASX’s settlement costs. In addition to a settlement fee of the AU$1.30 and a confirmation fee of AU$0.30, a fee of AU$0.90 for CHESS sub-register transfers and conversions was applied for the settlement of each client order. This has been amended and the user-profile estimates in this report have been verified against actual fees paid by participants (Appendix 4).
The financials analysis is based on publicly available, audited financial statements. In general, these statements report the financial results consolidated across the whole business of the FMI, and are therefore not specific to clearing and settlement services for the cash equity market. The exception is ASX, which, in line with its commitments within the Code of Practice, has published audited segregated accounts for its cash equity post-trading businesses: ASX Clearing and ASX Settlement.
4 Oxera (2013), ‘The Trading and Post-Trading Monitor’, prepared for ASX, July; and Oxera (2012), ‘What would be the costs and benefits of changing the competitive structure of the market for trading and post-trading services in Brazil?’, prepared for Comissão de Valores Mobiliários, June.

Global cost benchmarking of cash equity clearing and settlement services Oxera
3
Statistics reported by the Bank of International Settlements, the European Central Bank, and the European Association of Central Security Depositaries were complemented by service-level descriptions and website reviews to identify the distinguishing features of clearing and settlement services offered by each FMI. As noted above, this desk-top research was complemented by calls with the relevant FMIs.
1.2 Scope
Financial centres included
The analysis covers the following financial centres and regions:
Americas: USA, Canada, Brazil;
Europe: the UK, Germany, France, Spain, Switzerland and Denmark;
Asia-Pacific: Australia, Japan, Hong Kong, Singapore, and Korea.
These financial centres provide a cross-section of jurisdictions by region, size of market, market structure and stage of development.
In the case of Europe, where there are many clearing providers, the CCPs with the largest market shares have been estimated.
Services captured
In line with the commitments made by ASX set out in the Code, Oxera’s research focus is on the post-trading services provided for transactions in cash equities. For completeness, trading fees are included in the user-profile cost benchmarking of ASX services. Analysis of the financial metrics of FMIs and the differences in services provided focuses on post-trading services only.
Even within post-trading services, ASX Clear and ASX Settlement provide an array of services. Oxera’s research has focused on the services directly relating to the clearing and settlement of cash equity transactions executed on exchange and novated for clearing at the CCP.
Profiles captured
Stylised user profiles have been designed to capture the most common ways in which investors and their associated trading and post-trading intermediaries trade in the Australian cash equity market. These include three retail investor profiles and four institutional investor profiles around which sensitivity analysis has been performed. The design of the user profiles was informed by data on the Australian cash equity market.
Acknowledgement
This study has been conducted in cooperation with financial market infrastructures, brokers and investors, trade associations and other organisations. Oxera is grateful to the many people involved in the study, whose cooperation and contribution have made it possible. Any errors, however, remain those of Oxera.

Global cost benchmarking of cash equity clearing and settlement services Oxera
4
2 International cost benchmarking methodology
2.1 Introduction
The prices or costs of trading and post-trading services can be assessed by taking a user-profile or a revenue approach. For the former approach, user profiles are designed that represent investors and intermediaries in the focal financial centre—in this case, Australia. These profiles are then applied to the pricing schedules of the FMIs to give an estimate of the total charges paid by different types of investor in each financial centre. This is a well-established approach for estimating the costs of services when the costs incurred depend on the profile of the user, and has been used by Oxera, regulators, and infrastructure providers in studies of securities trading and post-trading, as well as in studies in other sectors.5
The second approach, the revenue approach, measures the unit cost for the trading and post-trading services according to the service providers’ revenues (divided by the number or value of transactions).
While both approaches have advantages and disadvantages, for the purposes of conducting like-for-like comparison across financial centres, a user-profile approach has certain advantages. By holding the profiles constant between financial centres, any cost differences found will reflect differences in price only, rather than differences in the way investor and brokers use the FMIs, which would also be reflected in revenues generated by the FMIs.
The way in which an investor and its intermediaries use FMI services can have significant impact on the costs incurred, particularly for settlement services. Another advantage of the user-profile approach is that it allows for detailed analysis of how costs vary between types of investor and broker, and why any such cost variations exist. For example, using a user-profile approach can distinguish between whether certain groups of investors are benefiting from lower per-unit costs for FMI services because they use larger intermediaries that are benefiting from substantial volume discounts provided by the FMI. Alternatively, the benefit may come from investors having high trading velocities, and therefore CSD fees charged according to the value of assets under management (at CSDs where these fees are applicable) appear small relative to the investor’s value of transactions. These are just two possible explanations for cost differences between investors. The user-profile approach also reduces the reliance on data provided by comparator FMIs relative to a revenue approach, and thus allows for a broader sample for analysis.
The following two sub-sections (sections 2.2 and 2.3) provide detail on: i) how the relevant services and fees have been identified; and ii) how the costs for users of these services have been calculated. For those familiar with the methodology from the 2013 analysis for ASX,6 these sections can be skipped.
5 See, for example, Oxera (2012), ‘What would be the costs and benefits of changing the competitive structure of the market for trading and post-trading services in Brazil?’, prepared for Comissão de Valores Mobiliários, June, Oxera (2010), ‘Costs of securities trading and post-trading—UK equities’, prepared for Euroclear, 26 February, and EuroCCP (2008), ‘The Clearing Industry in Europe: Cost Comparison’. For an example of the user-profile approach outside the area of securities trading and post-trading, see Oxera (2006), ‘The price of banking: an international comparison—a study prepared for the British Bankers’ Association’, November.
6 Or the Oxera analysis for CVM (SEC Brazil). See Oxera (2012), ‘What would be the costs and benefits of changing the competitive structure of the market for trading and post-trading services in Brazil?’, June.

Global cost benchmarking of cash equity clearing and settlement services Oxera
5
Section 2.4 describes the user profiles7 adopted in the analysis. These cover a range of retail and institutional investors and their associated trading and post-trading intermediaries, and have been based on data on the Australian cash equity market. The profiles focus on the most common ways in which retail, and institutional, investors trade in the Australian cash equity market, around which sensitivity analysis has been performed.
The institutional profiles assume that the investor’s executing broker is different to their prime broker (custodian). Therefore, for every investor order executed, it is assumed that there is a movement of securities between the client’s custodian’s account at the CSD and their executing broker’s account at the CSD.8
In the case of the retail profiles, for Australia the broker-sponsored system operated by ASX is taken into account and compared with the relevant systems operated by the other FMIs. Neither the retail nor institutional investors are assumed to participate in stock or margin lending activities. This assumption is made consistently across all FMIs. See Appendix 1 for illustrations of the post-trading fees included in the analysis for ASX.
Section 2.5 gives an overview of the FMIs included in this analysis, identifying the most salient features. This is complemented by section 4, which reviews the key differences in services and systems operated by each FMI, and section 5, which presents some financial statistics to provide insight into the differences in the business models operated.
The results of the user profile analysis, presented in section 3, consider the cost of using one trading-clearing-settlement system at a time. This allows for comparisons between, for example, the costs of trading, clearing and settling at ASX, and the costs of trading, clearing and settling through LSE-LCH.Clearnet-Euroclear UK&I. The analysis does not support comparisons between user costs when one or multiple CCPs provide clearing services for the same set of securities. In a static analysis, splitting flow between two CCPs is likely to increase costs to a user, although to what extent will depend on the degree to which the user has offsetting positions at each CCP—a characteristic that varies by time as well as by user. A dynamic analysis could also find cost savings depending on the effectiveness of competition.
2.2 Identification of relevant services
This analysis focuses on the fees charged by FMIs in each financial centre for the following types of service:
trading services—in particular, the acceptance, prioritisation and matching of trading instructions by trading venues, to execute a trade;
counterparty risk clearing services (CCP-type services), which capture:
clearing—the preparation of a transaction for settlement, which comprises trade netting (bundling multiple transactions into a single settlement order), and settlement instruction (processing the matched and netted trades to be sent for settlement);
7 The term ‘user profile’ is used to refer to the investor and its trading and post-trading intermediaries collectively.
8 Executing and prime brokers are both assumed to be direct clearing participants.

Global cost benchmarking of cash equity clearing and settlement services Oxera
6
risk management—this is often provided through novation, in which case the FMI becomes the counterparty to each side of a transaction. (The exception in this analysis is for trades executed on the BME, which has adopted a different risk management service);
settlement and custody services (CSD-type services):
settlement includes pre-settlement positioning (ensuring that the buyer has the monies available and the seller the securities available) and the completion of a transaction through the transfer of ownership of assets and monies;
custody and safekeeping involve account provision (at the end-investor or intermediary level), and, to varying degrees of detail between different CSDs, the management of corporate actions (as discussed in section 4.3).
The main focus of this benchmarking study is on post-trading services, but, as explained, an analysis of trading fees has also been included. This analysis does not include an analysis of the fees for market data services. The fees for these services depend on factors such as the number of terminals licensed by each investor and their intermediaries, which can vary considerably across the industry. At AU$55 per end-user per month,9 the fees charged by ASX for market data seem to be within the range of fees charged in Europe. For an economic analysis of market data fees in Europe and the USA, see Oxera (2014).10
Fees for fail management services have also not been included. This is because, in general, when a trade fails to settle on the settlement date, a buy-in process occurs, and a large component of the cost of failing to deliver securities on time to the broker depends on market liquidity and the outcome of the buy-in process, rather than the efficiencies of the services and systems operated by the FMI—the focus of this analysis. Section 4.3 gives an overview of the failure rates at different CCPs, and discusses the implications for users.
As noted in section 2.1, the benchmarking analysis estimates the cost of using one trading-clearing-settlement system at a time. This allows for comparisons between different sets of FMIs—for example, between the trading, clearing and settlement costs at ASX and the trading, clearing and settlement costs at NYSE-NSCC-DTC. However, it does not allow for direct comparisons of user costs where one or more CCPs provide clearing services for the same set of securities—for example, between the current structure in Australia and the various structures of multiple non-interoperating and interoperating CCPs present in Europe. Appendix 5 describes the market structures present in the financial centres considered as part of this analysis, setting out the main implications for user costs.
Rebates have been included according to the proportion of cash market revenue rebated to participants in 2013. This affects the results for Canada and Australia.
Table 2.1 clarifies the fees included in the analysis, and which services are outside scope.
9 From 1 July 2014, this fee is set to increase to A$65 per end-user per month.
10 Oxera (2014), ‘Pricing of market data services: an economic analysis’, February.

Global cost benchmarking of cash equity clearing and settlement services Oxera
7
Table 2.1 Types of services included and excluded from the user-profile analysis
Included Excluded
Trading Membership
Transaction fees
Connectivity
Market data
Clearing Membership
Novation
Risk management
Interoperability
Fail management and buy-in fees
Settlement Membership
Book entry fees for market settlements
Institutional settlements
Account-based fees—e.g. fees per account and per value of account
Specific account administration services charged for separately—e.g. changing account details, requesting additional statements
Non-trade-related services charged for separately—e.g. processing of corporate actions
Transactions to process stock lending
Source: Oxera.
Infrastructure providers charge for these services in different ways. It is usual for both fixed and variable fees to be charged. The fixed fees related to membership and access charges and the variable fees are per-transaction fees (see section 2.3 for further details). Both types are considered in this analysis.11 Variable fees can be applied per transaction, per value of transaction, or per share per transaction; or, in the case of safekeeping fees, per value of assets under management, per share under management, or per trading unit12 under management. It is also quite common for FMIs to use a combination of approaches. To be able to draw comparisons between the costs of trading and post-trading in each financial centre, all charges for each type of service have been aggregated and presented as a fee per value of transaction and per transaction, as explained in the following section.
2.3 Identifying relevant fees and translating them into costs
The sub-sections below explain in more detail how the total cost for each level of the value chain has been calculated.
2.3.1 Trading costs
Trading platforms charge for their trading services in different ways. As noted above, there is usually a fixed fee—an access and/or membership fee for each firm to use the trading platform—and a variable fee—a charge per transaction (common in Europe), per value of transaction (e.g. common in Asia-Pacific), or per share per transaction (e.g. Canada and the USA). Volume discounts, fee caps and/or minimum fees are also often applied. The total trading platform costs associated with each user profile can be calculated as follows.
Fixed fees can be converted into a fee per value of transaction by considering the total (average) value of trading within the relevant time period. The average value of trading is based on the assumptions of the user profile. For example, a monthly membership fee is divided by the average value of trading by the user in each month.
11
One-off application fees and connectivity costs have been excluded. When considered relative to typical volumes and values of trading, these fees are small and will not affect the results of the analysis.
12 A trading unit is the minimum number of shares that can be bought, or sold, in a stock. For example, for many of the stocks listed on Tokyo Stock Exchange, the trading unit is 100 shares.
Global cost benchmarking of cash equity clearing and settlement services Oxera
8
Per-transaction fees can be converted into a fee per value of transaction by considering the average trade size of the broker. For example, a per-transaction fee of AU$1 is equivalent to a 2bp fee for trades of AU$5,000 in value.
Per-share-per-transaction fees—in the case of US and Canadian costs, where charges are per share per transaction, it is also necessary to take into account the average number of shares per transaction (and their average price) in each financial centre, in order to calculate a fee per value of transaction. Data on the average value of a share is generally available from the stock exchange websites.
Volume discounts can be incorporated by considering the total value of trading (or number of transactions) undertaken within the time period to which the volume discounts apply. In financial centres where the trading platform fees are charged to the broker rather than directly to the end-investor, volume discounts are based on the volume of services purchased by the broker. Therefore, to incorporate the volume discount in these financial centres, the average volume of trading by brokers (i.e. not investors) needs to be considered. In financial centres where the discount is based on the volume of service purchased by the end-investor, the volume of trading by the end-investor needs to be considered. The value chain and pricing schedules in each financial centre have been carefully considered to ensure that the appropriate approach has been taken.
Minimum and maximum fees—some FMIs apply minimum fees per transaction, which can increase the costs of relatively small transactions; other FMIs apply maximum fees per transaction, which can reduce the cost of relatively large transactions. Such fee floors and caps have been incorporated into the analysis in relation to the average trade size of the user profiles.
The above descriptions show that the total cost can be presented per value of transaction, but can also be presented per transaction by dividing the total monthly cost by the average number of trades each month associated with the user profile, as follows:
Fee per transaction (Fp) Total cost for all transactions (C)
Total number of transactions (N) and average trade size A
Total value of all transactions ( )
Total number of transactions (N) and
Fee per value of transaction (Fbp) Total cost for all transactions (C)
Total value of all transactions ( ) So, Fbp =
Fp
A
2.3.2 CCP costs
Clearing and risk management services are typically charged on a pre- or post- transaction basis (pre-netting being per trade, or value of trade executed on the trading venue, and post-netting being per settlement instruction sent). Similar to trading platforms, CCPs often charge fixed fees (membership/access) and per-transaction fees, and may offer volume discounts. These have been incorporated into the analysis in the following ways.
Fixed fees are incorporated in the same way as fixed trading fees.
Volume discounts are incorporated more or less as in the case of trading fees—i.e. by considering the total value of trading undertaken within the time period to which the volume discounts apply. Where the clearing fees are charged to the clearing participant rather than directly to the end-investor (which is rarely the case), the volume discounts apply to the volume of activity

Global cost benchmarking of cash equity clearing and settlement services Oxera
9
of the clearing participant. This has been approximated by the average volume of activity by brokers.
Pre-netting transaction fees—the total cost associated with pre-netting transaction fees is calculated by applying the fee rate (including any volume discounts) to the number, or value, of transactions as determined in the user profile.
Post-netting transaction fees—to incorporate post-netting transaction fees, the number (or value) of post-netting transactions (settlement instructions) arising from executing the investor’s trades needs to be calculated first. The number of settlement instructions depends on the diversification of the investor’s trading orders—i.e. the number of different stocks the investor wishes to buy and/or sell; the extent to which the broker has clients with similar trading orders (and therefore the extent to which the clearing house can net transactions for each broker); and the netting efficiency of the clearing house. The netting efficiency assumed as part of the user profiles in this analysis is based on the netting efficiencies observed at ASX.
The total cost can be presented per transaction by dividing the total cost by the average number of trades associated with the user profile, or per value of transaction by dividing the total cost by the average value of trading associated with the user profile. (See the equations in section 2.3.1.)
2.3.3 CSD costs
In general, CSDs charge fixed fees (e.g. membership and access fees) and two types of variable fee: a fee relative to the transactions flowing through the CSD, on a pre- or post-netting basis (referred to in our analysis as ‘flow-based fees’); and a fee relative to the assets under management (referred to in our analysis as ‘stock-based fees’). CSDs in Asia-Pacific differ from this general rule, and tend not to charge a stock-based fee according to the amount of assets under management.13
In terms of transactions flowing through the CSD, for every client order there are in general two types of settlement processed by the CSD:
market settlements—the delivery of securities between the two intermediaries (brokers) trading on behalf of their clients. For example, message type156 (market batch settlement) at ASX Settlement;
institutional settlements—either the settlement of securities between a client’s custodian’s account to their broker’s account, prior to market settlement (for example, message type 101 (delivery versus payment) at ASX Settlement); or, where end-investor accounts are held at the CSD, the settlement of securities directly from a client’s account to their broker’s account. For example, as is the case of retail investors at ASX Settlement, where the relevant instruction is message type 001 (transfer message).
Volume discounts are common, particularly for the stock-based fee, in which case, where omnibus accounts are held, the volume discount is applied to the value of assets under custody of the intermediary (i.e. the custodian). Where end-investor accounts are held (e.g. in Brazil), the discounts apply to the value under custody held by the end-investor only.
13
JASDEC is the exception to this rule, charging a fee per trading unit held within an account.

Global cost benchmarking of cash equity clearing and settlement services Oxera
10
Fixed fees have been included in the analysis in exactly the same way as for trading platforms and CCPs, as have the costs associated with flow-based fees. Care has been taken to note whether there is an additional settlement instruction arising from the CCP’s involvement (as is the case, for example, at Euroclear UK&I) and incorporated as appropriate.
The steps taken to incorporate fees applied to the assets under management are as follows.
Value of assets under management—to estimate the cost associated with a given value of trading, it is necessary to consider how frequently the investor trades, and thus, for a given value of trading, what the average value of assets under management is expected to be. This has been estimated, with ASX’s assistance and in consultation with market participants, by considering the turnover velocity on ASX and the typical value of equity holdings by superannuation funds in Australia (for the institutional investor profiles)14 and the average value of holdings by retail investors (for the retail investor profiles).15
Volume of shares under management—in the case of Canada and the USA, some of the costs of providing CSD services are recovered through fees charged according to the number of shares held by the CSD on behalf of the investor, and, in the case of Japan, according to the number of trading units16 held by the CSD. To translate these fees into a cost relative to a specific value of trading, in addition to the step described directly above, it is necessary to take into account the average number of shares (or units) per transaction.
The total cost can be presented per transaction (by dividing the total cost by the average number of trades associated with the user profile), or per value of transaction (by dividing the total cost by the average value of trading associated with the user profile). (See the equations in section 2.3.1.)
2.4 User profiles
To estimate the costs of trading and post-trading provided by the FMIs for a representative range of investors in Australia, six investor profiles have been considered (detailed in Table 2.2).
14
As reported in KPMG (2011), ‘Superannuation trends and implications’, November. 15
As reported in ASX (2011), ‘2010 Australian share ownership study’. 16
Units refer to the minimum number of shares that an investor can choose to buy or sell in a particular stock listed on the Tokyo Stock Exchange. This is commonly around 100 shares.
Global cost benchmarking of cash equity clearing and settlement services Oxera
11
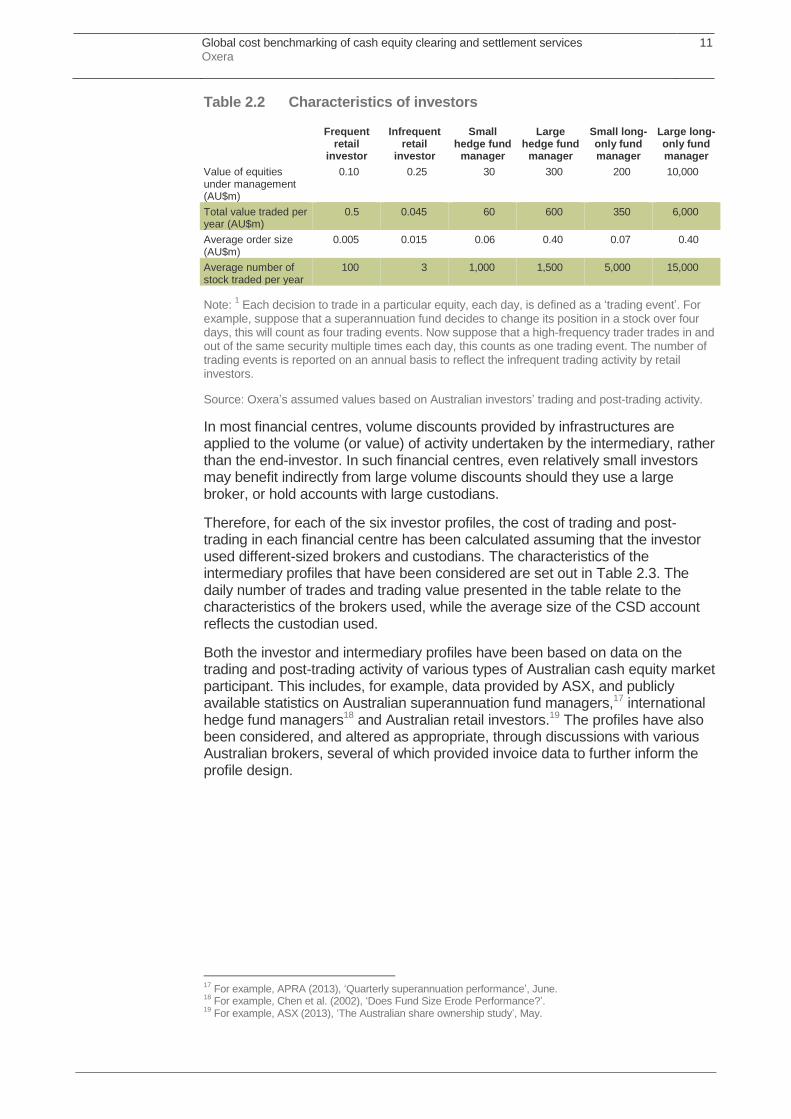
Table 2.2 Characteristics of investors
Frequent retail
investor
Infrequent retail
investor
Small hedge fund
manager
Large hedge fund
manager
Small long-only fund manager
Large long-only fund manager
Value of equities under management (AU$m)
0.10 0.25 30 300 200 10,000
Total value traded per year (AU$m)
0.5 0.045 60 600 350 6,000
Average order size (AU$m)
0.005 0.015 0.06 0.40 0.07 0.40
Average number of stock traded per year
100 3 1,000 1,500 5,000 15,000
Note: 1 Each decision to trade in a particular equity, each day, is defined as a ‘trading event’. For
example, suppose that a superannuation fund decides to change its position in a stock over four days, this will count as four trading events. Now suppose that a high-frequency trader trades in and out of the same security multiple times each day, this counts as one trading event. The number of trading events is reported on an annual basis to reflect the infrequent trading activity by retail investors.
Source: Oxera’s assumed values based on Australian investors’ trading and post-trading activity.
In most financial centres, volume discounts provided by infrastructures are applied to the volume (or value) of activity undertaken by the intermediary, rather than the end-investor. In such financial centres, even relatively small investors may benefit indirectly from large volume discounts should they use a large broker, or hold accounts with large custodians.
Therefore, for each of the six investor profiles, the cost of trading and post-trading in each financial centre has been calculated assuming that the investor used different-sized brokers and custodians. The characteristics of the intermediary profiles that have been considered are set out in Table 2.3. The daily number of trades and trading value presented in the table relate to the characteristics of the brokers used, while the average size of the CSD account reflects the custodian used.
Both the investor and intermediary profiles have been based on data on the trading and post-trading activity of various types of Australian cash equity market participant. This includes, for example, data provided by ASX, and publicly available statistics on Australian superannuation fund managers,17 international hedge fund managers18 and Australian retail investors.19 The profiles have also been considered, and altered as appropriate, through discussions with various Australian brokers, several of which provided invoice data to further inform the profile design.
17
For example, APRA (2013), ‘Quarterly superannuation performance’, June. 18
For example, Chen et al. (2002), ‘Does Fund Size Erode Performance?’. 19
For example, ASX (2013), ‘The Australian share ownership study’, May.

Global cost benchmarking of cash equity clearing and settlement services Oxera
12
Table 2.3 Characteristics of intermediaries
Retail: online
Retail: advice
Institutional: small
Institutional: mid
Institutional: large
Average number of transactions per day
20,000 4,000 12,000 59,000 126,000
Average trade size (AU$) 5,000 7,000 5,000 5,000 5,000
Average value of custodian account (CSD level—total) (AU$m)
20,000 15,000 1,000 12,000 52,000
Average number of settlement instructions per day
1,000 500 1,000 1,000 1,000
Source: Oxera’s assumed values based on the trading activity of Australian intermediaries.
Table 2.4 defines the baseline pairings of investors and intermediaries for which the costs of trading and post-trading are presented in section 3.
Table 2.4 Investors and associated intermediaries
Profile 1 Profile 2 Profile 3 Profile 4 Profile 5 Profile 6 Profile 7
Investor type Small hedge fund manager
Large hedge fund manager
Small long-only fund manager
Large long-only fund manager
Frequent retail
Infrequent retail
Infrequent retail
Intermediary type
Institutional: small
Institutional: mid
Institutional: mid
Institutional: large
Retail: online
Retail: advice
Retail: online
Source: Oxera’s assumed values based on the trading activity of Australian intermediaries.
2.5 Financial centres analysed
The cost of trading and post-trading services provided by FMIs active in a number of financial centres has been analysed. The sample is not intended to be exhaustive, but does include more than 20 FMIs covering 14 financial centres. The sample has been selected to include FMIs operating at larger scale to ASX—for example, NSCC and DTC (the CCP and CSD in the USA)—as well as FMIs more comparable in size to ASX—for example, CCASS (the CCP and CSD in Hong Kong) and BM&F Bovespa (the CCP and CSD in Brazil).
Table 2.5 summarises the FMIs considered in the analysis, and Table 2.6 identifies some key characteristics, such as where other FMIs provide a comparable set of services and the degree of vertical integration where integration is defined as ownership by a common entity of more than 50%.
For ease of reference, in this report a group of FMIs that provide services for a common national market are sometimes referred to collectively by that national market. This does not necessarily imply that the costs of services provided by this specific group of FMIs represent the ‘average’ costs of trading and post-trading cash equities listed in that particular financial centre. The costs will differ, for example, where alternative trading platforms and/or CCPs exist, which is often the case in Europe.
In this analysis, the pan-European CCPs and trading platforms have been allocated to a specific national financial centre in order to clarify which CSD the settlement costs relate to. Although EuroCCP, SIX x-clear and LCH.Clearnet Ltd charge the same clearing fees for all trades they clear regardless of the trading platform on which the trade was executed, the settlement fees differ according to the CSD to which the CCP is sending settlement instructions. In addition, each CSD has its own price list, creating more international variation in the settlement costs between European national financial centres.

Global cost benchmarking of cash equity clearing and settlement services Oxera
13
To capture a range of trading and post-trading costs in Europe, seven comparators have been considered, including two for UK equities: one where trades are executed on the London Stock Exchange (LSE) and cleared at LCH.Clearnet Ltd; and another where trades are executed on BATS Chi-X Europe and cleared at EuroCCP. In both cases trades are settled at EuroClear UK & Ireland (EUI), the home CSD for these stocks.
Table 2.5 Overview of FMIs considered
Comparator reference
Trading platform Clearinghouse (CH)/CCP
CSD
Australia Australian Securities Exchange (ASX)
ASX Clear ASX Settlement
Hong Kong Hong Kong Stock Exchange (SEHK)
Central Clearing and Settlement System (CCASS)
Central Clearing and Settlement System (CCASS)
Singapore Singapore Exchange (SGX)
Central Depository (CDP)
Central Depository (CDP)
Japan Tokyo Stock Exchange (TSE)
Japan Securities Clearing Corporation (JSCC)
Japan Securities Depository Center (JASDEC)
Korea Korea Exchange –(KRX)
Korea Exchange (KRX) Korea Securities Depository (KSD)
Brazil BM&FBovespa BM&FBovespa—CBLC BM&FBovespa—CBLC
USA New York Stock Exchange (NYSE)
National Securities Clearing Corporation (NSCC)
Depository Trust Company (DTC)
Canada Toronto Stock Exchange (TSX)
Canadian Depository for Securities (CDS)
Canadian Depository for Securities (CDS)
Germany Deutsche Börse Eurex Clearing Clearstream
France NYSE Euronext: Europe
LCH.Clearnet S.A. Euroclear (ESES)
UK (EuroCCP) BATS Chi-X EuroCCP Euroclear UK & Ireland
UK (LCH.Clearnet) London Stock
Exchange LCH.Clearnet Ltd. Euroclear UK & Ireland
Spain BME Iberclear1 Iberclear
Switzerland SIX Swiss Stock Exchange
SIX x-clear SIX SIS
Denmark Nasdaq OMX (Nordic) EuroCCP VP Securities
Note: 1 Spain does not have a CCP at present.

Global cost benchmarking of cash equity clearing and settlement services Oxera
14
Table 2.6 Key characteristics of FMIs considered
Comparator reference Level of vertical integration
1
Choice at trading (T) or clearing (C) level?
User choice of CCP facilitated by trading platform Number of transactions on trading platform (m)
Australia TP–CCP–CSD T n.a. 154
Hong Kong TP–CCP–CSD No n.a. 148
Singapore TP–CCP–CSD No n.a. 22
Japan TP–CCP2 T n.a. 350
Korea TP–CCP–CSD No n.a. 1,219
Brazil TP–CCP–CSD No n.a. 160
USA CCP–CSD T n.a. 1,375
Canada TP–CCP–CSD T n.a. 216
Germany TP–CCP–CSD T, C3 No: trades executed on Deutsche Börse are cleared at
Eurex 104
France (LCH.Clearnet S.A.) No vertical integration T, C3 No: trades executed on NYSE Euronext are cleared at
LCH.Clearnet SA 117
UK (EuroCCP) No vertical integration T, C3 Yes: trades executed on BATS Chi-X Europe can be
cleared at EuroCCP, LCH.Clearnet or x-clear 175
UK (LCH.Clearnet Ltd) TP–CCP T, C3,4
Yes: trades executed on LSE can be cleared at LCH.Clearnet or x-clear
164
Spain (Iberclear) TP–CH–CSD T, C3 No: trades executed on BME are cleared at IberClear 40
Switzerland (x-clear) TP–CCP–CSD T, C4,5
Yes: trades executed on SIX Swiss Exchange can be cleared at LCH.Clearnet or x-clear
29
Denmark No vertical integration T No: trades executed on Nasdaq OMX are cleared at EuroCCP
76
Note: The number of transactions is based on 2012 data. For Denmark, the number of transactions is based on the whole NASDAQ OMX Nordic market. 1 Integration is defined as ownership by a common entity of more than 50%.
2 The Japan Exchange Group owns 83% of JSCC and 24% of JASDEC.
3 EuroCCP offers clearing services for a wide range of European stocks traded on alternative trading platforms to the incumbent national stock exchanges (such as BATS Chi-X
Europe) including Germany, France, UK, Spain and Switzerland, thereby introducing a degree of choice at the clearing level. 4 SIX x-clear offers clearing services for cash equities traded on a number of trading platforms including the SIX Swiss Exchange and LSE.
5 LCH.Clearnet Ltd offers clearing services for equity securities traded on the SIX Swiss Exchange.
Source: World Federation of Exchanges (WFE) annual statistics; SGX (2012), ‘Statistical report’, December; Committee on Payment and Settlement Systems, BIS (2013), ‘Statistics on payment, clearing and settlement systems in the CPSS countries’, September; BATS Chi-X data; London Stock Exchange (2012), ‘Summary trading statistics’, December.

Global cost benchmarking of cash equity clearing and settlement services Oxera
15
3 International cost benchmarking results
This section presents the results of the international comparison of the costs of using infrastructure providers’ post-trading services. The section is structured as follows:
section 3.1 explores how economies of scale explain the international variation in the costs for FMI post-trading services;
section 3.2 presents the overall costs for trading and post-trading services provided by the selected FMIs, for a range of investor profiles, and explores potential reasons for variations between investor types;
section 3.3 breaks down FMI costs between trading services and post-trading services, and, where possible, between CCP- and CSD-type services;
section 3.4 presents the findings from the sensitivity analysis, which considers how the costs of different FMIs’ services vary with changes in the investors’ and their intermediaries’ behaviour;
section 3.5 provides a conclusion, summarising ASX’s position in each area of analysis.
3.1 Economies of scale in FMI post-trading services
To assess whether economies of scale have a role in explaining the international variation in the costs for FMI post-trading services, it is useful to consider the relationship between the scale of both the FMI and post-trading fees, and the FMI and trading and post-trading fees. As documented in Table 2.6, many of the FMIs considered in this analysis are, to some extent, vertically integrated. Therefore, although the total fee for trading and post-trading services provided by such FMIs may be cost-reflective, the fees for the individual components of trading and post-trading may not be.
Figures 3.1a and 3.1b present the relationship between the total cost associated with FMI trading and post-trading services and the value of trades at the relevant trading platform. (Sections 3.2 and 3.3 present figures that allow for easier comparison between the costs in each financial centre and illustrate the variation in costs for different types of investor. Appendix 4 provides a full set of data tables with the cost estimates for each user profile, at each FMI.)
The user profile underpinning both charts is profile 3: the long-only fund manager using medium-sized intermediaries. This profile can be observed across the different markets being examined; however, the profile has also been adapted in Figure 3.1b to take into account the local average trade size at each trading platform. This significantly reduces the estimates of the total trading and post-trading costs for Spain and Switzerland, where the average trade size is substantially larger (about AU$20,000) than in Australia. (Appendix 3 repeats this analysis for alternative Australian institutional and retail profiles.)

Global cost benchmarking of cash equity clearing and settlement services Oxera
16
Figure 3.1a Relationship between the cost of FMI trading and post-trading and value of trades—based on Australian user profile 3
Note: The fees are based on profile 3:the long-only fund manager using medium-sized intermediaries. The value of equity trading is based on the electronic domestic and foreign turnover for the relevant stock exchange in 2012 provided in the WFE dataset. For the exchanges for which the data was not available in the WFE—namely, NYSE Euronext Paris, BATS Chi-X and the LSE—BATS Global Markets dataset has been used. For Denmark, the value traded on the NASDAQ OMX Nordic has been used. The trade values have been converted to AU$ using two-year average exchange rates.
Source: WFE annual statistics; BATS Global Markets; and FMIs’ pricing schedules.

Global cost benchmarking of cash equity clearing and settlement services Oxera
17
Figure 3.1b Relationship between the cost of FMI trading and post-trading and value of trades—based on local user profile 3
Note: The fees are based on profile 3, except that the average trade size is adapted to reflect the average trade size on the relevant trading platform.
Source: Oxera.
Australia
Hong Kong
Singapore
Japan
Korea
Brazil
Canada
Germany
France
UK (EuroCCP)
UK (LCH.Clearnet)
Spain
Switzerland
Denmark
0
1
2
3
4
5
6
0 500 1,000 1,500 2,000 2,500 3,000 3,500
Tra
ding
and
pos
t-tra
ding
fees
(bp)
Value of trading (AU$ bn)
USA (AU$13.6tn, 0.20bp)

Global cost benchmarking of cash equity clearing and settlement services Oxera
18
Figures 3.1a and 3.1b show evidence of a pattern of economies of scale: the cost for trading and post-trading services provided by infrastructures generally decreases as the value of trading increases. This general trend is robust to changes in the user profile (see charts in Appendix 3) and is consistent with the economies of scale observed in previous analysis undertaken by Oxera.20
Figure 3.2 and Figure 3.3 consider the relationship between the cost of post-trading services and scale of the CCP under consideration.
Figure 3.2 presents the relationship between post-trading costs and the value of transactions cleared at the CCP under consideration, proxied by the value of transactions executed at the relevant trading platform or, where competition for trading services exists, the value of transactions executed on the relevant trading platforms. To take account of international variation in average trade sizes, Figure 3.3 presents the relationship between post-trading costs and the number of transactions cleared at the CCP under consideration (again proxied by the number of trades at the relevant trading platform, or platforms). In both cases the investor profile considered is based on a long-only fund manager using medium intermediaries (profile 3). (The references to the underlying data are provided in Appendix 4.)
20
See, for example, Oxera (2013), ‘The Oxera Trading and Post-trading Monitor’, note prepared for ASX Group, April; and Oxera (2012), ‘What would be the costs and benefits of changing the competitive structure of the market for trading and post-trading services in Brazil?’, prepared for Comissão de Valores Mobiliários, June.

Global cost benchmarking of cash equity clearing and settlement services Oxera
19
Figure 3.2 Relationship between the cost of post-trading (for institutional investors) and the value of trades
Note: The fees are based on institutional profile 3. The value of equity trading is based on the electronic domestic and foreign turnover for the relevant stock exchange in 2012 provided in the WFE dataset. For the exchanges for which the data was not available from the WFE—namely, NYSE Euronext Paris, BATS Chi-X and the LSE—BATS Global Markets dataset has been used. For Denmark the value traded on NASDAQ OMX Nordic has been used. The trade values have been converted to AU$ using two-year average exchange rates.
Source: WFE annual statistics; BATS Global Markets; and FMIs’ pricing schedules.
Australia
Hong Kong
Singapore
Japan
Korea
Brazil
CanadaGermany
France
UK (EuroCCP)
UK (LCH.Clearnet)
Spain
Switzerland
Denmark
0.0
0.5
1.0
1.5
2.0
2.5
3.0
3.5
4.0
4.5
5.0
0 500 1,000 1,500 2,000 2,500 3,000 3,500
Pos
t-tra
ding
fees
(bp)
Value of trading (AU$ bn)
USA (AU$13.6tn, 0.03bp)
Pos
t-tra
ding
fees
(bp)
Value of trading (AU$ bn)

Global cost benchmarking of cash equity clearing and settlement services Oxera
20
Figure 3.3 Relationship between the cost of post-trading (for institutional investors) and the number of trades
Note: The fees are based on institutional profile 3. The number of trades are single-counted figures and based on the number of electronic order book equity trades in 2012 provided in the WFE dataset. For the financial centres for which the data was not available from the WFE, other sources have been used; namely, CPSS data on the number of executed equity trades on NYSE Euronext (Paris), SGX data on the number of security trades (excluding ETFs) on the Singapore Exchange, LSE data on the number of order book trades (excluding ETFs) on the LSE, and BATS Chi-X Europe data for the number of trades on the GB market on BATS Chi-X Europe in 2012. For Denmark the number of trades on NASDAQ OMX Nordic has been used. Korea and the USA have been excluded as outliers because their trade volumes exceed 1 billion. The post-trading costs for the FMIs in these financial centres are 0.04bp and 0.03bp respectively.
Source: WFE annual statistics; Committee on Payment and Settlement Systems, BIS (2013), ‘Statistics on payment, clearing and settlement systems in the CPSS countries’, September; SGX (2012), ‘Statistical report’, December; London Stock Exchange (2012), ‘Summary trading statistics’, December; BATS Chi-X Europe; and FMIs’ pricing schedules.
Australia
Hong Kong
Singapore
Japan
Brazil
CanadaGermany
France
UK (EuroCCP)
UK (LCH.Clearnet)
Spain
Switzerland
Denmark
0.0
0.5
1.0
1.5
2.0
2.5
3.0
3.5
4.0
4.5
5.0
0 50 100 150 200 250 300 350 400
Pos
t-tra
ding
fees
(bp)
Number of trades (m)
Korea (1.2bn, 0.04bp), USA (1.4bn, 0.03bp)

l Global cost benchmarking of cash equity clearing and settlement services Oxera
21
Figures 3.2 and 3.3 both show a pattern of economies of scale similar to that shown in Figure 3.1.
When moving from a trade value to a trade volume measure of scale, the relative position of Spain shifts to the left. This is because the average trade size in Spain is significantly larger than those of the other comparator countries. As such, although Spain is comparable to France and Australia in terms of value of transactions, in terms of number of transactions processed, it is considerably smaller. This may in part explain the substantially higher Spanish fees. Similarly, Switzerland has a relatively larger average trade value, and therefore its market size is much smaller when considered according to number of trades.
Figures 3.4 to 3.6 below present the economies of scale results based on retail profile 5: frequent retail investor using an online retail broker.

Global cost benchmarking of cash equity clearing and settlement services Oxera
22
Figure 3.4 Relationship between the cost of trading and post-trading (for retail investors) and the value of trades
Note: The fees are based on profile 5.
Source: Oxera analysis.
Australia
Hong Kong
Singapore
Japan
Korea
Brazil
Canada
Germany
France
UK (EuroCCP)
UK (LCH.Clearnet)
Spain
Switzerland
Denmark
0
2
4
6
8
10
12
14
16
18
20
0 500 1,000 1,500 2,000 2,500 3,000 3,500 4,000
Tra
ding
and
pos
t-tra
ding
fees
(bp)
Value of trading (AU$ bn)
USA (AU$13.6tn, 0.33bp)

Global cost benchmarking of cash equity clearing and settlement services Oxera
23
Figure 3.5 Relationship between the cost of post-trading (for retail investors) and the value of trades
Note: The fees are based on profile 5.
Source: Oxera analysis.
Australia
Hong Kong
Singapore
Japan
Korea
Brazil
Canada
Germany
France
UK (EuroCCP) UK (LCH.Clearnet)
Spain
Switzerland
Denmark
0
1
2
3
4
5
6
0 500 1,000 1,500 2,000 2,500 3,000 3,500 4,000
Pos
t-tra
ding
fees
(bp)
Value of trading (AU$ bn)
USA (AU$13.6tn, 0.15bp)

Global cost benchmarking of cash equity clearing and settlement services Oxera
24
Figure 3.6 Relationship between the cost of post-trading (for retail investors) and the number of trades
Note: The fees are based on profile 5.
Source: Oxera analysis.
Australia
Hong Kong
Singapore
Japan
Brazil
Canada
Germany
France
UK (EuroCCP)UK (LCH.Clearnet)
Spain
Switzerland
Denmark
0
1
2
3
4
5
6
0 50 100 150 200 250 300 350 400 450
Pos
t-tra
ding
fees
(bp)
Number of trades (m)
Korea (1.2bn, 0.04bp), USA (1.4bn, 0.15bp)
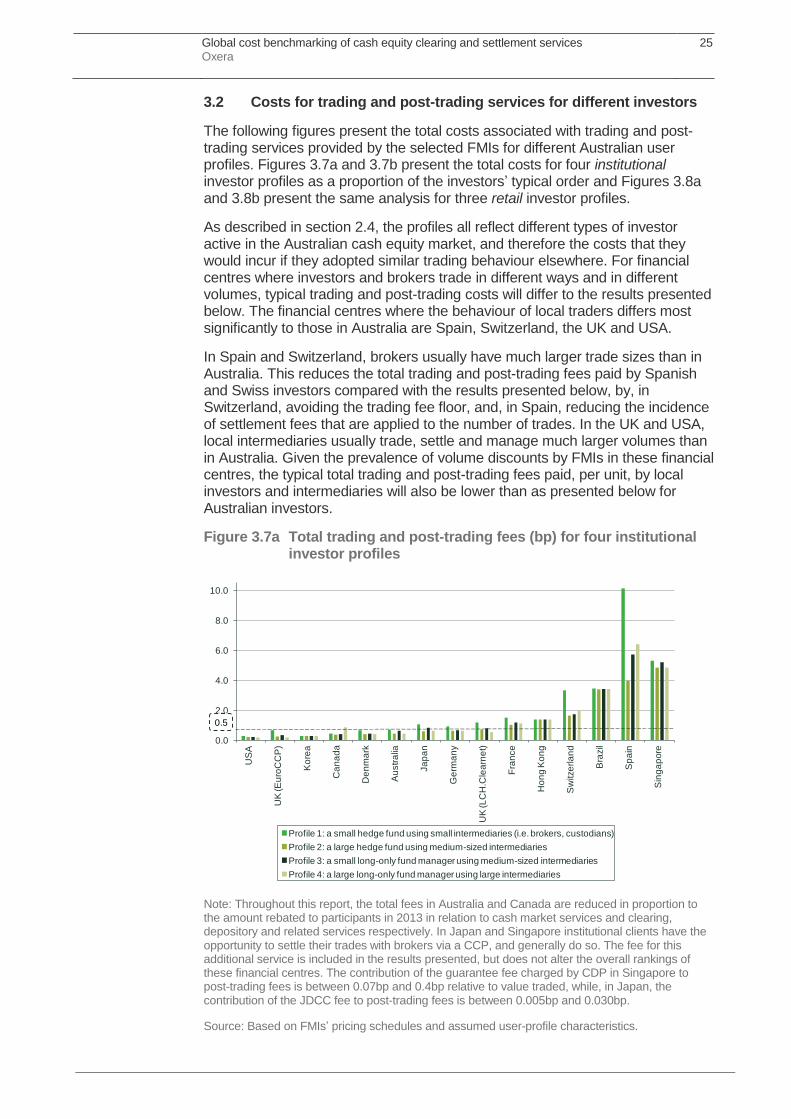
Global cost benchmarking of cash equity clearing and settlement services Oxera
25
3.2 Costs for trading and post-trading services for different investors
The following figures present the total costs associated with trading and post-trading services provided by the selected FMIs for different Australian user profiles. Figures 3.7a and 3.7b present the total costs for four institutional investor profiles as a proportion of the investors’ typical order and Figures 3.8a and 3.8b present the same analysis for three retail investor profiles.
As described in section 2.4, the profiles all reflect different types of investor active in the Australian cash equity market, and therefore the costs that they would incur if they adopted similar trading behaviour elsewhere. For financial centres where investors and brokers trade in different ways and in different volumes, typical trading and post-trading costs will differ to the results presented below. The financial centres where the behaviour of local traders differs most significantly to those in Australia are Spain, Switzerland, the UK and USA.
In Spain and Switzerland, brokers usually have much larger trade sizes than in Australia. This reduces the total trading and post-trading fees paid by Spanish and Swiss investors compared with the results presented below, by, in Switzerland, avoiding the trading fee floor, and, in Spain, reducing the incidence of settlement fees that are applied to the number of trades. In the UK and USA, local intermediaries usually trade, settle and manage much larger volumes than in Australia. Given the prevalence of volume discounts by FMIs in these financial centres, the typical total trading and post-trading fees paid, per unit, by local investors and intermediaries will also be lower than as presented below for Australian investors.
Figure 3.7a Total trading and post-trading fees (bp) for four institutional investor profiles
Note: Throughout this report, the total fees in Australia and Canada are reduced in proportion to the amount rebated to participants in 2013 in relation to cash market services and clearing, depository and related services respectively. In Japan and Singapore institutional clients have the opportunity to settle their trades with brokers via a CCP, and generally do so. The fee for this additional service is included in the results presented, but does not alter the overall rankings of these financial centres. The contribution of the guarantee fee charged by CDP in Singapore to post-trading fees is between 0.07bp and 0.4bp relative to value traded, while, in Japan, the contribution of the JDCC fee to post-trading fees is between 0.005bp and 0.030bp.
Source: Based on FMIs’ pricing schedules and assumed user-profile characteristics.
0.0
2.0
4.0
6.0
8.0
10.0
US
A
UK
(E
uro
CC
P)
Ko
rea
Ca
na
da
De
nm
ark
Au
str
alia
Ja
pa
n
Ge
rma
ny
UK
(L
CH
.Cle
arn
et)
Fra
nce
Ho
ng
Ko
ng
Sw
itze
rla
nd
Bra
zil
Sp
ain
Sin
ga
pore
Profile 1: a small hedge fund using small intermediaries (i.e. brokers, custodians)
Profile 2: a large hedge fund using medium-sized intermediaries
Profile 3: a small long-only fund manager using medium-sized intermediaries
Profile 4: a large long-only fund manager using large intermediaries
0.5

Global cost benchmarking of cash equity clearing and settlement services Oxera
26
Figure 3.7b Total trading and post-trading fees (bp) for institutional investor profiles—truncated axis
Note: The total trading and post-trading fees for Switzerland (for profile 1), Brazil, Spain and Singapore are truncated at 2bp.
Source: Based on FMIs’ pricing schedules and assumed user-profile characteristics.
Total trading and post-trading costs at ASX—institutional investors
The results presented in Figures 3.7a and 3.7b above are as follows (Profile 1 to Profile 4): 0.70bp, 0.43bp, 0.62bp and 0.43bp.
Figure 3.7a indicates that, for Australian-based institutional investors, the costs of the trading and post-trading services provided by the FMIs appear to fall into one of three groups:
those with fees in excess of 3bp—FMIs in Singapore, Brazil and Spain;
those with fees between 0.5bp and 2bp—this is the largest group, covering FMIs in Australia, Hong Kong, Japan, France, Germany and the UK (LCH.Clearnet);
those with fees below 0.5bp—FMIs in Korea, the USA, Canada, Denmark and the UK (EuroCCP).
The relatively high fee for institutional investors in Singapore is driven by the CDP’s clearing fee of 4bp of contract value (capped at SG$600—AU$488).21 In the case of Switzerland, the relatively high fee is driven by the trading fee floor of CHF0.5 per transaction charged (c. AU$0.6, or 1.2bp based on an average trade size of AU$5,000). As noted in the text preceding Figure 3.7a, local investors commonly avoid this trading fee floor owing to the much larger average trade size of Swiss brokers. In the case of Spain, the relatively high fees for institutional users are driven by the adoption of a gross settlement model and
21
This fee is due to change to 0.0325% capped in June 2014, but this will not significantly alter the results.
0.0
0.2
0.4
0.6
0.8
1.0
1.2
1.4
1.6
1.8
2.0
US
A
UK
(E
uro
CC
P)
Ko
rea
Ca
na
da
De
nm
ark
Au
str
alia
Ja
pa
n
Ge
rma
ny
UK
(L
CH
.Cle
arn
et)
Fra
nce
Ho
ng
Ko
ng
Sw
itze
rla
nd
Bra
zil
Sp
ain
Sin
ga
pore
Profile 1 Profile 2 Profile 3 Profile 4

Global cost benchmarking of cash equity clearing and settlement services Oxera
27
settlement fee of €0.90 per transfer (c. AU$1.3, or 2.6bp based on an average trade size of AU$5,000). This cost is less significant to Spanish investors than as estimated in Figure 3.7 for Australian investors, for the same reason—the average trade size in Spain is 4–5 times larger than that in Australia.
The picture changes slightly when retail investors are considered—especially for Singapore, which, compared with institutional investors, is closer in cost to other financial centres. This is because, in other financial centres, the fees charged relative to assets under management become more significant for retail investors.
In the case of Brazil and Spain, costs for retail investors remain higher than observed in other financial centres (see Figure 3.8a). In the case of Brazil, the relatively high costs for retail investors are driven primarily by the monthly account management fee of BRI 6.9 for active accounts and BRI 3 for inactive accounts (AU$3.3 and AU$1.44 respectively) charged by BM&F Bovespa. These fees equate to a 4.2bp and 8.9bp charge relative to the value traded for an investor with monthly trading value of AU$45,000, as assumed for the infrequent retail investor. In the case of Spain, in addition to the high settlement costs incurred by institutional investors, retail investors face high trading fees because BME applies volume discounts on trading fees according to the value of trading by each broker, for each final client, in each security, and the fees for small client orders are relatively high. At other European and US trading platforms, the broker usually applies volume discounts to the value of trading, and therefore smaller investors can also benefit from volume discounts achieved by their broker.
Figure 3.8a Total trading and post-trading fees (bp) for three retail investor profiles
Source: Based on FMIs’ pricing schedules and assumed user-profile characteristics.
0
2
4
6
8
10
12
14
16
18
20
Ko
rea
US
A
UK
(E
uro
CC
P)
Au
str
alia
Ge
rma
ny
UK
(L
CH
.Cle
arn
et)
Ho
ng
Ko
ng
De
nm
ark
Ja
pa
n
Ca
na
da
Fra
nce
Sw
itze
rla
nd
Sin
ga
pore
Bra
zil
Sp
ain
Profile 5: frequent retail investor using an online retail broker
Profile 6: infrequent retail investor using a retail advice broker
Profile 7: infreqent retail investor using an online retail broker

Global cost benchmarking of cash equity clearing and settlement services Oxera
28
Figure 3.8b Total trading and post-trading fees (bp) for three retail investor profiles—truncated axis
Note: The total trading and post-trading fees for Switzerland (for profile 6), Brazil and Spain are truncated at 5bp.
Source: Based on FMIs’ pricing schedules and assumed user-profile characteristics.
Total trading and post-trading costs at ASX—retail investors
The results presented in Figures 3.8a and 3.8b above are as follows (Profile 5 to Profile 7): 2.16bp, 1.04bp and 1.00bp.
3.3 Breakdown in costs between trading, CCP-type and CSD-type services
Figures 3.9a, 3.9b, 3.10a and 3.10b present the cost breakdown between trading and post-trading services. These figures help to illustrate the drivers of the higher costs in Singapore, Brazil, Spain and Switzerland, as described in section 3.2.
Figures 3.9a and 3.9b present the results for the four Australian institutional profiles. Figures 3.10a and 3.10b present the results for the three Australian retail profiles (see Appendix 4 for the data underpinning these figures). Intermediaries trade smaller volumes in the Australian market than, for example, in the UK and USA markets, where volume discounts are also commonly available for clearing and settlement services. This means that the results in Figures 3.9a and 3.9b for the smaller Australian institutional investor and intermediary profiles (profile numbers 1, 2 and 3) are higher than the costs typically incurred by local investors and intermediaries in these markets. Profile 4 provides a closer estimate of fees paid by local investors and intermediaries in the UK and USA markets.

Global cost benchmarking of cash equity clearing and settlement services Oxera
29
Figure 3.9a Trading (dark shading) and post-trading (light shading) fees (bp) for institutional investors
Source: Based on FMIs’ pricing schedules and assumed user-profile characteristics.
Figure 3.9b Trading (dark shading) and post-trading (light shading) fees (bp) for institutional investors—truncated axis
Note: The total trading and post-trading fees for Switzerland (for profile 1), Brazil, Spain and Singapore are truncated at 2bp.
Source: Based on FMIs’ pricing schedules and assumed user-profile characteristics.
0
2
4
6
8
10
12
US
A
UK
(E
uro
CC
P)
Ko
rea
Ca
na
da
De
nm
ark
Au
str
alia
Ja
pa
n
Ge
rma
ny
UK
(L
CH
.Cle
arn
et)
Fra
nce
Ho
ng
Ko
ng
Sw
itze
rla
nd
Bra
zil
Sp
ain
Sin
ga
pore
Profile 1 Profile 2 Profile 3 Profile 4
0.0
0.2
0.4
0.6
0.8
1.0
1.2
1.4
1.6
1.8
2.0
US
A
UK
(E
uro
CC
P)
Ko
rea
Ca
na
da
De
nm
ark
Au
str
alia
Ja
pa
n
Ge
rma
ny
UK
(L
CH
.Cle
arn
et)
Fra
nce
Ho
ng
Ko
ng
Sw
itze
rla
nd
Bra
zil
Sp
ain
Sin
ga
pore
Profile 1 Profile 2 Profile 3 Profile 4

Global cost benchmarking of cash equity clearing and settlement services Oxera
30
Total post-trading costs at ASX—institutional investors
The results presented in Figures 3.9a and 3.9b above are as follows (Profile 1 to Profile 4): 0.55bp, 0.29bp, 0.47bp and 0.28bp.
Figures 3.9a and 3.9b show that, while there is considerable international variation in post-trading costs, there is more consistency in trading fees, especially when the results for Spain and Switzerland are excluded.22 Indeed, in general, fees for trading services provided by the FMIs for institutional investors fall into one of two groups:
around 0.5bp—which includes SGX (Singapore), BM&F Bovespa (Brazil), SEHK (Hong Kong), NYSE Euronext (France), LSE (UK), and Deutsche Börse (Germany);
around 0.3bp or less—which includes ASX, TSE (Japan), TMX (Canada), NYSE (US), Nasdaq OMX (Denmark), and BATS Chi-X Europe (UK). (Although not one of the core comparators, Chi-X Australia also falls into this group.)
In general, the same pattern is found for retail investors as shown in Figures 3.10a and 3.10b, excluding Spain and Switzerland. Trading fees are generally more consistent across different financial centres than post-trading fees.
Figure 3.10a Trading (dark shading) and post-trading (light shading) fees (bp) for retail investors
Source: Based on FMIs’ pricing schedules and assumed user-profile characteristics.
22
Which, as noted, reflect only the costs that Australian investors would incur should they trade in the Swiss or Spanish markets in the same way as they trade in Australia, and do not represent typical fees incurred by investors local to the Swiss and Spanish markets, owing primarily to the difference in average trade size.
0
2
4
6
8
10
12
14
16
18
20
Ko
rea
US
A
UK
(E
uro
CC
P)
Au
str
alia
Ge
rma
ny
UK
(L
CH
.Cle
arn
et)
Ho
ng
Ko
ng
De
nm
ark
Ja
pa
n
Ca
na
da
Fra
nce
Sw
itze
rla
nd
Sin
ga
pore
Bra
zil
Sp
ain
Profile 5 Profile 6 Profile 7

Global cost benchmarking of cash equity clearing and settlement services Oxera
31
Figure 3.10b Trading (dark shading) and post-trading (light shading) fees (bp) for retail investors—truncated axis
Note: The total trading and post-trading fees for Switzerland (for profile 6), Brazil and Spain are truncated at 5bp.
Source: Based on FMIs’ pricing schedules and assumed user-profile characteristics.
Total post-trading costs at ASX—retail investors
The results presented in Figures 3.10a and 3.10b above are as follows (Profile 5 to Profile 7): 2.01bp, 0.88bp, 0.85bp.
Figure 3.11 and Figure 3.12 below extend the analysis in Figures 3.9–3.10 to give a breakdown of post-trading costs between CCP-type and CSD-type services.
Where the CCP and CSD are separate entities—for example, in the UK, France, Denmark, and USA—allocating post-trading fees to the relevant category is straightforward. However, the allocation of fees charged by vertically integrated FMIs to CCP- or CSD-type services involves mapping the services as described within the FMI’s pricing schedule to the relevant category. This can require some judgement, particularly because the terms ‘clearing’ and ‘settlement’ refer to different services at different FMIs. In addition, the FMI’s chosen allocation of fees may not necessarily reflect costs.
Where only a single bundled fee is charged (e.g. at BM&F Bovespa), or it has not been possible to make a robust allocation of fees (e.g. SGX), no breakdown has been provided. As these FMIs charge some of the higher fees, the overall variation in fees in Figures 3.11 and 3.12 below is smaller than in the previous figures (Figures 3.7–3.10).

Global cost benchmarking of cash equity clearing and settlement services Oxera
32
Figure 3.11 Breakdown of fees between CCP-type services (dark shading) and CSD-type services (light shading) fee for institutional investors (bp)
Note: The CCP fees include transaction and membership clearing fees; the CSD fees include settlement transaction, membership fees and stock-related fees. The countries excluded from the total sample because of bundling of fees are Brazil, Spain, Korea, Hong Kong and Singapore.
Source: Based on FMIs’ pricing schedules and assumed user-profile characteristics.
Figure 3.12 Breakdown of fees between CCP-type services (dark shading) and CSD-type services (light shading) fee for retail investors (bp)
Source: Based on FMIs’ pricing schedules and assumed user-profile characteristics.
0.0
0.2
0.4
0.6
0.8
1.0
1.2
1.4
US
A
De
nm
ark
UK
(E
uro
CC
P)
Ge
rma
ny
Ca
na
da
UK
(L
CH
.Cle
arn
et)
Au
str
alia
Ja
pa
n
Fra
nce
Sw
itze
rla
nd
Profile 1 Profile 2 Profile 3 Profile 4
0.0
0.5
1.0
1.5
2.0
2.5
3.0
3.5
4.0
US
A
UK
(E
uro
CC
P)
Au
str
alia
Ge
rma
ny
UK
(L
CH
.Cle
arn
et)
De
nm
ark
Ja
pa
n
Fra
nce
Ca
na
da
Sw
itze
rla
nd
Profile 5 Profile 6 Profile 7

Global cost benchmarking of cash equity clearing and settlement services Oxera
33
Breakdown of post-trading costs at ASX
The costs of CCP services provided by ASX for the four institutional profiles shown in Figure 3.11 above are consistently 0.24bp.
The costs of CCP services provided by ASX for the three retail profiles shown in Figure 3.12 above are 0.24bp for Profile 5 and 7, and 0.25bp for Profile 6. The latter is slightly higher because this investor is assumed to use a smaller broker, and therefore the (assumed) pass-through of the broker’s clearing membership fees at ASX Clear is more significant.
The costs of CSD services provided by ASX for the four institutional profiles shown in Figure 3.11 above are as follows (Profiles 1 to 4): 0.31bp, 0.05bp, 0.23bp, 0.04bp.
The costs of CSD services provided by ASX for the three retail profiles shown in Figure 3.12 above are as follows (Profiles 5 to 7): 1.77bp, 0.64bp and 0.61bp.
The relatively broad range of settlement costs for different investors at ASX can be explained by ASX’s fee of AU$1.30 per institutional settlement (i.e. the 101 DvP message) for institutional investors and AU$0.90 per transfer to a sponsoring broker’s entrepot for retail investors. For order sizes of AU$400,000 (as assumed for the large long-only fund manager and large hedge fund profiles) ASX’s fee of AU$1.30 as a proportion of value traded is relatively low at 0.03bp, but it increases to 0.22bp for order sizes of AU$60,000 (as assumed for the small hedge fund profile).
Similarly, the AU$0.90 fee as a proportion of value traded is relatively high for the frequent retail investor at 1.8bp, reflecting this investor’s relatively small order size of AU$5,000. The cost of this service as a proportion of value traded is much lower for the infrequent retail investor at 0.6bp, reflecting their larger order size of AU$15,000. (The average order size of retail investors is understood to be around AU$11,000.)
Figures 3.11 and 3.12 illustrate that there is more comparability between fees charged for CCP-type services than there is for CSD-type services. This is particularly the case for institutional investors, where CCP-type fees at most FMIs range from around 0.1bp to around 0.36bp across all the institutional user profiles considered. (The exceptions are the USA and Canada, where CCP fees are particularly low, at approximately 0.01bp and 0.02bp respectively.)
ASX lies at the higher end of this range. Charging the highest CCP fee (of those FMIs for which segregated CCP-CSD analysis was possible) for the largest institutional investors, who would benefit from volume discounts offered by other higher-cost CCPs (such as LCH.Clearnet Ltd in the UK, and Eurex in Germany).
In comparison, CSD fees are more volatile both between different CSDs and by the same CSD but across different users. The variation between CSDs is greatest for the larger institutional investors with lower trading velocities, ranging from 0.01bp to 0.85bp. This is primarily for two reasons: i) the larger institutional investors benefit most from the volume discounts that are only available from some CSDs; and ii) the potential importance of fees charged according to the value of assets held under management at a CSD, when presented relative to the value traded by the investor. The fees charged by ASX for settlement lie at the low to middle end of this (broad) spectrum, at 0.05bp to 0.3bp.

Global cost benchmarking of cash equity clearing and settlement services Oxera
34
An implication of the variability in CSD fees is that the relative importance of CCP and CSD fees varies between different financial centres. In some financial centres, CCP and CSD fees are comparable for institutional investors—for example, in Denmark and Japan. In other financial centres, CCP fees are much lower than CSD fees—for example, in the USA and Canada, where CCP fees are immaterial. In a further group of financial centres, the relative important of CCP and CSD fees is dependent on the investor’s trading and holding characteristics. For example, although CCP fees at ASX are always 0.25bp of the value traded by the investor, the total cost of settlement services relative to the value traded by the investor becomes larger as the size of the client’s order decreases. This is because the cost of delivering the securities between the broker and the custodian’s account (the DvP message, number 101) is charged per settlement instruction.
For retail investors, CSD fees can be particularly significant for one or more of the following reasons: first, as explained above, where fees are charged to move securities between the custodian’s and the broker’s account, these become larger as the client’s order size decreases, and retail investors have smaller order sizes. Second, some CSDs charge a (fixed) account management fee, and these become more significant for retail investors given their lower trading values (which drives the higher CSD fees at BM&FBovespa for retail investors). Finally, stock-based fees often appear higher for retail investors when presented in terms of the value traded by the investor, owing to the lower trading velocities of the investors.
3.4 Main results from sensitivity analysis
The purpose of the sensitivity analysis is to test whether the results of the user-profile analysis are robust to changes in the assumptions about how investors and intermediaries trade.
Differences in the ways in which FMIs charge for their services mean that, depending on how an investor and its intermediaries trade, the relative cost of using their services may change. For example, where trading fees are per transaction, an investor that executes the same value of trade but over many more transactions may face a higher total cost per value of transaction than in financial centres where fees are per value of transaction. To consider the impact of this, the results presented in sections 3.2 and 3.3 covered a range of investor and intermediary types and demonstrated that, for investors with smaller order sizes, settlement costs at ASX become more material when considered as a proportion of the value traded. This effect is most visible when comparing the three retail investor profiles, as the frequent investor (Profile 5) is assumed to have an order size one-third of the size of the infrequent investor (Profile 6 and 7).
This section expands the analysis in section 3.2 and 3.3 to consider how the cost of trading and post-trading services by the selected FMI varies according to further, more extreme, changes in the user-profile parameters.
The main finding is that the estimates for post-trading costs in Spain and trading costs in Switzerland are particularly sensitive to changes in the assumptions about how investors, and intermediaries, trade. The cost estimates for Spain and Switzerland are significantly lower when the average trade size of the broker is increased to a level that is more in line with what is observed in these markets.
Table 3.1 highlights the user-profile characteristics that have the most significant impact on the cost estimates for trading, clearing and settlement. The supporting analysis is summarised in the bullets and figures below the table.

Global cost benchmarking of cash equity clearing and settlement services Oxera
35
Table 3.1 Main cost drivers
Parameter FMIs significantly affected
Explanation
Trading
Average trade size
SIX Swiss Exchange (to a large degree), Euronext, SEHK and NasdaqOMX also slightly affected
All charge a per-transaction trading fee or impose a trading fee floor. Therefore increasing the average trade size reduces the trading fee when considered relative to the value traded
Size of intermediary
Deutsche Börse, Euronext, LSE, BME and SIX Swiss Exchange
All offer volume discounts or fee caps, reducing the overall average trading costs paid by larger brokers and (assumed to be) passed on to the end-client
Clearing
Size of intermediary
EuroCCP, LCH.Clearnet Ltd, Eurex, SIX x-clear, JSCC
All offer volume discounts and/or fee caps
Average trade size
CDS, LCH.Clearnet Ltd EuroCCP and LCH.Clearnet S.A.
All charge a per-transaction clearing fee. Therefore, increasing the average trade size reduces the clearing fee when considered relative to the value traded
Settlement
Velocity of trading
All European CSDs, BM&FBovespa, CDS, DTC, JASDEC
All charge a fee relative to the value of assets under management or number of shares under management. Therefore, reducing an investor’s velocity of trading will increase the CSD fees relative to their value of trading
Size of client order
ASX, CDS, JASDEC, SGX, Euroclear, SIS, VPSS
All charge for the transfer from the client’s (custodian’s) account to their broker’s account on a per-transaction basis. Therefore, increasing the client’s order size will reduce the settlement costs relative to the value traded
Size of intermediary
JASDEC, BM&FBovespa, DTC, Clearstream, Euroclear, Iberclear, SIS
All offer volume discounts and/or fee caps
Source: Oxera analysis.
The following bullets summarise the effects of altering each of the user-profile parameters.
Investor’s order size: Reducing the client’s order size increases the significance of the fee for settlement between the broker’s account and the client’s (or their custodian’s) account, where this occurs and is charged for per settlement instruction. This affects the settlement costs at ASX significantly, but also at some other FMIs such as Euroclear. Reducing the order size also has a significant impact on trading fees at BME (Spain), where trading fees and volume discounts take into account the investor’s order size. See Figures 3.13a and 3.13b below.

Global cost benchmarking of cash equity clearing and settlement services Oxera
36
Figure 3.13a Variation in total trading and post-trading costs according to the investor’s order size (bp)
Note: Profile 3 (small long-only fund manager using medium-sized intermediaries) represents the baseline (100%) profile. The 25% profile is the same as profile 3, except that the investor’s order size is 25% of that assumed in profile 3 (and therefore, because the value traded by the investor is held constant, the number of trades is 400% of that assumed in profile 3). The 400% profile is the same as profile 3, except that the investor’s order size is 400% of that assumed in profile 3 and the number of trades is 25% of that assumed in profile 3.
Source: Oxera.
Figure 3.13b Variation in total trading and post-trading costs according to the investor’s order size (bp)—truncated
Note: The total trading and post-trading fees for Brazil, Singapore and Spain are truncated at 2bp.
Source: Oxera analysis.
Investor’s velocity of trading: this velocity relates to the value traded relative to assets under management. As the velocity increases, the CSD-type fees become less significant (when considered relative to the investor’s
0.00
1.00
2.00
3.00
4.00
5.00
6.00
7.00
8.00
9.00
10.00
25% 100% 400%
0.00
0.20
0.40
0.60
0.80
1.00
1.20
1.40
1.60
1.80
2.00
25% 100% 400%
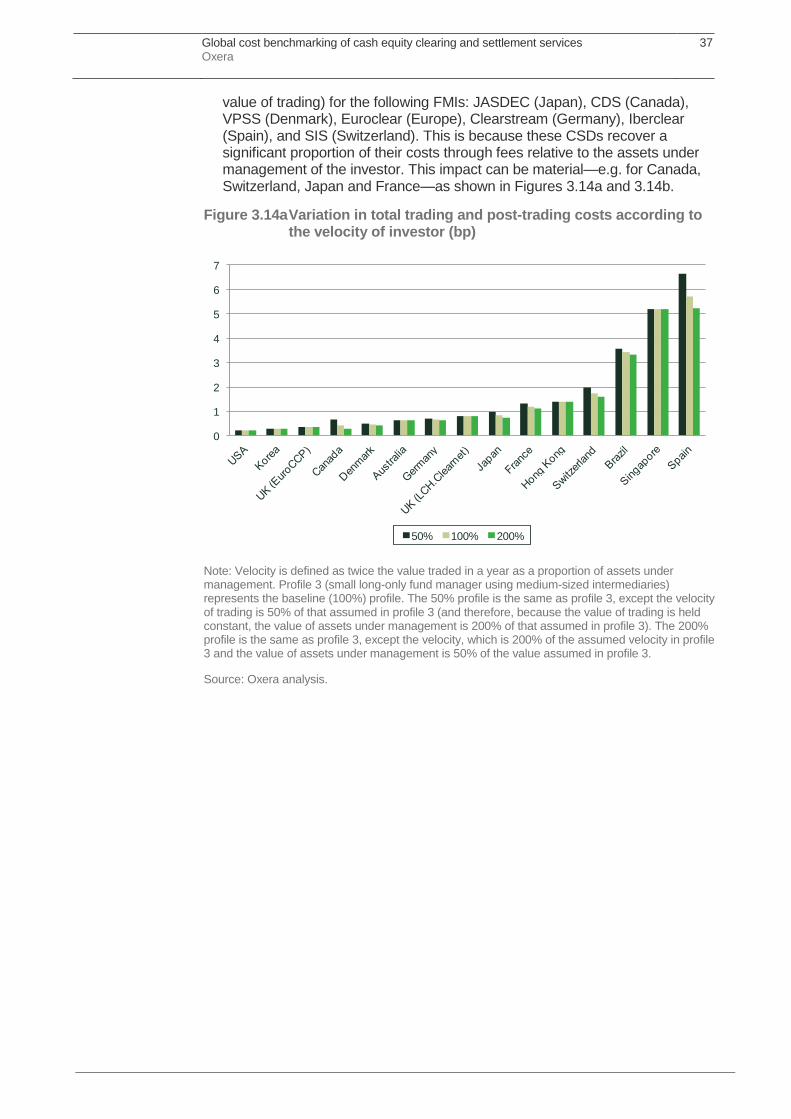
Global cost benchmarking of cash equity clearing and settlement services Oxera
37
value of trading) for the following FMIs: JASDEC (Japan), CDS (Canada), VPSS (Denmark), Euroclear (Europe), Clearstream (Germany), Iberclear (Spain), and SIS (Switzerland). This is because these CSDs recover a significant proportion of their costs through fees relative to the assets under management of the investor. This impact can be material—e.g. for Canada, Switzerland, Japan and France—as shown in Figures 3.14a and 3.14b.
Figure 3.14a Variation in total trading and post-trading costs according to the velocity of investor (bp)
Note: Velocity is defined as twice the value traded in a year as a proportion of assets under management. Profile 3 (small long-only fund manager using medium-sized intermediaries) represents the baseline (100%) profile. The 50% profile is the same as profile 3, except the velocity of trading is 50% of that assumed in profile 3 (and therefore, because the value of trading is held constant, the value of assets under management is 200% of that assumed in profile 3). The 200% profile is the same as profile 3, except the velocity, which is 200% of the assumed velocity in profile 3 and the value of assets under management is 50% of the value assumed in profile 3.
Source: Oxera analysis.
0
1
2
3
4
5
6
7
50% 100% 200%

Global cost benchmarking of cash equity clearing and settlement services Oxera
38
Figure 3.14b Variation in total trading and post-trading costs according to the velocity of investor (bp)—truncated
Note: The total trading and post-trading fees for Brazil, Singapore and Spain are truncated at 2bp.
Source: Oxera analysis.
Average trade size of the broker: increasing the average trade size of the broker reduces the cost of trading services when considered relative to the value of trading, where a per-transaction fee or per-transaction-fee floor is a significant driver of user costs, as is the case at SIX (Switzerland) and Hong Kong Stock Exchange. Increasing the average trade size also reduces clearing costs when considered relative to the value of trading, where clearing fees are based on the pre-netting number of transactions, as is the case at LCH.Clearnet S.A. (UK), EuroCCP, (UK) JSCC (Japan) and x-clear (Switzerland). Figures 3.15a and 3.15b summarise these overall impacts on the total costs of trading and post-trading services for profile 3. The 400% scenario is roughly representative of brokers in Switzerland.
0.0
0.2
0.4
0.6
0.8
1.0
1.2
1.4
1.6
1.8
2.0
50% 100% 200%

Global cost benchmarking of cash equity clearing and settlement services Oxera
39
Figure 3. 15a Variation in total trading and post-trading costs according to the average trade size of broker (bp)
Note: Profile 3 (small long-only fund manager using medium-sized intermediaries) represents the baseline (100%) profile. The 25% profile is the same as profile 3, except the average trade size of the broker is 25% of that assumed in profile 3, and number of trades is 400% of that assumed in profile 3. The 400% profile is the same as profile 3, but the average trade size is 400% of the value assumed in profile 3, and the number of trades is 25%.
Source: Oxera analysis.
Figure 3.15b Variation in total trading and post-trading costs according to the average trade size of broker (bp)—truncated
Note: The total trading and post-trading fees for Hong Kong (25%), Brazil, Singapore, Switzerland (25%) and Spain are truncated at 2bp.
Source: Oxera analysis.
Size of custodian’s account: changing the size of the custodian’s account does not have a material effect on the costs of trading and post-trading services provided by the selected FMIs. However, increasing the size of the
0
2
4
6
8
10
12
14
16
25% 100% 400%
0.0
0.2
0.4
0.6
0.8
1.0
1.2
1.4
1.6
1.8
2.0
25% 100% 400%

Global cost benchmarking of cash equity clearing and settlement services Oxera
40
custodian’s account results in greater volume discounts where a fee is charged relative to the value of the client’s assets under management (e.g. at European CSDs, DTC in the US, BM&F Bovespa in Brazil, JASDEC in Japan); except for JASDEC and Iberclear, where there is a small reduction in costs, there is no material impact on the results for the other FMIs when a range of 25–400% is considered.
Activity of broker and clearing participant: where there are volume discounts, increasing the size of the broker and clearing participant results in lower trading and clearing costs. This has only a small material impact on the results for some FMIs, including those in the following financial centres: Spain, Switzerland, Japan, UK (EuroCCP) and UK (LCH.Clearnet), France, Denmark and Germany, as shown in Figures 3.16a and 3.16b.
Figure 3.16a Variation in total trading and post-trading costs according to the size of the broker (bp)
Note: Profile 3 (small long-only fund manager using medium-sized intermediaries) represents the baseline (100%) profile. The 50% profile is the same as profile 3, except the value of trading, number of trades and value of the custodian’s account are 50% of those assumed in profile 3. The 200% profile is the same as profile 3, but the value of trading, number of trades and value of the custodian’s account are 200% of the values assumed in profile 3.
Source: Oxera analysis.
0
1
2
3
4
5
6
7
50% 100% 200%

Global cost benchmarking of cash equity clearing and settlement services Oxera
41
Figure 3.16b Variation in total trading and post-trading costs according to the size of the broker (bp)—truncated
Note: The total trading and post-trading fees for Brazil, Singapore and Spain are truncated at 2bp.
Source: Oxera analysis.
3.5 Conclusion: overview of ASX’s position based on user-profile analysis
The total cost of trading and post-trading services provided by ASX is at the low end of the middle group of FMIs considered in this analysis, at between 0.4bp and 0.7bp for Australian institutional investors (see Figure 3.7). This means that once the scale of trading in Australia is taken into account, costs are consistent with what is observed in other financial centres (see Figure 3.2).
Trading fees at ASX are particularly low given the scale of operations in Australia; of the FMIs considered in this cost benchmarking exercise, only BATS Chi-X Europe and TMX (Canada) offer lower trading fees. Post-trading fees are not out of line either, and are comparable to those charged in the UK (when considering clearing at either LCH.Clearnet Ltd or EuroCCP), France, Germany and Japan (markets comparable in size to Australia or larger), and lower than those observed in Hong Kong, Singapore, Brazil and Spain (markets comparable in size to Australia or smaller).
The disaggregated analysis of post-trading fees for CCP and CSD services, which can be presented for only a subset of FMIs owing to the bundling of different services in a single post-trading fee by some FMIs,23 finds that the fees charged by ASX for CSD services for institutional investors are at the low end of the spectrum or towards the middle, whereas fees for CCP services are at the high end. In the case of CSD services, for institutional investors with large order sizes, only DTC (in the USA) offers a service lower in cost than ASX. The same does not hold for institutional investors with smaller order sizes, as the significance of the DvP message fee (type 101) when considered relative to the
23
A breakdown in fees between CCP and CSD services could not be provided for five FMIs, of which the following three have particularly high total post-trading fees: BM&F Bovespa in Brazil, SGX in Singapore, and IberClear in Spain. The other two FMIs are CCASS in Hong Kong, which charges slightly higher total post-trading fees than ASX, and KSD in Korea, which charges very low total post-trading fees.
0.0
0.2
0.4
0.6
0.8
1.0
1.2
1.4
1.6
1.8
2.0
50% 100% 200%

Global cost benchmarking of cash equity clearing and settlement services Oxera
42
value of the investor’s trade increases as the investor’s order size falls. For such investors the fees charged by ASX are in line with those charged, for example, by CDS in Canada and Euroclear for French stocks.
In terms of CCP services, ASX charges a uniform fee of 0.25bp for all trades cleared, which is generally higher than charged by the other FMIs in the (small) group for which the breakdown between CCP and CSD fees could be estimated. The FMIs operating the lowest cost service are NSCC (in the USA) and CDS (in Canada). Other CCPs charging higher fees based on the Australian profile analysis include CCPs that provide strong volume discounts, such as LCH.Clearnet Ltd and Eurex. This means that fees typically paid by their local customers, which generally clear larger volumes than Australian clearing participants, would be best represented by profile 4, at around 0.1bp.
The cost of using FMI services varies much more for retail investors than institutional investors, both within a financial centre—according to how frequently they trade, their order size and the size of intermediary they use—and between different financial centres. The cost of using ASX services for most retail investors would be 1–2bp, which, as shown in Figure 3.8, is comparable to the range of costs incurred by retail investors in the UK (when clearing at either EuroCCP or LCH.Clearnet Ltd), Denmark, Japan and Hong Kong. Overall, for most retail investors, the costs of using ASX services lie in the middle of the (very broad) range of the costs of using the services of any of the FMIs in this analysis.

Global cost benchmarking of cash equity clearing and settlement services Oxera
43
4 Comparison of clearing and settlement systems
The analysis presented in section 3 found substantial variation in the total costs for trading and post-trading services. As explained, the scale of operations of the FMIs can explain much of the observed variation in costs between these financial centres.
The purpose of this section is to explore the main differences in the services and systems operated by each FMI, to understand whether some of these differences can provide further explanations for the observed variations in fees charged to users.
Section 4.2 explores the key differences in risk management services. From a user cost perspective, the most significant difference is whether the clearing costs estimated in section 3 include the provision of CCP services. Of next significance (from a user-cost perspective) is the position of participants’ contribution in the default waterfall and the extent to which the CCP itself provides a buffer to protect the capital committed by non-defaulting participants.
Section 4.3 analyses the main differences in the clearing and settlement services and systems, including, for example, the variation in netting efficiencies, and failure rates.
Appendix 5 also supports this section by giving an overview of the market structures of each financial centre, their potential advantages and disadvantages, and the implications for user costs. An assessment of the optimal market structure for cash equity trading in Australia, or the impact of changing the current market structure, is beyond the scope of this report.
4.1 Risk management services
CCP clearing has become the international standard for risk management of trading across all asset classes, spurred on from the commitment by the G20 to centrally clear all standardised OTC derivatives.24 In the case of equity markets, all of the comparator financial centres, except for Spain, have CCP facilities for most, if not all, stocks.25 26
With CCP clearing, the CCP becomes the counterparty to each side of a transaction that is executed at the trading venues (i.e. a CCP acts as buyer to every seller and seller to every buyer in a transaction), and therefore assumes any counterparty risk that those trading would otherwise have to assume. This process is referred to as novation.
In the case of trades executed on BME (the Spanish incumbent trading platform), a CCP facility does not currently exist and no novation service is offered. Instead, traders receive some protection from counterparty default through a guarantee fund. This fund has some similarities to the default funds commonly managed by CCPs: it comprises daily contributions from clearing participants, set according to the exposure that each participant poses to the market. However, importantly, Iberclear is not obligated to fulfil the settlement obligations of the defaulting participant and the risk of counterparty default remains with each of the trading parties.
24
G-20 Leaders' Statement: The Pittsburgh Summit, September 2009. The statement is available at: http://www.canadainternational.gc.ca/g20/summit-sommet/g20/declaration_092509.aspx?view=d
25 In Spain, EuroCCP offers CCP services for the execution of trades in Spanish stocks on BATS Chi-X Europe. A CCP facility is being established to novate trades executed on BME.
26 For the less illiquid stocks, central counterparty clearing might not be available.

Global cost benchmarking of cash equity clearing and settlement services Oxera
44
There is also a key distinction in Canada, where CDS novates trades only on the eve prior to the intended settlement, which is generally t+3.
The lower responsibility taken by Iberclear and CDS would suggest that the costs of their clearing operations would be lower than elsewhere—indeed, CDS’s CCP fees of around 0.02bp are a fraction of the fees charged by all other CCPs, with the exception of NSCC (the USA CCP). The same does not hold for Iberclear, where total post-trading costs are at the high end of those observed in this study. However, this might be because the complete absence of a CCP facility at Iberclear means that each trade is settled on a trade-by-trade basis, potentially increasing the costs of clearing and settlement operations.
Elsewhere, the function that the CCP fulfils is effectively the same across all financial centres, although differences in the structure of the default waterfall (i.e. on whom the costs of a default fall and in what order) do vary, which can have a significant impact on the overall costs to users. Other aspects that can affect user costs include the account structure and scope of CCP services and the handling of client collateral—for example, whether the CCP passes back to participants any earnings on participants’ margins.
The impact on investors’ costs from variations on these aspects is covered in the following sub-sections.
4.1.1 The default waterfall
The default waterfall is a term commonly used to describe how a CCP will finance the fulfilment of counterparty settlement obligations in the case of that counterparty’s default.
The structure of the default waterfall affects the degree of risk protection provided by the CCP to its clearing participants, as well as the overall cost to the participant of using the CCP (see Box 4.1).
Box 4.1 Impact of different default waterfalls on user costs
The default waterfall that is common across many of the CCPs considered in this study is as follows.
Source: Oxera.
Tier 1a
Tier 1b
Tier 2
Tier 3
Tier 4
Margin of the defaulting
participant
Clearing fund contribution of the
defaulting participants
Tranche of CCP’s own resources
Clearing fund contributions from
non-defaulting participants
Additional resources including, for example, the remainder of
CCP equity, central bank guarantees, insurance
Application of
resources

Global cost benchmarking of cash equity clearing and settlement services Oxera
45
The main ways by which the structure of the default waterfall affects the risk protection provided by, and the cost to the participant of using, the CCP are as follows.
Overall value of resources—increasing pre-funding arrangements can increase the upfront cost of using a CCP (according to who contributes to the pre-funding arrangements), but simultaneously reduces the exposure of the CCP to members in the event of default.
CCP’s own resources at risk—the greater the amount of the CCP’s own resources that are at risk, the higher its position in the waterfall and increasing its relative size to the amounts committed by clearing participants, the greater the risk protection provided by the CCP to its participants.
Participant’s contributions—the greater the value that each participant is required to commit to the CCP, either as margin or as a contribution to the default fund (also known as the default fund in some financial centres), the higher the overall cost of the services provided by the CCP to the participant.
Basis of participant contributions—the more tailored the commitments that participants are required to make (whether this is as margin or to the default fund) to the risk they pose to the CCP (if this can be effectively estimated ex ante), the lower the cost to the safer participant.
Pooling of participant’s contributions—where there is a strict delineation between a participant’s margin that can be used only (except, perhaps, in extreme circumstances) to help finance its own settlement obligations should it default and other collateral posted at the CCP that can be used to cover shortfalls caused by another participant’s default (e.g. a default fund), shifting the balance of a participant’s commitments towards the margin from default fund contributions will lower the risk of using the CCP to participants with lower than average risk of default.
Source: Oxera.
4.1.2 Consistency in Tier 1
In line with the updated guidelines for FMI issued by the Committee on Payment and Settlement Systems (CPSS) and International Organization of Securities Commissions (IOSCO),27 all the CCPs considered in this study use collateral lodged by the defaulting participant as the first tier of protection.
In terms of the magnitude of the contribution that each participant is required to make, the CPSS/IOSCO (2012) recommend that the:
initial margin should meet an established single-tailed confidence level of at least 99 percent of the estimated distribution future exposure (paragraph 3.4.18)
Oxera understands that this recommendation has become industry practice. The CCPs (or FMIs providing CCP services) that responded to Oxera’s request for information confirmed that they adhere to this standard.
27
CPSS/IOSCO (2012), ‘Principles for financial market infrastructures’, April, available at: https://www.bis.org/publ/cpss101a.pdf.

Global cost benchmarking of cash equity clearing and settlement services Oxera
46
4.1.3 Variation in Tier 2
There is more variation between the CCPs as to whether the next tier is contributions lodged by non-defaulting participants or another source such as the CCP’s own resources.
Table 4.1 sets out the value of funds that are used after the defaulting participant’s collateral, but before the collateral lodge by non-defaulting participants, at various CCPs. (Data was not available to include EuroCCP, and LCH.Clearnet S.A. or x-clear.) At all CCPs except JSCC, this buffer is fully funded by the CCP’s own resources; at JSCC, the first AU$124m is funded by the exchanges.
Table 4.1 Protection for non-defaulting participants funds
Buffer (AU$m) Value of share trading (AU$bn)
Buffer as a proportion of value traded (bp)
KRX (Korea) 0 1,561 0.00
CDS (Canada) 0 1,345 0.00
NSCC (USA) 48 13,631 0.03
LCH.Clearnet Ltd (UK) 32 1,237 0.26
CCASS (Hong Kong) 30 1,121 0.27
Eurex (Germany) 66 1,311 0.51
JSCC (Japan) 260 3,110 0.83
CDP 24 258 0.94
ASX Clear 250 903 2.77
Notes: A two-year average foreign exchange rate is used to convert the revenue figures into AU$.
Source: Annual reports and service descriptions.
Table 4.1 shows that at most CCPs, once the defaulting participant’s margin has been exhausted, there is little further protection for non-defaulting participants’ collateral. In the case of CDS and KRX, no such protection exists.28 However, at ASX Clear, the buffer is intended to be large enough to protect non-defaulting participants’ collateral in all but very extreme circumstances.29
These default arrangements imply that ASX Clear will have a higher probability of loss of own resources relative to participants in case of default, leading to a higher risk profile of the business and hence a higher cost of financing. To cover this higher cost, the CCP may need to impose higher fees. At the same time, participants will realise cost savings as the collateral they post at ASX Clear is (much less) likely to be used to settle the obligations of another participant’s default.
The cost of financing the default fund is driven by the risk exposure of the default fund minus any interest that can be earned on the capital while it is held in the default fund. The risk exposure of the default fund is, broadly speaking, the average risk of default of the counterparties trading through the CCP. The cost is therefore the same for the clearing participants as it is for the CCP. In practice,
28
Korea is considering reordering its Tiers 2 and 3 to ‘match international standards’. See, for example, Grant, J. (2014), ‘Banks launch clearing review after Korean broker default’, reporting for The Financial Times, 7 March. http://www.ft.com/cms/s/0/14b59838-a4d6-11e3-9313-00144feab7de.html#axzz2vlBmAvWx
29 The buffer is made up of a restricted capital reserve of AU$71.5m and an additional AU$178.5m of dedicated ASX capital and subordinated debt.

Global cost benchmarking of cash equity clearing and settlement services Oxera
47
the risk associated with the default fund can be estimated by taking the average cost of long-term debt financing of the ASX clearing participants—assumed to be 5.2%.30 This should be a reasonable approximation of the default risk of the collateral contributed to the fund by participants (i.e. the risk they face of not being able to get their money back because it has been used to pay for a failure of a participant in the CCP not to meet its obligations). (See Appendix 6 for a more detailed description of the rational for adopting this methodology.)
Offset against this gross cost is the interest earned on the default fund that may be passed back to participants. The potential interest that can be earned on collateral held at ASX Clear can be proxied by the Australian cash rate, taken to be 2.5%.31 (Restrictions on how a CCP can invest capital committed, including restrictions on cross-currency investments, mean that the potential earning rate is nation-specific.)
It is assumed that the default fund is of optimal size—i.e. should ASX not fund the default fund, participants in aggregate would have to contribute the same as what ASX currently secures; namely, AU$250m.32 Applying the net cost of financing (approximated by the bond yield less the interest on default funds) to the total value of the fund gives a lower bound of the total cost of the default fund based on the assumption that the interest rate is paid out to the participants (i.e. assuming a net cost of financing rate of 2.72%) and an upper bound based on the assumption that participants do not receive interest on the default funds (i.e. assuming a net cost of financing rate of 5.2%). (See Appendix 6 for more detail on the estimation approach.) Thus, the estimated range of the cost of the default fund is between 0.04bp and 0.07bp.33
Overall, these estimates suggest that, in order to compare like for like between the clearing fees charged by ASX and those charged by CCPs where the default fund is composed of participants’ contributions (and there is minimal additional protection by the CCP), ASX fees should be reduced by around 0.04–0.07bp based on the methodology for the estimated cost of funding the default fund.
Where there is some protection to non-defaulting participants’ collateral, in addition to the defaulting participant’s own collateral, the reduction to ASX fees is slightly less. Compared with CDP, the CCP providing the next greatest level of protection after ASX (as shown in Table 4.1), the relevant reduction to ASX’s fees is between 0.03bp and 0.06bp.
4.1.4 Handling of participants’ collateral
There is variation in the handling of participants’ collateral between CCPs. This variation covers aspects including:
the types of collateral accepted;
the haircuts applied to the less liquid instruments;
whether interest generated on the collateral held by the CCP, on behalf of participants, is passed back to participants.
30
Based on the average spread on the euro and sterling bond yield using the IBOXX index for single A-rated financial corporations’ bonds with maturity of ten years and the ten-year Australian government bond yield.
31 Based on Reserve Bank of Australia data.
32 Composed of the restricted capital reserve of AU$ 71.5m, equity of AU$ 103.5m and subordinated debt of AU$ 75m.
33 The cost of the default fund in basis points is based on the following calculation:
{ h }
.

Global cost benchmarking of cash equity clearing and settlement services Oxera
48
The updated guidelines for financial market infrastructures from CPSS/IOSCO cover some of these aspects—in particular, the types of collateral that CCPs should accept. CPSS/IOSCO recommends that:
CCPs should (only) accept collateral with low credit, liquidity and market risks, and set and enforce appropriately conservative haircuts and concentration limits (Principle 5);
in general, guarantees should not be considered acceptable collateral—exceptions include when the guarantee is from a central bank (paragraph 3.5.2).
This suggests that, over time, there will be convergence in the types of financial instrument that will be accepted as collateral, and the conditions surrounding different security types. However, at present considerable variation remains. For example, the CCP in Singapore accepts only cash contributions to the default fund, whereas in most other financial centres government bonds are an acceptable form of collateral. At some CCPs (e.g. in Brazil), equity is also accepted.
The more restrictive the types of acceptable collateral and the greater the haircuts applied to the less liquid instruments, the higher the cost to users of supplying that collateral, and, hence, of using the CCP’s services. However, by increasing the robustness of the CCP, such measures may also reduce the risk to the users of the CCP of having to pay out in the event of another participant’s default.
A more straightforward comparison is the treatment of any interest generated by participants’ margins held by the CCP. In some financial centres, this is passed back in full to clearing members—for example, as is the case at EuroCCP—elsewhere a spread may be kept by the CCP—for example, as is the case at Eurex Clearing and CDP.
Although interest earned on participants’ margins that is not passed back to the participants provides another potential source of revenue for CCPs, the analysis presented in section 5 indicates that this is unlikely to be material at most CCPs. (The exception is LCH.Clearnet Group Ltd, where interest earned on participants’ margins is substantial. However, this is likely to be generated mainly from the commodities and derivatives part of this CCP, not the cash equity clearing part.) As a result, whether or not interest is passed back to the owners of the collateral in full, or a proportion is used by the CCP to cover its own costs (and hence allow it to reduce the direct fees charged for its services), is unlikely to have a significant impact on the fee levels actually charged which underpin the analysis in section 3.
However, the margin posted by participants could represent a material cost to users (particularly if the CCP does not pay them interest on the margin posted). Absent the margin requirement, users are likely to be able to sustain the same level of activity with less capital. The cost of this margin to users will depend on the costs to the relevant firm of additional capital that it will require. The upper boundary of this cost is likely to be the firm’s cost of capital. If, for example, the cost of capital were 8% (nominal), the total costs of ASX Clear’s customers of providing the margin, which is approximately AU$139m, would be AU$11m.34 However, as the CCP (ASX Clear) currently pays 2.5% (on cash posted), the net
34
Calculated as AU$139m multiplied by 8%, the average cost of capital. The size of the total margin is based on data from ASX on the average total cash market equity margins held in the first half of 2014.

Global cost benchmarking of cash equity clearing and settlement services Oxera
49
cost to participants would approximate to 5.5%, representing a cost of around AU$8m. On total equity trading of around AU$900,000m (single count), this net cost represents an addition of around 0.04bp to the cost of clearing and settlement (on a double-count basis).35
Although this is a non-trivial amount compared with the fees that CCP users will incur, the posting of margin is a requirement in all financial markets, and most (if not all) pay participants interest on collateral held. Any significant variation in the costs of different CCPs would arise from differences in the total amount of collateral required for the same value of trading. To make a material difference to the comparison between CCPs, the differences in margin requirements would themselves need to be significant. This, in turn, would change the risk profile of using different CCPs, which would tend to raise the costs of using the ‘lower costs’ CCPs.
The methodology adopted in section 3 has therefore not taken into account any differences in margining requirements.
4.1.5 Scope of CCP services
Investors are not generally direct beneficiaries of CCPs; rather, the CCP novates market transactions between brokers (who may use third-party clearers to manage the interactions with the CCP), and national client money regulation provides the framework for investor protection for transactions consolidated by a clearing agent.
There are some exceptions to this rule. For example, JASDEC (in Japan), KSD (in Korea) and CDP (in Singapore) provide investors an option for the non-market transactions between their custodian and brokers to also be guaranteed by the CCP.36
Where national client money regulation covers the interaction between end-investors and their brokers, one of the main differences relates to the required account structures. There are three broad types of account structures:
un-segregated accounts—where the intermediary can manage client and proprietary exposures in the same account, as is the case in ASX Clear for example;
omnibus client segregation—where the intermediary must segregate client assets from proprietary assets, but individual client assets are co-mingled. This is the minimum level of segregation required under European Market and Financial Infrastructure Regulation (EMIR);37
individual client segregation—where the intermediary must segregate each client’s assets from one another, as well as from proprietary assets.
The advantage from more segregation is greater protection of individual client assets from the default of their intermediary. In the case of full segregation, client
35
Calculated as AU$8m divided by AU$1,800,000m. 0.04bp is 10% of the 0.4bp typically paid by institutional investors for FMI post-trading services in Australia.
36 In theory, as well as extending the benefits of novation, netting could be introduced to reduce settlement costs. For example, the required deliveries of the same stock from all a custodian’s clients to one broker could be netted into one movement. However, neither JASDEC nor CDP provides this netting function; in the case of CDP, this reflects the maintenance of segregated client accounts at the CSD.
37 The Regulation (EU) No 648/2012 of the European Parliament and of the Council of 4 July 2012 on OTC derivatives, central counterparties (CCPs) and trade repositories (TRs) (EMIR) entered into force on 16 August 2012.

Global cost benchmarking of cash equity clearing and settlement services Oxera
50
accounts can more easily be transferred (‘ported’) to another clearing participant. These benefits are not easily quantified, and will depend on characteristics such as the probability of intermediary default.
Greater segregation has two main disadvantages: a reduction in the netting of transactions, thereby increasing the total number of settlements and settlement fees paid; and a requirement for greater margin to be posted at the CCP because opposing client and/or house positions cannot be offset. The marginal netting efficiencies from co-mingling client accounts, and potential client and house accounts, depend on the concentration of trading within the financial centre. The greater the overlap in securities between the proprietary and client accounts, and the higher the settlement fees, the greater the potential cost saving to investors.
4.2 Settlement services
Although CSDs may operate different systems and provide different services, the fundamental services of settlement, book-entry and safekeeping are sufficiently similar for the analysis based on their pricing schedules presented in section 3 to provide a reasonably fair comparison.
The main areas through which settlement systems can operate and affect user costs are as follows:
direct settlement to final beneficiary;
netting efficiencies; and
settlement date and failure rates.
4.2.1 Direct settlement to final beneficiary
In the USA and most financial centres in Europe, securities are typically held in ‘omnibus’ accounts at the local CSD. These accounts are managed by an intermediary (often a custodian bank), and hold securities that are owned by several different investors. As the settlement process by the CSD finishes at the level of the custodian, an important part of the services provided by custodians is keeping track of securities that they hold in their omnibus accounts at the CSD, between their clients in their own internal systems.
In comparison, the CSDs in Brazil, Denmark, Singapore and Australia for retail investors hold accounts at the individual investor level.38 Although investors often appoint an ‘account operator’ or ‘sponsor’ to help with the management of these accounts, these CSD systems automatically settle at the end-investor level, and therefore undertake a core service provided by custodians at CSDs where omnibus accounts are held, as shown in Figure 4.1.
38
ASX Settlement offers both an end-investor account system and an omnibus account management system. Commonly, shares owned by retail investors are held in end-investor accounts, whereas institutional investors typically choose the omnibus account system. CDP (the CSD in Singapore) offers two variants of the individual investor account model: direct participation—where there is no account nominee, and an investor’s account at the CSD is directly linked to their broker’s account to automate the processing of trade instructions; and a nominee system—where an account operator manages the segregated client accounts on behalf of a number of investors. Retail investors tend to prefer the direct participation model, while institutional investors choose the nominee system. The Korean CSD also allows institutional investors to hold accounts in their own name.

Global cost benchmarking of cash equity clearing and settlement services Oxera
51
Figure 4.1 Settlement processes at omnibus and end-investor account CSDs
Source: Oxera.
Where the CSD holds end-investor accounts, it will usually have many more accounts to deal with. Because it is effectively delivering securities to a greater number of accounts, it may therefore have more settlements to process. However, even where there are omnibus accounts, movements between an omnibus account (held by a custodian) and the broker of the custodian’s client (the ‘client-side transactions’ in Figure 4.1) may still occur on an end-client basis. Although the custodian and/or the relevant broker could instruct the CSD on a net basis—for example, a custodian wishing to transfer the same security on behalf of multiple clients to the same broker could instruct the CSD to make one transfer to the broker, rather than one for each client—Oxera’s understanding is that, in general, this does not occur. For the purposes of the analysis in section 3, it is assumed that there is no netting in this part of the value chain.
To the extent that end-user accounts do increase the cost base for CSDs, but reduce the costs incurred in other parts of the value chain, the analysis in section 3 will overestimate the relative costs facing users in these financial centres. This should be taken into account when comparing the results of different financial centres.
Another implication from systems that settle at the investor level is that the CSD may provide (and charge for) services commonly provided by custodians where omnibus accounts are held at the CSD. There are several services that ASX charges for that would not be provided (and therefore charged for) by a CSD operating omnibus accounts. These include:
the processing of security lending and margin lending transactions between a retail broker and their clients. Message number 101, fee AU$1.30;
updating client contact information as and when required.
In addition to the final settlement (i.e. the settlement to the investor), the maintenance of investor-level accounts allows ASX to process some other services, normally provided (and often charged for) by custodians. For example, ASX automatically processes corporate actions for stocks held by retail investors, passing on the relevant information such as voting rights or dividend payments direct to the retail investor. No additional fee is charged for this service.
CCP
Broker
Broker
Broker
Custodian
Custodian
Investor
Investor
Investor
Investor CCP
Broker
Broker
Broker
Investor
Investor
Investor
Investor
1. Settlements where omnibus accounts are held at the CSD 2. Settlements where end-investor accounts are held at the CSD –
all processed by CSD
Settlements processed by the CSD Settlements processed by
custodians Movement of securities
Settlement of
client-side
transactions
Settlement
of market
transactions
Settlement
of market
transactions
Settlement
of client-side
transactions

Global cost benchmarking of cash equity clearing and settlement services Oxera
52
4.2.2 Netting efficiency
In addition to the efficiency of the CCP’s netting algorithm, the netting efficiency achieved by a CCP depends on factors such as whether client and house accounts are segregated, the concentration in the industry for clearing participants, and the concentration of trading in particular stocks.
The following table sets out the netting efficiencies on a volume basis achieved by a number of CCPs considered as part of this study. Data was not available to include a reliable estimate for netting efficiencies on a value basis for most CCPs, and so has been omitted here. A comparison can be drawn between ASX, which has a netting efficiency (based on value) of 60%, and NSCC, which has a netting efficiency (based on value) of 97%. However, as only one (NSCC) of the FMIs considered as part of this study charges clearing or settlement fees based on the value of netted transactions, while several charge settlement fees according to the number of netted transactions, the netting efficiency on a volume basis is more relevant.
Table 4.2 Overview of netting efficiencies
Netting efficiency (volume-based)
Australia 98%
Hong Kong 96%
Singapore 82% 1
Canada 98%
Germany 92%
UK (LCH.Clearnet) 95%
Notes: The volume-based netting efficiency relates to the number of settlements associated with CCP-cleared trades as a proportion of the total CCP-cleared trades—i.e. institutional settlements that are not novated or netted are excluded from the calculation. It is calculated as follows:
The netting efficiency is based on the following: for Australia, the ASX cash market netting efficiency for January 2012 to April 2014; for Hong Kong, the one-year average of the daily netting efficiency between April 2013 and March 2014 reported by HKEx; for UK(LCH.Clearnet) and Germany, the number of delivery instructions processed on account of CCPs by the CSD, respectively Euroclear and Clearstream, relative to the number of equity trades on LSE and Deutsche Börse respectively, in 2010.
1 The netting efficiency relates to transactions and
settlements from institutional investors only.
Source: Information from ASX; HKEx statistics (http://www.hkex.com.hk/eng/stat/clearstat/secclrsettstat/statistic16.1.htm); Information provided by CDS; European Central Bank data.
The relatively low netting efficiency achieved by Singapore reflects the holding of client-segregated accounts at the CSD, and the fact that, in the majority of cases, investors choose for the CDP to novate the custodian to broker settlement, as well as the settlement of market, broker-to-broker transactions. Where this is the case, the CDP moves securities directly from the segregated account of the selling investor to the segregated account of the buying investor, thereby reducing the extent to which transactions can be netted.
The effect of the observed variation in netting efficiencies on users’ costs depends on the significance of fees for market settlements relative to the overall post-trading costs. In the case of ASX, as the fee for market settlement is relatively low, at AU$0.30, the effect is small, albeit not insignificant. For example, increasing the netting efficiency from 92% to 98% lowers the total post-

Global cost benchmarking of cash equity clearing and settlement services Oxera
53
trading costs at ASX for a small long-only fund manager using a mid-sized Australian broker (profile 3) by 0.04bp, from 0.34bp to 0.30bp.
4.2.3 Settlement date and failure rates
Table 4.3 shows the settlement dates and proportion of trades that fail to settle within one day of the intended settlement date (ISD)—i.e. within ISD +1. The CSDs are grouped by settlement date and, within these groups, ordered by decreasing failure rates.
Table 4.3 Overview of settlement dates and failure rates
CSD Settlement date Failure rates
UK Euroclear UK&I T+3 3.50%
Denmark VP Securities T+3 1.20%
Switzerland SIX SIS T+3 0.41%
Australia ASX Settlement T+3 0.32%
France Euroclear France T+3 0.10%
Spain Iberclear T+3 0.01%
Brazil CBLC T+3 n.a.
Canada CDS T+3 n.a.
Singapore CDP T+3 n.a.
Germany Clearstream Banking AG
T+2 1.20%
Hong Kong CCASS T+2 0.01%
Japan JASDEC T-T+3 n.a.
Korea Korea Securities Depository
T, T+1, T+2 n.a.
USA DTC T, T+3 n.a.
Note: The settlement failure rate refers to the proportion of transactions that fail to settle in the CSD by the end of the day following the intended settlement date. The failure rates are based on 2012 data for the European CSDs and CCASS and 2013 data for ASX Settlement.
Source: CPSS, Red Book statistical update, Table CSD1. Iberclear, SIX SIS and VP Securities service descriptions published on their websites. ASX data on failure rates. European Central Securities Depositories Association (2012), ‘2012 Statistical exercise on matching and settlement efficiency’, 18 September. HKEx, 2012 annual report
Table 4.3 shows that most CSDs operate a T+3 settlement cycle. However, most, including ASX,39 are considering moving to a T+2 settlement cycle. In the case of Europe, forthcoming regulation will require implementation of a T+2 cycle by January 2015,40 with several CSDs announcing a switch date prior to this.41
The advantages of a shorter settlement cycle include risk reduction and cost savings. For example, shortening the settlement cycle would reduce the duration to which an investor is exposed to their broker in relation to the settlement of
39
ASX (2014), ‘Shortening the settlement cycle in Australia: transitioning to T+2 for cash equities’, consultation paper, 25 February.
40 European Commission (2012), ‘Proposal for a Regulation of the European Parliament and of the Council on improving securities settlement in the European Union and on central securities depositories (CSDs) and amending Directive 98/26/EC’, March.
41 For example, Euroclear UK&I intends to switch in October 2014.

Global cost benchmarking of cash equity clearing and settlement services Oxera
54
client orders, which are generally unguaranteed and free-of-payment. 42 Reducing the settlement cycle also reduces the risk the CCP is exposed to, and could therefore result in cost savings to participants as margin requirements would be expected to fall.
The implementation challenge of shortening the settlement cycle is that brokers may need to increase the efficiencies of their back-office operations required to process each trade. This challenge is being addressed in Australia by allowing for a sufficiently long transition period, with T+2 probably not happening until Q1 2016.
Fail management fees have not been included in the analysis presented in section 3 because when a trade fails to settle on the CSD, a buy-in process usually occurs, and a large component of the cost of failing to deliver securities on time to the broker depends on market liquidity and the outcome of the buy-in process, rather than the efficiencies of the services and systems operated by the FMI, the focus of this analysis.
Table 4.3 shows considerable range in the failure rates between CSDs considered in this analysis. This range is due to differences in the efficiencies not only of the services and systems operated by the CSDs, but of the processes of local brokers, investors and custodians. The range suggests that the typical costs to users of trading and post-trading in the UK, Denmark and Germany could be higher than in other financial centres than as estimated in section 3. Across the Australian trading community, fail fees accounted for 2% of total clearing, settlement and fail fees in 2013. No data on this in the public domain is available for other FMIs.
4.3 Conclusion
Although in many cases the clearing and settlement services provided by the FMIs considered in this study are similar in nature there are some fundamental differences that can affect user costs.
In terms of clearing services the main differences are as follows:
For trades executed on BME (in Spain), no CCP or netting service is currently provided, and for trades cleared at CDS (the Canadian CCP) the timing of novation is the intended settlement date.
There are some differences in the positions of participants’ contributions in the CCP default waterfall and the extent to which the CCP itself provides a buffer to protect the capital committed by non-defaulting participants. The analysis indicates that ASX Clear provides substantially more protection against this risk than the other CCPs. The benefit to CCP users of ASX’s commitment to the default fund is estimated at between 0.04bp and 0.07bp. (This is based on an assumed net cost of financing rate of between 2.7% and 5.2%—see Appendix 6 for underlying calculations.)
In addition to revenues from clearing fees, CCPs may earn revenues on the difference between the interest they earn on margins received from participants and what they themselves pay participants—‘net interest earned on participants’ margins’. However, for most CCPs (or FMIs with a CCP), net interest earned on participants’ margins is small. For example, net interest
42
As described in section 4.2.1, CCPs in Japan and Singapore offer investors an option to guarantee these institutional settlement transactions.

Global cost benchmarking of cash equity clearing and settlement services Oxera
55
earned on participants’ margins by ASX Clear is estimated to account for 2% of clearing revenues, and some CCPs have a policy of returning all interest back to participants, for example, EuroCCP. This confirms that ignoring any net interest margin on participants’ margins does not materially distort the comparison between FMIs based on the tariff schedules
In terms of settlement services, the main way in which settlement systems can differ and affect user costs, is whether settlement is directly to the final beneficiary. Compared to where CSDs hold omnibus accounts, direct settlement to the final beneficiary can reduce the costs of services provided by custodians, and increase the costs of operating as a CSD. However, the impact on users’ costs will depend on how the custodians interact with the CSD and therefore will differ between financial centres.

Global cost benchmarking of cash equity clearing and settlement services Oxera
56
5 Analysis of financials
5.1 Objectives and scope
The objective of this section is to analyse financial metrics for operating margins, returns on assets and returns on equity to complement the user-profile analysis. Specifically, this section:
assesses the importance of income generated from the equity business of the FMI not captured by analysis of the pricing schedules that underpins the user-profile approach. For example, income generated from net interest earned on collateral collected from participants;
considers the impact of the different amounts of capital committed by each FMI to the default waterfall on the returns generated by the fees underpinning the analysis presented in section 3;
examines the sustainability of the prices underpinning the results of the pricing schedule analysis.
In general, only data at the group-wide level for each FMI is available, and it is therefore not possible to undertake specific analysis of the cash equity businesses. The exceptions are ASX, which, in line with its commitments within the Code of Practice, has published audited segregated accounts for its cash equity post-trading businesses since 2013, and EuroCCP, which operates only equity CCP services. Table 5.1 gives an overview of the businesses operated by each FMI considered in the analysis, and, where possible, the relative amounts of cash equity revenues.
This section presents some standard financial metrics. It does not present a profitability assessment of the FMIs or their cash equity business, which would require information rarely available in published financial statements, such as the economic value of the capital invested in their cash equity businesses and adjustments to take account of the different accounting standards and financial years, for example.43
5.2 Overview of FMI businesses
Table 5.1 below highlights the heterogeneity within the subset of FMIs for which the financial metrics have been analysed: it shows the total revenues generated and the relative importance of the cash equity business. This context is important to bear in mind when interpreting the results of the analysis. Some FMIs have been omitted from the analysis owing to a lack of sufficient information and data.
43
For a discussion of the requirements for a detailed profitability analysis, see, for example, a study prepared by Oxera for the UK Office of Fair Trading. OFT (2003), ‘Assessing the profitability in competition policy analysis’, Economic Discussion paper 6, prepared by Oxera, July.

Global cost benchmarking of cash equity clearing and settlement services Oxera
57
Table 5.1 Total revenue and proportion of cash business
Overview Total revenues in 2012 (AU$m)
Approximate % of 2012 revenues from cash
equity business
ASX (Australia) Vertically integrated, multi-asset FMI
610 20%
BME (Spain) Vertically integrated, multi-asset FMI
388 40–80%1
BM&F Bovespa (Brazil)
Vertically integrated, multi-asset FMI
980 50-60%2
CDS (Canada) Vertically integrated, securities FMI (CCP & CSD)
90 n.a.
Deutsche Börse (Germany)
Vertically integrated, multi-asset FMI
2,849 10–25%3
EuroCCP Equity CCP 27 100%
HKEx (Hong Kong)
Vertically integrated, multi-asset FMI
943 50–65%4
JSCC (Japan) Multi-asset CCP 83 n.a.
LCH.Clearnet Multi-asset CCP 5207 10–15%
5
SGX (Singapore)
Vertically integrated, multi-asset FMI
526 50–65%6
SIX (Switzerland)
Vertically integrated, multi-asset FMI
1,425 n.a.
Notes: A two-year average foreign exchange rate is used to convert the revenue figures into AU$. 1
The lower bound is based on equities trading and some post-trading revenue relative to total revenue, while the upper bound includes clearing and settlement, listing and information revenues, which cover fixed incomes in addition to equities.
2 The upper bound is based on the revenue
associated with Bovespa’s trading and settlement system, while, in addition to these, the upper bound includes revenue from listing and depository.
3 The lower bound is based on the revenue
from Xetra relative to total revenue, while the upper bound is based on the revenue from Xetra and market data relative to the total.
4 The lower bound is based on the cash market trading fees,
clearing and settlement fees, and depository and custody revenue relative to total revenue, while the upper bound includes listing and market data revenues as well.
5 The lower bound is based on
clearing fee revenue from cash equities as a proportion of total revenue, while the upper bound is based on clearing fee revenues from cash equities relative to the total clearing fee revenue.
6 The
lower bound is based on the revenue from securities trading and clearing services and depository services relative to total revenue, while the upper bound also includes market data and issuer services.
Sources: ASX Ltd, ‘Annual report 2013’; BM&FBovespa, ‘Annual Report 2012’; BME, ‘Annual report 2012’; The Canadian Depository for Securities Limited, ‘2012 Annual Report’; Deutsche Börse Group, ‘Corporate report 2013’; LCH.Clearnet Group Ltd, ‘Proven risk management: annual report and accounts 2012’; Hong Kong Exchange and Clearing Limited, ‘2012 Annual Report’; Japan Securities Clearing Corporation, ‘JSCC Annual Report 2013’; Singapore Exchange, ‘Annual Report 2012’; European Central Counterparty Limited, ‘Report and financial statements for the year ended 31 December 2012’; SIX, ‘Annual report 2012’.
5.3 Analysis of operating margins
In general, the ‘core’ operational revenue to FMIs comes from the transaction-based and membership fees charged to participants. In the case of CCPs, however, there is an additional potential source of revenue: interest earned on participant’s collateral. The difference between the interest earned on collateral and the amount of interest passed on to the participants is the CCP’s net income from the interest on members’ collateral. Depending on the company’s policy and rules, the net income might be zero if the total interest is returned to the participants, as is the case at NSCC, CDS, EuroCCP, Eurex Clearing and CDP, or positive if the amount returned is less than the total earned.
Global cost benchmarking of cash equity clearing and settlement services Oxera
58
In the case of ASX Clear, the proportion of CCP revenues that come from the net interest margin on participants’ collateral is small: approximately AU$1m in 2012, or 2% of total cash equity CCP revenues.44
For other CCPs, data on net interest earnings includes net interest margins on participants’ collateral as well as interest earned on their own assets—i.e. no breakdown is provided. The total net interest earnings as a proportion of total clearing revenues is small for most CCPs (between 0% and 5%).45
Figure 5.1 presents two metrics to capture post-tax net earnings: the first excludes net interest earned; the second includes this additional source of revenue. The net interest earned in the calculations in Figure 5.1 refers to the total net interest earned, which includes the net interest earned on participants’ collateral, but might also include interest earned on their own assets—as explained, FMIs do not provide a breakdown in their annual accounts.
To avoid any distortion from the deferral of tax payments, tax has been accounted for by applying the statutory corporate tax rate to earnings before net interest expense and taxation (EBIT) or the sum of EBIT plus net interest earnings on participant’s collateral. Specifically, the metrics are calculated as follows:
first column (dark shading):
{EBIT * (1 – statutory tax rate)} ÷ operating revenues
second column (light shading):
{(EBIT + net interest earnings on participants’ collateral) * (1 – statutory tax rate)} ÷ {operating revenues + net interest earnings on participants’ collateral}
The results for each FMI are ordered alphabetically. The green shading indicates that the results cover the full services provided by the FMI and these services include trading, clearing and settlement services. The grey shading indicates that the results reflect only the CCP services provided, and the brown shading is used to indicate that the results for ASX Settlement relate to CSD services only.
44
This was calculated as follows: ASX reports a net earning rate on participants’ margins across its whole business of 46bp (see ASX Annual report 2012) and that, as at June 2012, participants’ margins for cash equity trades amounted to AU$ 212m. Multiplying 46bp with AU$ 212m results in an estimate of net interest earnings of AU$ 0.975m. CCP fee revenue is reported to be AU$ 42.5 m in 2013. Assuming that revenues have stayed relatively stable over time, the net interest earning relative to total CCP revenues is approximately 2%.
45 Except for Bovespa (around 12%) and LCH-Clearnet (around 50%). The ratios for Bovespa and LCH-Clearnet are likely to be driven by interest earned on participants’ collateral in relation to the derivatives rather than cash equity business.

Global cost benchmarking of cash equity clearing and settlement services Oxera
59
Figure 5.1 Post-tax net earning margins
Source: Oxera analysis of financial statements, annual reports listed in source to Table 5.1Error! Reference source not found., and ASX 2013 management income statements.
The main messages from Figure 5.1 can be summarised as follows.
Interest earned is an important source of revenue for one multi-asset, multi-national CCP: LCH.Clearnet. However, this is, likely to be generated mainly from net interest margins on participants’ collateral in relation to the commodities and derivatives part of this CCP, not the cash equity clearing part. This is because the commodities and derivatives clearing business of this CCP accounts for the majority of its clearing fee revenues (c. 70% in 2012) and margin requirements for commodities and derivatives trades are generally much larger than for equity trades, owing to the longer maturity of the contracts.
Except for BME, European FMIs generate lower net earning margins than typically generated by FMIs in Asia-Pacific. This is particularly the case for EuroCCP, which has made a substantial operating loss for a number of years. EuroCCP has recently merged with EMCF, another sizeable CCP within Europe, and the combined entity made a small profit in 2013.
The relationship between the size of the cash equity clearing business of the FMI and the margins generated was also explored and found not to be significant (not presented).
Operating margins do not take into account the different capital intensities of the various FMIs. This is considered in the following sections, which looks at the returns generated.
5.4 Analysis of returns
Figure 5.2 below presents the post-tax return on equity, using the same shading as in Figure 5.1.
The post-tax return on equity is calculated as follows:
-60%
-40%
-20%
0%
20%
40%
60%
80%
AS
X L
td
AS
X C
lea
r
AS
X S
ett
lem
en
t
BM
E
BM
&F
Bo
ve
sp
a
CD
S
De
uts
ch
e B
örs
e
Eu
roC
CP
HK
Ex
JS
CC
LC
H.C
lea
rne
t
SG
X
SIX
Without earnings on participants' collateral Including earnings on participants' collateral

Global cost benchmarking of cash equity clearing and settlement services Oxera
60
{(EBIT+ net interest earnings on participants’ collateral) * (1 – statutory tax rate)} ÷ tangible equity
where equity is total equity (i.e. the difference between total assets and total liabilities) minus goodwill. Goodwill has been excluded so as to increase the comparability of the reporting approaches between the FMIs considered.
In the management income statements, ASX allocates a portion of ASX Ltd total equity (referred to as capital) to ASX Clear and ASX Settlement as follows:
ASX Clear—combination of i) AU$182.5m (or 73%) of the total cash equities and options default fund (with the portion based on stress testing exposures over the past ten years); ii) AU$15m of operational/business risk capital provided by ASX Group; and iii) AU$23.6m reflecting the original/replacement cost of ASX Clear’s infrastructure;
ASX Settlement—combination of i) AU$102.4m of operational/business risk capital provided by ASX Group based on the average value of securities held at Chess; and ii) AU$28m reflecting the value of the CHESS platform.
Given the importance of net interest earnings on participants’ collateral for at least one FMI, this has been included in the measure of returns.
Figure 5.2 Post-tax return on equity
Source: Oxera analysis of financial statements, annual reports and management income statements.
The main messages from Figure 5.2 can be summarised as follows.
There is a wide range in the returns on equity when only CCP services are considered. EuroCCP, an independent, equity-only CCP generates the lowest (negative) returns, and LCH.Clearnet, a multi-asset, multi-national and now part of the London Stock Exchange Group generates the highest returns observed, exceeding 60%.
-40%
-20%
0%
20%
40%
60%
80%
AS
X L
td
AS
X C
lea
r
AS
X S
ett
lem
en
t
BM
E
BM
&F
Bo
ve
sp
a
CD
S
De
uts
ch
e B
örs
e
Eu
roC
CP
HK
Ex
JS
CC
LC
H.C
lea
rne
t
SG
X
SIX

Global cost benchmarking of cash equity clearing and settlement services Oxera
61
Several of the FMIs with relatively low operating margins have relatively high returns on equity, and vice versa. For example, in terms of operating margins, Deutsche Börse and LCH.Clearnet were modest relative to the other FMIs considered, but have much higher returns on equity.
JSCC and ASX are two of the FMIs that contribute the most to the default waterfall (see section 4). Both have relatively low returns on equity.
The relationship between the size of the cash equity clearing business of the FMI and the returns on equity achieved was also explored and no significant relationship found (not presented).
Returns on equity can be affected by volatility of earnings and the gearing of the FMI. All the Asia-Pacific FMIs have limited, if any, debt financing. This contrasts to FMIs in Europe, where debt financing is more common. Figure 5.3 takes this into account and presents profit after tax, relative to ‘own’ assets excluding goodwill. Own assets are calculated as total assets minus the value of collateral held on behalf of participants. The management reports for ASX Settlement and ASX Clear do not provide the required data on debt financing and therefore only the results for the consolidated business of ASX Ltd are presented.
Figure 5.3 Profit after tax relative to tangible assets
Source: Oxera analysis of financial statements, annual reports and management income statements.
Comparing Figure 5.3 and Figure 5.2 suggests that Deutsche Börse and LCH.Clearnet have higher liabilities (such as debt) than the other FMIs considered. While both had some of the highest returns on equity, returns on assets are more in line with returns observed in other markets.
5.5 Conclusions
For one CCP, LCH-Clearnet, net interest earned on participants’ collateral is an important revenue driver. However, this is likely to reflect net interest earnings from their commodities and derivatives clearing business, rather than the cash equity clearing business. For most of the other CCPs (including ASX Clear)
-20%
-10%
0%
10%
20%
30%
40%
AS
X L
td
BM
E
BM
&F
Bo
ve
sp
a
CD
S
De
uts
ch
e B
örs
e
Eu
roC
CP
HK
Ex
JS
CC
LC
H.C
lea
rne
t
SG
X
Global cost benchmarking of cash equity clearing and settlement services Oxera
62
considered, the proportion of revenues from net interest earned on participants’ is small and would not materially affect the user-profile analysis presented in section 3.
ASX Clear and JSCC are the two FMIs contributing the most to the cash equity default waterfalls, and both have a lower ranking than the other FMIs considered when the ranking is based on post-tax return on equity than when it is based on operating margins. ASX Clear generates the second-highest margins of the FMIs considered, but has the fourth-lowest post-tax returns on equity. Similarly, whilst JSCC’s margins are in line with those generated by CDS and SIX, its post-tax return on equity is the lowest but for EuroCCP.
This is consistent with the hypothesis that FMIs contributing more to the default waterfall require higher operating margins (and therefore charge higher fees) to achieve a rate of return comparable to that of the other FMIs. The sample is too small and the data too noisy (owing to the use of consolidated information for most FMIs) to be able to draw a strong conclusion on this point, but the hypothesis is further supported by the analysis presented in section 4.2.2. This section estimates the cost to ASX of providing AU$250m of protection in the default waterfall to be roughly equivalent to providing a 0.04bp discount to clearing fees charged by CCPs where the default fund is composed of participants’ collateral but all interest earned on the default fund is passed back to the participants (or equivalent to a discount of 0.07bp where no interest is passed back).
In line with the results of the user-profile analysis, the FMIs with the highest fees also have relatively high operating margins and returns: BME, HKEx and SGX.
Similarly, the FMIs with the lowest fees in the user-profile analysis also have relatively low operating margins and returns: EuroCCP, JSCC and CDS. (The higher post-trading costs observed in Japan relate to the CSD fees rather than JSCC’s fees for CCP services). At the point in time when the data was collected for this analysis, these were all independent CCPs—CDS has subsequently been acquired by the TMX Group and EuroCCP has merged with EMCF.

Global cost benchmarking of cash equity clearing and settlement services Oxera
63
A1 Interpretation of ASX’s cash equity clearing and settlement pricing schedules
The figures below illustrate the interpretation of ASX’s clearing and settlement pricing schedules underpinning the cost estimates presented in section 3. The numbers along each arrow relate to the message types as stated in ASX’s pricing schedules and defined in Table A1.1 further below.
The figures present the fees included in the cost estimates for institutional and retail investors respectively. In both cases, investor A is the ultimate buyer of securities and investor B the ultimate seller.
Figure A1.1 Post-trading services provided by ASX for institutional clients
Figure A1.2 Post-trading services provided by ASX for retail clients
Notes: The dashed green arrows show the direction in which securities are moving; the solid green arrows are other post-trading messages. Diamonds are actions/processes. Boxes denote participants. Client and trading instructions are omitted.
Source: Oxera analysis of ASX service descriptions.
CHESS
Netting Settlement
Broker of client A—
self-clearing
164134/
138
101 and 156
156
Custodian of client A
164
134/
138
Custodian of client BBroker of client B—
self-clearing
156
101 and 156
Novation
CHESS
Netting Settlement
Broker of client A—
self-clearing
164 134/
138
Transfer &
Conversions (001)
156
CHESS HIN/SRN
of client A
164
134/
138
CHESS HIN/SRN
of client BBroker of client B—
self-clearing
156
001
Novation

Global cost benchmarking of cash equity clearing and settlement services Oxera
64
Table A1.1 Definition of relevant messages and fees
Message Fee Category Explanation
164 0.25bps Transaction Clearing Fee Equities
Clearing notification/registration, including point of novation (calculated on executed trade value)
134/138 AU$0.00 Netted transaction & Notification
Netting notification/obligation
101 AU$1.30 DVP Settlement / Misc Payment
Priming for settlement (delivery of stock, cash) and off-market movements from custodians
156 AU$0.30 Settled DvP Settlement Instructions
Market Batch Transaction for DVP (Confirmation of settlement)
Various AU$0.90 CHESS & Sub-register Transfer & Conversion (various message # e.g. 001, 005)
Transfers between a CP’s accumulation and settlement entrepot acct (priming for settlement and CHESS/SRN to CHESS + CHESS to CHESS/SRN Conversions)
Source: ASX.

Global cost benchmarking of cash equity clearing and settlement services Oxera
65
A2 Overview of pricing schedules
Legend for Tables A2.1 to A2.3
Symbol Basis for charging the fee
V Per value of transaction
N Per number of transactions
S Per number of shares traded
SI Per settlement instruction
VS Per value of securities balance in custody
NS Per number of shares in custody
A Per CSD account
P Per positions held
Table A2.1 Overview of pricing schedules—trading platforms
Trading platform Fixed fee
Basis of variable fee
Volume discounts
Australian Securities Exchange Yes V A flat rate is applied; maximum fee per trade
Hong Kong Stock Exchange No V, N A flat rate is applied
Singapore Exchange Yes V A flat rate is applied
Tokyo Stock Exchange Yes1 V The fee varies with the monthly trading
value Korea Exchange No V A flat rate is applied
BM&FBovespa No V A flat rate is applied
New York Stock Exchange Yes S2 Rebate for adding liquidity
Toronto Stock Exchange Yes S Rebate for adding liquidity
Deutsche Börse Yes V Discounts based on the monthly value
NYSE Euronext Paris No V Discounts based on the monthly value, minimum and maximum fee per order, and a monthly maximum
BATS Chi-X Europe Yes3 V Rebate for adding liquidity which
increases with the monthly value London Stock Exchange Yes V Discounts based on the orders value
Bolsas y Mercados Espanoles Yes Per value of traded client turnover
4
Discounts based on the orders value, cap
SIX Swiss Exchange Yes V, N Discounts based on level of commitment, minimum and maximum for the per-value fee
NADAQ OMX Nordic (Copenhagen)
Yes5 V, N Maximum fee per order
Note: 1 Tokyo Stock Exchange has an access fee which increases with the number of orders per
month. 2 The variable fee when the shares traded have a price of less than $1 is charged per value
of transaction. 3 A monthly fee is applied if the participant selects a subscription package and no
fixed fee is applied if a standard package is selected. 4 In particular, the pricing schedule specifies
that the fee is charged ‘per turnover traded on a single day by the same final client, security, price and direction (buy or sell)’.
5 A fixed fee is applied in two of the three fees options available to the
participant and not applied in one of them, where a minimum monthly fee is applied instead.
Source: Oxera analysis of the pricing schedules.

Global cost benchmarking of cash equity clearing and settlement services Oxera
66
Table A2.2 Overview of pricing schedules—CCPs/CHs
CCP/CH Fixed fee Basis of variable fee Volume discounts
ASX Clearing Yes V A flat rate is applied
CCASS No SI A flat rate is applied
CDP Yes V A flat rate is applied
JSCC Yes V, N Discounts based on the value and number of transactions and conditional on total participants’ value
KRX No V A flat rate is applied
CBLC Yes n.a. (bundled fees, see Table A2.3)
NSCC Yes V, N, per post-netting value
1
A flat rate is applied
CDS No N, SI A flat rate is applied
Eurex Clearing Yes V, N, SI Discounts based on the monthly value and number of transactions
LCH.Clearnet S.A. Yes2 N, SI
3 A flat rate is applied
EuroCCP Yes N, SI3 Discounts based on the daily number of
transactions LCH.Clearnet Ltd. Yes N
4 Discounts based on the daily number of
transactions Iberclear n.a. (bundled fees)
SIX x-clear Yes N Discounts based on the monthly number of transactions
Note: 1 Referred to as outside the net value fee.
2 The fee increases with the participant’s monthly
volume. 3 These fees charged per settlement instruction cover settlement-related costs incurred by
the CCP. 4 In addition to the clearing fee, LCH.Clearnet Ltd passes on to participants the
settlement-related costs it incurs.
Source: Oxera analysis of the pricing schedules.

Global cost benchmarking of cash equity clearing and settlement services Oxera
67
Table A2.3 Overview of pricing schedules—CSDs
CSD Fixed fee
Stock-based fee Flow-based fee
Basis of fee
Volume discount Basis of fee
Volume discount
ASX settlement
Yes n.a. n.a. SI A flat rate is applied
CCASS No n.a. n.a. V A flat rate is applied, minimum and maximum fees per transaction
CDP No A1 Discount for account with no
holdings SI
1 A flat rate is applied
JASDEC No A, Per unit
2
Discounts based on number of accounts and number of units
SI Discount based on the number of transfers in a month
KSD n.a. (bundled fees)
CBLC Yes A, VS Discounts based on the value of the account balance, discount for inactive accounts
V A flat rate is applied
DTC Yes NS Discounts based on the number of shares
SI Discounted fee for receive transaction
CDS No NS, P A flat rate is applied SI Discounted fee for BNS settlement relative to real-time
Clearstream No A, VS Discounts based on the value of the account balance
SI3 A flat rate is applied
Euroclear (ESES)
Yes VS Discounts based on the value of the account balance
SI Discounts based on the number of settlement instructions
Euroclear UK&I
Yes VS Discounts based on the daily value of the account balance
SI Discounts based on the number of settlement instructions
Iberclear Yes VS Discounts based on the daily value of the account balance
V, N A flat rate is applied
SIX SIS No VS Discounts based on the value of the account balance and value in a given security
N, SI A flat rate is applied4
VP Securities No A, VS, Per ISIN
Discounts based on the daily value of the account balance
SI Discounts based on the number of settlement instructions
Note: 1 These fees apply only for institutional settlement, not for retail investors.
2 A unit refers to
the minimum number of shares that an investor can choose to buy or sell in a particular stock listed on the Tokyo Stock Exchange, which is commonly around 100 shares.
3 The settlement fee is
charged by Eurex Clearing. 4 There are no volume discounts but participants can choose between
gross and net settlement depending on which of the two options leads to a lower total cost.
Source: Oxera analysis of the pricing schedules.
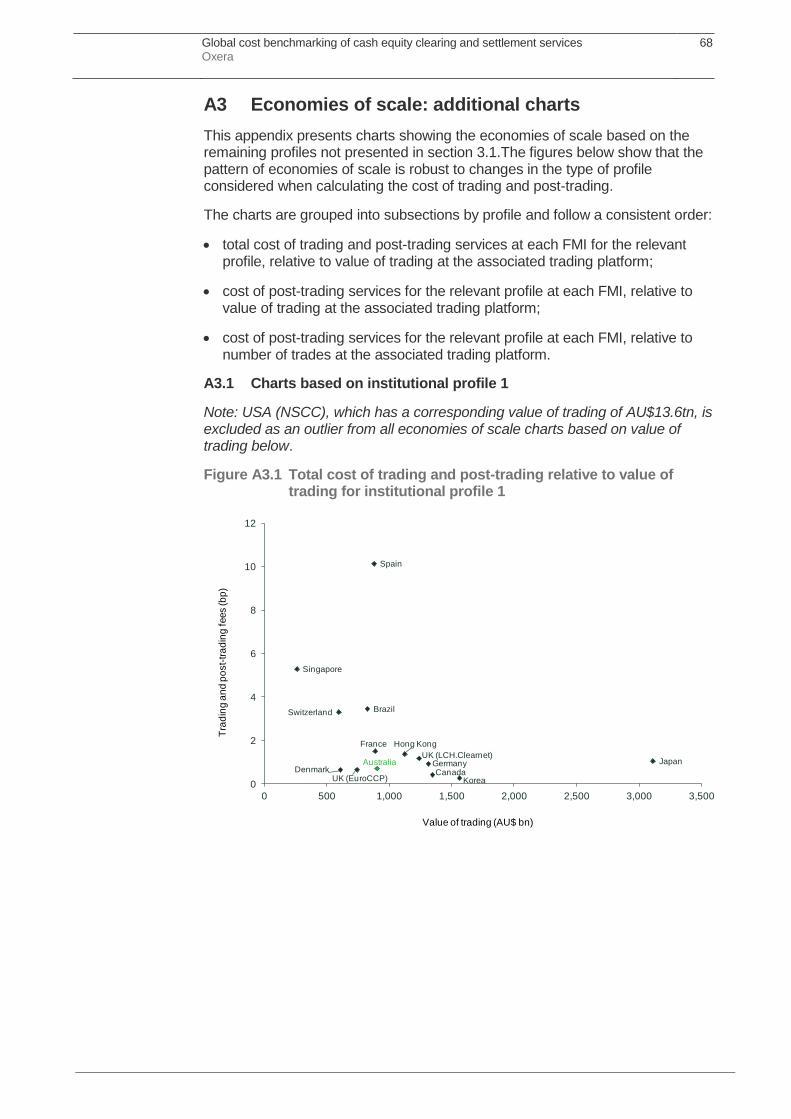
Global cost benchmarking of cash equity clearing and settlement services Oxera
68
A3 Economies of scale: additional charts
This appendix presents charts showing the economies of scale based on the remaining profiles not presented in section 3.1.The figures below show that the pattern of economies of scale is robust to changes in the type of profile considered when calculating the cost of trading and post-trading.
The charts are grouped into subsections by profile and follow a consistent order:
total cost of trading and post-trading services at each FMI for the relevant profile, relative to value of trading at the associated trading platform;
cost of post-trading services for the relevant profile at each FMI, relative to value of trading at the associated trading platform;
cost of post-trading services for the relevant profile at each FMI, relative to number of trades at the associated trading platform.
A3.1 Charts based on institutional profile 1
Note: USA (NSCC), which has a corresponding value of trading of AU$13.6tn, is excluded as an outlier from all economies of scale charts based on value of trading below.
Figure A3.1 Total cost of trading and post-trading relative to value of trading for institutional profile 1
Australia
Hong Kong
Singapore
Japan
Korea
Brazil
CanadaGermany
France
UK (EuroCCP)
UK (LCH.Clearnet)
Spain
Switzerland
Denmark
0
2
4
6
8
10
12
0 500 1,000 1,500 2,000 2,500 3,000 3,500
Tra
din
g a
nd
po
st-
tra
din
g f
ees (b
p)
Value of trading (AU$ bn)

Global cost benchmarking of cash equity clearing and settlement services Oxera
69
Figure A3.2 Post-trading costs relative to value of trading for institutional profile 1
Note: Korea (KRX) and USA (NSCC), which have a corresponding number of trades of 1.2bn and 1.4bn respectively, are excluded as outliers from all economies of scale charts based on number of trades below.
Figure A3.3 Post-trading costs relative to the number of trades for institutional profile 1
Australia
Hong Kong
Singapore
Japan
Korea
Brazil
CanadaGermany
France
UK (EuroCCP)UK (LCH.Clearnet)
Spain
Switzerland
Denmark0
1
2
3
4
5
6
7
8
9
0 500 1,000 1,500 2,000 2,500 3,000 3,500
Po
st-
tra
din
g fe
es (b
p)
Value of trading (AU$ bn)
Australia
Hong Kong
Singapore
Japan
Brazil
CanadaGermany
FranceUK (EuroCCP)
UK (LCH.Clearnet)
Spain
Switzerland
Denmark0
1
2
3
4
5
6
7
8
9
0 50 100 150 200 250 300 350 400
Po
st-
tra
din
g fe
es (b
p)
Number of trades (m)

Global cost benchmarking of cash equity clearing and settlement services Oxera
70
A3.2 Charts based on institutional profile 2
Figure A3.4 Total costs of trading and post-trading relative to value of trading for institutional profile 2
Figure A3.5 Post-trading costs relative to value of trading for institutional profile 2
Australia
Hong Kong
Singapore
Japan
Korea
Brazil
CanadaGermany
France
UK (EuroCCP)
UK (LCH.Clearnet)
Spain
Switzerland
Denmark
0
1
2
3
4
5
6
0 500 1,000 1,500 2,000 2,500 3,000 3,500
Tra
din
g a
nd
po
st-
tra
din
g f
ees (b
p)
Value of trading (AU$ bn)
Australia
Hong Kong
Singapore
Japan
Korea
Brazil
Canada
Germany
France
UK (EuroCCP)
UK (LCH.Clearnet)
Spain
Switzerland
Denmark0.0
0.5
1.0
1.5
2.0
2.5
3.0
3.5
4.0
4.5
0 500 1,000 1,500 2,000 2,500 3,000 3,500
Po
st-
tra
din
g fe
es (b
p)
Value of trading (AU$ bn)

Global cost benchmarking of cash equity clearing and settlement services Oxera
71
Figure A3.6 Post-trading costs relative to the number of trades for institutional profile 2
A3.3 Charts based on institutional profile 4
Figure A3.7 Total costs of trading and post-trading relative to value of trading for institutional profile 4
Australia
Hong Kong
Singapore
Japan
Brazil
CanadaGermany
France
UK (EuroCCP)
UK (LCH.Clearnet)
Spain
Switzerland
Denmark0.0
0.5
1.0
1.5
2.0
2.5
3.0
3.5
4.0
4.5
0 50 100 150 200 250 300 350 400
Po
st-
tra
din
g fe
es (b
p)
Number of trades (m)
Australia
Hong Kong
Singapore
Japan
Korea
Brazil
Canada
Germany
France
UK (EuroCCP) UK (LCH.Clearnet)
Spain
Switzerland
Denmark
0
1
2
3
4
5
6
7
0 500 1,000 1,500 2,000 2,500 3,000 3,500
Tra
din
g a
nd
po
st-
tra
din
g f
ees (b
p)
Value of trading (AU$ bn)
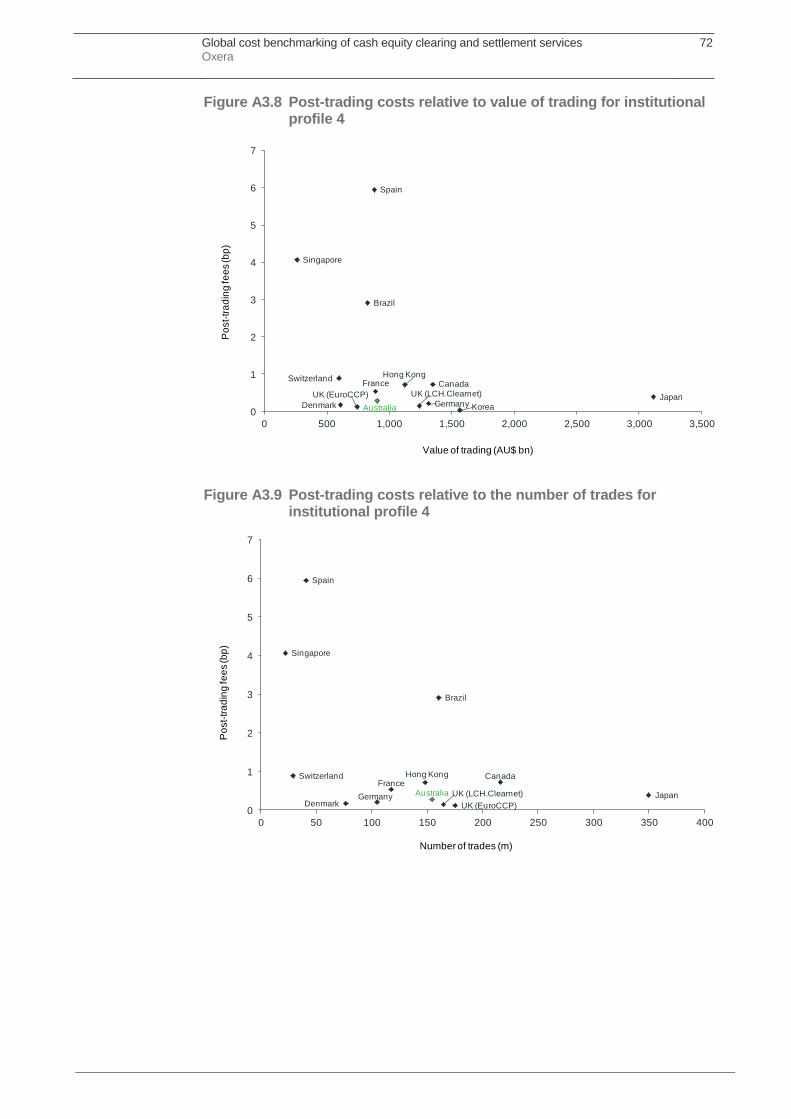
Global cost benchmarking of cash equity clearing and settlement services Oxera
72
Figure A3.8 Post-trading costs relative to value of trading for institutional profile 4
Figure A3.9 Post-trading costs relative to the number of trades for institutional profile 4
Australia
Hong Kong
Singapore
JapanKorea
Brazil
Canada
Germany
France
UK (EuroCCP) UK (LCH.Clearnet)
Spain
Switzerland
Denmark0
1
2
3
4
5
6
7
0 500 1,000 1,500 2,000 2,500 3,000 3,500
Po
st-
tra
din
g fe
es (b
p)
Value of trading (AU$ bn)
Australia
Hong Kong
Singapore
Japan
Brazil
Canada
Germany
France
UK (EuroCCP)
UK (LCH.Clearnet)
Spain
Switzerland
Denmark0
1
2
3
4
5
6
7
0 50 100 150 200 250 300 350 400
Po
st-
tra
din
g fe
es (b
p)
Number of trades (m)

Global cost benchmarking of cash equity clearing and settlement services Oxera
73
A3.4 Charts based on retail profile 6
Figure A3.10 Total costs of trading and post-trading relative to value of trading for retail profile 6
Figure A3.11 Post-trading costs relative to value of trading for retail profile 6
Australia
Hong Kong
Singapore
Japan
Korea
Brazil
Canada
Germany
France
UK (EuroCCP)
UK (LCH.Clearnet)
Spain
Switzerland
Denmark
0
2
4
6
8
10
12
14
16
18
0 500 1,000 1,500 2,000 2,500 3,000 3,500
Tra
din
g a
nd
po
st-
tra
din
g f
ees (b
p)
Value of trading (AU$ bn)
Australia
Hong Kong
Singapore
Japan
Korea
Brazil
Canada
Germany
France
UK (EuroCCP)
UK (LCH.Clearnet)
Spain
Switzerland
Denmark
0
2
4
6
8
10
12
14
0 500 1,000 1,500 2,000 2,500 3,000 3,500
Po
st-
tra
din
g fe
es (b
p)
Value of trading (AU$ bn)

Global cost benchmarking of cash equity clearing and settlement services Oxera
74
Figure A3.12 Post-trading costs relative to the number of trades for retail profile 6
A3.5 Charts based on retail profile 7
Figure A3.13 Total costs of trading and post-trading relative to value of trading for retail profile 7
Australia
Hong Kong
Singapore
Japan
Brazil
Canada
Germany
France
UK (EuroCCP)
UK (LCH.Clearnet)
Spain
Switzerland
Denmark
0
2
4
6
8
10
12
14
0 50 100 150 200 250 300 350 400 450
Po
st-
tra
din
g fe
es (b
p)
Number of trades (m)
Australia
Hong Kong
Singapore
Japan
Korea
Brazil
Canada
Germany
France
UK (EuroCCP)
UK (LCH.Clearnet)
Spain
Switzerland
Denmark
0
2
4
6
8
10
12
14
16
18
0 500 1,000 1,500 2,000 2,500 3,000 3,500
Tra
din
g a
nd
po
st-
tra
din
g f
ees (b
p)
Value of trading (AU$ bn)

Global cost benchmarking of cash equity clearing and settlement services Oxera
75
Figure A3.14 Post-trading costs relative to value of trading for retail profile 7
Figure A3.15 Post-trading costs relative to the number of trades for retail profile 7
Australia
Hong Kong
Singapore
Japan
Korea
Brazil
Canada
Germany
France
UK (EuroCCP)
UK (LCH.Clearnet)
Spain
Switzerland
Denmark
0
2
4
6
8
10
12
14
0 500 1,000 1,500 2,000 2,500 3,000 3,500
Po
st-
tra
din
g fe
es (b
p)
Value of trading (AU$ bn)
Australia
Hong Kong
Singapore
Japan
Brazil
Canada
Germany
France
UK (EuroCCP)
UK (LCH.Clearnet)
Spain
Switzerland
Denmark
0
2
4
6
8
10
12
14
0 50 100 150 200 250 300 350 400 450
Po
st-
tra
din
g fe
es (b
p)
Number of trades (m)

Global cost benchmarking of cash equity clearing and settlement services Oxera
76
A4 Data tables
Table A4.1 Data for Figures 3.1 to 3.3
Number of trades (m)
Value of share trading (AU$bn)
Post-trading costs for profile 3
(bp)
Post-trading and trading costs for
profile 3 (bp)
Australia 154 903 0.47 0.62
Hong Kong 148 1,121 0.74 1.37
Japan 350 3,110 0.55 0.81
Korea 1,219 1,561 0.04 0.27
Singapore 22 258 4.44 5.19
Brazil 160 823 2.91 3.41
Canada 216 1,345 0.28 0.41
USA 1,375 13,631 0.03 0.20
Denmark 76 606 0.19 0.43
France 117 886 0.52 1.17
Germany 104 1,311 0.24 0.66
Spain 40 877 3.78 5.70
Switzerland 29 594 0.64 1.73
UK (EuroCCP) 175 739 0.26 0.33
UK (LCH.Clearnet) 164 1,237 0.36 0.80
Source: See notes to Figures 3.1 and 3.3.
Table A4.2 Estimated trading, post-trading and total costs (bp) for institutional profiles 1 to 4
Profile Trading CCP CSD Post-trading
Total
Australia (ASX Clearing) 1 0.15 0.24 0.31 0.55 0.70
2 0.15 0.24 0.05 0.29 0.43
3 0.15 0.24 0.23 0.47 0.62
4 0.15 0.24 0.04 0.28 0.43
Hong Kong (CCASS) 1 0.63 n.a. n.a. 0.74 1.38
2 0.63 n.a. n.a. 0.73 1.36
3 0.63 n.a. n.a. 0.74 1.37
4 0.63 n.a. n.a. 0.73 1.36
Japan (JSCC) 1 0.23 0.16 0.67 0.83 1.05
2 0.26 0.14 0.20 0.34 0.60
3 0.26 0.16 0.39 0.55 0.81
4 0.23 0.19 0.21 0.40 0.63
Korea (KRX) 1 0.23 n.a. n.a. 0.04 0.27
2 0.23 n.a. n.a. 0.04 0.27
3 0.23 n.a. n.a. 0.04 0.27
4 0.23 n.a. n.a. 0.04 0.27
Singapore (CDP) 1 0.76 n.a. n.a. 4.53 5.29
2 0.75 n.a. n.a. 4.08 4.83
3 0.75 n.a. n.a. 4.44 5.19
4 0.75 n.a. n.a. 4.08 4.83
Brazil (BM&FBovespa CBLC)
1 0.50 n.a. n.a. 2.96 3.46
2 0.50 n.a. n.a. 2.89 3.39
3 0.50 n.a. n.a. 2.91 3.41
4 0.50 n.a. n.a. 2.92 3.42
Canada (CDS) 1 0.15 0.02 0.25 0.27 0.42

Global cost benchmarking of cash equity clearing and settlement services Oxera
77
Profile Trading CCP CSD Post-trading
Total
2 0.13 0.02 0.22 0.24 0.37
3 0.13 0.02 0.26 0.28 0.41
0.12 0.02 0.72 0.73 0.85
USA (NSCC) 1 0.19 0.01 0.07 0.09 0.27
2 0.17 0.01 0.02 0.03 0.19
3 0.17 0.01 0.02 0.03 0.20
4 0.16 0.01 0.01 0.02 0.18
Denmark (EuroCCP) 1 0.38 0.09 0.18 0.27 0.65
2 0.24 0.08 0.06 0.14 0.39
3 0.24 0.08 0.11 0.19 0.43
4 0.22 0.07 0.12 0.18 0.41
France (LCH.Clearnet S.A.)
1 0.65 0.14 0.71 0.86 1.51
2 0.65 0.14 0.23 0.37 1.02
3 0.65 0.14 0.39 0.52 1.17
4 0.55 0.12 0.43 0.55 1.10
Germany (Eurex Clearing)
1 0.46 0.29 0.17 0.46 0.93
2 0.42 0.13 0.06 0.20 0.61
3 0.42 0.13 0.11 0.24 0.66
4 0.39 0.09 0.13 0.22 0.62
Spain (Iberclear) 1 2.13 n.a. n.a. 8.01 10.14
2 0.46 n.a. n.a. 3.52 3.98
3 1.92 n.a. n.a. 3.78 5.70
4 0.46 n.a. n.a. 5.96 6.41
Switzerland (SIX x-clear)
1 2.07 0.19 1.05 1.24 3.31
2 1.09 0.09 0.47 0.55 1.65
3 1.09 0.09 0.55 0.64 1.73
4 1.09 0.06 0.84 0.90 1.99
UK (EuroCCP) 1 0.08 0.09 0.49 0.58 0.65
2 0.07 0.08 0.10 0.18 0.25
3 0.07 0.08 0.18 0.26 0.33
4 0.03 0.07 0.06 0.13 0.16
UK(LCH.Clearnet) 1 0.46 0.36 0.36 0.71 1.18
2 0.44 0.21 0.07 0.28 0.72
3 0.44 0.21 0.15 0.36 0.80
4 0.38 0.10 0.05 0.16 0.53
Note: For Hong Kong, Korea, Singapore, Brazil and Spain, the split between CCP- and CSD-type of services is not made because of bundling of fees.
Source: Oxera analysis of FMIs’ pricing schedules.
Table A4.3 Estimated trading, post-trading and total costs (bp) for retail profiles 5 to 7
Profile Trading CCP CSD Post-trading
Total
Australia (ASX Clearing)
5 0.15 0.24 1.77 2.01 2.16
6 0.15 0.25 0.64 0.88 1.04
7 0.15 0.24 0.61 0.85 1.00
Hong Kong (CCASS) 5 0.63 n.a. n.a. 1.31 1.94
6 0.59 n.a. n.a. 0.66 1.25
7 0.63 n.a. n.a. 0.81 1.44
Japan (JSCC) 5 0.24 0.11 0.10 0.22 0.46

Global cost benchmarking of cash equity clearing and settlement services Oxera
78
Profile Trading CCP CSD Post-trading
Total
6 0.19 0.11 1.57 1.68 1.87
7 0.24 0.11 1.32 1.43 1.67
Korea (KRX) 5 0.23 n.a. n.a. 0.04 0.27
6 0.23 n.a. n.a. 0.04 0.27
7 0.23 n.a. n.a. 0.04 0.27
Singapore (CDP) 5 0.76 n.a. n.a. 4.01 4.77
6 0.78 n.a. n.a. 4.03 4.81
7 0.76 n.a. n.a. 4.01 4.77
Brazil (BM&FBovespa CBLC)
5 0.50 n.a. n.a. 3.55 4.05
6 0.50 n.a. n.a. 7.02 7.52
7 0.50 n.a. n.a. 7.02 7.52
Canada (CDS) 5 0.15 0.02 0.27 0.29 0.44
6 0.17 0.01 2.46 2.48 2.64
7 0.15 0.02 2.45 2.47 2.62
USA (NSCC) 5 0.18 0.01 0.14 0.15 0.33
6 0.22 0.02 0.18 0.20 0.42
7 0.18 0.01 0.14 0.15 0.33
Denmark (EuroCCP) 5 0.31 0.09 0.80 0.89 1.20
6 0.58 0.08 1.31 1.39 1.97
7 0.31 0.09 1.25 1.33 1.65
France (LCH.Clearnet S.A.)
5 0.65 0.13 2.66 2.79 3.44
6 0.65 0.15 2.56 2.71 3.36
7 0.65 0.13 2.34 2.47 3.12
Germany (Eurex Clearing)
5 0.45 0.22 0.78 1.01 1.45
6 0.48 0.32 0.75 1.08 1.56
7 0.45 0.22 0.71 0.93 1.38
Spain (Iberclear) 5 13.56 n.a. n.a. 5.35 18.91
6 5.33 n.a. n.a. 11.46 16.79
7 5.33 n.a. n.a. 11.71 17.04
Switzerland (SIX x-clear)
5 1.31 0.16 1.45 1.60 2.91
6 1.98 0.15 3.27 3.42 5.40
7 1.31 0.16 3.13 3.29 4.59
UK (EuroCCP) 5 0.08 0.08 1.59 1.67 1.74
6 0.08 0.08 0.91 0.99 1.06
7 0.08 0.09 0.72 0.81 0.88
UK (LCH.Clearnet) 5 0.46 0.30 1.51 1.81 2.27
6 0.48 0.29 0.77 1.06 1.54
7 0.46 0.30 0.64 0.95 1.41
Note: For Hong Kong, Korea, Singapore, Brazil and Spain, the split between CCP- and CSD-type of services is not made because of bundling of fees.
Source: Oxera analysis of FMIs’ pricing schedules.

Global cost benchmarking of cash equity clearing and settlement services Oxera
79
A5 Overview of market structures
In terms of the structure of each national financial centre, there is considerable variation both across and within each region considered.
igure A5.1 presents a high-level stylised comparison of some of the possible market structures in terms of the number of FMIs supplying trading, clearing and settlement services for stocks listed in a particular market. The text following the figure identifies examples of where each structure can be observed in the sample of financial centres considered in this report, and highlights some of the main advantages and disadvantages of each model.
The costs and benefits of the various models may depend on the specific characteristics of the financial centre.46
Figure A5.1 Types of market structure
Source: Oxera.
Single trading platform and CCP: Structure 1
In the first stylised example there is only one supplier of trading, clearing and settlement services. This market structure is sometimes referred to as a ‘vertical model’ as the trading platform, CCP and CSD may be part of the same company, although this is not always the case—in the early 2000s, for certain UK stocks, the London Stock Exchange was the only trading platform, the London Clearing House47 was the sole CCP, and CrestCo48 was the sole CSD. This market structure applied in Australia prior to 2011 when competition was introduced at the trading level.
This single trading platform and CCP structure is becoming less common. In several financial centres there are usually some forms of alternative trading venues available, ranging from internal crossing platforms to fully fledged exchanges. Of the sample of financial centres considered in this study, Brazil is
46
For an example of the costs and benefits of different models for a specific financial centre, see Oxera (2012), ‘What would be the costs and benefits of changing the competitive structure of the market for trading and post-trading services in Brazil?’, prepared for Comissão de Valores Mobiliários, June.
47 This has since merged with the European CCP, Clearnet, and since had a majority stake acquired by the LSE.
48 This has since merged with the Euroclear Group.
Trading platform
CCP
CSD
Trading platform
CCP
CSD
Trading platform
Trading platform
CCP
Trading platform
CCP
1. Single trading platform and CCP 2. Multiple trading platforms
3. Multiple trading platforms and CCPs
Trading platform
CCP
CSD
CCPinteroperability
Trading platform
4. Interoperability
CSD

Global cost benchmarking of cash equity clearing and settlement services Oxera
80
the only market where there has not yet been any form of entry at the trading level and even here a number of platforms have announced plans to enter.49 Elsewhere, the market shares that alternative trading venues have achieved is quite variable and is most limited in Singapore, Korea, Hong Kong, and Japan, where often only internal crossing platforms act as an alternative to the incumbent exchange.
There can be advantages to having a single trading platform and CCP for a set of stocks—for example, the consolidation of liquidity at one venue can reduce implicit trading costs. However, without alternative trading platforms imposing competitive pressure on the incumbent trading platform, trading fees may be higher than an efficient operator would charge, and the quality of trading services (e.g. robustness of the trading system, trading hours and orders types) lower than customers want. This may not be the case, for example, where the trading platform is user-owned and/or where the trading platform is competing for trading in international stocks and/or where internalisation imposes an effective constraint.
Multiple trading platforms: Structure 2
In the second stylised example, there are multiple suppliers of trading services, but only one supplier of clearing and settlement services. This structure is the most commonly observed in the financial centres considered in this analysis, although the market shares of the ‘alternative’ trading venues compared with the ‘incumbent’ venues vary considerably.50
Entry has been most limited in the Asian markets considered as part of this study. Although alternative trading venues have gained market share in Australia (Chi-X Australia executes around 10% of on-exchange trades in Australia), 51 and to a lesser extent in Japan, they have gained limited traction in the other Asian markets. As noted above, in Singapore, Korea and Hong Kong, the incumbent exchanges tend to face competition from only internal crossing platforms.
In comparison, in Canada, the USA and Europe, alternative trading platforms have established considerable market share—for example, Alpha, an alternative trading venue to TSX, executed 22% of trades in TSX-listed stocks in Q1 2013 (19% based on number of shares), and Chi-X executed 19% (14% based on number of shares). In the case of Canada and the USA, there is a single CCP and CSD, whereas in Europe multiple CCPs exist, as described below.
Although international experience in introducing competition for trading services usually finds price reductions and service enhancements by the incumbent, as observed in some Asian markets, entry by alternative trading platforms does not always succeed. Competition may also be limited to the more liquid stocks;
49
For example, Direct Edge, BATS and ATS Brasil, a joint venture between ATG and NYSE Euronext. See Direct Edge (2011), ‘Direct Edge Announces Intent to Launch a Brazilian Stock Exchange in Rio de Janeiro’, press release, 21 November, available at: http://www.directedge.com/About/PressReleases/tabid/363/articleType/ArticleView/articleId/73/Direct-Edge-Announces-Intent-to-Launch-a-Brazilian-Stock-Exchange-in-Rio-de-Janeiro.aspx; Philip Stafford (2011), ‘BATS and Claritas consider Brazilian exchange’, reporting for the Financial Times, 15 February, available at: http://www.ft.com/cms/s/0/8229b9fc-38e2-11e0-b0f6-00144feabdc0.html#axzz2vwuZas75; and Adil Siddiqui (2013), ‘New Brazilian Stock Exchange, ATS Brasil, Poised to Start in 2014, reporting for Forex Magnates, 20 June, available at: http://forexmagnates.com/new-brazilian-stock-exchange-ats-brasil-poised-to-start-in-2014/.
50 The speech marks highlight that the reference to alternative and incumbent does not give a fair reflection of the prevailing market share in certain markets.
51 Based on analysis of IRESS data for 1 July to 31 December 2013.
Global cost benchmarking of cash equity clearing and settlement services Oxera
81
however, if trading venues offer the same fees for all stocks traded, the benefits can still flow through to the trading of other stocks.
Multiple trading platforms and CCPs: Structure 3
In the third stylised example, there are two trading platforms offering trading services, each using a different CCP. This structure is observed in each of the European financial centres considered in this analysis, although in some, the fourth structure is adopted, where interoperability is also present.
There can be advantages and disadvantages to Structure 3 compared with Structure 2.52 The advantages include introducing some competitive pressure on the CCP services associated with each trading venue.
In some scenarios, it appears that this market structure is considered to impose sufficient competitive pressure. For example, in the provision of trading and clearing services for derivative contracts, interoperability is not commonly observed. National best-execution rules may need to be adjusted to allow competition between multiple trading-clearing providers to function. For example, if there is a prescriptive requirement for brokers to execute client orders at the best available price of the stock, rather than considering all the explicit and implicit costs associated with executing on each venue, such as CCP fees, minimal (if any) competitive pressure will be introduced.
Another way for competition for CCP services to exist in this market structure is when the exclusive clearing arrangement between the trading venue and CCP is time-limited. In this case, competition for the contract between multiple CCPs can impose competitive constraint on clearing fees and services.
One of the main disadvantages of Structure 3 over Structure 2, which is overcome in Structure 4, is the potential fragmentation of a broker’s flow between multiple CCPs, resulting in potentially higher settlement and margin costs. If all trades for a broker are cleared through a single CCP, the broker will (typically) only have one settlement instruction per stock at the end of the day. Whereas, if the broker’s flow is split between two CCPs, it may have up to two settlement instructions per stock traded; one per stock, per CCP. (It will have less if, for some stocks, only one CCP is used.) Related to this, the broker (or its clearing member) is likely to face higher total margin requirements overall if its flow is split between multiple CCPs. This is because each CCP will call for a margin based on the portfolio of the broker (or clearing member) that the CCP clears. This means that the CCP cannot take account of offsetting positions cleared at another CCP. In other words, if a broker clears a purchase of stock A through one CCP, and clears the sale of the same stock through the second CCP, the broker will need to post margin at both CCPs, despite having a net flat position overall.
Another disadvantage of Structure 3 over Structure 2 is the duplication of the fixed costs associated with operating an additional CCP. Depending on the scale of the market, distributing this cost across the market participants can mitigate the extent to which any increase in competitive pressure results in overall lower CCP fees.
52
For a discussion, see also Oxera (2012), ‘What would be the costs and benefits of changing the competitive structure of the market for trading and post-trading services in Brazil?’, prepared for Comissão de Valores Mobiliários, June.

Global cost benchmarking of cash equity clearing and settlement services Oxera
82
Interoperability: Structure 4
In the fourth stylised example, a broker can choose between two trading platforms and, independent of this decision, between two CCPs. Of the financial centres considered in this analysis, this structure is observed in the UK and Switzerland.
The main advantage of Structure 4 over Structure 3 is the flexibility of the system to allow brokers to consolidate their flow at one CCP, thereby reducing their settlement costs and margin requirements. The cost saving to participants by concentrating their purchase of CCP services can be significant. In the extreme scenario, where a clearing participant has an equal and opposite net position in each security, at each CCP, consolidating all trades at one CCP would leave the participant with a net flat position in each security at this CCP and, therefore, zero settlement obligations. Where CCPs provide volume discounts, consolidation of flow at one CCP can also reduce their total CCP fees paid.
Interoperability is not without some challenge for the relevant trading platforms and CCPs, the burden of which is debated frequently by European FMIs, reflecting their market positions. The essence of the challenge is that, by allowing each side of a trade to choose a different CCP, the two CCPs become exposed to one another, and, thus, one another’s risk management systems and clearing members. This results in inter-CCP settlements at the CSDs and inter-CCP margin calls, the costs of which are ultimately both funded by the clearing members of each CCP.
In European markets where interoperability has been introduced, this has been with the support of the brokers and clearing participants active in these markets. Although interoperability introduces some incremental costs, these are small relative to the cost savings from the reduced settlement instructions and margin requirements when compared with Structure 3. The incremental costs are small because the CCPs can net their inter-CCP exposures across all clearing participants, reducing the cost that is passed back to each participant. For example, LCH.Clearnet Ltd charges a fee of AU$0.20 per settlement per CCP to each clearing participant for which an inter-CCP settlement arises; for a typical order size of AU$100,000, this is 0.02bp.53
Structure 4 can also be compared with Structure 2. In this respect, the main advantage is that Structure 4 allows some clearing participants to switch away from the incumbent CCP without imposing switching costs on all clearing participants—as would be the case if the trading venue were to switch its exclusive clearing arrangement from one CCP to another. The unavoidable disadvantage of Structure 4 compared with Structure 2 is the duplication of fixed costs, the significance of which depends on the overall scale of the market.
53
LCh.Clearnet Ltd EquityClear pricing schedule available at: http://www.lchclearnet.com/fees/ltd/transactions/equityclear.asp.

Global cost benchmarking of cash equity clearing and settlement services Oxera
83
A6 Calculation of the default fund cost
The table below presents the steps in the calculation, followed by an explanation of the methodology adopted.
Table A6.1 Calculation of the cost of the default fund for Australia
Calculation Component Estimate Estimation approach
[A] Yield spread 1.29% Based on the average spread on the euro and sterling bond yield using the IBOXX index for 10-year maturity bonds issued by single A-rated financial corporations
[B] Risk-free rate 3.93% Based on the 10-year Australian government bond yield
[C=A+B] Bond yield 5.22%
[D] Interest rate earned on the default fund
2.50% Based on the Australian cash rate
[EL=C-D] Net cost of financing—
lower bound 2.72% Based on the assumption that
participants receive the interest on their contributions
[EU=C] Net cost of financing—
upper bound 5.22% Based on the assumption that
participants do not receive interest on their contributions
[F] Default fund 250mn Based on ASX’s default fund contributions (i.e. ASX Clear Pty restricted capital reserve and the equity capital and subordinated debt provided by ASXCC)
[G] Value cleared 919,000mn Approximated by the value of share trading on ASX
[H=(EL*F)/(2*G)]
Cost of default fund—lower bound
0.0004% (0.04bp)
[H=(EU*F)/(2*G)] Cost of default fund—
upper bound 0.0007% (0.07bp)
Source: Oxera.
Further notes on the estimation approach:
The bond yield (C) is approximated as shown in the table above because the IBOXX financial corporations index is not available for Australian dollar denominated bonds.
The bonds of A-rated financial corporations are considered as some of the largest participants in the Australian stock market (with a total market share of around 35%54) and belong to A-rated parent groups.
The spread on the euro and sterling bond yields is relative to the UK and German government bond yields for a maturity of ten years.
54
Australian Securities and Investments Commission (2010), ‘Consultation paper 145: Australian equity market structure: Proposal’, November.

Global cost benchmarking of cash equity clearing and settlement services Oxera
84
The data sources used include S&P, Reserve Bank of Australia, Bank of England, Eurostat, IBOXX, WFE.
Explanation of the methodology and its limitations
The default fund can be provided either by the CCP or clients of the CCP. If it is supplied by the clients, then they will have to hand over capital/collateral to the CCP for the time they remain as clients. In order to do this and maintain the same operational position in their activities outside the posting of those securities, they will have to raise additional finance.
The issue here is: how much does the raising of that additional capital cost the client?
In business terms, a client could address the raising of additional capital by obtaining a loan, raising additional equity, or a combination of both. Looked at in isolation, the cost of doing this could then be calculated. However, the posting of capital to the default fund is not like expanding their business. Under nearly all circumstances the client will actually get its default fund contributions back, should it need them to exit the market and, from a creditor of the client’s perspective, in nearly all circumstances the client’s contribution to the default fund would be available to pay creditors. Hence, if the client raised the additional capital as equity, the risks that creditors face when dealing with that entity falls. Hence any other borrowing by that entity would now be (marginally) cheaper, and this reduction in borrowing costs should be factored into any calculation of the net cost of raising the additional capital.
If the entity raises the additional capital by borrowing, there will also be knock-on effects into the cost of other debt and equity.
In order to avoid having to try to trace through all of these effects, this calculation has adopted a different approach, and has calculated the cost of contributions to default fund in terms of the specific risks that that additional capital faces. That is, to evaluate the risk of not getting the amount posted back (the default risk on that specific amount).
The conditions under which the amount posted is not returned are either when the client itself defaults on a transaction(s) with the CCP and the posted margin is insufficient to cover any shortfall in the CCP itself competing the contract, or when some other client of the CCP has defaulted and they have exhausted both their margin and their own contribution to the default fund. Given the level of cover provided by the margin requirements, the specific ‘default’ risk to collateral contributed to the default fund is low, and is likely to be lower than the general default risk of the entity. Hence, for this calculation we have used a relatively low risk debt rate as the likely net cost to the client of supplying collateral to a default fund.
The total cost to clients is then the difference between this cost to them and any interest that they may be paid by the CCP because the CCP has in turn invested the collateral into interest bearing securities (e.g. risk-free securities).
In the case of ASX, clients do not fund the default fund, so this cost (as calculated above) is taken as a saving to those clients. This is the calculation that is set out above.
The issue can also be addressed from the other side: what is the cost to ASX of providing this capital that can be used in the event that a payment is required from that fund?

Global cost benchmarking of cash equity clearing and settlement services Oxera
85
The same logic applies, so that if ASX raises this capital as equity, the net cost to ASX is not necessarily the cost of that equity, but the net effect of the overall change in the cost of the totality of ASX capital. Increasing the equity base of a company to fund a relatively low-risk activity (i.e. the chances of the default fund actually being used is low) will reduce the overall cost of capital while at the same time increasing the quantum of equity capital employed. So the total equity needed goes up to run the business, but the unit cost of the equity for the whole business goes down. The net change in the total cost of servicing the two levels of capital is the net cost of supplying the default fund. (Again, netting off any interest earned if the CCP, for example, purchases risk-free securities with the additional equity.)
If the capital markets worked perfectly, there should be broad equivalence of the customers funding the default fund or the CCP funding the default fund. However, if the capital markets are not perfect (and they are not perfect) there are likely to be some differences and, in particular, the costs to individual clients in funding the same level of default fund are likely to vary with their respective idiosyncratic characteristics.
In addition, if the capital markets do not recognise the relatively low risk of contributions to a default fund then the funding cost (to the clients or the CCP) is likely to be higher than theory would suggest. If the capital market actually behaves as if the risk facing this additional capital is the same as the overall risk facing the firm prior to taking on this funding obligation (clients or the CCP as relevant) then the cost will be the weighted average cost of capital of the contributing party, pre-contribution. As a result, the lower bound of the cost of funding the default fund is likely to be approximated by the calculation method set out above, while the upper bound would be the overall cost of capital of the contributor/funder in their other activities.
As a reasonably good approximation of the lower bound, the costs of funding the default fund are likely to be the cost of low-risk debt (net of any interest earned), because that is the risk characteristic of the fund. To be conservative, this is the value taken in the analysis. But to the extent that capital market is not efficient, in practice, the costs to either the clients or CCP are likely to be higher than this.

Global cost benchmarking of cash equity clearing and settlement services Oxera
86
A7 ASX revenue analysis
The following figures present the clearing and settlement revenues generated by ASX as a proportion of the value traded, at both an individual-participant level and aggregate level. The results of the user-profile analysis are also included in the figures (shaded dark green) to allow comparison and have been ordered by value traded by the relevant intermediary: retail advice—relevant for Profile 6 and 8; institutional small—relevant for Profile 1; retail online—relevant for Profile 5; institutional mid—relevant for Profile 2 and 3; and institutional large—relevant for Profile 4.
Although there is some variation in the average clearing and settlement fees paid as a proportion of value traded between participants, the results of the user-profile analysis are roughly in line with what most participants pay.
Figure A7.1 Comparison of ASX clearing revenues from various participants and user-profile results
Source: ASX revenue data.
There is more variation in the settlement fees paid as a proportion of traded value by participants at ASX, as shown in Figure A7.2 below. However, a similar range in costs is captured by the institutional profiles within the user-profile analysis. The high settlement fee estimated within the user profile represents the cost for a frequent retail investor using an online broker (profile 5). Owing to this investor’s small order size, settlement fees as a proportion of the value traded are relatively high. This is consistent with the results based on the analysis of fees paid by ASX participants, who, as intermediaries, will have a range of clients, including clients with large order sizes and therefore low settlement costs, as well as clients with smaller order sizes and therefore higher settlement costs (when considered relative to the value traded).
0.230
0.232
0.234
0.236
0.238
0.240
0.242
0.244
0.246
0.248
Average clearing fee (0.238bp)
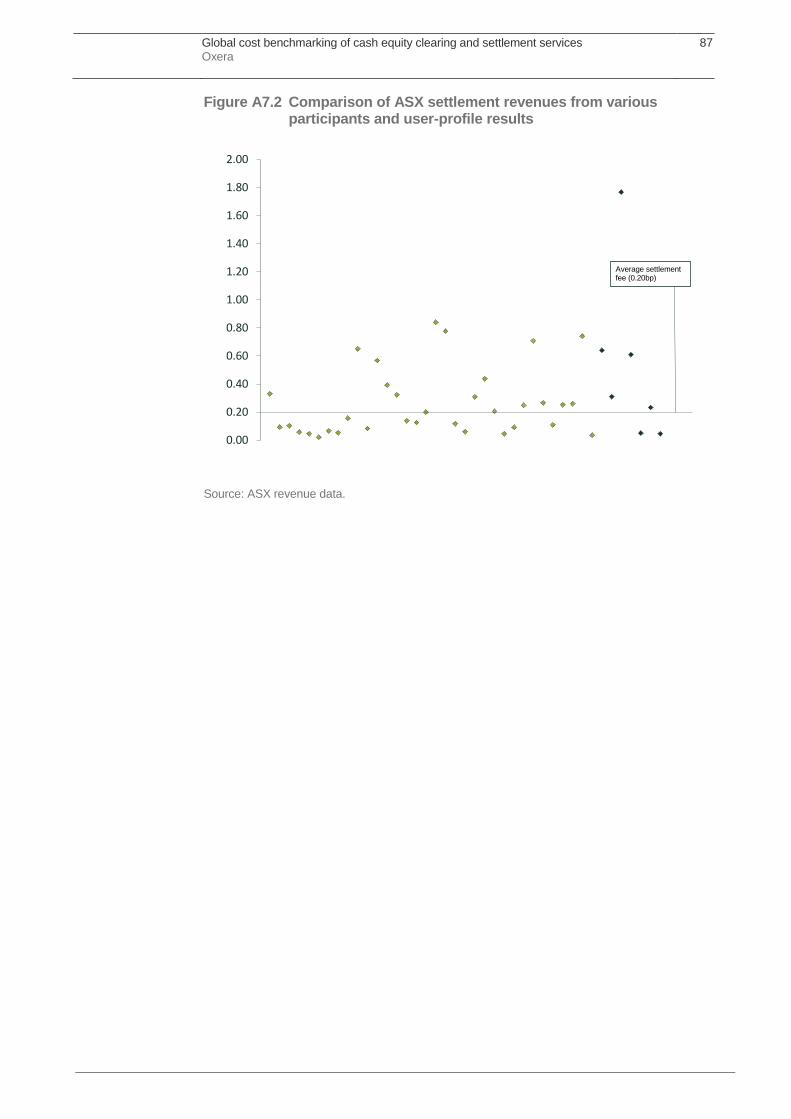
Global cost benchmarking of cash equity clearing and settlement services Oxera
87
Figure A7.2 Comparison of ASX settlement revenues from various participants and user-profile results
Source: ASX revenue data.
0.00
0.20
0.40
0.60
0.80
1.00
1.20
1.40
1.60
1.80
2.00
Average settlement fee (0.20bp)

Tel: +44 (0) 1865 253 000 Email: [email protected]
www.oxera.com
Oxford
Park Central 40/41 Park End Street
Oxford OX1 1JD
United Kingdom
Berlin Pariser Platz 4a
10117 Berlin Germany
Brussels
Stephanie Square Centre Avenue Louise 65
Box 11 1050 Brussels
Belgium
London 200 Aldersgate
14th Floor London
EC1A 4HD United Kingdom


