15
Global Defense Outlook 2016 Shifting Postures and Emerging Fault Lines

Global Defense Outlook 2016 Shifting Postures and Emerging Fault Lines

Global Defense Outlook 2016 | Shifting Postures and Emerging Fault Lines
3
Global Defense Outlook 2016 | Shifting Postures and Emerging Fault Lines
2
About Deloitte’s Global Defense Outlook
This report examines policies, practices and trends affecting the defense budgets and strategies of 50 nations whose combined defense budgets total over 95 percent of projected global defense spending in 2020 (the “Top 50”). Although its defense spending and global profile is clearly substantial, North Korea is not included in this analysis because reliable public information on North Korea's defense budgets and policies is not available at the same level of detail as the other Top 50. Publicly-available information, commercially-sourced data, interviews with officials in government and industry, and analyses by Deloitte’s global network of defense-oriented professionals are applied to develop the insights presented in the Global Defense Outlook. This is an independently-written report and the data and conclusions herein have not
been submitted for review or approval by any government organization, corporation or other institution. To simplify presentation and illuminate patterns in the economic data, Deloitte categorizes each of the Top 50 nations according to projected economic growth and projected growth in the national defense budget. Economic growth is defined as 2016 – 2020 projected compound annual growth rate (CAGR) in Gross Domestic Product (GDP) measured at purchasing power parity. Growth in the national defense budget is defined as 2016 – 2020 projected CAGR in the total national defense budget (all military services and defense-wide agencies) measured at purchasing power parity. These two projections illuminate distinct economic and defense budget profiles among the Top 50. The profiles are:
Higher-Growth Spenders: These fourteen nations project annual economic growth at 5 - 10 percent during 2016 – 2020, and project annual defense budget growth of 3 - 7 percent. The Higher-Growth Spenders are Algeria, Angola, Australia, China, Egypt, India, Indonesia, Israel, Morocco, Nigeria, Pakistan, Philippines, Poland, and Vietnam.
Higher-Growth Balancers: These nine nations project annual economic growth at 4.5 - 6.5 percent and project annual defense budget growth of 0 - 2.75 percent. The Higher-Growth Balancers are Iran, Mexico, Qatar, Singapore, South Korea, Taiwan, Thailand, Turkey, and United Arab Emirates.
Lower-Growth Balancers: These ten nations project annual economic growth
in the range of 3 - 4.5 percent and project annual defense budget growth of 0 - 2.75 percent. The Lower Growth Balancers are Belgium, Denmark, Finland, France, Germany, Italy, South Africa, Spain, Sweden, and Switzerland.
Economizers: Thirteen nations project 0 to - 3 percent annual defense budget growth, with overall economic growth rates from 2 - 7 percent annually. The Economizers are Argentina, Brazil, Canada, Chile, Japan, Kuwait, Malaysia, Netherlands, Norway, Oman, Saudi Arabia, United Kingdom, and United States.
Outliers: Four of the Top 50 nations project significant reductions in defense budgets (less than -3 percent annual growth). The Outliers are Colombia, Iraq, Libya, and Russia.
Contents
Global Defense Outlook: Shifting Postures, Emerging Fault Lines 4
Defense Posture Index: Economic Development Drives Defense Postures 6
Most Nations Are Moderating Defense Postures 6
Defense Budgets Lag Economic Growth as Developed Nations Economize on Defense 9
Strategic Profiles: Spenders, Balancers, and Economizers 10
Five Emerging Fault Lines 12
Russia/NATO: Conventional Forces Confrontation in Eastern Europe 12
China/Pacific States: Maritime Confrontation in the South China Sea 13
States/Terrorists: Asymmetric Confrontation in Africa and the Middle East 16
Mature/Emerging Nuclear Powers: Asymmetries among Nuclear States 18
The Information Economies/Emerging Economies: Confrontation in Cyberspace 20
Implications for Defense Policymakers: Managing Shocks Along the Fault Lines 23
Authors 24
Endnotes 25

54
4,200
60%
250
Russia
Israel
US
Pakistan
India
Iraq
Turkey
Singapore
Algeria
France
Denmark
Indonesia
South Africa
Canada
Argentina
Belgium
Mexico
Japan
180
180
180
168
156
150
132
120
120
120
66
66
66
66
54
54
60
60
0 50 100 150 200 0 50 100 150 200
1002011=1002016=98
98
Global Defense Outlook 2016 | Shifting Postures and Emerging Fault Lines Global Defense Outlook 2016 | Shifting Postures and Emerging Fault Lines
Global Defense Outlook 2016 Shifting Postures, Emerging Fault Lines Moderating defense postures…
• Defense Posture Index (DPI) down from 100 to 98 globally from 2011-2016.
• Since 2011 only seven nations in the Top 50 raised their defense posture. All are in Africa, Asia-Pacific and the Middle East.
• These seven growing DPI nations are expected to spend a total of $116B on defense in 20201, or seven percent of the total Top 50 spenders.
• In contrast, 42 nations including China, Russia and the US maintained or lowered their defense postures. These 42 nations are expected to spend over $1,400B on defense in 2020.
• 92 percent of the global defense budget is owned by nations which have moderated their defense postures since 2011.
…but increasing global tensions on Five Fault Lines
Russia/NATO
1 US Armored Brigade in Poland. The US increased its presence in Eastern Europe by
250 armored vehicles and self-propelled artillery
and 4,200 soldiers.
3 Russian Divisions in Western Military District.
China/Pacific States
Naval budgets are projected to grow by more than
60 percent above their 2011 levels by 2020 due to naval construction programs.
30 new Chinese submarines 48 new Indian naval vessels
States/Terrorists
92 percent of terrorist attacks and fatalities from 2005-2014 occurred in Africa, the Middle East and South Asia.
836 percent increase in terrorist attacks in Sub-Saharan Africa (2005-07 vs. 2012-14).
144 Persistent terrorist groups in 2012 -14, which has
doubled compared to 2005-07.
Mature/Emerging Nuclear Powers
9 Nuclear powers
5 Key Nuclear Security agreements
No agreements signed by all 9 nuclear powers
Cyber Top Targets
43% increase in average global vulnerability to cyberattack 2010-14.
“Cyber Top 10” are
6x more vulnerable to cyberattack than the ten least vulnerable Top 50 countries.
Defense Posture Index By Country 2016 Global Average = 98
Global Highest Posture (≥120) Global Lowest Posture (≤80)
GLOBAL DEFENSE OUTLOOK OVERVIEW
Global D
efense Outlook
Defense Posture Index
Five Emerging Fault Lines
Implications for D
efense Policymakers
GLOBAL DEFENSE OUTLOOK OVERVIEW

Global Defense Outlook 2016 | Shifting Postures and Emerging Fault Lines
7
Global Defense Outlook 2016 | Shifting Postures and Emerging Fault Lines
6
Lower Defense Posture Higher Defense Posture
Defense Posture Index: Economic Development Drives Defense Postures
Rapid, sustained economic growth combined with broad-based declines in global levels of military operations continues to transform the global defense environment. Over the next five years, economic forces appear likely to continue moderating global defense postures, and to narrow the capability gaps between armed forces worldwide. Economic forces are also creating significant new tensions among military powers, raising the prospect of new conflicts even as military postures continue to moderate worldwide. These new tensions have produced five emerging “fault lines” identified in this report as Russia/NATO, China/ Asia-Pacific States, Terrorists/Organized States, Mature/Emerging Nuclear Powers and Information Economies/ Emerging Economies. Along each fault line, advancing technology and inadequate international management frameworks are increasing the potential for future conflicts.
Most Nations Are Moderating Defense Postures National defense posture develops through a continuous and complex set of policy choices, based on perceptions of national interests and objectives, security threats, military-technical capabilities, economic priorities and other political factors. The outcome of this continuous evolution can be seen in seven elements of national defense posture, compiled here through a Defense Posture Index (DPI)2 . The DPI includes economic, military, and operational elements which, taken together, convey the overall national level of commitment to defense.
The seven Defense Posture Index elements are: Defense Share of Gross Domestic Product (GDP): This element describes how heavily the national economy relies on defense spending. Defense Share of Labor Force: This
element describes how dependent the domestic labor force is on defense spending and programs. Highly-advanced and diversified economies (e.g., United States) are generally less dependent, while emerging economies (e.g., India) rely on defense spending to boost economic development and job creation. Defense Share of Gross Government Expenditures: As economies develop, citizens typically demand new services, limiting the share of government expenditures available for defense programs. A high defense share of gross government expenditures signals a relatively heavy commitment to national defense at the expense of other priorities. Total Number of Nuclear Warheads: The decision to acquire and maintain nuclear weapons is consequential in economic, military and political terms,
and embodies a fundamental defense posture decision. This element reflects the total number of nuclear warheads currently counted in the arsenals of declared nuclear powers. Armed Conflict: This element counts the number of external conflicts involving a nation’s armed forces during the most recent and four preceding years. States with relatively high levels of external engagement are considered to have a higher defense posture. Battle-Related Deaths: This element captures the intensity of external conflicts (if any) during the most recent and four trailing years. Arms Exports: This element tracks the value of each nation’s arms exports. The decision to export military equipment reflects a key aspect of national economic policy and military-technical skill, as well as the maturity and scale of the defense industry.
DEFENSE POSTURE INDEX
Chart 1: Defense Posture Index Elements3
Defense Posture Index Elements and Scoring
Defense Posture Element Defense Posture Index Score
1 2 3 4 5
Defense Share of GDP (Percent) 0 < 1% 1 < 1.5% 1.5 < 2% 2 < 3.5% ≥ 3.5%
Defense Share of Labor Force (Percent) 0 < 0.5% 0.5 < 1% 1 < 1.5% 1.5 < 3% ≥ 3%
Defense Share of Gross Government Expenditures (Percent) 0 < 3% 3 < 5% 5 < 10% 10 < 20% ≥ 20%
Total Nuclear Warheads (Total) 0 1 < 20 20 < 100 100 < 500 ≥ 500
Engaged in Armed Conflict Current and Trailing 4 Years (Total Number of Conflicts) 0 1 < 2 2 < 5 5 < 10 ≥ 10
Battle-Related Deaths Current and Trailing 4 Years 0 1 < 500 500 < 1,000 1,000 < 2,000 ≥ 2,000
Total Trend Indicator Value of Arms Exports, Current and Trailing 4 Years ($M, US1990) 0 1 < 100 100 < 1,000 1,000 < 10,000 ≥ 10,000
Global D
efense Outlook
Defense Posture Index
Five Emerging Fault Lines
Implications for D
efense Policymakers

Global Defense Outlook 2016 | Shifting Postures and Emerging Fault Lines
9
Global Defense Outlook 2016 | Shifting Postures and Emerging Fault Lines
8
Pakistan
India
Iraq
Russia
Israel
US
Saudi Arabia
UAE
Singapore
Oman
Morocco
Algeria
Turkey
Sweden
South Africa
Mexico
Finland
Brazil
Switzerland
Denmark
Germany
Argetina
Canada
Belgium
Global Highest Posture(≥120) Global Lowest Posture(≤71)
164 71
71
71
66
66
66
60
60
55
55
49
153
153
148
148
142
131
126
126
120
120
120
120
0 50 100 150 200 0 50 100 150 200
Country
-6
-6
-6
-6
-6
-6
-6
-6
-6
-6
-12
-12
-12
-12
-18
-24
-2
6
6
6
6
6
18
0 5 10 15 2520-5-10-25 -15-20
12
Russia
Israel
US
Pakistan
India
Iraq
Turkey
Singapore
Algeria
France
Denmark
Indonesia
South Africa
Canada
Argentina
Belgium
Mexico
Japan
180
180
180
168
156
150
132
120
120
120
66
66
66
66
54
54
60
60
0 50 100 150 200 0 50 100 150 200
Nigeria
United Arab Emirates
Egypt
India
Singapore
Kuwait
Qatar
GLOBAL AVG
Israel
United States
Pakistan
United Kingdom
Finland
Spain
Switzerland
Belgium
Japan
Canada
Iraq
Chile
Germany
Turkey
Philippines
Libya
Lower Defense Posture Higher Defense Posture
Chart 2: Defense Posture Index: China, Russia, NATO, United States4
Defense Posture Element Defense Posture Index Score
1 2 3 4 5
Defense Share of GDP
Defense Share of Labor Force
Defense Share of Gross Government Expenditures
Total Nuclear Warheads
Engaged in Armed Conflict
Battle-Related Deaths
Arms Exports
National decisions about these seven elements reflect overall levels of commitment to national defense. When these elements are combined to form the Defense Posture Index, national approaches taken among the Top 50 defense spenders can be contrasted. Since 2011, the global average Defense Posture Index declined from 100 to 98, reflecting a broad-based but shallow decline in the reliance of national economies on defense-related production as well as declining military operating tempos. Of the ten countries with the highest Defense Posture Index scores (above 120), Russia, Israel and the United States are tied with the highest score. Six of the top ten are also nuclear powers. Of the eight countries with the lowest Index values (below 80), Japan and Mexico maintain the lowest defense posture index score and three other countries are non-U.S. members of NATO. In fact, the combined average Index score of non-U.S. NATO members (85) is 95 index points below the U.S. score (180) and 23 index points below the global average. China’s 2014 Index score of 108 is above the global Top 50 average, but well below the Index scores of India (156), Russia (180), and the United States (180).
Despite its growing defense capability and status as a nuclear power, China ranks 16th among the Top 50, and tied with Colombia and Oman. China’s moderate index score reflects its relatively low percentage of GDP devoted to military expenditures, and its lower level of engagement in foreign conflicts. Since 2011, only seven nations in the Top 50 raised their defense posture as
described by the DPI (See Figure 3). All seven are in Africa, Asia-Pacific, or the Middle East. These nations are expected to budget a combined total of $116B for defense in 20206, or about seven percent of total Top 50 defense spending. In contrast, 42 nations including China, Russia, and the United States maintained or lowered their defense postures. These 42 nations expect to budget over
$1,400B for defense in 2020. In fact, 92 percent of the global defense budget is owned by nations which have moderated their defense postures in recent years. Why do global tensions appear to be increasing, even as most nations are moderating their defense postures? Rapid economic growth in Asia-Pacific, and slower growth in the more developed Western economies, are creating shifts in defense resources and contributing to the emergence of new global fault lines.
Chart 3: Defense Posture Index By Country5
2016 Global Average = 98
Global Highest Posture (≥120) Global Lowest Posture (≤80)
Chart 4: Change In Defense Posture Index7
2016 vs.2011
Defense Budgets Lag Economic Growth as Developed Nations Economize on Defense The combined annual defense budget
of the 50 largest defense spenders is projected to remain flat at about $1.6 trillion through 20208 . Although the total global defense budget is flat, budget changes are not uniform worldwide. In fact, 12 of the Top 50 nations are projected to reduce annual defense budgets by a total of $44B, paced by the projected U.S. reduction of $38B (2020 vs. 2016). Sixteen of the Top 50 will increase defense budgets by more than $1B annually, adding $91B to the total global defense budget. China, India, South Korea, and Australia – all Asia-Pacific states -- plan the largest defense budget increases, accounting for $70B or 80 percent of the total global increase through 20209.
As economic growth and development continue worldwide, the global economy is becoming less reliant on defense spending. Higher-income nations including the United States and most European states are reducing the growth of defense budgets to accommodate domestic economic priorities, and lower-income nations are generally increasing defense spending to accelerate national economic development while further enhancing defense capabilities. While U.S. defense budget leadership remains unchallenged, flat or declining budgets in the United States and other higher-income countries contrast sharply with projected defense budget growth in Asia-Pacific.
Global D
efense Outlook
Defense Posture Index
Five Emerging Fault Lines
Implications for D
efense Policymakers
2016-20 GDP CAGR at PPP20
16-2
0 D
efen
se B
udge
t CA
GR
at P
PP
Mouse over circles below for alternati ve views
1110
Global Defense Outlook 2016 | Shifting Postures and Emerging Fault Lines Global Defense Outlook 2016 | Shifting Postures and Emerging Fault Lines
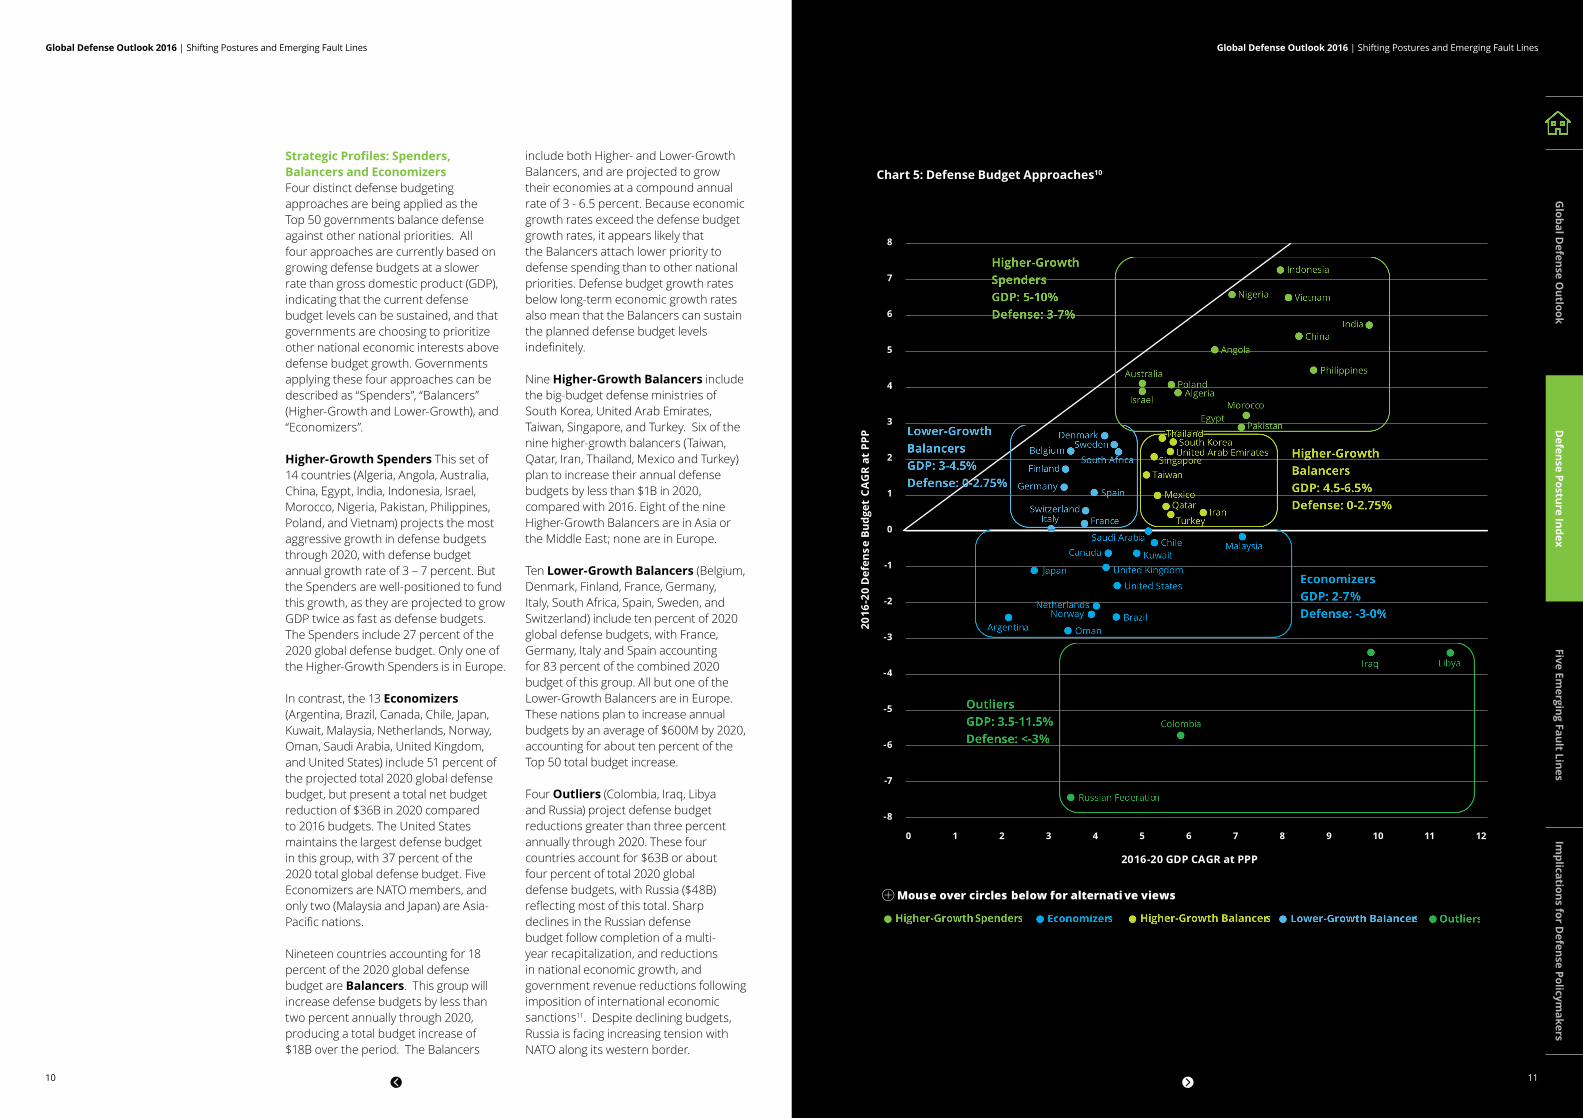
Strategic Profiles: Spenders, Balancers and Economizers Four distinct defense budgeting approaches are being applied as the Top 50 governments balance defense against other national priorities. All four approaches are currently based on growing defense budgets at a slower rate than gross domestic product (GDP), indicating that the current defense budget levels can be sustained, and that governments are choosing to prioritize other national economic interests above defense budget growth. Governments applying these four approaches can be described as “Spenders”, “Balancers” (Higher-Growth and Lower-Growth), and “Economizers”.
Higher-Growth Spenders This set of 14 countries (Algeria, Angola, Australia, China, Egypt, India, Indonesia, Israel, Morocco, Nigeria, Pakistan, Philippines, Poland, and Vietnam) projects the most aggressive growth in defense budgets through 2020, with defense budget annual growth rate of 3 – 7 percent. But the Spenders are well-positioned to fund this growth, as they are projected to grow GDP twice as fast as defense budgets. The Spenders include 27 percent of the 2020 global defense budget. Only one of the Higher-Growth Spenders is in Europe.
In contrast, the 13 Economizers (Argentina, Brazil, Canada, Chile, Japan, Kuwait, Malaysia, Netherlands, Norway, Oman, Saudi Arabia, United Kingdom, and United States) include 51 percent of the projected total 2020 global defense budget, but present a total net budget reduction of $36B in 2020 compared to 2016 budgets. The United States maintains the largest defense budget in this group, with 37 percent of the 2020 total global defense budget. Five Economizers are NATO members, and only two (Malaysia and Japan) are Asia-Pacific nations.
Nineteen countries accounting for 18 percent of the 2020 global defense budget are Balancers. This group will increase defense budgets by less than two percent annually through 2020, producing a total budget increase of $18B over the period. The Balancers
include both Higher- and Lower-Growth Balancers, and are projected to grow their economies at a compound annual rate of 3 - 6.5 percent. Because economic growth rates exceed the defense budget growth rates, it appears likely that the Balancers attach lower priority to defense spending than to other national priorities. Defense budget growth rates below long-term economic growth rates also mean that the Balancers can sustain the planned defense budget levels indefinitely.
Nine Higher-Growth Balancers include the big-budget defense ministries of South Korea, United Arab Emirates, Taiwan, Singapore, and Turkey. Six of the nine higher-growth balancers (Taiwan, Qatar, Iran, Thailand, Mexico and Turkey) plan to increase their annual defense budgets by less than $1B in 2020, compared with 2016. Eight of the nine Higher-Growth Balancers are in Asia or the Middle East; none are in Europe.
Ten Lower-Growth Balancers (Belgium, Denmark, Finland, France, Germany, Italy, South Africa, Spain, Sweden, and Switzerland) include ten percent of 2020 global defense budgets, with France, Germany, Italy and Spain accounting for 83 percent of the combined 2020 budget of this group. All but one of the Lower-Growth Balancers are in Europe. These nations plan to increase annual budgets by an average of $600M by 2020, accounting for about ten percent of the Top 50 total budget increase.
Four Outliers (Colombia, Iraq, Libya and Russia) project defense budget reductions greater than three percent annually through 2020. These four countries account for $63B or about four percent of total 2020 global defense budgets, with Russia ($48B) reflecting most of this total. Sharp declines in the Russian defense budget follow completion of a multi-year recapitalization, and reductions in national economic growth, and government revenue reductions following imposition of international economic sanctions11. Despite declining budgets, Russia is facing increasing tension with NATO along its western border.
Chart 5: Defense Budget Approaches10
Global D
efense Outlook
Defense Posture Index
Five Emerging Fault Lines
Implications for D
efense Policymakers

Global Defense Outlook 2016 | Shifting Postures and Emerging Fault Lines
13
Global Defense Outlook 2016 | Shifting Postures and Emerging Fault Lines
12
Five Emerging Fault Lines As defense budgets flatten, and as the emerging economies accelerate development of defense capabilities, tensions appear to be rising along five global fault lines. In each case, the fault line runs between higher-income nations and lower-income nations or non-state actors. The fault lines pose risks because existing international structures appear ill-suited to manage these risks, and because improving military technology may increase the potential for inadvertent or unintentionally costly conflict. Even as global defense postures continue to moderate, the potential for conflict along the global fault lines appears substantial.
The Russia/NATO Fault Line: Conventional Forces Confrontation in Eastern Europe During the Cold War, tensions between NATO and the Soviet Union were buffered by the geographical separation and routine interaction provided by the Warsaw Pact. Following the collapse of the Soviet Union and dissolution of the Warsaw Pact, NATO began to expand eastward, and now includes every former Warsaw Pact nation as well as the Baltic states of Latvia, Lithuania and Estonia. The combination of close proximity, expanding military forces deployed near the Russia/NATO borders, and loss of previous arms control and crisis management capabilities, have created a new fault line in Europe posing increasing risks of accidental conflict. The United States has signaled that it will deploy armored forces in Poland, bringing U.S. and Russian troops into closer proximity. NATO Supreme Commander U.S. General Breedlove described the United States and NATO’s European Reassurance Initiative (ERI) as a return to a posture of deterrence
against Russia, contrasting the ERI with NATO’s previous policy of “partnership toward Russia”, under which the alliance downsized its forces, headquarters and capabilities12. The U.S. Defense Department proposed budget for ERI is $3.4 billion for FY17 – more than quadrupling the $789 million requested in FY16 – providing funds to increase the amount of prepositioned equipment sets in Europe as well as the number of U.S. forces, including Reserve forces, rotating through Europe. This increase supports the persistent rotational presence of an armored brigade combat team resulting in a full-time presence of three U.S. armored brigade combat teams. ERI spending supports forward-stationing equipment for an additional armored brigade combat team and division headquarters, an additional F-15 fighter squadron based in Europe and other measures13. Deployment of U.S. missile defense systems began in Romania and Poland in 2013, against strong objections from the Russian government14. Aligning with the U.S. announcement, Poland projects that its annual defense budget will increase by over $2 billion by 202015. The Baltic countries will increase their annual defense budgets by more than 40 percent, to roughly $2B in total, by 202016. Russia has also built up forces along its western border. Three “western-oriented” army divisions are to be deployed in Russia’s Western Military District in 2016, continuing a re-deployment that has included some 30 units17. Russian Army and Navy units are being modernized and deployed in the southwestern Black Sea region as a counterpoise to NATO deployments18. The Russian Defense Minister indicated that Russia intends to expand permanent
military infrastructure including test sites, equipment depots and barracks in western Russia19. However, as Russia and NATO continue to expand military capabilities along Russia’s western border, the mechanisms for limiting arms buildups and managing potential confrontations have deteriorated. In 2015, Russia decided to “completely” end its reporting and other diplomatic activities under the Treaty on Conventional Armed Forces in Europe (CFE), after first halting participation in 200720. Russia’s Permanent Representative to NATO Alexander Grushko characterized the treaty as having “no links with reality”, and described the arms control environment in Europe as “practically non-existent”21. Following a close confrontation between a U.S. Navy destroyer operating near Poland and Russian military aircraft, NATO’s Secretary General acknowledged that improved coordination measures are necessary to avoid accidental conflict, and called for a re-examination of the Vienna Document22. This 2011 agreement23 includes politically binding confidence and security-building measures (CSBMs) designed to increase openness and transparency concerning military activities conducted inside the territory, surrounding sea areas, and air space of all European (Russia from the western border to the Ural Mountains) and Central Asian participating States. The Vienna Document calls for a variety of information exchanges, on-site inspections, and other military-to-military contacts. While conventional forces move into closer proximity, unconstrained by arms control measures, other U.S./ NATO/Russia agreements remain well-established. For example, the U.S./Russia New START Treaty24 caps the number
of U.S. and Russian strategic nuclear forces. New START provides for data exchanges, notifications, and on-site inspections—all of which have continued in spite of the recent deterioration in relations. The United States, Russia, and NATO remain nominally committed to other agreements which could provide a basis for risk reduction, including the Vienna Document and the Open Skies Treaty25. The emerging conventional forces fault line, based on escalating and unregulated force levels, is a marked contrast to the cooperative behavior between NATO and Russia in other defense policy domains.
Chart 6: Global Maritime Shipping Container Volumes28
Global Maritime Shipping Container Volumes by Source Twenty-Foot Equivalent Units (TEU) (2001 vs. 2013)
The China/Pacific States Fault Line: Maritime Confrontation in the South China Sea The primary maritime fault line facing global defense authorities is the fissure between China and the Pacific Rim states over access and operations in the South China Sea. This deepening fault line
has its roots in the growing importance of maritime commerce to all Asia-Pacific economies, combined with the absence of international laws, treaties or institutions equipped to manage conflicting national economic interests. Naval practices (e.g. freedom of navigation exercises) which bring contending forces into close proximity, combined with new Chinese bases on artificially enlarged islands may further deepen this fault line. Director of U.S. National Intelligence James Clapper claimed that China can project “substantial offensive military power” from its newly-established artificial islands26. For its part, the United States has sent a series of U.S. Navy patrols near the disputed islands, claiming these are “freedom of navigation” exercises that “challenge maritime claims that would unlawfully restrict rights and freedoms provided in international law”27. The risk of conflict appears high in this contested area.
Global D
efense Outlook
Defense Posture Index
Five Emerging Fault Lines
Implications for D
efense Policymakers
2001
16%12%
22%
30%
20%
100% = 219M TEU
52%
50%
100% = 631M TEU+188%
China
Other Asia-Pacific
European Union
United States
Rest of World24%
7%
16%
25%
27%
2013
Global Defense Outlook 2016 | Shifting Postures and Emerging Fault Lines
15
Global Defense Outlook 2016 | Shifting Postures and Emerging Fault Lines
14
Economic Development Drives Increased Maritime Commerce As the Asia-Pacific economies have developed their manufacturing and export capabilities, and as demand increases with economic development, ocean shipments of goods have become increasingly important to sustained growth and development (See Chart 6). Container shipment volumes increased by over 188 percent between 2001 and 201329. More than half the world’s total container shipment volume now originates in the Asia-Pacific region, with 27 percent from China alone. China’s share of the global total has increased sharply since 2001 and appears likely to rise further.
But this increased trade is moving through narrow sea lanes, posing risks for countries dependent on free movement of commercial goods over the world’s oceans. Each year, about 30 percent of world trade passes through the Strait of Malacca and approximately 20 percent of worldwide oil exports pass through the Strait of Hormuz30. Tanker traffic through the Strait of Malacca leading to the South China Sea is over three times greater than traffic through the Suez Canal31, and over five times greater than traffic through the Panama Canal. China and all Asia-Pacific nations have substantial economic interests in maintaining access to the key commercial routes through the Western Pacific, South China Sea, East China Sea and Indian Ocean.
Maritime Commerce Drives Asia-Pacific Naval Buildup China’s position as the region’s largest economy, and its reliance on access to ocean routes for international trade have led to substantial changes in Chinese defense policy. These changes, in turn, are generating policy responses from other Asia-Pacific governments, leading to a significant buildup of naval capabilities in the region. China undertook a broad revision of its defense strategy in 201532, citing for the first time a commitment by the PLA Navy (PLAN) to gradually shift its focus toward open-sea operations, including strategic
deterrence and counterattack, maritime maneuvers, and joint operations at sea, and comprehensive defense support. This shift toward open-sea operations can be seen in at least four maritime practices undertaken by China – territorial claims to provide a basis for securing sea lines of communication, new overseas bases to enhance support for open-sea operations, continued development of carrier-based aviation and an extensive submarine construction program. China’s new strategy includes expansion of carrier-based aviation, as the PLA Navy announced the design and construction of a second aircraft carrier intended to enhance China’s ability to “safeguard sovereignty over territorial seas and over maritime rights and interests”33. The Chinese naval construction program is also believed to include over 30 new diesel-electric attack submarines – or about one-third of all conventional submarine deliveries planned worldwide over the next ten years34. China’s territorial claims to Taiwan (Republic of China or ROC) and ROC-controlled islands, islands in the South China Sea (Paracels and Spratly Islands), and the Senkaku/Diaoyu islands claimed by Japan have not changed substantially since the 1970s35, but have gained importance as China has undertaken construction and reclamation efforts to support future bases.
Regional Navies Adjust to Expanding Commerce, and To China’s Emerging Capability With a view toward their own reliance on maritime commerce, as well as toward China’s growing naval resources, Asia-Pacific defense ministries are undertaking substantial programs to expand their fleets – especially submarine fleets. Naval budgets are projected to grow by more than 60 percent above their 2011 levels by 2020, as naval construction programs drive higher spending36. Most countries in Asia-Pacific have announced new or expanded submarine programs. Australia will undertake its first new submarine construction in twelve years, replacing the existing Collins-class fleet
with a new boat to be designed with international participation37. Taiwan announced its intention to design and build a fleet of new submarines to replace existing 70-year-old boats38. The Indonesian Navy has announced plans to procure two new submarines from Russia as it seeks to bolster its limited submarine force. Current plans are for Indonesia to acquire 12 diesel-electric submarines by 202439. Japan is continuing with construction of its advanced Soryu-class submarine fleet by adding to the six boats already in service40. South Korea added a sixth conventional submarine to its fleet in 2015, and announced the formation of an integrated submarine fleet command structure41. Pakistan announced in late 2015 a deal to acquire eight new attack submarines from China42, and India announced plans to design and build a new class of nuclear-powered attack submarines, with an initial commitment for six boats43. The Indian submarine program complements a substantial naval buildup, as India currently has some 48 new vessels under construction44. The U.S. Navy plans a substantial expansion of undersea warfare capabilities, even as the U.S. defense budget declines. Recently-announced plans include acquisition of nine new Virginia-class attack submarines,
development of new torpedoes and unmanned undersea vehicles (UUV), and increased procurement of maritime surveillance and patrol aircraft. Nearly $42B is budgeted for these naval spending programs45. But these increasingly-capable navies are operating in close proximity, in a region where available international law and crisis management mechanisms appear ill-suited to containing potential confrontations. The limitations of these laws and mechanisms are apparent in the ongoing confrontation between China and its Asia-Pacific neighbors over the Spratly Islands. The current confrontation appears rooted in the failure of the 1951 San Francisco Treaty to stipulate possession of the Spratly islands after the conclusion of the Second World War46. With six nations laying claim to the Spratly Islands (Brunei, Malaysia, China, Philippines, Vietnam, and Taiwan), the dispute might be placed in the realm of international law and resolved by applicable adjudicatory bodies. But there is no treaty that all members with claims (or interests) implicated have shared membership (Table 1). Some claims have sought resolution from the UN through the United Nations Convention on the Law of the Sea47 (UNCLOS). However, the United States has not ratified UNCLOS. Philippines
contested China’s claims in The Hague in November 2015, claiming China’s actions are illegal. While the court’s findings are binding for UNCLOS members, China declined to participate. Its foreign ministry spokesman said, “Our position is clear; we will not participate to or accept the arbitration”48. For its part, Taiwan has contested the Philippines claim, disputing the Philippines contention that the Spratlys are not legally islands49. Other regional nations have looked to the Association of Southeast Asian Nations (ASEAN) for resolution. ASEAN has said it is “seriously concerned” about the disputed islands50, but is not well-positioned to resolve tensions because China, Japan and the United States are not members. As early as 2011, ASEAN tried to resolve the status of the islands at its conference, but to no avail51. A novel attempt by four of the ASEAN claimants – Brunei, Malaysia, the Philippines, and Vietnam – to settle their own positions also produced no resolution52. A joint conference with China in November 2015 failed to produce a joint ceremonial statement over language regarding the disputes53. The combination of vital economic interests, increasingly powerful naval forces operating in close proximity, and weak international legal and institutional mechanisms points toward deepening tensions along this maritime fault line.
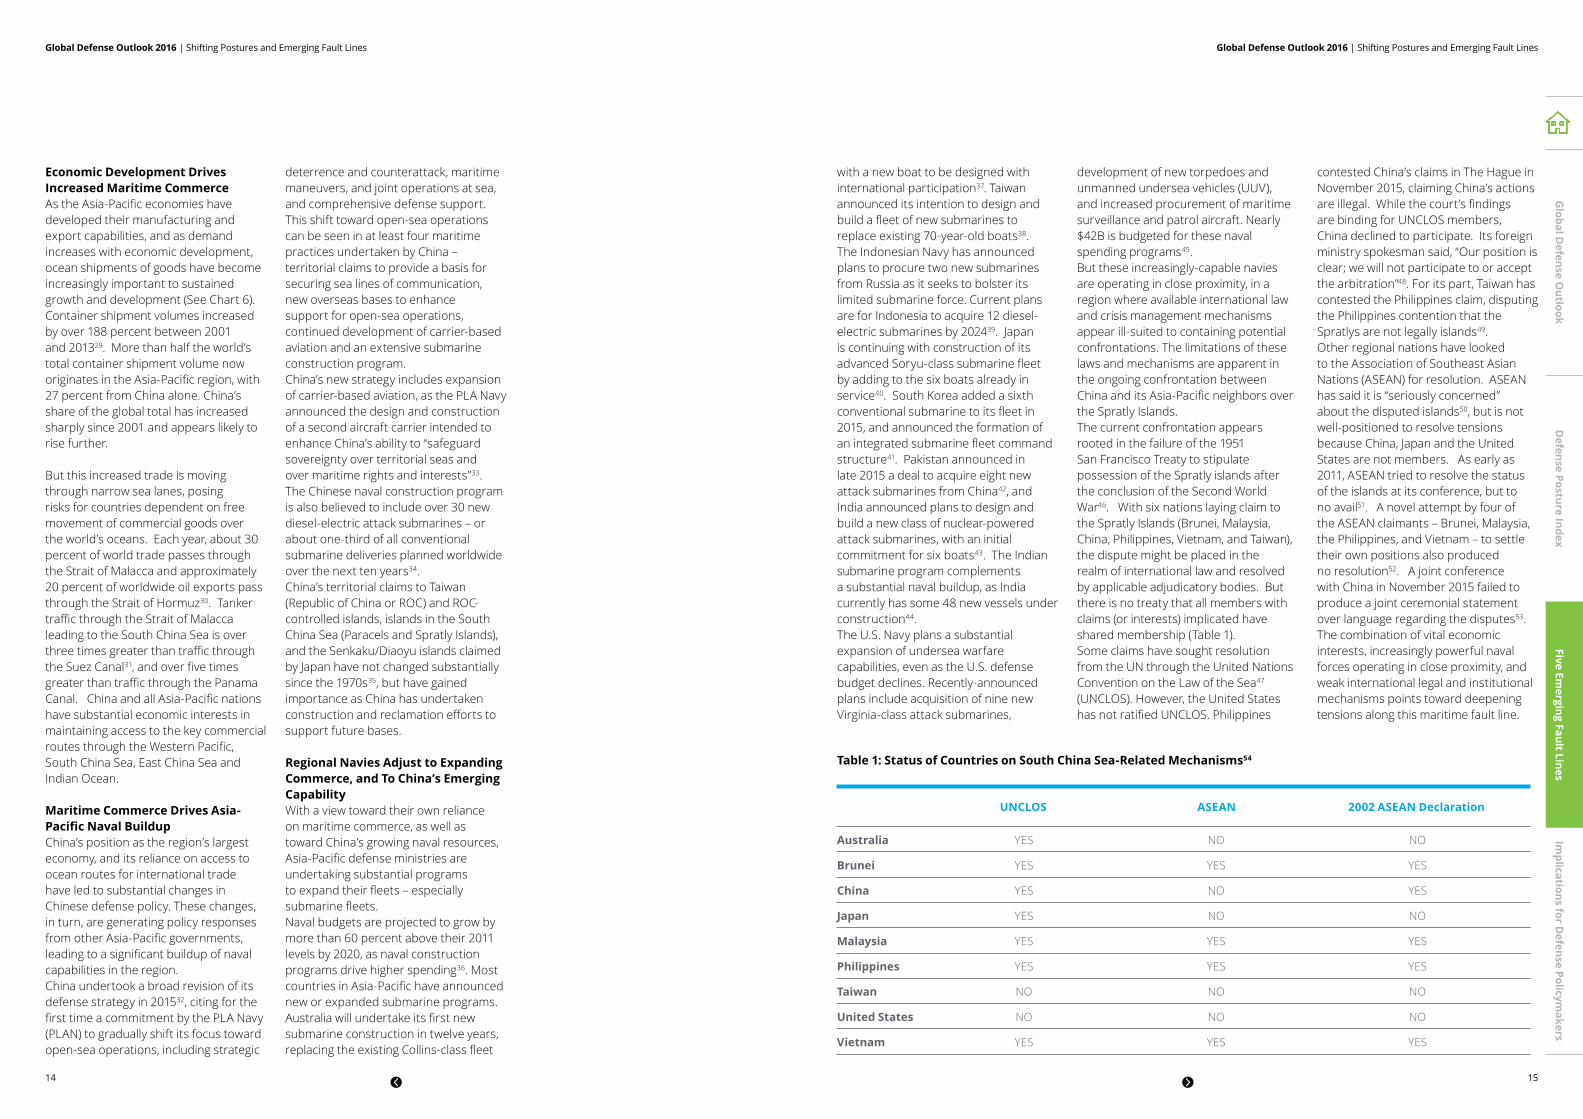
Table 1: Status of Countries on South China Sea-Related Mechanisms54
UNCLOS ASEAN 2002 ASEAN Declaration
Australia YES NO NO
Brunei YES YES YES
China YES NO YES
Japan YES NO NO
Malaysia YES YES YES
Philippines YES YES YES
Taiwan NO NO NO
United States NO NO NO
Vietnam YES YES YES
Global D
efense Outlook
Defense Posture Index
Five Emerging Fault Lines
Implications for D
efense Policymakers

Global Defense Outlook 2016 | Shifting Postures and Emerging Fault Lines
17
Global Defense Outlook 2016 | Shifting Postures and Emerging Fault Lines
16
Middle East & North Africa South Asia Southeast Asia Sub-Saharan Africa
3,443
2,526
13,873
+303%
+836%
+430%
+241%
13,392
840 475
4,446
2,861
2005 - 2007 2012 - 2014
Middle East & North Africa South Asia Southeast Asia Sub-Saharan Africa
2428
35+46%
+260%
+104%
+60%
57
10 10
36
16
2005 - 2007 2012 - 2014
Middle East & North Africa South Asia Southeast Asia Sub-Saharan Africa
3,443
2,526
13,873
+303%
+836%
+430%
+241%
13,392
840 475
4,446
2,861
2005 - 2007 2012 - 2014
Middle East & North Africa South Asia Southeast Asia Sub-Saharan Africa
2428
35+46%
+260%
+104%
+60%
57
10 10
36
16
2005 - 2007 2012 - 2014
The States/Terrorist Fault Line: Asymmetric Confrontation in Africa and Middle East High-profile terrorist attacks in Europe attract global media attention, but the focus of terrorist groups remains the Middle East, Africa and South Asia. A deep fault line continues to develop between increasingly well-organized and financed terrorist groups, and the poorly-armed and ill-equipped governments these groups are working to undermine. As this fault line between states and chaos deepens, the lack of local or global institutions to address terrorist activity, and the new tools provided by emerging technology, indicate that terrorism-related challenges appear likely to persist.
Growing Chaos: Increasing Terrorism, More Persistent and Capable Adversaries From 2005 to 2014, nearly 65,000 terrorist attacks occurred worldwide, killing over 143,000 people55. More than 91 percent of these attacks and fatalities occurred in Africa, the Middle East and South Asia, which remain the primary focus of terrorism. Despite substantial military, political and economic measures by governments to address terrorism, attacks in Africa, Middle East and South Asia have continued to increase. Compared to the three year period from 2005 – 2007, terrorist incidents in
Africa, the Middle East, and South Asia increased by 375 percent in the three years 2012-2014, with fatalities rising at about the same rate57. The well-known terrorist groups Islamic State, Al Qaida, Boko Haram and Al Shabab account for only about twenty percent of the total incidents and fatalities during this period, but these groups represent increasingly capable and well-financed threats to governments across the region. Islamic State revenues from oil and other sources have been estimated at greater than $480M annually, supporting some 31,000 fighters58. Al-Shabab is estimated to take in over $100M annually through taxation, extortion and other methods59. Boko Haram operates on lower cash budgets by recruiting young men from rural areas of Africa, but maintains a fighting force estimated at 9,00060. Organized efforts to weaken or destroy these increasingly-capable groups do not appear to have worked. In fact, as the number of successful attacks has grown, the number of persistent terrorist groups operating in Africa, the Middle East and South Asia appears to have increased. “Persistent” terrorist groups are those able to conduct and take credit for more than one incident over multiple years. Many terrorist acts are undertaken by single individuals, or by groups that conduct only a single incident and never re-emerge. Persistent groups maintain funding, infrastructure and forces over
longer periods of time, presenting a more durable challenge to established governments. During the three-year period 2005 – 2007, 72 persistent terrorist groups carried out attacks in Africa, the Middle East and South Asia. This number doubled to 144 persistent groups in the three-year period 2012-2014, with the largest increase occurring in sub-Saharan Africa.
Chart 7: Terrorist Incidents 2005-2007 and 2012-201456
As the number of persistent terrorist groups has increased, so has their capability to inflict larger numbers of casualties. The most lethal terrorist groups are those able to kill more than 50 victims in a single year. During the three-year period 2005 – 2007, only 15 such groups were in operation, accounting for 28 percent of total terrorist incidents in Africa, the Middle East and South Asia. Despite significant counter-terrorism operations by local governments, assisted by global military and economic resources, the number of highly-lethal groups more than doubled, to 38, during the 2012-2014 period62.
Enabled By Technology and Limited International Mechanisms Terrorism in Africa, the Middle East and South Asia continues to increase, with a larger number of persistent and increasingly lethal terrorist groups mounting more frequent attacks. Technology appears to be working in
favor of terrorist operations, facilitating the transfer of money, weapons and information and making terrorist organizations harder to combat. Islamic State’s sophisticated recruiting and propaganda operations are well-known and appear effective in attracting money and fighters63. In addition to internet-enabled information operations, terrorist groups have exploited social media networks to create an arms-trafficking market isolated from international constraints on arms trafficking.
Chart 8: Persistent, More Capable Terrorist Groups61
Recent surveys of terrorist arms trafficking in Libya and other states confirm that weapons including anti-tank and anti-aircraft missiles, small arms and communications equipment are being sold through easily-accessed social media sites. Weapons include items originally provided by the U.S. and other Western governments to government forces in Iraq, Afghanistan and other states. These weapons can be made available to a broad network of potential buyers because of the e-commerce capabilities and easy access procedures on public social media networks64. Enabled by Western information technology and weapons, and relatively unhindered by international arms trafficking constraints, terrorist groups are deepening the fault line between order and chaos in Africa, Middle East and South Asia.
Global D
efense Outlook
Defense Posture Index
Five Emerging Fault Lines
Implications for D
efense Policymakers

Global Defense Outlook 2016 | Shifting Postures and Emerging Fault Lines
19
Global Defense Outlook 2016 | Shifting Postures and Emerging Fault Lines
18
The Mature Nuclear Powers/ Emerging Nuclear Powers Fault Line: Asymmetries among Nuclear States The Cold War consensus on tight control over nuclear weapons has frayed, as the emerging powers adopt a more opportunistic approach to development and deployment of nuclear weapons. The emerging nuclear powers are operating outside the global treaty framework for testing, proliferation, arms reduction, crisis management and fissile material controls. As a result, a new global fault line has emerged, with the more established nuclear powers generally operating within established international norms governing nuclear weapons, and a group of emerging nuclear powers operating outside this framework. Proliferation, accidental use or even theft of nuclear weapons or fissile material may be increasingly likely in the absence of revised and more generally accepted international principles for governing these dangerous weapons. Proliferating cruise and stealth technology, miniaturization and other technical advancements are increasing the capability of the emerging group, while not constraining these states to adopt treaty restrictions65. The Cold War spawned a series of multilateral nuclear treaties that explicitly restricted the testing and proliferation of nuclear weapons. These treaties bound the actions of the major Cold War nuclear powers, including the United States, the then-Soviet Union, China, the United Kingdom, and France. However, the more recent members of the nuclear club – India, Pakistan, and North Korea – were not signatories to many of these treaties, nor did they subsequently accede to them once they developed nuclear weapons (See Table 2). Nuclear tensions between India and Pakistan are currently largely resolved on the basis of bilateral treaties that explicitly do not restrict development, testing, or building of nuclear weapons.
The major treaty between the two countries, the India-Pakistan Non-Attack Treaty, signed in 1988, forbids attacks on nuclear electric generation stations but contains no restrictions on nuclear weapons67. Of special concern to many nations is the fact that both India and Pakistan are not signatories to the Non-Proliferation Treaty.
Without the restrictions of the Non-Proliferation Treaty, both India and Pakistan are looking to expand the potential of their nuclear arsenals. Pakistan’s Defense Secretary, Khawaja Asif stated that nuclear weapons existed as deterrents and would be used to ensure national survival68. Pakistan’s Foreign Secretary Aizaz Chaudhry confirmed that Pakistan would use low-yield nuclear bombs to forestall any advance of Indian troops under New Delhi’s “Cold Start” doctrine69. Pakistan’s Prime Minister’s Advisor on Foreign Affairs stated that the strategic and conventional imbalance with India was Pakistan’s topmost security concern and rejected any call from the United States to limit its nuclear weapons arsenal70. Pakistan last year tested a Ghauri Ballistic Missile with a range of 1,300 kilometers or 807 miles71. For its part, India announced the completion of the INS Arihant, a submarine that will complete development of a nuclear triad. Carrying up to 12 short range K-15 missiles or four K-4 ballistic missiles, the Arihant provides India with a “second strike” capability72. It has raised the potential for an arms race among regional naval powers such as China, Pakistan, and North Korea73. A media report indicated that India is also looking into stockpiling enriched uranium fuel to develop thermonuclear weapons and is developing a site to do so74. President Obama announced at the Nuclear Security Summit in April 2016 that both Pakistan and India
must reduce their nuclear weapons, and expressed concern regarding development of “small tactical nuclear weapons that could be at greater risk of theft”75. He called on both the United States and Russia to lead the way as the largest possessors of nuclear weapons. But his remarks led to negative responses from both countries. India’s Foreign Affairs Spokesman characterized the President’s comments as demonstrating a “lack of understanding of India’s defense posture”76.
Table 2: Multilateral Nuclear Treaty Ratification or Accession Status66
Non-Proliferation Treaty
Comprehensive Test Ban Treaty
International Convention on the
Suppression of Acts of Nuclear Terrorism
Treaty Banning Nuclear Tests in the Atmosphere,Outer Space,and Under Water
(Partial Test Ban)
Treaty on the Prohibition of the Emplacement of Nuclear Weapons and Other WMD on the Seabed and Ocean Floor and in the Subsoil Thereof
United States Not ratified
Russia
France
United Kingdom
Israel Not ratified Not ratified
China Not ratified
North Korea Withdraw
India
Pakistan
North Korea is also not a signatory to these treaties and recently announced successful testing of a solid-fuel rocket engine77. The major response to North Korea nuclear testing has been international sanctions. In reaction to recent tests, France imposed sanctions on North Korea, as has China, which banned imports of coal and iron ore, major North Korean exports78. In the interim, the United Nations International Atomic Energy Agency announced on April 8, 2016 that 100 countries would have to implement more robust standards to protect nuclear materials, in part to keep nuclear weapons from terrorist groups79. As the emerging nuclear powers (India, Pakistan and North Korea) develop new capabilities, the mature nuclear powers
including the U.S., Russia and China are developing new nuclear warhead and delivery technologies that appear likely to further limit the practical value of existing arms control mechanisms. The U.S. has announced a 30-year program to “modernize” its nuclear arsenal, but the program includes five classes of weapons and delivery vehicles seen as shifting the U.S. arsenal toward smaller, stealthier weapons that may prove difficult to verify or manage through arms control agreements80. Since the New Start Treaty of 2010, both Russia and China have moved to increase the number of warheads deployed on ballistic missiles81. China and the United States are developing hypersonic glide vehicles, potentially capable of attacking nuclear weapon sites without using nuclear warheads and blurring the line between conventional and nuclear weapons82. The emerging nuclear fault line is magnified by new nuclear powers and by technologies that threaten the usefulness of traditional arms control and confidence-building measures. Addressing the nuclear fault line may require new forms of multi-state diplomacy as well as technical restraint in deploying advanced nuclear systems.
Global D
efense Outlook
Defense Posture Index
Five Emerging Fault Lines
Implications for D
efense Policymakers
Global Defense Outlook 2016 | Shifting Postures and Emerging Fault Lines
21
Global Defense Outlook 2016 | Shifting Postures and Emerging Fault Lines
20
South KoreaNetherlandsSwitzerlandDenmarkFinlandVietnamUnited KingdomSwedenAustraliaGermanyWorld AverageMexicoLibyaIranUnited Arab EmiratesAlgeriaOmanKuwaitIraqSaudi ArabiaQatar
CanadaPolandUnited StatesSwedenFinlandNetherlandsItalyNorwaySouth KoreaFranceTop 50 AverageAlgeriaUnited Arab EmiratesSaudi ArabiaKuwaitQatarOmanLibyaAngolaNigeriaIraq
0 50 100 150 200 250 300 350
0
2009
50 100 150 200 250 300 350
2014
183
146
109
140
109
142
130
107
147
100
100
24
44
25
23
3333
30
28
27
27
1410
25
2213
15
296
231
209
200
196
158
158
158
150146
143
324
275
255
251
216
212
157
153
144
140
54
10
9
8
7
7
3
2
2
2
1
49
45
42
35
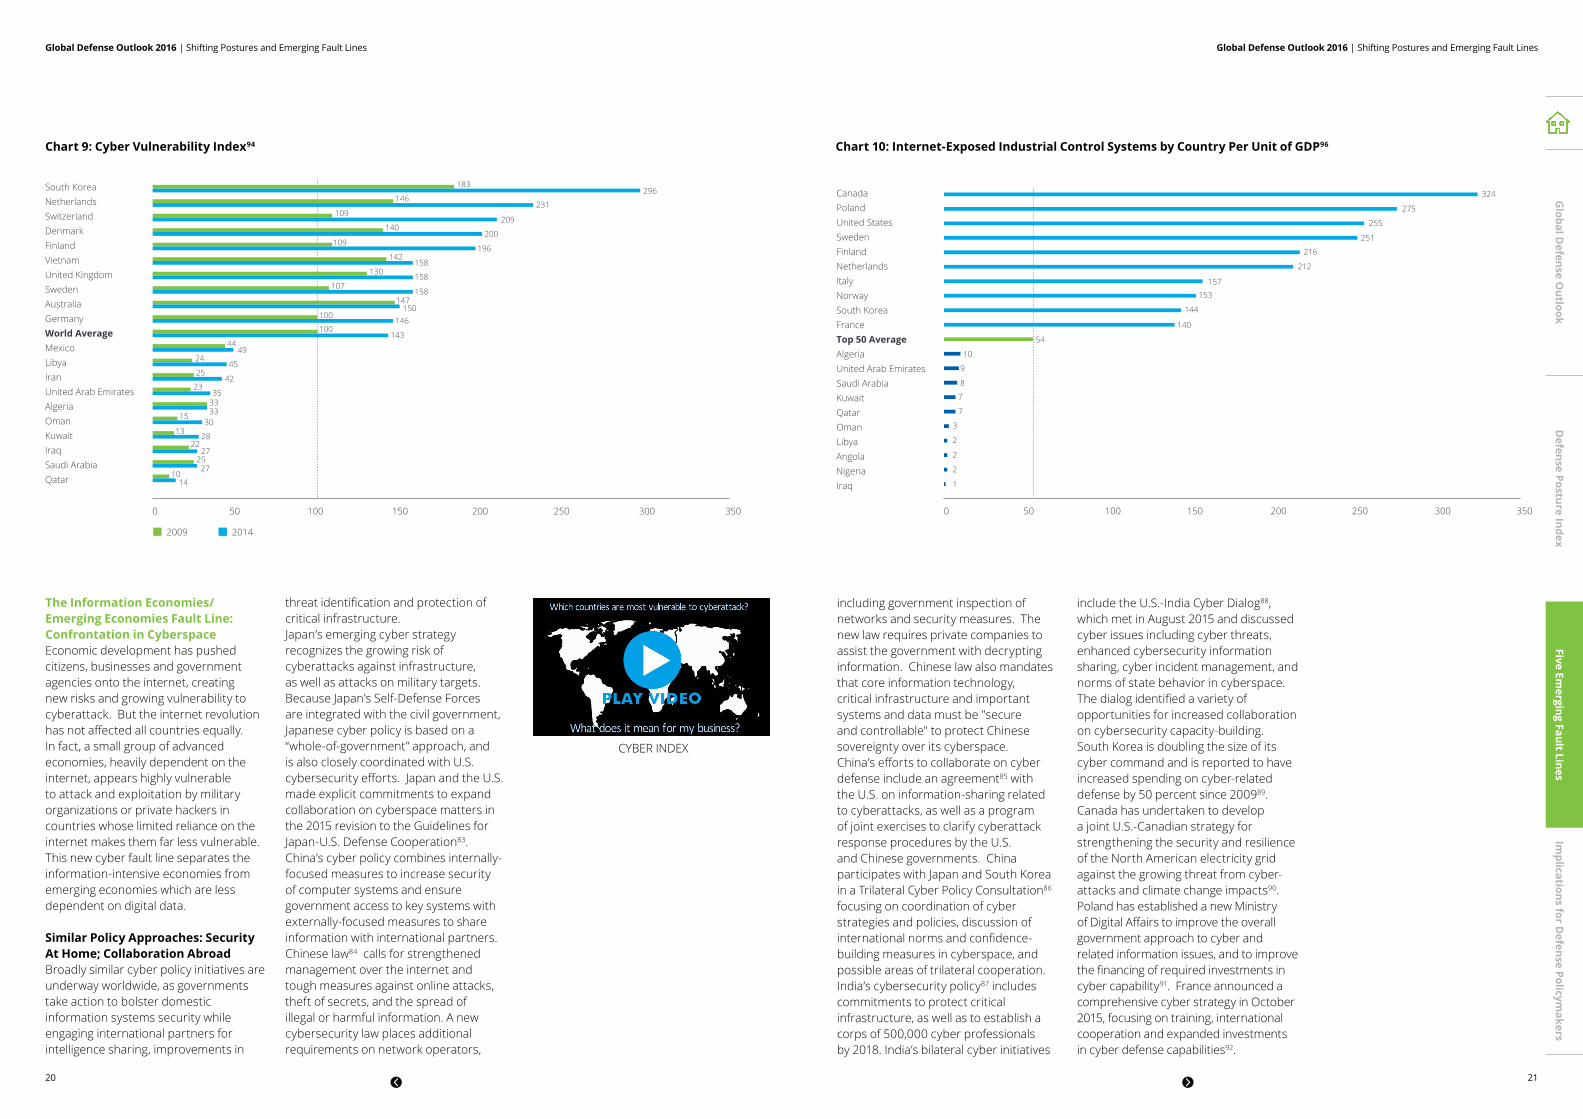
Chart 9: Cyber Vulnerability Index94 Chart 10: Internet-Exposed Industrial Control Systems by Country Per Unit of GDP96
The Information Economies/ Emerging Economies Fault Line: Confrontation in Cyberspace Economic development has pushed citizens, businesses and government agencies onto the internet, creating new risks and growing vulnerability to cyberattack. But the internet revolution has not affected all countries equally. In fact, a small group of advanced economies, heavily dependent on the internet, appears highly vulnerable to attack and exploitation by military organizations or private hackers in countries whose limited reliance on the internet makes them far less vulnerable. This new cyber fault line separates the information-intensive economies from emerging economies which are less dependent on digital data.
Similar Policy Approaches: Security At Home; Collaboration Abroad Broadly similar cyber policy initiatives are underway worldwide, as governments take action to bolster domestic information systems security while engaging international partners for intelligence sharing, improvements in
threat identification and protection of critical infrastructure. Japan’s emerging cyber strategy recognizes the growing risk of cyberattacks against infrastructure, as well as attacks on military targets. Because Japan’s Self-Defense Forces are integrated with the civil government, Japanese cyber policy is based on a “whole-of-government” approach, and is also closely coordinated with U.S. cybersecurity efforts. Japan and the U.S. made explicit commitments to expand collaboration on cyberspace matters in the 2015 revision to the Guidelines for Japan-U.S. Defense Cooperation83. China’s cyber policy combines internally-focused measures to increase security of computer systems and ensure government access to key systems with externally-focused measures to share information with international partners. Chinese law84 calls for strengthened management over the internet and tough measures against online attacks, theft of secrets, and the spread of illegal or harmful information. A new cybersecurity law places additional requirements on network operators,
including government inspection of networks and security measures. The new law requires private companies to assist the government with decrypting information. Chinese law also mandates that core information technology, critical infrastructure and important systems and data must be "secure and controllable" to protect Chinese sovereignty over its cyberspace.CYBER INDEX China’s efforts to collaborate on cyber defense include an agreement85 with the U.S. on information-sharing related to cyberattacks, as well as a program of joint exercises to clarify cyberattack response procedures by the U.S. and Chinese governments. China participates with Japan and South Korea in a Trilateral Cyber Policy Consultation86 focusing on coordination of cyber strategies and policies, discussion of international norms and confidence-building measures in cyberspace, and possible areas of trilateral cooperation. India’s cybersecurity policy87 includes commitments to protect critical infrastructure, as well as to establish a corps of 500,000 cyber professionals by 2018. India’s bilateral cyber initiatives
include the U.S.-India Cyber Dialog88, which met in August 2015 and discussed cyber issues including cyber threats, enhanced cybersecurity information sharing, cyber incident management, and norms of state behavior in cyberspace. The dialog identified a variety of opportunities for increased collaboration on cybersecurity capacity-building. South Korea is doubling the size of its cyber command and is reported to have increased spending on cyber-related defense by 50 percent since 200989. Canada has undertaken to develop a joint U.S.-Canadian strategy for strengthening the security and resilience of the North American electricity grid against the growing threat from cyber-attacks and climate change impacts90. Poland has established a new Ministry of Digital Affairs to improve the overall government approach to cyber and related information issues, and to improve the financing of required investments in cyber capability91. France announced a comprehensive cyber strategy in October 2015, focusing on training, international cooperation and expanded investments in cyber defense capabilities92.
Global D
efense Outlook
Defense Posture Index
Five Emerging Fault Lines
Implications for D
efense Policymakers

Global Defense Outlook 2016 | Shifting Postures and Emerging Fault LinesGlobal Defense Outlook 2016 | Shifting Postures and Emerging Fault Lines
22 23
Widening Gap in Cyber-Vulnerability: The Global “Cyber Ten” While policy approaches to cyber security appear broadly similar, the Top 50 are not equally vulnerable to cyberattack. In fact, ten developed European and Asian economies (the “Cyber Ten”) appear disproportionately vulnerable to attacks against information systems, while other less-developed states in the Middle East and Africa (including Iran and Libya) appear much less vulnerable. The widening cyber-vulnerability gap may create incentives for the less-vulnerable countries to adopt a more aggressive or risk-prone posture in cyberspace. Vulnerability to cyberattack can be estimated and compared by examining how extensively each economy relies on internet-based interactions. Deloitte compiled historical data from the World Bank’s World Development Indicators93 to develop a Cyber Vulnerability Index using each nation’s rate of mobile cell subscribers, number of secure internet servers, fixed broadband subscribers and rate of internet use. While the index does not include key aspects of national vulnerability and risk, including (for example) the level of security and countermeasures in place, the number of military and government systems exposed to the internet, and many other potentially useful variables, the Index provides a straightforward, publicly-verifiable basis for rough comparison of changing national vulnerability over time. The Cyber Vulnerability Index assigns a value of 100 to the 2009 global average as the baseline for comparison (See Chart 9).
Ten economies -- the “Cyber Ten” -- appear to be most heavily dependent on internet-based interactions: South Korea, Netherlands, Switzerland, Denmark, Finland, Vietnam, UK, Sweden, Australia and Germany. As a group, the Cyber Ten are six times more vulnerable to cyberattack than the ten least vulnerable Top 50 countries. South Korea’s rapid move toward ubiquitous wireless access propelled it to the highest score for cyber risk in 2014.
The wide gap in vulnerability between the Cyber Ten and the other Top 50 economies may point toward an emerging defense challenge. For example, Libya (2014 Cyber Risk Score 45) and Iran (42) appear far less vulnerable to cyberattack than the Cyber Ten, and therefore these or other lower-vulnerability nations may choose to initiate or sponsor cyberattacks with relatively low risk. The lower-vulnerability nations may be prepared to behave more aggressively in cyberspace, because their potential adversaries are much more exposed to internet-based damage. Industrial control systems (not included in the Cyber Index) demonstrate how the advanced economies present much higher vulnerability than less-developed Top 50 countries. Industrial control systems include computers used to manage building and factory automation, commercial infrastructure and other key economic resources. While industrial control systems (ICS) are being widely adopted95, the ten most ICS-dependent countries present more than 40 times more internet-exposed ICS than the least-dependent countries per unit of economic output (See Chart 10).
The disproportionate vulnerability of the Cyber Top Targets to economic damage from cyberattacks is a product of economic development, and may decline over the long term as the other global economies increase their reliance on internet-based systems. In the near term, the vulnerability gap indicates that collaborative approaches may not be adequate to deter attacks against internet-based infrastructure. Cyber defense policies that rely on quid pro quo retaliation in cyberspace may work for the less-advanced economies, but the Top Targets are likely to require other policy approaches. Threatening disproportionate or unpredictable retaliation for cyberattacks, including responses outside cyberspace (for example, trade measures or other economic sanctions) may be essential elements of a rational cyber policy for the highly-vulnerable top targets.
Implications for Defense Policymakers: Managing Shocks Along the Fault Lines Although national defense postures are moderating worldwide, and the global defense budget is projected to stay relatively flat through 2020, emerging fault lines appear to be increasing risks of accidental conflict through miscalculation, errors in judgment, or unintended confrontation. This challenging outlook for the global defense environment invites national policymakers and international organizations to consider three broad guidelines related to policy choices about arms control measures, defense technical innovation and industrial policy.
Consider the potential contribution of arms control and confidence-building measures. Along all five of the emerging fault lines, increasingly capable and fast-acting military capabilities are interacting in close proximity, in environments characterized by weak or outdated rules and procedures governing these interactions. Top 50 defense budgets provide substantial military resources, but relatively less attention has been paid to shaping the channels for regular military-to-military and international diplomatic communications to manage conflict. The Asian and European fault lines, where conventional military and naval forces are being drawn into close proximity, and the nuclear fault line, present obvious opportunities for expanded international dialog and formal agreements. But there may be unrealized opportunities for similar approaches along the terrorism and cyber fault lines as well, as illustrated in recent efforts in Syria97 and between the United States and China on cyber matters98. The potential for negotiated agreements to manage routine interactions, limit escalation in crises, and contribute to
conflict resolution, appears increasingly valuable as forces become more capable, and increasingly workable as defense postures moderate.
Focus investment on productivity improvement rather than “innovation”. Defense ministries in the Balancer and Economizer nations have launched “innovation” initiatives to pursue advanced technologies, but this approach may not be well-aligned with emerging global defense postures. The U.S. Department of Defense announced that it will pursue a technological “third offset” (the first two were nuclear weapons and precision guidance) to “put the competitive advantage in the hands of American power projection”99. Australia announced a similar initiative to invest in strategic technologies with “the potential to deliver game-changing capabilities”100. But moderating defense postures and emerging fault lines suggest that the “innovation” approach may actually convey limited advantages and divert resources from more valuable investment opportunities. In an environment of relatively flat budgets, defense organizations might find more value in productivity improvement and human capital-related initiatives. For example, personnel incentives to raise the quality of recruits and improve retention of skilled specialists have emerged as key budget concerns for nations including the United States101, Japan102, and Germany103. If resources are limited, marginal investment may well prove to be more valuable when applied to basic productivity enhancements like recruiting and retention. All five fault lines appear to indicate that the marginal value of “innovative”
military technology is declining. In fact, the technical capabilities of forces confronting each other across all five fault lines appear to be converging, as precision guidance104, stealth, satellite navigation, and nuclear warheads are increasingly comparable. If the convergence trend continues, then it may be productivity, rather than novelty, that conveys actual military advantages.
Recognize the limited potential for defense export growth. Along with national defense postures and top-line budgets, procurement budgets are moderating, especially among the higher-income Balancer and Economizer nations105. Defense companies and governments are responding by promoting exports, but a mismatch may be growing between defense market supply and demand, limiting the potential for export growth. In 2014, the top ten defense exporting nations accounted for 88 percent of all international arms exports, and 61 percent of global defense procurement106. All ten have indicated that they intend to continue growing exports, and both Japan107 and India also signal that they intend to export defense equipment. But who will buy? Realistic demand projections must take into account the relatively small size and limited growth potential of new markets, and the reality of high barriers to entry created by incumbent weapons suppliers and their respective national governments. For defense ministries, the realities of the global export market suggest caution when sizing or budgeting acquisition programs if significant volumes are assumed to come from exports. Flat procurement markets at home will not necessarily be eased by finding new overseas markets for defense equipment.
Global D
efense Outlook
Defense Posture Index
Five Emerging Fault Lines
Implications for D
efense Policymakers

Global Defense Outlook 2016 | Shifting Postures and Emerging Fault Lines
25
Global Defense Outlook 2016 | Shifting Postures and Emerging Fault Lines
24
Authors Rieko Arashi [email protected] Rieko is a social scientist serving defense clients in Asia-Pacific. She worked as a research assistant at Harvard University and MIT and as a public sector consultant at Nomura Securities. She holds master’s degrees from the University of Chicago and Boston College, and a B.A. from Keio University.
Catherine Cloud [email protected] Catherine serves global defense clients on strategic planning matters. She joined Deloitte from the Center for a New American Security. Catherine holds an M.A. in Security Studies from Georgetown University and a B.A. in International Studies and French Language and Literature from the University of the Pacific.
Jack Midgley [email protected] Jack focuses on the challenges confronting Japan’s Ministry of Defense and defense industry. Jack served in Afghanistan as a civilian senior advisor to the Commander, International Security Assistance Forces (ISAF). He graduated from West Point, earned the M.P.P. at Harvard and Ph.D. in political science at MIT.
Joseph M. Moyer [email protected] Joe serves defense clients with policy analysis, strategy and large-scale change leadership. Joe deployed to Afghanistan as a Navy Judge Advocate, working on rule of law development and transition of detention operations. He graduated from Moravian College with a B.A., and earned his J.D. from Temple University.
Bobby Strauss [email protected] Bobby serves Fortune 500 and government defense clients on strategic planning, acquisition, and due diligence matters. Bobby holds an M.A. in international relations and economics from the Johns Hopkins School of Advanced International Studies (SAIS) and a B.A. in psychology from the University of Colorado at Boulder.
Endnotes 1. IHS Jane’s, “Jane’s Defense Budgets,” available at https://janes.ihs.com/
CustomPages/Janes/Home.aspx (accessed April 20, 2016); Deloitte Analysis.
2. International Monetary Fund, “World Economic Outlook October 2015,” “Gross Domestic Product, based on Purchasing-Power-Parity (PPP), valuation of country GDP” available at https://www.imf.org/ external/pubs/ft/weo/2015/02/weodata/index.aspx (accessed April 20, 2016); IHS Jane’s, “Jane’s Defense Budgets,” available at https://janes.ihs.com/CustomPages/Janes/Home.aspx (accessed April 20, 2016); Deloitte Analysis (nominal defense spending from Jane’s converted to values at PPP by multiplying defense spending (nominal) by the quotient of GDP at PPP and nominal GDP); World Bank, “World Bank Indicators,” “Defense Share of Labor Force, Defense Share of Gross Government Expenditures,” available at http://data.worldbank.org/indicator (accessed April 20, 2016); Uppsala University, “Battle Related Deaths Dataset,” “Battle Related Deaths, States Engaged in Armed Conflict,” available at http://www.pcr.uu.se/research/ucdp/datasets/ucdp_battle-related_deaths_dataset/?languageId=1 (accessed April 20, 2016); SIPRI, “Arms Transfers Database,” “Trend Indicator Values of Arms Exports,” available at http://www.sipri.org/databases/armstransfers/background (accessed April 20, 2016); SIPRI, “Nuclear forces,” available at http://www.sipri.org/research/armaments/nuclear-forces (accessed April 20, 2016). Deloitte analysis (assigned 1-5 point scale for each value, calculate raw score for each country, calculate top 50 country average, set as base 100, calculate index values for each country using base value).
3. Ibid.
4. Ibid.
5. Ibid.
6. IHS Jane’s, “Jane’s Defense Budgets,” available at https://janes.ihs.com/CustomPages/Janes/Home.aspx (accessed April 20, 2016); Deloitte Analysis.
7. Supra note 2.
8. IHS Jane’s, “Jane’s Defense Budgets,” available at https://janes.ihs.com/CustomPages/Janes/Home.aspx (accessed April 20, 2016); Deloitte Analysis.
9. Ibid.
10. International Monetary Fund, “World Economic Outlook October 2015,” “Gross Domestic Product, based on Purchasing-Power-Parity (PPP), valuation of country GDP” available at https://www.imf.org/ external/pubs/ft/weo/2015/02/weodata/index.aspx (accessed April 20, 2016); IHS Jane’s, “Jane’s Defense Budgets,” available at https://janes.ihs.com/CustomPages/Janes/Home.aspx (accessed April 20, 2016); Deloitte Analysis (nominal defense spending from Jane’s converted to values at PPP by multiplying defense spending (nominal) by the quotient of GDP at PPP and nominal GDP).
11. Reuters, "Western sanctions are hitting Russia harder than people realized," (August 3, 2015), available at http://www.businessinsider.com/russia-sanctions-harder-than-realized-2015-8 (accessed April 23, 2016) ; Carol J. Williams, "Russia's grand plan to modernize navy is tripped up by economy," (November 16, 2015), available at http://www.latimes.com/world/europe/la-fg-russia-navy-ambitions-20151116-story.html (accessed April 23, 2016).
12. House Armed Service Committee, “General Breedlove, House Armed Services Committee Transcript” (February 25, 2016), available at http://www.eucom.mil/doc/35166/general-breedlove-house-armed-services-committee-transcript (accessed April 26, 2016).
13. US Department of Defense, “Submitted Statement-House Appropriations Committee-Defense(FY 2017 Budget Request),”(February 25, 2016),available at http://www.defense.gov/News/Speeches/Speech-View/Article/744066/submitted-statement-senate-appropriations-committee-defense-fy-2017-budget-requ?source=GovDelivery (accessed April 20, 2016).
14. “US, Romania break ground on missile defense system,” RT (October 30, 2013), available at https://www.rt.com/news/us-romania-groundbreaking-abm-839/(accessed April 20, 2016).
15. IHS Jane’s, “Jane’s Defense Budgets,” available at https://janes.ihs.com/CustomPages/Janes/Home.aspx (accessed April 20, 2016); Deloitte Analysis.
16. Ibid.
17. “Russia plans to form three west-oriented army divisions in 2016 – defense minister,” TASS ( January 12, 2016), available at http://tass.ru/en/defense/848904(accessed April 20, 2016).
18. “Russia to respond to NATO Black Sea force by deploying new weapons – report,” RT ( January 19, 2016), available at https://www.rt.com/politics/329414-russia-to-respond-to-nato/ (accessed April 20, 2016).
19. “Russia plans to form three west-oriented army divisions in 2016 – defense minister,” TASS ( January 12, 2016), available at http://tass.ru/en/defense/848904(accessed April 20, 2016).
20. “Russia ‘completely ending’ activities under Conventional Armed Forces in Europe treaty,” RT (March 10, 2015), available at https://www.rt.com/news/239409-russia-quits-conventional-europe/ (accessed April 20, 2016).
21. “Diplomat: Deployment of US forces in Europe on rotation basis against Russia-NATO accords,” TASS (April 1, 2016), available at http://tass.ru/en/politics/866497(accessed April 20, 2016).
22. Robin Emmott, “Russia warns U.S. over naval incident as NATO tensions laid bare,” Reuters (April 21, 2016), available at http://www.reuters.com/article/us-russia-nato-envoy-idUSKCN0XH1O3 (accessed April 26, 2016).
23. U.S. Department of State, “Overview of Vienna Document 2011,” available at http://www.state.gov/t/avc/cca/c43837.htm (accessed April 26, 2016).
24. U.S. Department of State, “New START”, available at http://www.state.gov/t/avc/newstart/index.htm (accessed April 26, 2016).
25. Ambassador Wolfgang Ischinger, “Confidence Building Measures Are Now Needed More Than Ever,” European Leadership Network ( June 20, 2014), available at http://www.europeanleadershipnetwork.org/confidence-building-measures-are-now-needed-more-than-ever_1578.html (accessed April 20, 2016).
26. “China to project ‘substantial offensive power’ from Spratlys in months: US,” CNBC (March 10, 2016), available at http://www.cnbc.com/2016/03/10/china-able-to-project-substantial-offensive-power-from-spratlys-in-months-us.html(accessed April 20, 2016).
27. “U.S. Navy to send third patrol near Spratly Island,” TruNews (April 2, 2016), available at http://www.trunews.com/u-s-navy-to-send-third-patrol-through-south-china-sea/ (accessed April 20, 2016).
28. World Bank, “World Bank Development Indicators,” “Container Port Traffic (TEU: 20 foot equivalent units), available at http://data.worldbank.org/indicator/IS.SHP.GOOD.TU (accessed April 20, 2016); Deloitte Analysis. (“Port container traffic measures the flow of containers from land to sea transport modes, and vice versa, in twenty-foot equivalent units (TEUs), a standard-size container. Data refer to coastal shipping as well as international journeys. Transshipment traffic is counted as two lifts at the intermediate port (once to off-load and again as an outbound lift) and includes empty units.”).
29. Ibid.
30. Carlo Masala, Tim Tepel, and Konstantino Tsetsos, “Security Landscape in the Indian Ocean Region,” IndraStra (December 26, 2015), available at http://www.indrastra.com/2015/12/ThinkTank-Security-Landscape-in-IOR-0574.html (accessed April 20, 2016).
31. Tara Clarke, “Why Is the South China Sea Important?” Money Morning (December 23, 2015), available at http://moneymorning.com/2015/12/23/why-is-the-south-china-sea-important/ (accessed April 20, 2016).
32. Ministry of National Defense, the People’s Republic of China, “China’s Military Strategy” (May 2015), available at http://eng.mod.gov.cn/Database/WhitePapers/(accessed April 20, 2016).
33. Chinese Ministry of National Defense, “December Report from the Regular Meeting of the Ministry of National Defense,” (December 31, 2015), available at http://news.mod.gov.cn/headlines/2015-12/31/content_4634699_5.htm(accessed April 20, 2016)(translation by Deloitte staff).
34. Stuart Slade, “Chinese Construction Drives Submarine Revival,” Forecast International ( January 30, 2015), available at http://blog.forecastinternational.com/wordpress/chinese-construction-drives-submarine-revival/ (accessed April 20, 2016).
35. Greg Austin, “Why Beijing’s South China Sea Moves Make Sense Now,” People’s Daily Online ( January 1, 2016), available at http://en.people.cn/n3/2016/0101/c90000-8998154.html (accessed April 20, 2016).
36. IHS Jane’s, “Jane’s Defense Budgets,” available at https://janes.ihs.com/CustomPages/Janes/Home.aspx (accessed April 20, 2016); Deloitte Analysis.
37. Australian Government Department of Defense, “SEA1000 Australia’s Future Submarines,” available at http://sea1000.gov.au/ (accessed April 26, 2016).
38. Jason Pan, “Navy to run with domestic submarine program,” Taipei Times (April 2, 2015), available at http://www.taipeitimes.com/News/taiwan/archives/2015/04/02/2003614977 (accessed April 20, 2016).

Global Defense Outlook 2016 | Shifting Postures and Emerging Fault Lines
27
Global Defense Outlook 2016 | Shifting Postures and Emerging Fault Lines
26
39. Prashanth Parameswaran, “Indonesia to Buy New Submarines From Russia,” The Diplomat (September 25, 2015), available at http://thediplomat.com/2015/09/indonesia-to-buy-new-submarines-from-russia/ (accessed April 20, 2016).
40. "Japan receives seventh Soryu-class submarine," (March 7, 2016), available at http://navaltoday.com/2016/03/07/japan-receives-seventh-soryu-class-submarine (accessed April 23, 2016).
41. Prashanth Parameswaran, “South Korea Reveals New Attack Submarine,” The Diplomat (May 8, 2015), available at http://thediplomat.com/2015/05/south-korea-reveals-new-attack-submarine/ (accessed April 20, 2016).
42. Usman Ansari, “Pakistan, China Finalize 8-Sub Construction Plan,” DefenseNews (October 11, 2015), available at http://www.defensenews.com/story/defense/naval/submarines/2015/10/11/pakistan-china-finalize-8-sub-construction-plan/73634218/ (accessed April 20, 2016).
43. Manu Pubby, “With six new nuclear attack submarines, India officially opens up on its undersea aspirations,” The Economic Times ( July 15, 2015), available at http://economictimes.indiatimes.com/news/defence/with-six-new-nuclear-attack-submarines-india-officially-opens-up-on-its-undersea-aspirations/ articleshow/48076623.cms (accessed April 20, 2016).
44. Ibid.
45. See DoD, supra note 13.
46. David Martin Jones and M.L.R. Smith, “Can Asean ever solve the South China Seas dispute through multilateral dialogue?,” Daily Telegraph (November 24, 2015), available at http://www.telegraph.co.uk/news/worldnews/asia/china/12012915/Can-Asean-ever-solve-the-South-China-Seas-dispute-through-multilateral-dialogue.html (accessed April 20, 2016).
47. Christina Mendez, “India: Sea disputes must be resolved under UNCLOS,” The Philippine Star (February 17, 2016), available at http://www.philstar.com/headlines/2016/02/17/1553964/india-sea-disputes-must-be-resolved-under-unclos (accessed April 20, 2016).
48. “Philippines Presents Maritime Claims at the Hague,” Maritime Executive. com (November 24, 2015), available at http://www.maritime-executive.com/article/philippines-presents-maritime-claims-at-the-hague (accessed April 20, 2016); Owen Bowcott, “UN tribunal at The Hague to rule on rival claims to South China Sea islands,” The Guardian (November 23, 2015), available at http://www.theguardian.com/world/2015/nov/23/south-china-sea-dispute-hague-competing-claims (accessed April 20, 2016).
49. Fabian Hamacher, “On South China Sea islet, Taiwan argues Philippines case is far from watertight,” (March 23, 2016), available at http://www.businessinsider.com/r-on-south-china-sea-islet-taiwan-argues-philippines-case-is-far-from-watertight-2016-3 (accessed April 20, 2016).
50. “Malaysia seeks Australian support in South China Sea dispute,” The Guardian (March 15, 2016), available at http://www.theguardian.com/world/2016/mar/15/malaysia-seeks-australian-support-south-china-sea-dispute (accessed April 20, 2016).
51. “Spratly Islands: no agreement at ASEAN summit as Philippines flexes its muscles,” AsiaNews.it ( July 20, 2011), available at http://www.asianews.it/news-en/Spratly-Islands:-no-agreement-at-ASEAN-summit-as-Philippines-flexes-its-muscles-22147.html (accessed April 20, 2016).
52. Greg Torode, “Long way to joint Asean claim on Spratly Islands,” South China Morning Post ( January 1, 2013), available at http://www.scmp.com/comment/insight-opinion/article/1116765/long-way-joint-asean-claim-spratly-islands(accessed April 20, 2016).
53. “ASEAN scraps joint defense statement amid naval spat,” CNBC (November 4, 2015), available at http://www.cnbc.com/2015/11/04/no-asean-joint-defense-statement-as-us-china-fight-over-south-china-sea.html (accessed April 20, 2016).
54. United Nations, Oceans & Law of the Sea, “United Nations Convention on the Law of the Sea of 10 December 1982,” available at http://www.un.org/depts/los/convention_agreements/convention_overview_convention.htm (accessed April 20, 2016); Association of Southeast Asian Nations, ASEAN Member States, available at http://www.asean.org/asean/asean-member-states/ (accessed April 20, 2016); Association of Southeast Asian States, “Declaration on the Conduct of Parties in the South China Sea,” available at http://www.asean.org/?static_post=declaration-on-the-conduct-of-parties-in-the-south-china-sea-2 (accessed April 20, 2016).
55. University of Maryland, “University of Maryland Global Terrorism Database,” available at http://www.start.umd.edu/gtd/ (accessed April 20, 2016); Deloitte Analysis.
56. Ibid.
57. Ibid.
58. Senate Committee on Energy and Natural Resources, “The Role of Oil in ISIL Finances” (December 10, 2015), http://www.rand.org/content/dam/rand/pubs/testimonies/CT400/CT448/RAND_CT448.pdf (accessed April 26, 2016).
59. Erin Foster-Bowser and Angelia Sanders, “Security Threats in the Sahel and Beyond: AQIM, Boko Haram and al Shabaab,” Civil-Military Fusion Centre (April 2012), available at http://reliefweb.int/sites/reliefweb.int/files/resources/Full_Report_3818.pdf (accessed April 26, 2016).
60. Keith Crane, “The Role of Oil in ISIL Finances,” RAND Office of External Affairs (December 2015), available at http://www.rand.org/content/dam/rand/pubs/testimonies/CT400/CT448/RAND_CT448.pdf (accessed April 20, 2016).
61. University of Maryland, “University of Maryland Global Terrorism Database,” available at http://www.start.umd.edu/gtd (accessed April 20, 2016); Deloitte Analysis.
62. See University of Maryland, supra note 55.
63. “The Islamic State’s (ISIS, ISIL) Magazine,” Clarionproject.org (September 10, 2014), available at http://www.clarionproject.org/news/islamic-state-isis-isil-propaganda-magazine-dabiq# (accessed April 20, 2016).
64. Security Assessment in North Africa, “The Online Trade of Light Weapons in Libya,” (April 2016), available at http://www.smallarmssurvey.org/fileadmin/docs/R-SANA/SANA-Dispatch6-Online-trade.pdf (accessed April 20, 2016); C.J. Chivers, “Facebook Groups Act as Weapons Bazaars for Militias,” New York Times (April 6, 2016), available at http://www.nytimes.com/2016/04/07/world/middleeast/facebook-weapons-syria-libya-iraq.html?_r=0 (accessed April 20, 2016).
65. Robert Farley, "After China: The Proliferation of Cruise Missiles," ( July 3, 2014), available at http://thediplomat.com/2014/07/after-china-the-proliferation-of-cruise-missiles/ (accessed April 23, 2016) and Zachary Keck, "US General: North Korea Can Miniaturize Nuke Warheads," (October 24, 2014), available at http://thediplomat.com/2014/10/us-general-north-korea-can-miniaturize-nuke-warheads/ (accessed April 23, 2016) and David Eshel and David Fulghum (Israel, U.S. Agree to $450Million in F-35 EW Work (August 6, 2012), available at http://aviationweek.com/awin/israel-us-agree-450-million-f-35-ew-work (accessed April 23, 2016).
66. United Nations, United Nations Office for Disarmament Affairs, “Treaty on the Non-Proliferation of Nuclear Weapons (NPT),” available at http://www.un.org/disarmament/WMD/Nuclear/NPT.shtml (accessed April 20, 2016); Comprehensive Nuclear Test Ban Treaty, Status of Signature and Ratification, available at https://www.ctbto.org/the-treaty/status-of-signature-and-ratification/ (accessed April 20, 2016); United Nations, “International Convention for the Suppression of Acts of Nuclear Terrorism,” available at https://treaties.un.org/Pages/ViewDetailsIII.aspx?src=TREATY&mtdsg_no=XVIII-15&chapter=18&Temp=mtdsg3&lang=en(accessed April 20, 2016); United Nations, United Nations Office for Disarmament Affairs, “Treaty Banning Nuclear Weapon Tests in the Atmosphere, in Outer Space and Under Water,” available at http://disarmament.un.org/treaties/t/test_ban(accessed April 20, 2016); Nuclear Threat Initiative, “Treaty on the Prohibition of the Emplacement of Nuclear Weapons and Other Weapons of Mass Destruction on the Sea-Bed and the Ocean Floor and in the Subsoil Thereof,” available at http://www.nti.org/media/pdfs/aptseabd.pdf (accessed April 20, 2016).
67. Nuclear Threat Initiative, “India-Pakistan Non-Attack Agreement,” available at http://www.nti.org/learn/treaties-and-regimes/india-pakistan-non-attack-agreement/ (accessed April 20, 2016).
68. “If needed, we can use nuclear weapons: Pak Minister,” Times of India ( July 8, 2015), available at http://timesofindia.indiatimes.com/world/pakistan/If-needed-we-can-use-nuclear-weapons-Pak-minister/articleshow/47985022.cms (accessed April 20, 2016).
69. Ankit Panda, ”Pakistan Clarifies Conditions for Tactical Nuclear Weapon Use Against India,” The Diplomat (October 20, 2015), available at http://thediplomat.com/2015/10/pakistan-clarifies-conditions-for-tactical-nuclear-weapon-use-against-india/ (accessed April 20, 2016).
70. PTI, “Aziz says India top security concern; rules out reducing nuclear weapons,” (March 1, 2016), available at http://indianexpress.com/article/india/india-news-india/pakistan-sartaj-aziz-nuclear-weapons/ (accessed April 20, 2016).
71. “Pakistan Test-Fires Nuclear-Capable Missile,” DefenseNews (April 15, 2015), available at http://www.defensenews.com/story/defense/international/asia-pacific/2015/04/15/pakistan-test-fires-nuclear-capable-ballistic-missile/25848945/ (accessed April 20, 2016).
72. Samuel Osborne, “INS Arihant: India nears completion of nuclear submarine ‘Slayer of enemies’ – so what does it mean for the rest of the world?,” Independent (February 27, 2016), available at http://www.independent.co.uk/news/
world/asia/india-nears-completion-of-nuclear-submarine-named-slayer-of-enemies-a6899881.html (accessed April 20, 2016).
73. Nc Bipindra, “India Nears Completion of Nuclear Triad With Armed Submarine,” Bloomberg (February 25, 2016), available at http://www.bloomberg.com/news/articles/2016-02-25/india-said-to-near-inducting-its-first-nuclear-armed-submarine (accessed April 20, 2016).
74. Adrian Levy, “India Is Building a Top-Secret Nuclear City to Produce Thermonuclear Weapons, Experts Say,” Foreign Policy (December 16, 2015), available at http://foreignpolicy.com/2015/12/16/india_nuclear_city_top_secret_china_pakistan_barc/ (accessed April 20, 2016).
75. White House, “Press Conference by President Obama, 4/1/2016” (April 1, 2016), available at https://www.whitehouse.gov/the-press-office/2016/04/01/press-conference-president-obama-412016 (accessed April 20, 2016).
76. Vibhuti Agarwal, “Obama’s Nuclear Remarks Upset India,” Wall Street Journal (April 5, 2016), available at http://blogs.wsj.com/indiarealtime/2016/04/05/obamas-nuclear-remarks-upset-india/ (accessed April 20, 2016).
77. “North Korea tests solid-fueld rocket engine, says state media,” The Guardian (March 23, 2016), available at http://www.theguardian.com/world/2016/mar/24/north-korea-tests-solid-fuel-rocket-engine-says-state-media (accessed April 20, 2016).
78. “US welcomes China’s restrictions on trade with N. Korea,” The Korea Times (April 7, 2016), available at http://www.koreatimes.co.kr/www/news/nation/2016/04/485_202103.html (accessed April 20, 2016).
79. “UN treaty to protect nuclear materials from terrorists takes effect in May,” Deutsche Welle (April 8, 2016), available at http://www.dw.com/en/un-treaty-to-protect-nuclear-materials-from-terrorists-takes-effect-in-may/a-19175074(accessed April 20, 2016).
80. William J. Broad and David E. Sanger, “Race for Latest Class of Nuclear Arms Threatens to Revive Cold War,” New York Times (April 16, 2016), available at http://www.nytimes.com/2016/04/17/science/atom-bomb-nuclear-weapons-hgv-arms-race-russia-china.html (accessed April 20, 2016).
81. Ibid.
82. William J. Broad and David E. Sanger, “Race for Latest Class of Nuclear Arms Threatens to Revive Cold War,” New York Times (April 16, 2016), available at http://www.nytimes.com/2016/04/17/science/atom-bomb-nuclear-weapons-hgv-arms-race-russia-china.html (accessed April 20, 2016).
83. Japanese Ministry of Defense, “Joint Statement of the U.S.-Japan Cyber Defense Policy Working Group,” (May 30, 2015), available at http://www.mod.go.jp/j/press/news/2015/05/30a_1.pdf (accessed April 20, 2016).
84. China Law Translate, “Cybersecurity Law (Draft,” ( July 6, 2015), available at http://chinalawtranslate.com/cybersecuritydraft/?lang=en#_Toc424040668 (accessed April 20, 2016); “National Security Law,” ( July 1, 2015), available at http://chinalawtranslate.com/2015nsl/?lang=en (accessed April 20, 2016); NBC News, “China Passes Anti-Terror Law With Controversial Cyber Provisions,” (December 28, 2015), available at http://www.nbcnews.com/tech/tech-news/china-passes-anti-terror-law-controversial-cyber-provisions-n486756 (accessed April 20, 2016).
85. Katie Bo Williams, “US, China set guidelines for fighting cyber crime,” The Hill (December 3, 2015), available at http://thehill.com/policy/cybersecurity/261921-us-china-set-guidelines-for-fighting-cyber-crime (accessed April 20, 2016).
86. Korean Ministry of Foreign Affairs, “The 2nd Korea-Japan-China Cyber Consultation,” (October 15, 2015), available at https://www.mofa.go.kr/webmodule/htsboard/template/read/engreadboard.jsp?typeID=12&boardid=302&seqno=315774 (accessed April 20, 2016).
87. Indian Ministry of Communication and Information Technology, “Notification on National Cyber Security Policy,” available at http://deity.gov.in/sites/upload_files/dit/files/National%20Cyber%20Security%20Policy%20(1).pdf (accessed April 20, 2016).
88. White House, “Joint Statement: 2015 United States – India Cyber Dialogue” (August 14, 2015), available at https://www.whitehouse.gov/the-press-office/2015/08/14/joint-statement-2015-united-states-india-cyber-dialogue (accessed April 20, 2016).
89. “South Korea Enlists Cyber Warriors to Battle Kim Jong Eun’s Regime” Independent (November 29, 2015), available at http://www.independent.co.uk/news/world/asia/south-korea-enlists-cyber-warriors-to-battle-kim-jong-un-s-regime-a6753041.html (accessed April 20, 2016).
90. White House, “U.S.-Canada Joint Statement on Climate, Energy, and Arctic Leadership” (March 10, 2016), available at https://www.whitehouse.gov/the-
press-office/2016/03/10/us-canada-joint-statement-climate-energy-and-arctic-leadership (accessed April 20, 2016).
91. Jaroslaw Adamowski, “Poland’s Digital Ministry to overhaul national cyber-security policy amid Russian fears,” SC Magazine (February 24, 2016), available at http://www.scmagazine.com/polands-digital-ministry-to-overhaul-national-cyber-security-policy-amid-russian-fears/article/478806/ (accessed April 20, 2016).
92. Office of the French Prime Minister, “French National Digital Security Strategy,” available at http://www.ssi.gouv.fr/uploads/2015/10/strategie_nationale_securite_numerique_en.pdf (accessed April 20, 2016).
93. World Bank, “World Bank Development Indicators,” available at http://data.worldbank.org/indicator/all (accessed April 20, 2016); Deloitte Analysis. (Formula: Secure Internet Servers per 1,000,000 people, Fixed Broadcast Subscriptions per 100 people; Mobile Cell Subscriptions per 100 people, and Internet Users per 100 people for 2008 and 2014; 2008 global average set at 100) (data unavailable for Taiwan). International Monetary Fund, “World Economic Outlook October 2015,” “Gross Domestic Product, based on Purchasing-Power-Parity (PPP), valuation of country GDP” available at https://www.imf.org/ external/pubs/ft/weo/2015/02/weodata/index.aspx (accessed April 20, 2016). Deloitte Analysis (cyber index values from the World Bank converted to values at PPP by multiplying cyber index value (nominal) by the quotient of GDP at PPP and nominal GDP).
94. Ibid.
95. “Asian Market for Building Automation Expected to Exceed $1B by 2015,” IHS Technology (September 9, 2013), available at https://technology.ihs.com/488050/asian-market-for-building-automation-equipment-to-exceed-1-billion-by-2015(accessed April 20, 2016).
96. SHODAN Computer Search Engine, Census of exposed ICS IP and country identifiers, available at www.Shodan.io (accessed April 20, 2016); International Monetary Fund, “World Economic Outlook,” available at https://www.imf.org/external/pubs/ft/weo/2015/01/weodata/index.aspx (accessed April 20, 2016); Deloitte Analysis.
97. Toluse Olorunnipa, “Syrian Cease-Fire ‘Held Longer Than I Expected,’ Obama Says,” Bloomberg Politics (April 22, 2016), available at http://www.bloomberg.com/politics/articles/2016-04-22/syrian-cease-fire-held-longer-than-i-expected-obama-says (accessed April 26, 2016).
98. Warwick Ashford, “The US and China agree more steps to fight cyber crime,” Computer Weekly (December 3, 2015) available at http://www.computerweekly.com/news/4500259897/The-US-and-China-agree-more-steps-to-fight-cyber-crime (accessed April 26, 2016).
99. United States Department of Defense, “Memorandum on the Defense Innovation Initiative” (November 15, 2014) available at http://www.defense.gov/Portals/1/Documents/pubs/OSD013411-14.pdf (accessed April 26, 2016).
100. Australian Government Department of Defense, “2016 Defence Industry Policy Statement” (2016) available at http://www.defence.gov.au/whitepaper/Docs/2016-Defence-Industry-Policy-Statement.pdf (accessed April 26, 2016).
101. U.S. Department of Defense, “Remarks by Secretary Carter on the Force of the Future” (March 30, 2015), available at http://www.defense.gov/News/Speeches/Speech-View/Article/606658 (accessed April 26, 2016).
102. Martin Anderson, “Japan addresses military recruiting shortfall with cute mobile game” The Stack (March 26, 2016), available at https://thestack.com/world/2015/03/26/japan-addresses-military-recruiting-shortfall-with-cute-mobile-game/ (accessed April 26, 2016).
103. Alison Smale, “A Dwindling Army Tempts New Recruits With a Charm Offensive,” The New York Times ( July 27, 2014) available at http://www.nytimes.com/2014/07/28/world/europe/german-army-a-dwindling-army-tempts-new-recruits-with-a-charm-offensive.html (accessed April 26, 2016).
104. Katsuya Tsukamoto, “Proliferation of Precision-Guided Munitions and Its Impact on East Asia,” available at http://www.nids.go.jp/publication/kiyo/pdf/bulletin_j17_1_7.pdf (accessed April 26, 2016).
105. SIPRI, “Recent trends in arms transfers,” available at http://www.sipri.org/databases/armstransfers/background (accessed April 20, 2016); Deloitte Analysis.
106. IHS Jane’s, “Jane’s Defense Budgets,” available at https://janes.ihs.com/CustomPages/Janes/Home.aspx (accessed April 20, 2016); Deloitte Analysis.
107. Kyle Mizokami, “Japan’s Emerging Defense Export Industry,” United States Naval Institute (February 23, 2015) available at http://news.usni.org/2015/02/23/japans-emerging-defense-export-industry (accessed April 21, 2015).

About Deloitte Deloitte refers to one or more of Deloitte Touche Tohmatsu Limited, a UK private company limited by guarantee (“DTTL”), its network of member firms, and their related entities. DTTL and each of its member firms are legally separate and independent entities. DTTL (also referred to as “Deloitte Global”) does not provide services to clients. Please see www.deloitte.com/about for a detailed description of DTTL and its member firms. Please see www.deloitte.com/us/about for a detailed description of the legal structure of Deloitte LLP and its subsidiaries. Certain services may not be available to attest clients under the rules and regulations of public accounting.
This publication contains general information only and Deloitte is not, by means of this publication, rendering accounting, business, financial, investment, legal, tax, or other professional advice or services. This publication is not a substitute for such professional advice or services, nor should it be used as a basis for any decision or action that may affect your business. Before making any decision or taking any action that may affect your business, you should consult a qualified professional advisor. Deloitte shall not be responsible for any loss sustained by any person who relies on this publication.
Copyright © 2016 Deloitte Development LLC. All rights reserved.


