60
Global economic outlook Julian Callow, Head of Economic Research, Barclays Capital May 2008
| Date post: | 29-Dec-2015 |
| Category: |
Documents |
| Upload: | kenneth-holland |
| View: | 214 times |
| Download: | 0 times |
Global economic outlook
Julian Callow, Head of Economic Research, Barclays Capital
May 2008
2
Global economic themes
Global monetary policy has been loose, not tight.
Central banks have a vested interest in keeping global growth going. The balance sheets of financial as well as non-financial companies seem to be robust enough to mean that central bank policy can still prove effective in the US and Europe.
The US economy is projected to recover during 2008 as the impact of substantial Fed easing coincides with an ebbing of the drag from housing contraction, accompanied by the fiscal stimulus package.
Gradual re-balancing of domestic demand is unfolding, with net exports an important support for US growth.
Emerging economies have effectively decoupled from the “advanced” economies in recent years. However, growth in China and India is set to moderate as higher inflation requires tighter monetary policy.
Inflation will remain a major concern for financial markets.
3
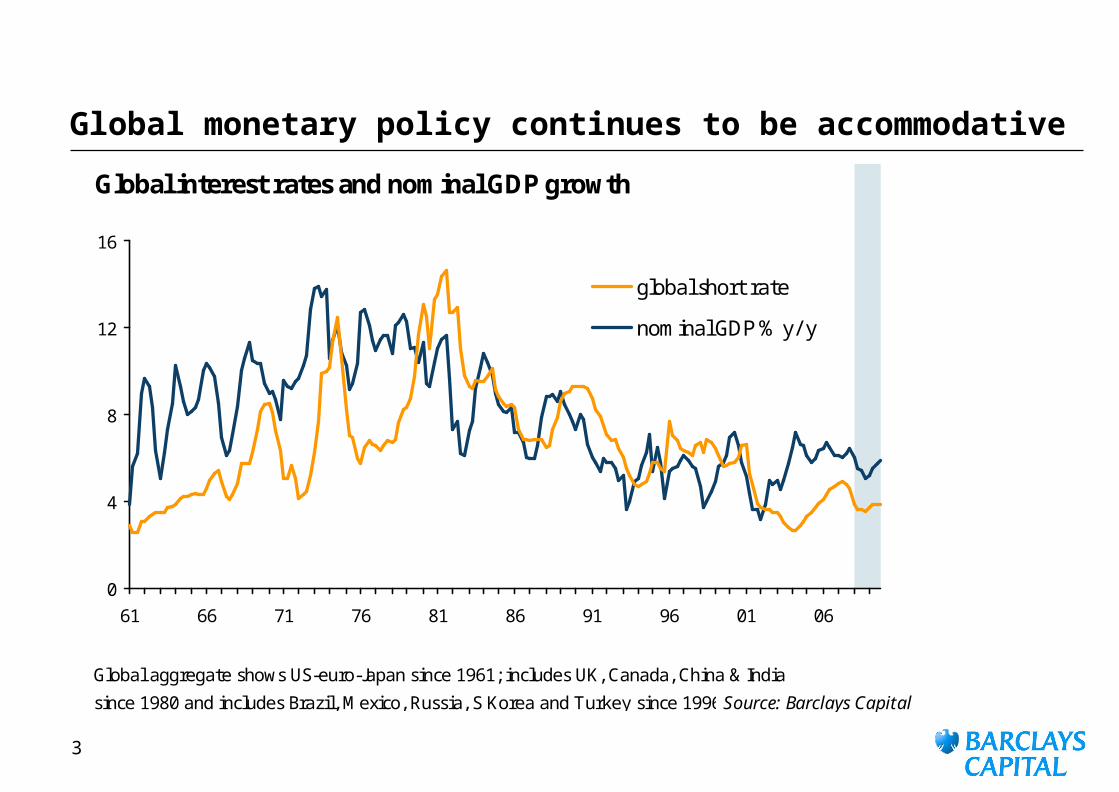
Global monetary policy continues to be accommodative
Global interest rates and nominal GDP growth
Global aggregate shows US-euro-Japan since 1961; includes UK, Canada, China & India
since 1980 and includes Brazil, Mexico, Russia, S Korea and Turkey since 1996Source: Barclays Capital
0
4
8
12
16
61 66 71 76 81 86 91 96 01 06
global short rate
nominal GDP % y/ y
4
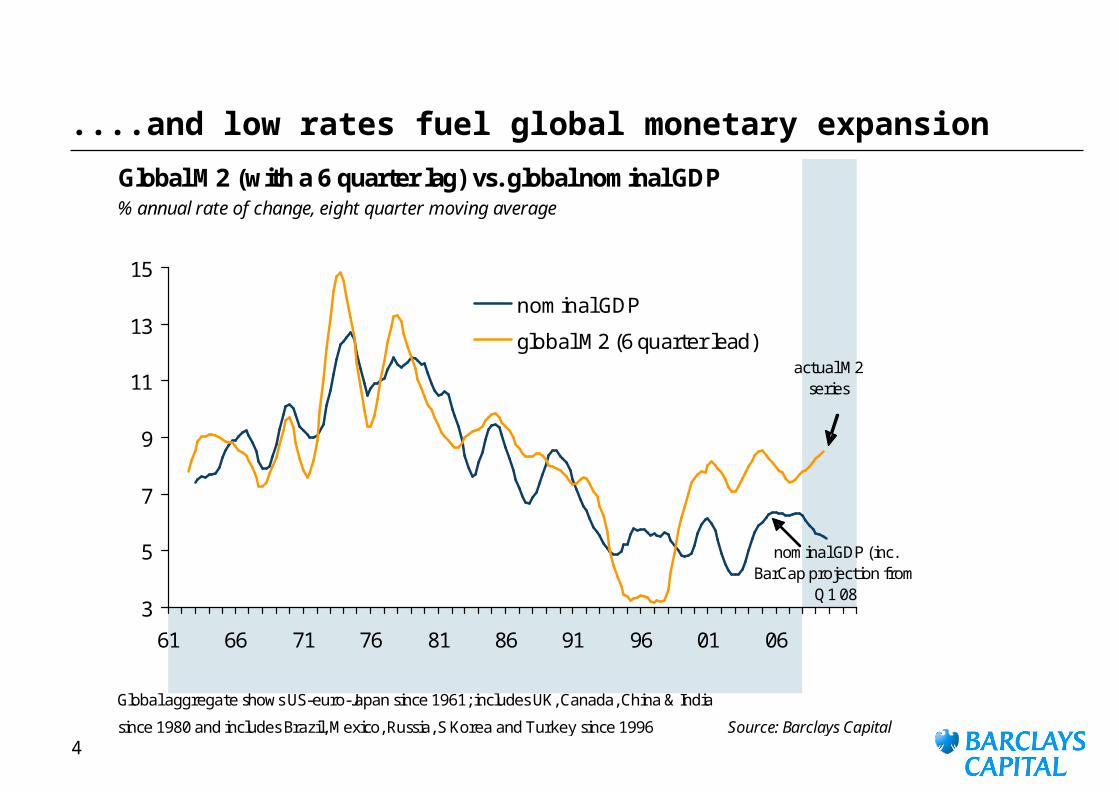
....and low rates fuel global monetary expansion
Global M2 (with a 6 quarter lag) vs. global nominal GDP% annual rate of change, eight quarter moving average
Global aggregate shows US-euro-Japan since 1961; includes UK, Canada, China & India
since 1980 and includes Brazil, Mexico, Russia, S Korea and Turkey since 1996 Source: Barclays Capital
3
5
7
9
11
13
15
61 66 71 76 81 86 91 96 01 06
nominal GDP
global M2 (6 quarter lead)actual M2
series
nominal GDP (inc. BarCap projection from
Q1 08
5
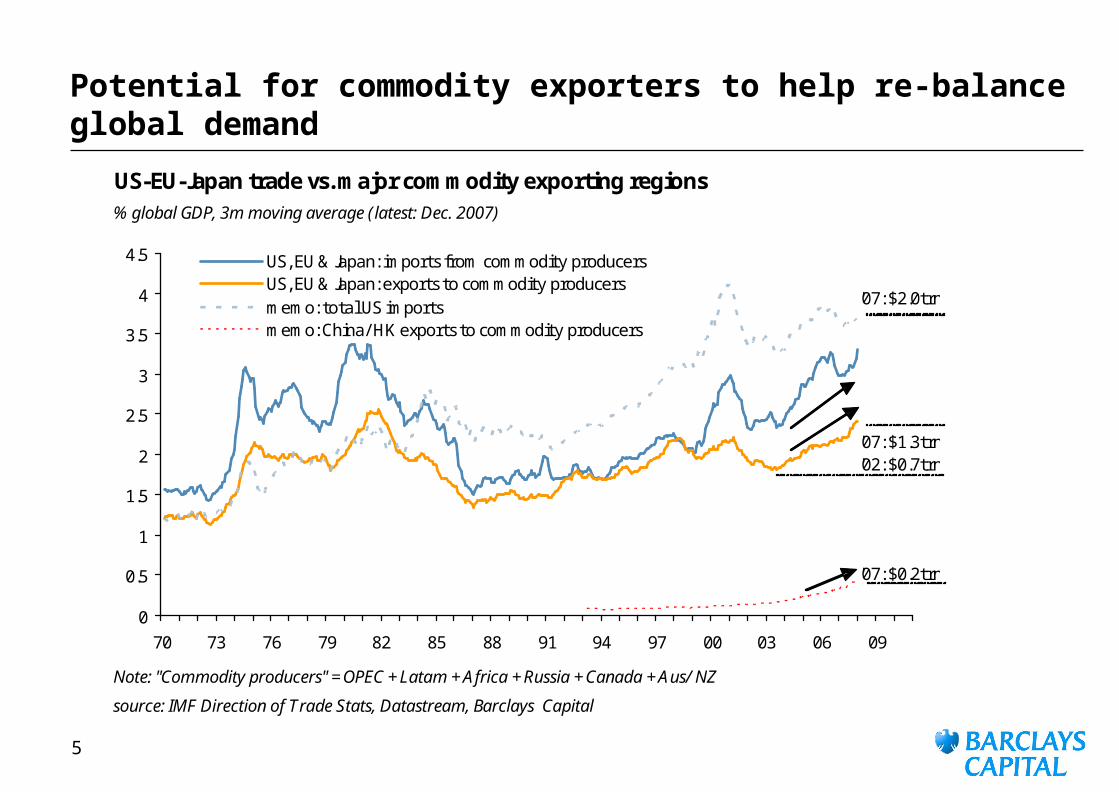
Potential for commodity exporters to help re-balance global demand
US-EU-Japan trade vs. major commodity exporting regions% global GDP, 3m moving average (latest: Dec. 2007)
Note: "Commodity producers" = OPEC + Latam + Africa + Russia + Canada + Aus/ NZ
source: IMF Direction of Trade Stats, Datastream, Barclays Capital
0
0.5
1
1.5
2
2.5
3
3.5
4
4.5
70 73 76 79 82 85 88 91 94 97 00 03 06 09
US, EU & Japan: imports from commodity producersUS, EU & Japan: exports to commodity producersmemo: total US importsmemo: China/ HK exports to commodity producers
'07: $1.3trn'02: $0.7trn
'07: $2.0trn
'07: $0.2trn
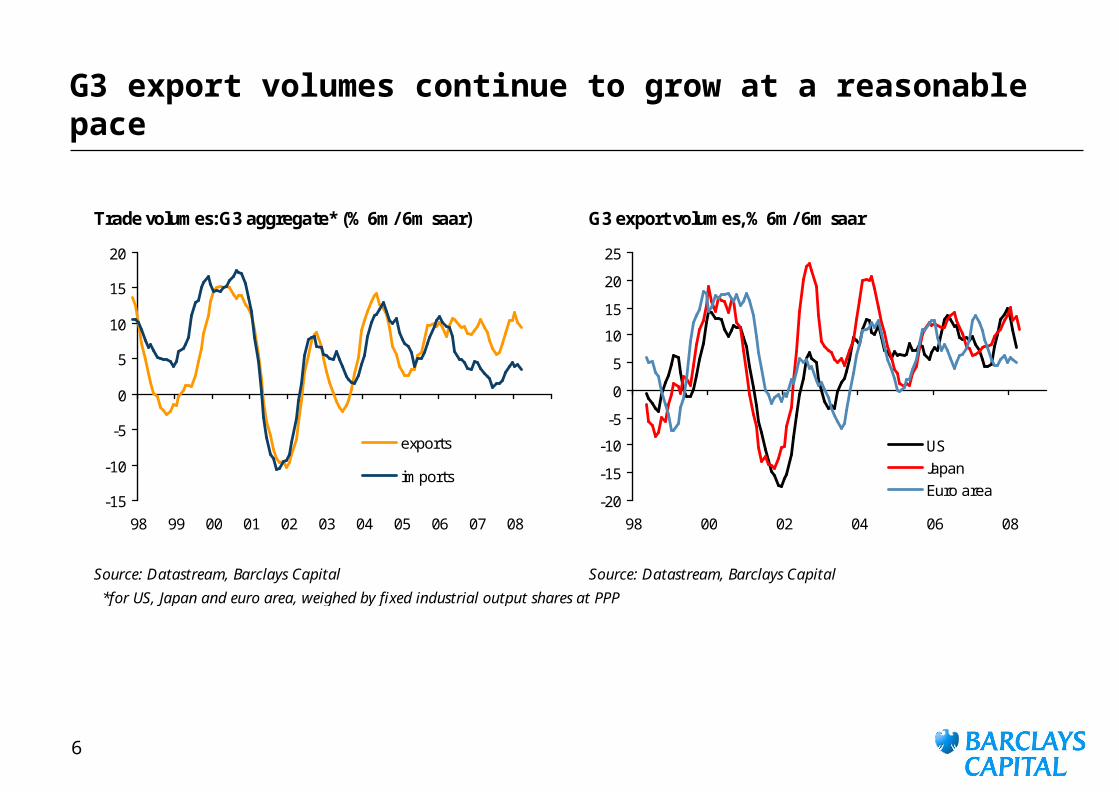
6
G3 export volumes continue to grow at a reasonable pace
Trade volumes: G3 aggregate* (% 6m/6m saar) G3 export volumes, % 6m/6m saar
Source: Datastream, Barclays Capital Source: Datastream, Barclays Capital
*for US, Japan and euro area, weighed by fixed industrial output shares at PPP
-15
-10
-5
0
5
10
15
20
98 99 00 01 02 03 04 05 06 07 08
exports
imports
-20
-15
-10
-5
0
5
10
15
20
25
98 00 02 04 06 08
USJapanEuro area
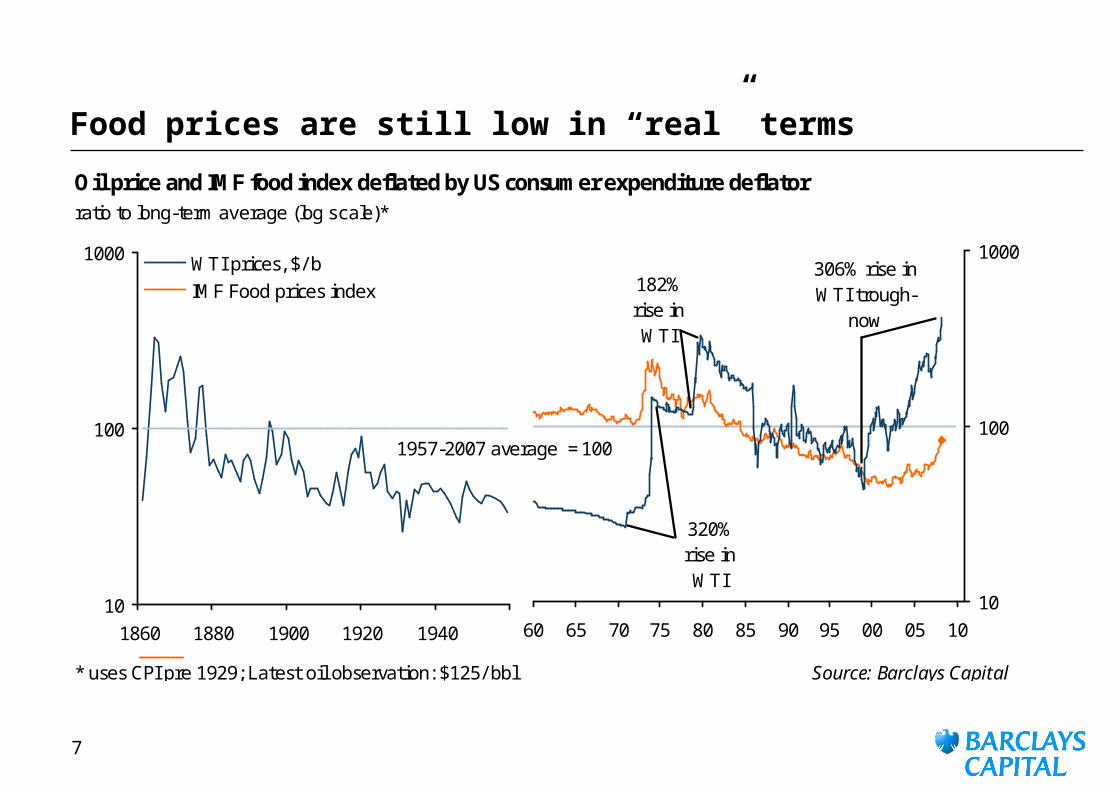
7
Food prices are still low in “real” terms
Oil price and IMF food index deflated by US consumer expenditure deflatorratio to long-term average (log scale)*
* uses CPI pre 1929; Latest oil observation: $125/ bbl Source: Barclays Capital
10
100
1000
1860 1880 1900 1920 1940
WTI prices, $/ bIMF Food prices index
60 65 70 75 80 85 90 95 00 05 1010
100
1000
182% rise in WTI
306% rise in WTI trough-
now
320% rise in WTI
1957-2007 average = 100
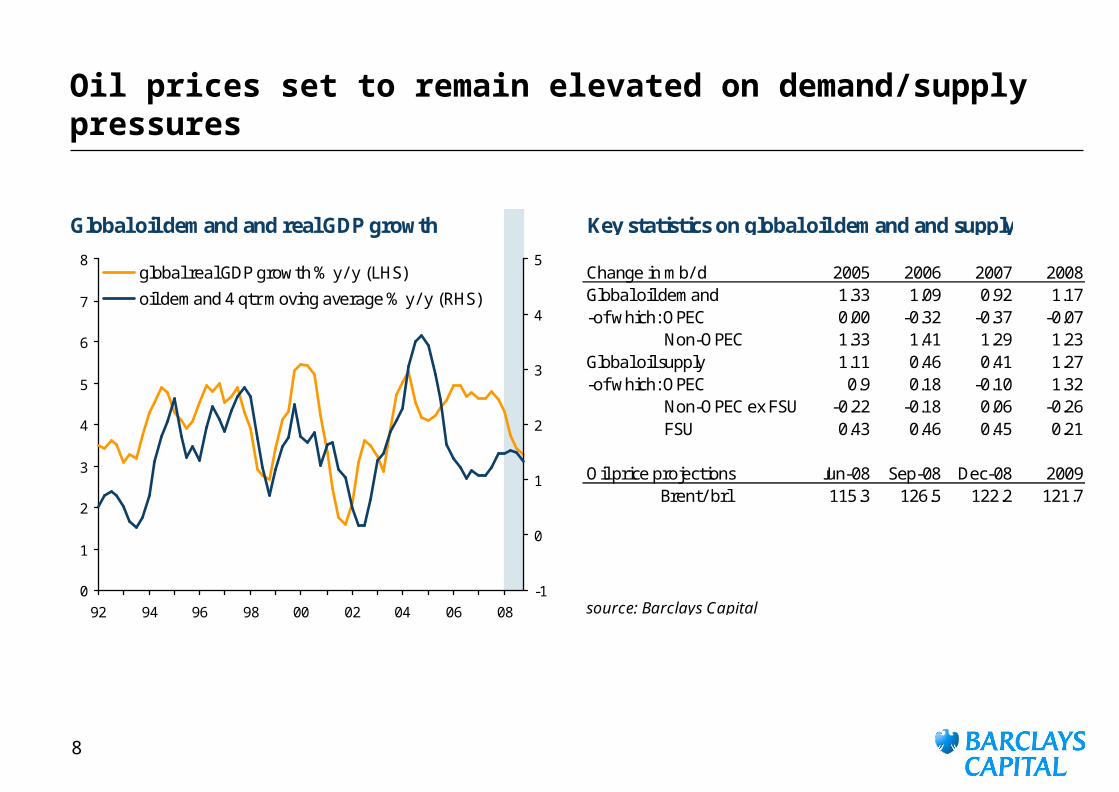
8
Oil prices set to remain elevated on demand/supply pressures
Global oil demand and real GDP growth Key statistics on global oil demand and supply
Change in mb/ d 2005 2006 2007 2008Global oil demand 1.33 1.09 0.92 1.17-of which: OPEC 0.00 -0.32 -0.37 -0.07
Non-OPEC 1.33 1.41 1.29 1.23Global oil supply 1.11 0.46 0.41 1.27-of which: OPEC 0.9 0.18 -0.10 1.32
Non-OPEC ex FSU -0.22 -0.18 0.06 -0.26 FSU 0.43 0.46 0.45 0.21
Oil price projections Jun-08 Sep-08 Dec-08 2009Brent/ brl 115.3 126.5 122.2 121.7
source: Barclays Capital0
1
2
3
4
5
6
7
8
92 94 96 98 00 02 04 06 08-1
0
1
2
3
4
5global real GDP growth % y/ y (LHS)
oil demand 4 qtr moving average % y/ y (RHS)
9
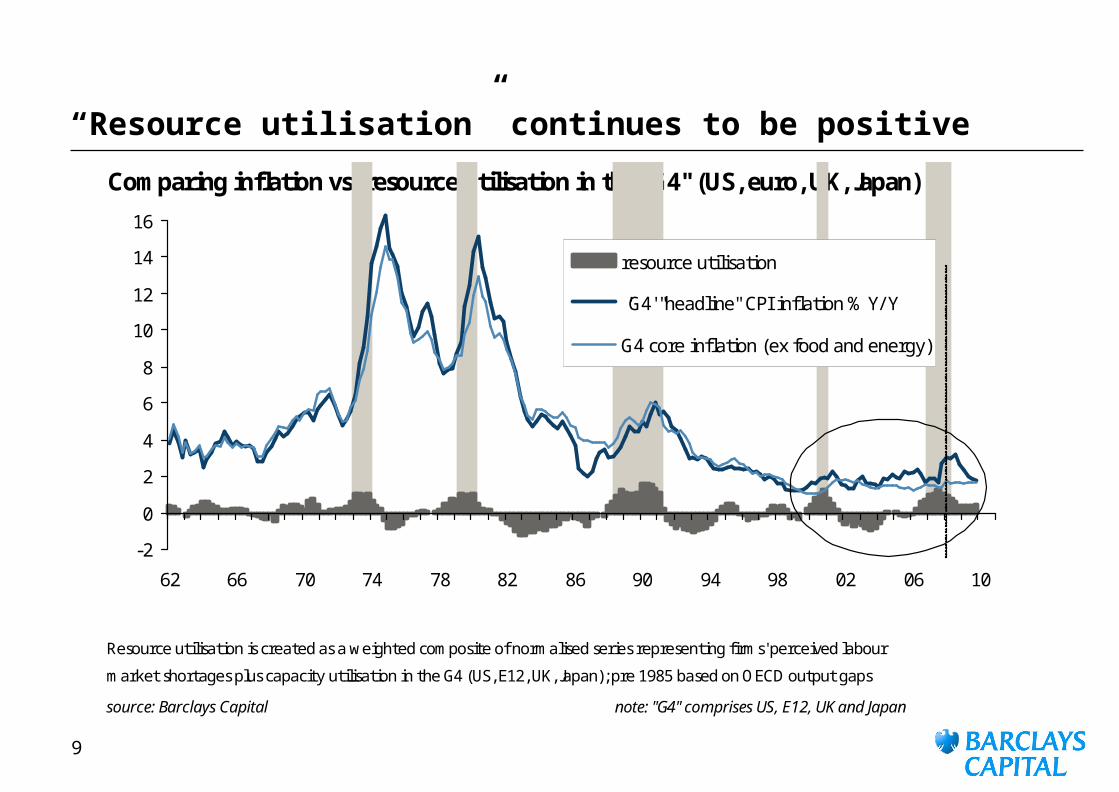
“Resource utilisation” continues to be positive
Comparing inflation vs. resource utilisation in the "G4" (US, euro, UK, Japan)
Resource utilisation is created as a weighted composite of normalised series representing firms' perceived labour
market shortages plus capacity utilisation in the G4 (US, E12, UK, Japan); pre 1985 based on OECD output gaps
source: Barclays Capital note: "G4" comprises US, E12, UK and Japan
-2
0
2
4
6
8
10
12
14
16
62 66 70 74 78 82 86 90 94 98 02 06 10
resource utilisation
'G4' "headline" CPI inflation % Y/ Y
G4 core inflation (ex food and energy)
10
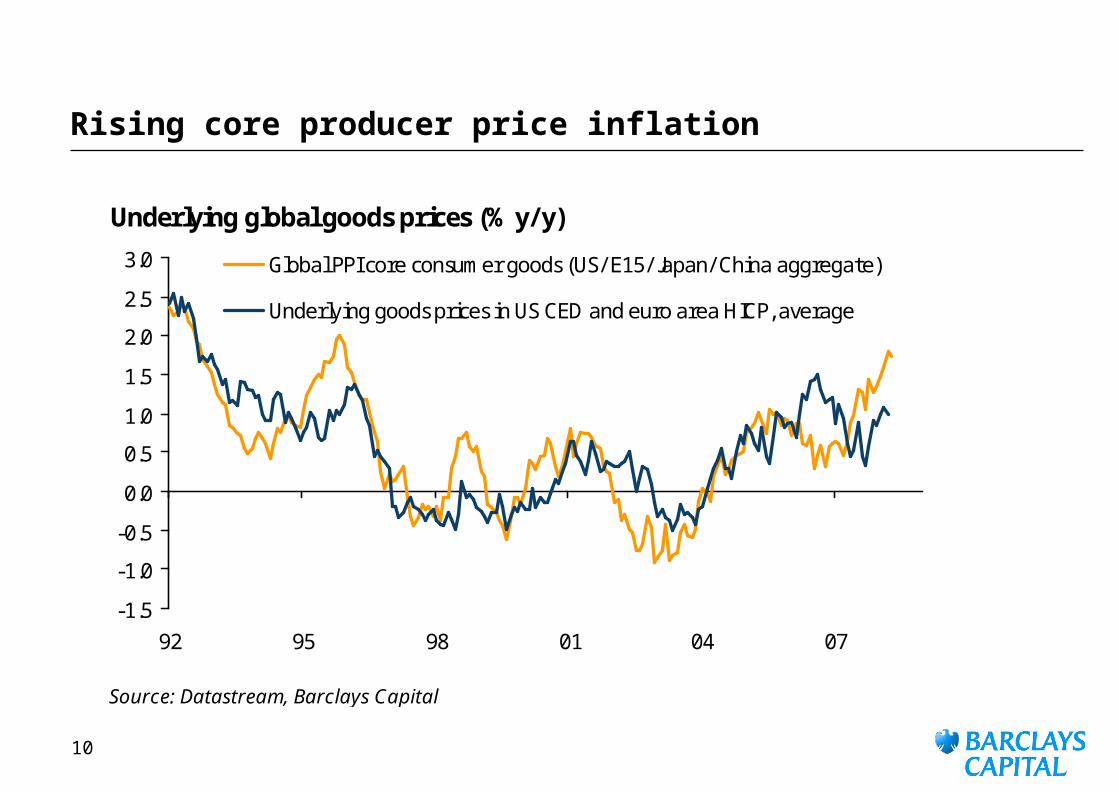
Rising core producer price inflation
Underlying global goods prices (% y/y)
Source: Datastream, Barclays Capital
-1.5
-1.0
-0.5
0.0
0.5
1.0
1.5
2.0
2.5
3.0
92 95 98 01 04 07
Global PPI core consumer goods (US/ E15/ Japan/ China aggregate)
Underlying goods prices in US CED and euro area HICP, average
11
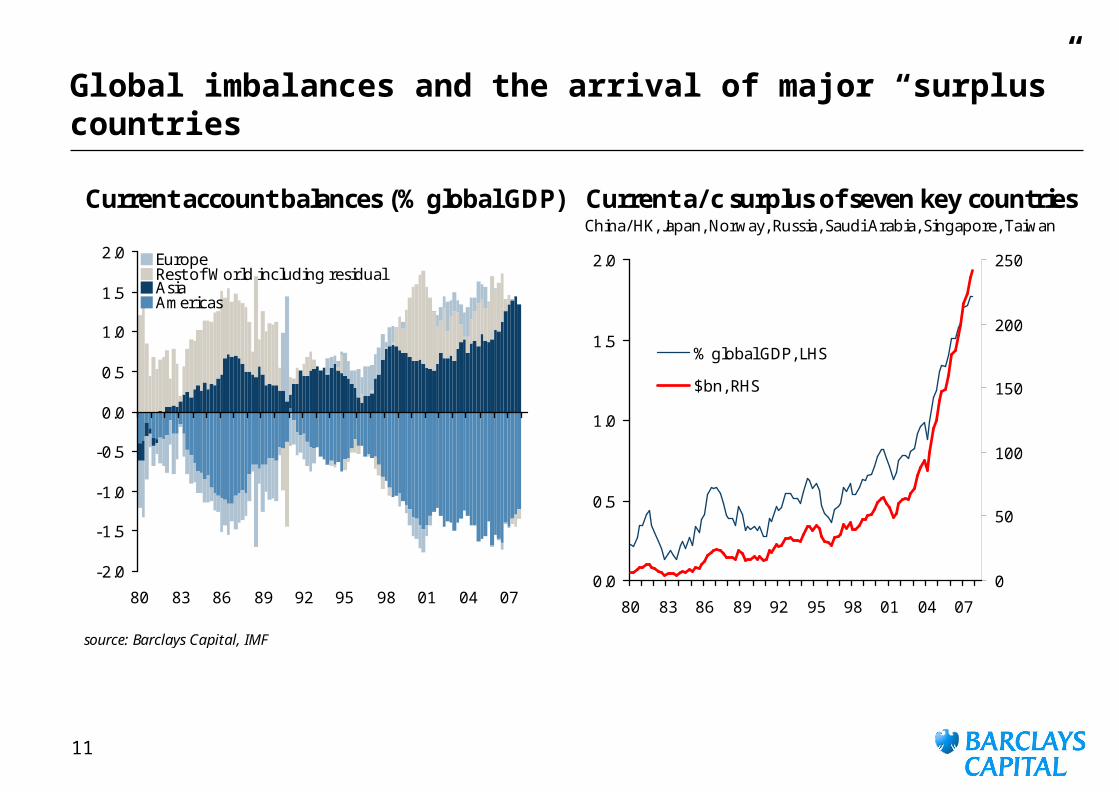
Global imbalances and the arrival of major “surplus” countries
Current account balances (% global GDP) Current a/c surplus of seven key countriesChina/ HK, Japan, Norway, Russia, Saudi Arabia, Singapore, Taiwan
source: Barclays Capital, IMF
-2.0
-1.5
-1.0
-0.5
0.0
0.5
1.0
1.5
2.0
80 83 86 89 92 95 98 01 04 07
EuropeRest of World including residualAsiaAmericas
0.0
0.5
1.0
1.5
2.0
80 83 86 89 92 95 98 01 04 07
0
50
100
150
200
250
% global GDP, LHS
$bn, RHS
12
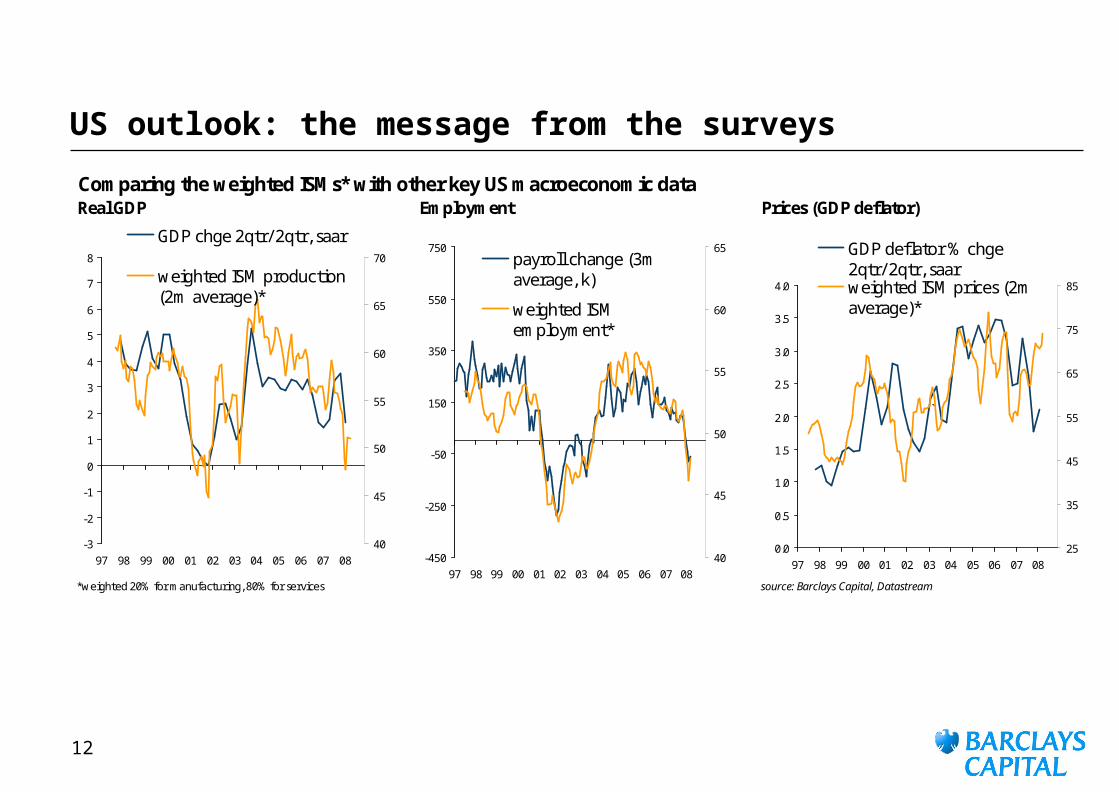
US outlook: the message from the surveys
Comparing the weighted ISMs* with other key US macroeconomic dataReal GDP Employment Prices (GDP deflator)
*weighted 20% for manufacturing, 80% for services source: Barclays Capital, Datastream
0.0
0.5
1.0
1.5
2.0
2.5
3.0
3.5
4.0
97 98 99 00 01 02 03 04 05 06 07 0825
35
45
55
65
75
85
GDP deflator % chge2qtr/ 2qtr, saarweighted ISM prices (2maverage)*
`
-450
-250
-50
150
350
550
750
97 98 99 00 01 02 03 04 05 06 07 0840
45
50
55
60
65payroll change (3maverage, k)
weighted ISMemployment*
-3
-2
-1
0
1
2
3
4
5
6
7
8
97 98 99 00 01 02 03 04 05 06 07 0840
45
50
55
60
65
70
GDP chge 2qtr/ 2qtr, saar
weighted ISM production(2m average)*
13
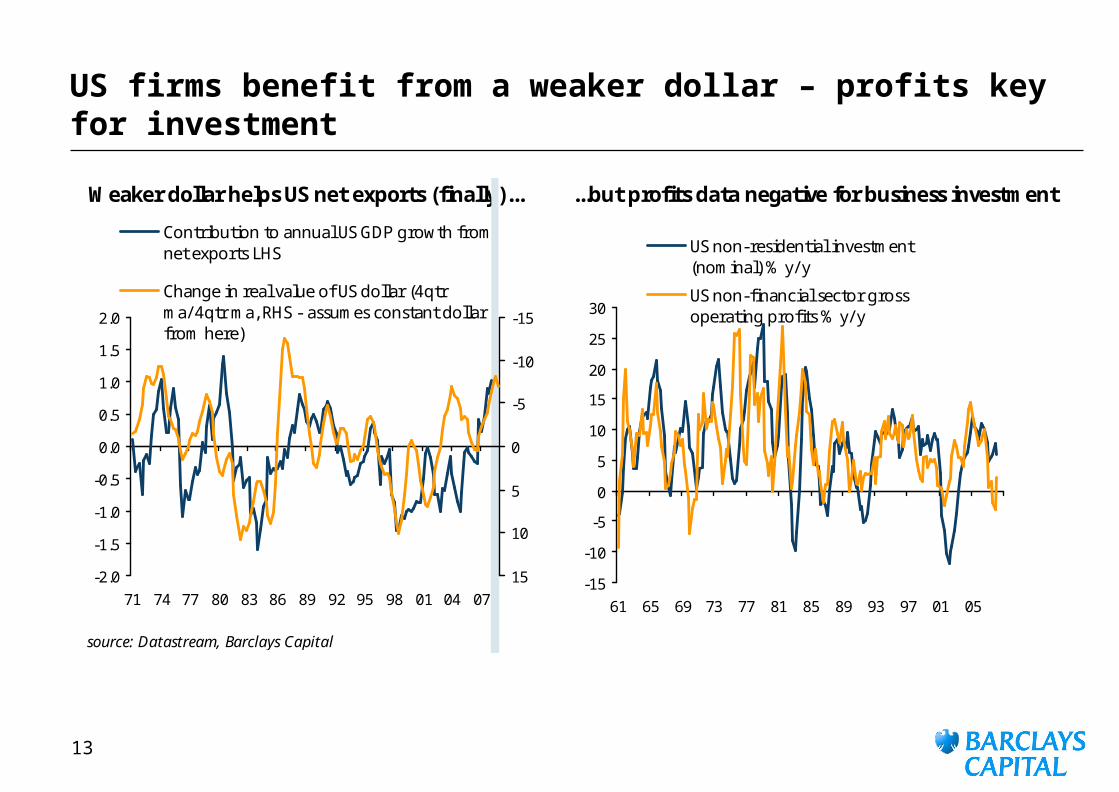
US firms benefit from a weaker dollar – profits key for investment
Weaker dollar helps US net exports (finally)... ...but profits data negative for business investment
source: Datastream, Barclays Capital
-2.0
-1.5
-1.0
-0.5
0.0
0.5
1.0
1.5
2.0
71 74 77 80 83 86 89 92 95 98 01 04 07
-15
-10
-5
0
5
10
15
Contribution to annual US GDP growth fromnet exports LHS
Change in real value of US dollar (4qtrma/ 4qtr ma, RHS - assumes constant dollarfrom here)
-15
-10
-5
0
5
10
15
20
25
30
61 65 69 73 77 81 85 89 93 97 01 05
US non-residential investment(nominal) % y/ y
US non-financial sector grossoperating profits % y/ y
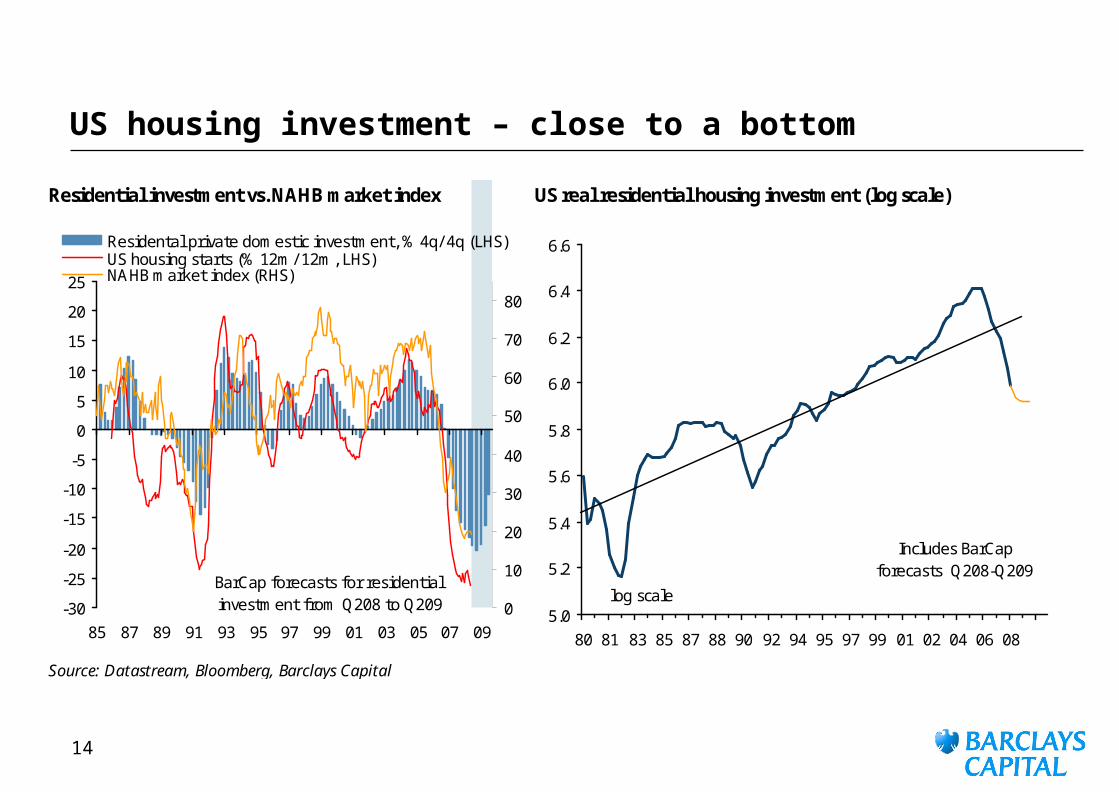
14
US housing investment – close to a bottom
Residential investment vs. NAHB market index US real residential housing investment (log scale)
Source: Datastream, Bloomberg, Barclays Capital
-30
-25
-20
-15
-10
-5
0
5
10
15
20
25
85 87 89 91 93 95 97 99 01 03 05 07 090
10
20
30
40
50
60
70
80
Residental private domestic investment, % 4q/ 4q (LHS)US housing starts (% 12m/ 12m, LHS)NAHB market index (RHS)
BarCap forecasts for residential investment from Q208 to Q209
5.0
5.2
5.4
5.6
5.8
6.0
6.2
6.4
6.6
80 81 83 85 87 88 90 92 94 95 97 99 01 02 04 06 08
Includes BarCapforecasts Q208-Q209
log scale
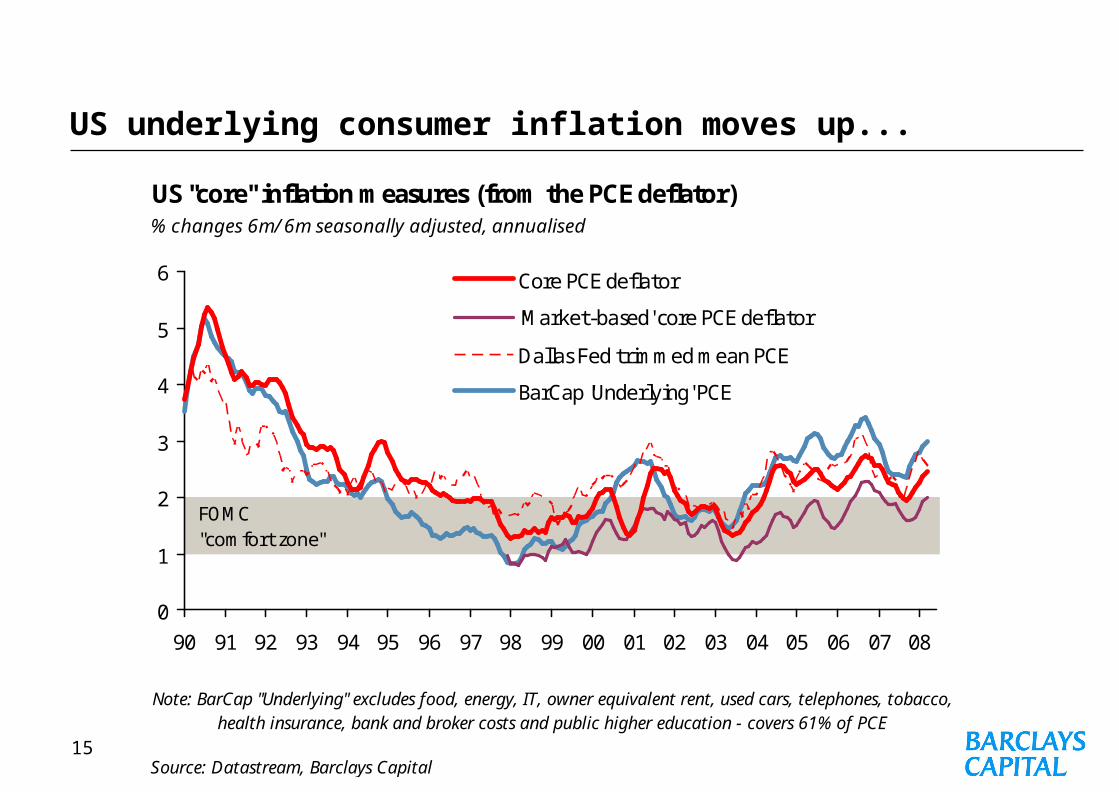
15
US underlying consumer inflation moves up...
US "core" inflation measures (from the PCE deflator)% changes 6m/ 6m seasonally adjusted, annualised
Source: Datastream, Barclays Capital
Note: BarCap "Underlying" excludes food, energy, IT, owner equivalent rent, used cars, telephones, tobacco, health insurance, bank and broker costs and public higher education - covers 61% of PCE
0
1
2
3
4
5
6
90 91 92 93 94 95 96 97 98 99 00 01 02 03 04 05 06 07 08
Core PCE deflator
'Market-based' core PCE deflator
Dallas Fed trimmed mean PCE
BarCap 'Underlying' PCE
FOMC "comfort zone"
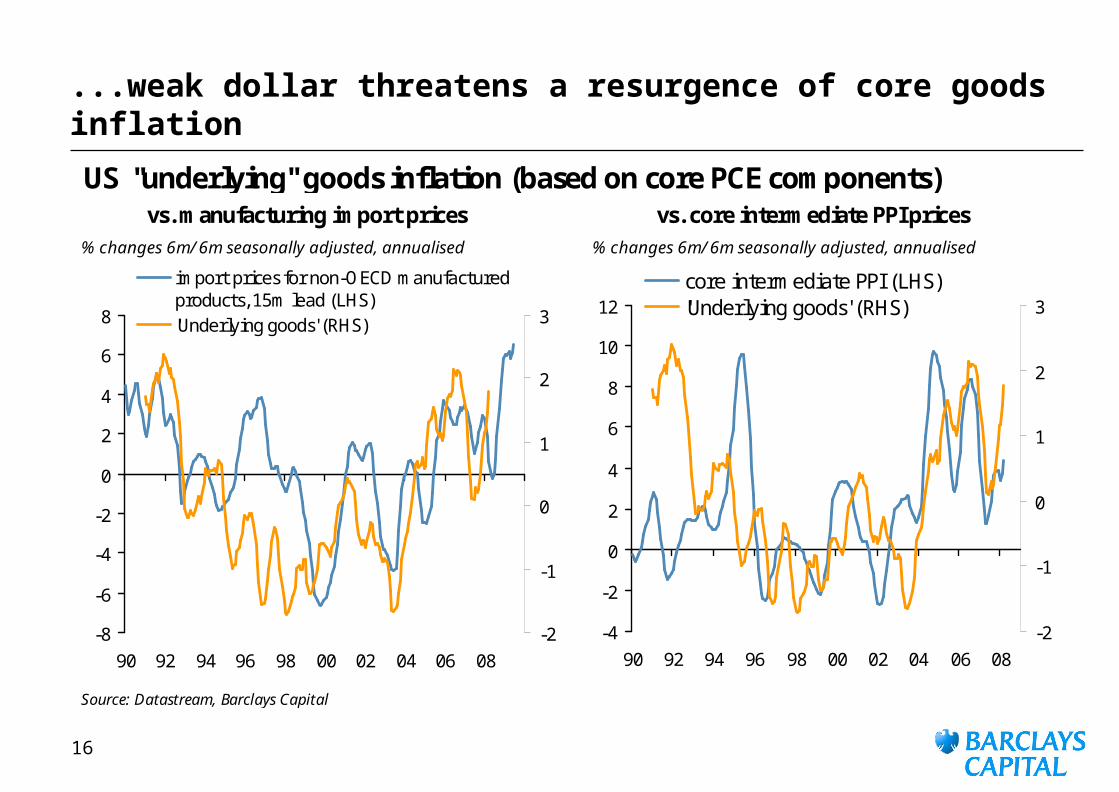
16
...weak dollar threatens a resurgence of core goods inflation
% changes 6m/ 6m seasonally adjusted, annualised % changes 6m/ 6m seasonally adjusted, annualised
Source: Datastream, Barclays Capital
vs. manufacturing import prices vs. core intermediate PPI prices
US "underlying" goods inflation (based on core PCE components)
-8
-6
-4
-2
0
2
4
6
8
90 92 94 96 98 00 02 04 06 08
-2
-1
0
1
2
3
import prices for non-OECD manufacturedproducts, 15m lead (LHS)'Underlying goods' (RHS)
-4
-2
0
2
4
6
8
10
12
90 92 94 96 98 00 02 04 06 08
-2
-1
0
1
2
3core intermediate PPI (LHS)'Underlying goods' (RHS)
17
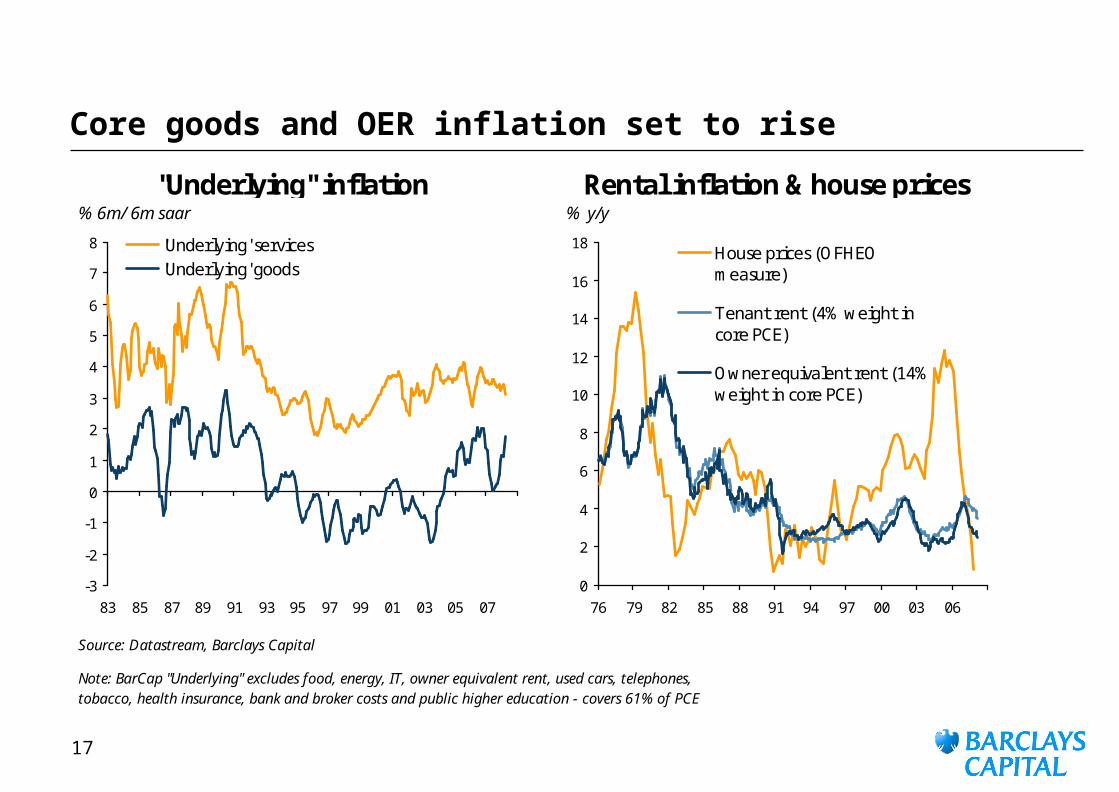
Core goods and OER inflation set to rise
% 6m/ 6m saar % y/y
Source: Datastream, Barclays Capital
Note: BarCap "Underlying" excludes food, energy, IT, owner equivalent rent, used cars, telephones, tobacco, health insurance, bank and broker costs and public higher education - covers 61% of PCE
"Underlying" inflation Rental inflation & house prices
0
2
4
6
8
10
12
14
16
18
76 79 82 85 88 91 94 97 00 03 06
House prices (OFHEOmeasure)
Tenant rent (4% weight incore PCE)
Owner equivalent rent (14%weight in core PCE)
-3
-2
-1
0
1
2
3
4
5
6
7
8
83 85 87 89 91 93 95 97 99 01 03 05 07
'Underlying' services'Underlying' goods
18
European economic themes
Two factors that underpinned strong euro area GDP growth in this recovery are fading – export dynamism and housing.
Hence we look for euro area GDP growth to slow to around 0.3% per quarter during Q4 07~Q2 08. Growth should be supported still by growth in employment, but even this is likely to moderate.
Inflation profile ugly for the ECB during 2008 – hence GDP growth/business confidence will need to be really soft for the ECB to lower rates: we do not expect rate cuts this year and next, though the risks are on the downside
19
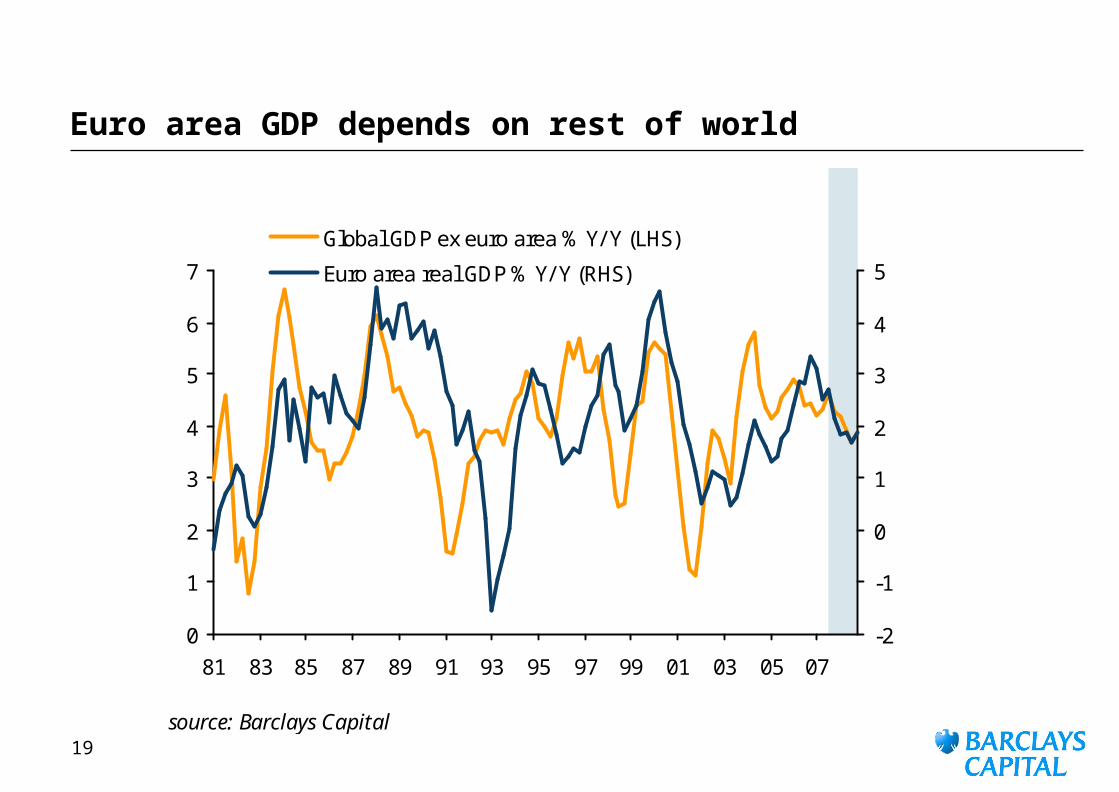
Euro area GDP depends on rest of world
source: Barclays Capital
0
1
2
3
4
5
6
7
81 83 85 87 89 91 93 95 97 99 01 03 05 07-2
-1
0
1
2
3
4
5
Global GDP ex euro area % Y/ Y (LHS)
Euro area real GDP % Y/ Y (RHS)
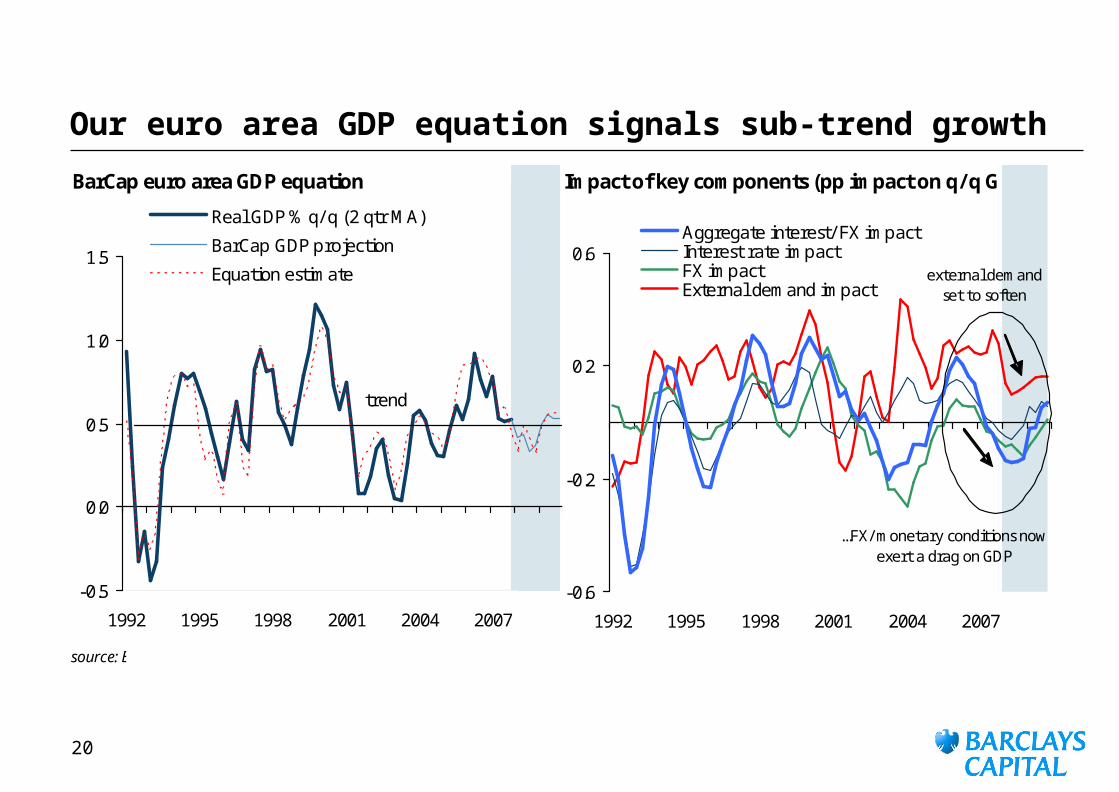
20
Our euro area GDP equation signals sub-trend growth
BarCap euro area GDP equation Impact of key components (pp impact on q/q GDP)
source: Barclays Capital
-0.5
0.0
0.5
1.0
1.5
1992 1995 1998 2001 2004 2007
Real GDP % q/ q (2 qtr MA)
BarCap GDP projection
Equation estimate
trend
-0.6
-0.2
0.2
0.6
1992 1995 1998 2001 2004 2007
Aggregate interest/ FX impactInterest rate impactFX impactExternal demand impact
external demand set to soften
...FX/ monetary conditions now exert a drag on GDP
21
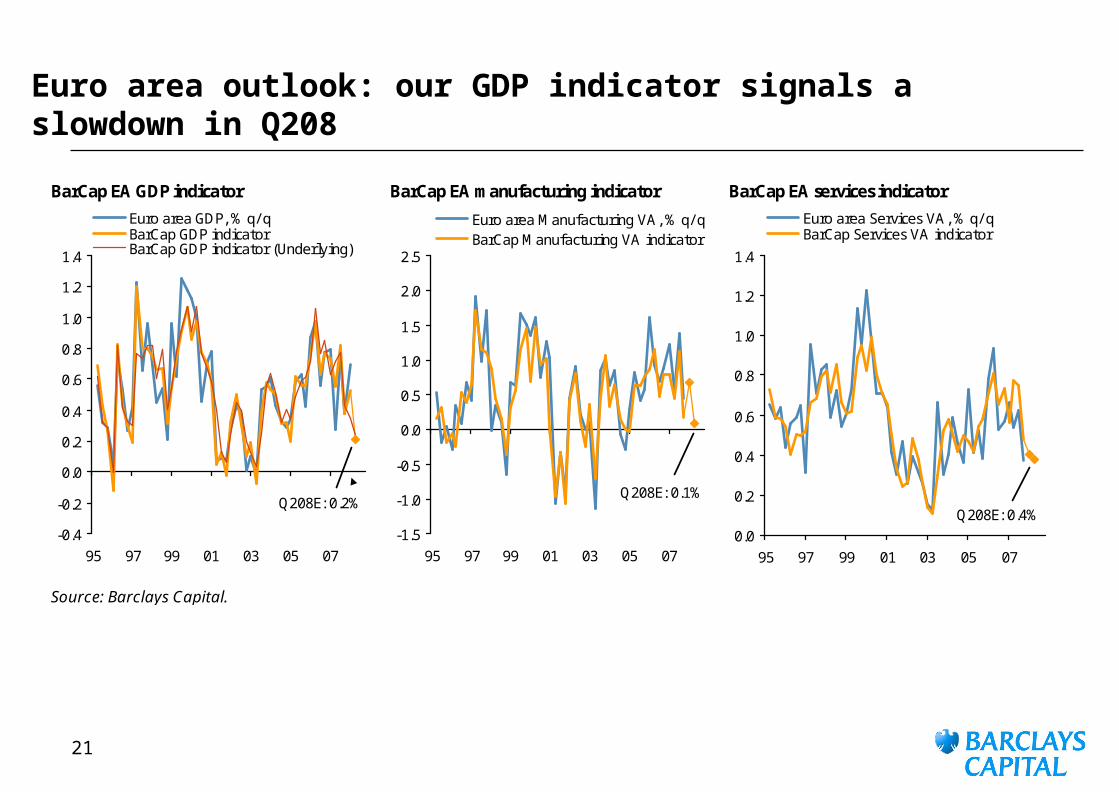
Euro area outlook: our GDP indicator signals a slowdown in Q208
BarCap EA GDP indicator BarCap EA manufacturing indicator BarCap EA services indicator
Source: Barclays Capital.
-0.4
-0.2
0.0
0.2
0.4
0.6
0.8
1.0
1.2
1.4
95 97 99 01 03 05 07
Euro area GDP, % q/ qBarCap GDP indicatorBarCap GDP indicator (Underlying)
Q208E: 0.2%
-1.5
-1.0
-0.5
0.0
0.5
1.0
1.5
2.0
2.5
95 97 99 01 03 05 07
Euro area Manufacturing VA, % q/ qBarCap Manufacturing VA indicator
Q208E: 0.1%
0.0
0.2
0.4
0.6
0.8
1.0
1.2
1.4
95 97 99 01 03 05 07
Euro area Services VA, % q/ qBarCap Services VA indicator
Q208E: 0.4%

22
Euro area economy at a glance
*"Composite PMI" is shown as a weighted aggregate of the manufacturing output balance, and the BarCap synthetic composite PMI.
Source: Ecowin, Datastream, Reuters, Barclays Capital
Real GDP Service sector
Manufacturing sector Construction sector
Euro area surveys vs GDP, GVA, manufacturing and construction
0.0
0.4
0.8
1.2
1.6
95 97 99 01 03 05 07
-2.5
-1.5
-0.5
0.5
1.5
2.5Private sector VA, % q/ q (LHS)Synthetic composite services PMI (RHS)EC survey service sector confidence (RHS)
normalised, 3mma
-4
-2
0
2
4
88 90 92 94 96 98 00 02 04 06 08
-4
-3
-2
-1
0
1
2
3Manufacturing production, % 3m/ 3m (LHS)EC industrial confidence (RHS)PMI output (RHS)PMI new orders - finished goods (RHS)
normalised, 3mma
0.0
0.2
0.4
0.6
0.8
1.0
1.2
1.4
98 00 02 04 06 08
-2.5
-1.5
-0.5
0.5
1.5
2.5
3.5Real GDP, % q/ q (LHS)
Composite PMI* (RHS)
normalised, 3mma
-10
-8
-6
-4
-2
0
2
4
6
8
97 99 01 03 05 07
-6
-5
-4
-3
-2
-1
0
1
2
3Construction sector VA, % y/ y (LHS)
EC construction sector confidence (RHS)
normalised, 3mma
23
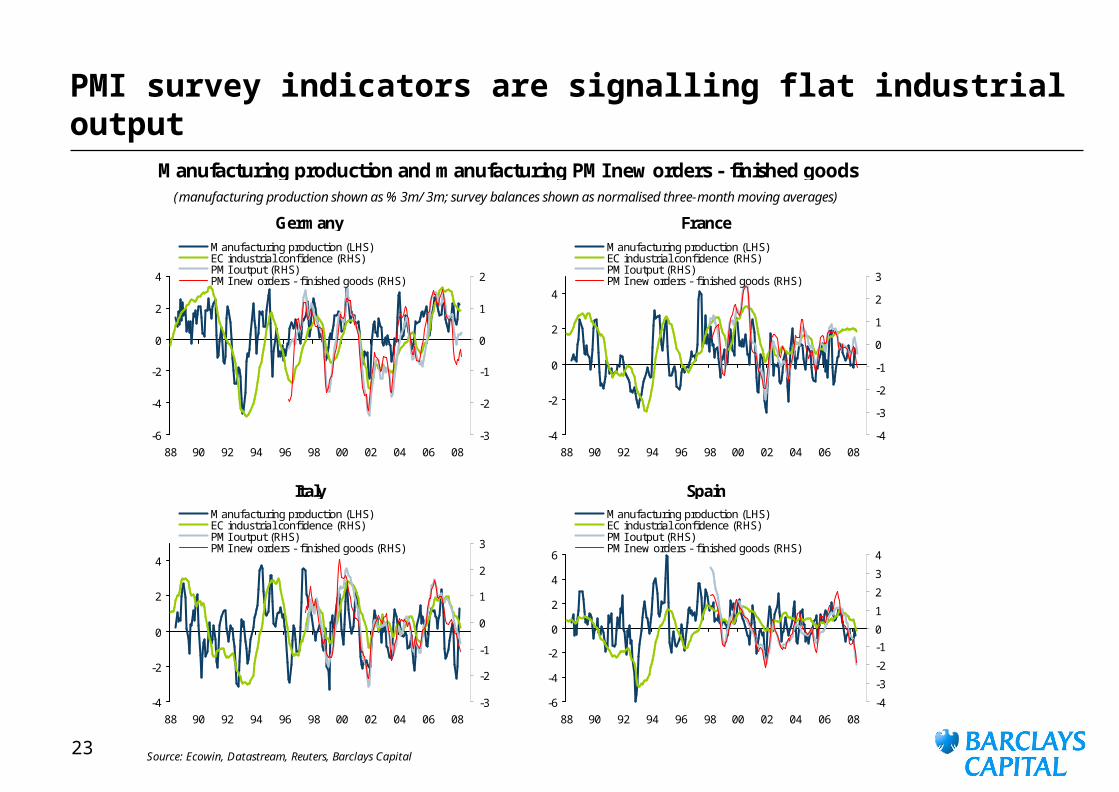
PMI survey indicators are signalling flat industrial output
Source: Ecowin, Datastream, Reuters, Barclays Capital
Italy Spain
Manufacturing production and manufacturing PMI new orders - finished goods (manufacturing production shown as % 3m/ 3m; survey balances shown as normalised three-month moving averages)
Germany France
-6
-4
-2
0
2
4
88 90 92 94 96 98 00 02 04 06 08
-3
-2
-1
0
1
2
Manufacturing production (LHS)EC industrial confidence (RHS)PMI output (RHS)PMI new orders - finished goods (RHS)
-4
-2
0
2
4
88 90 92 94 96 98 00 02 04 06 08
-4
-3
-2
-1
0
1
2
3
Manufacturing production (LHS)EC industrial confidence (RHS)PMI output (RHS)PMI new orders - finished goods (RHS)
-4
-2
0
2
4
88 90 92 94 96 98 00 02 04 06 08
-3
-2
-1
0
1
2
3
Manufacturing production (LHS)EC industrial confidence (RHS)PMI output (RHS)PMI new orders - finished goods (RHS)
-6
-4
-2
0
2
4
6
88 90 92 94 96 98 00 02 04 06 08
-4
-3
-2
-1
0
1
2
3
4
Manufacturing production (LHS)EC industrial confidence (RHS)PMI output (RHS)PMI new orders - finished goods (RHS)
24
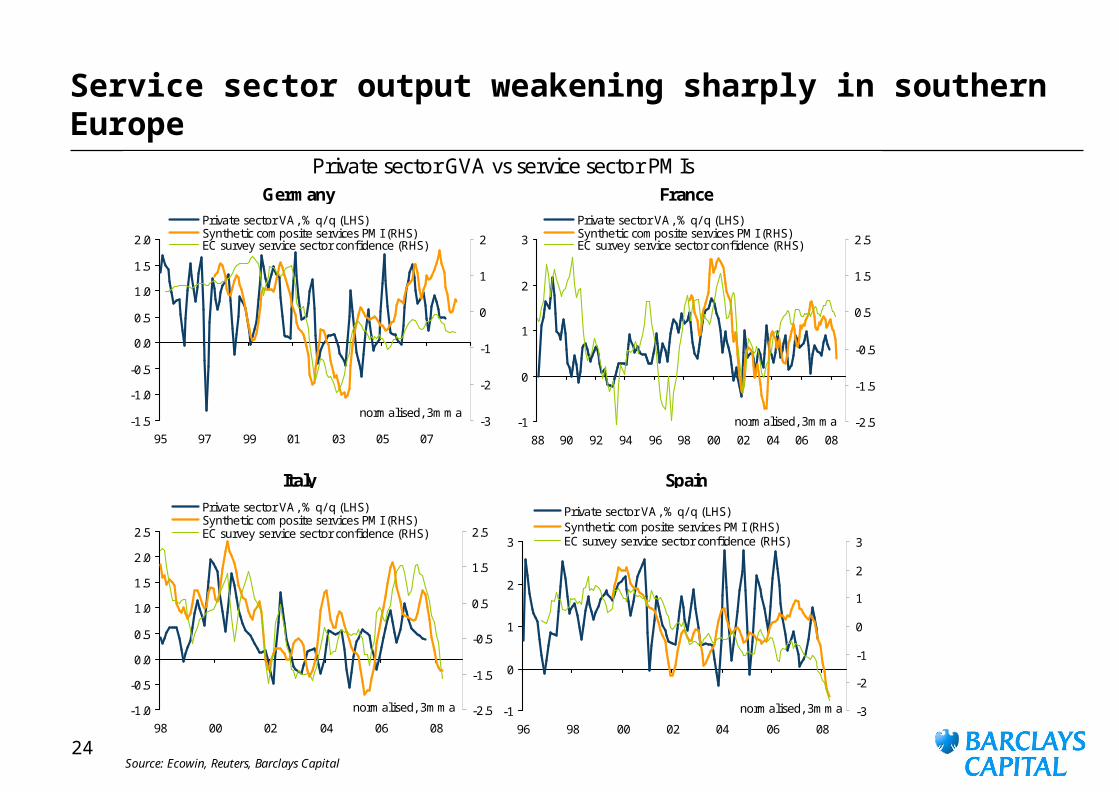
Service sector output weakening sharply in southern Europe
Source: Ecowin, Reuters, Barclays Capital
Private sector GVA vs service sector PMIsGermany France
Italy Spain
-1.5
-1.0
-0.5
0.0
0.5
1.0
1.5
2.0
95 97 99 01 03 05 07
-3
-2
-1
0
1
2
Private sector VA, % q/ q (LHS)Synthetic composite services PMI (RHS)EC survey service sector confidence (RHS)
normalised, 3mma-1
0
1
2
3
88 90 92 94 96 98 00 02 04 06 08-2.5
-1.5
-0.5
0.5
1.5
2.5
Private sector VA, % q/ q (LHS)Synthetic composite services PMI (RHS)EC survey service sector confidence (RHS)
normalised, 3mma
-1.0
-0.5
0.0
0.5
1.0
1.5
2.0
2.5
98 00 02 04 06 08-2.5
-1.5
-0.5
0.5
1.5
2.5
Private sector VA, % q/ q (LHS)Synthetic composite services PMI (RHS)EC survey service sector confidence (RHS)
normalised, 3mma -1
0
1
2
3
96 98 00 02 04 06 08-3
-2
-1
0
1
2
3
Private sector VA, % q/ q (LHS)Synthetic composite services PMI (RHS)EC survey service sector confidence (RHS)
normalised, 3mma
25
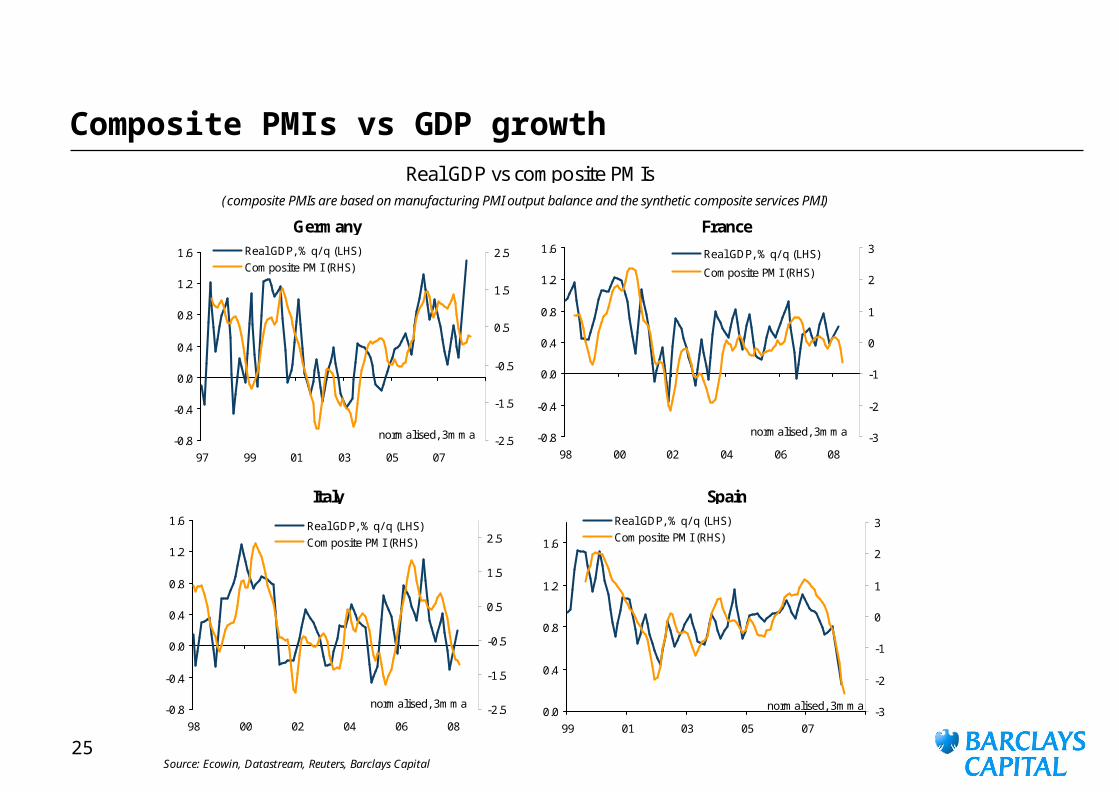
Composite PMIs vs GDP growth
Source: Ecowin, Datastream, Reuters, Barclays Capital
Real GDP vs composite PMIs(composite PMIs are based on manufacturing PMI output balance and the synthetic composite services PMI)
Germany France
Italy Spain
-0.8
-0.4
0.0
0.4
0.8
1.2
1.6
97 99 01 03 05 07-2.5
-1.5
-0.5
0.5
1.5
2.5Real GDP, % q/ q (LHS)Composite PMI (RHS)
normalised, 3mma -0.8
-0.4
0.0
0.4
0.8
1.2
1.6
98 00 02 04 06 08-3
-2
-1
0
1
2
3Real GDP, % q/ q (LHS)
Composite PMI (RHS)
normalised, 3mma
-0.8
-0.4
0.0
0.4
0.8
1.2
1.6
98 00 02 04 06 08-2.5
-1.5
-0.5
0.5
1.5
2.5Real GDP, % q/ q (LHS)Composite PMI (RHS)
normalised, 3mma0.0
0.4
0.8
1.2
1.6
99 01 03 05 07-3
-2
-1
0
1
2
3Real GDP, % q/ q (LHS)
Composite PMI (RHS)
normalised, 3mma
26
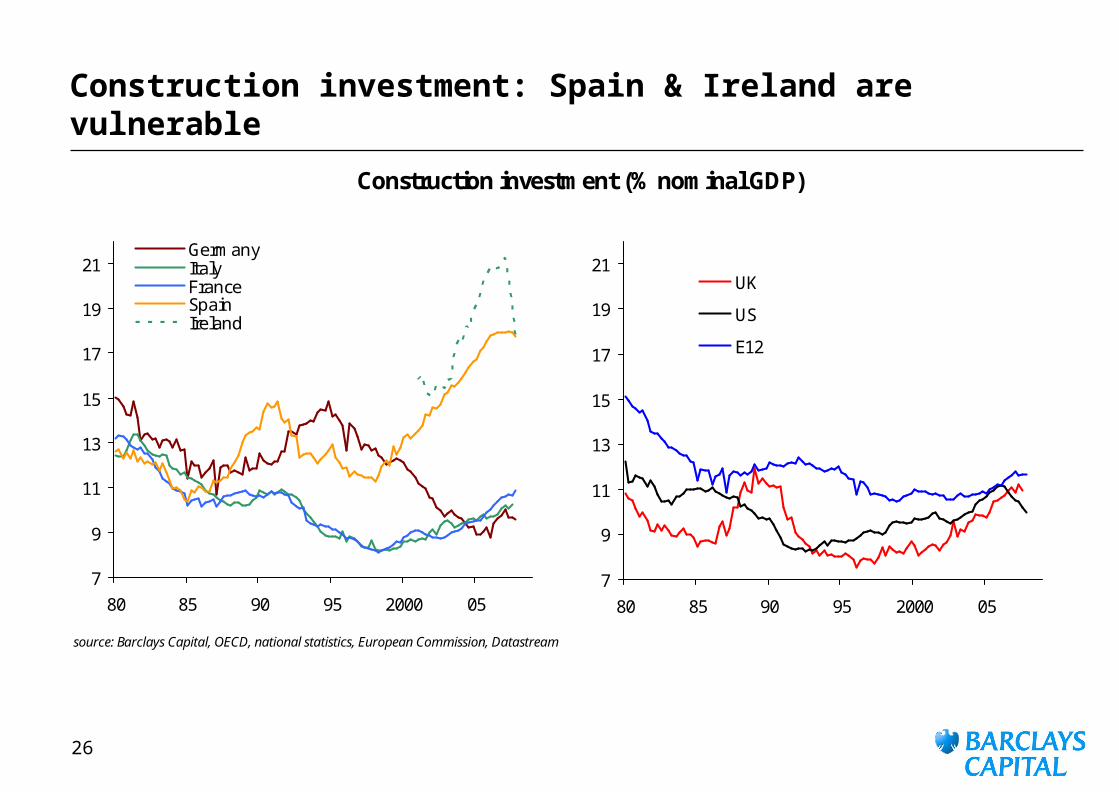
Construction investment: Spain & Ireland are vulnerable
source: Barclays Capital, OECD, national statistics, European Commission, Datastream
Construction investment (% nominal GDP)
7
9
11
13
15
17
19
21
80 85 90 95 2000 05
GermanyItalyFranceSpainIreland
7
9
11
13
15
17
19
21
80 85 90 95 2000 05
UK
US
E12
27
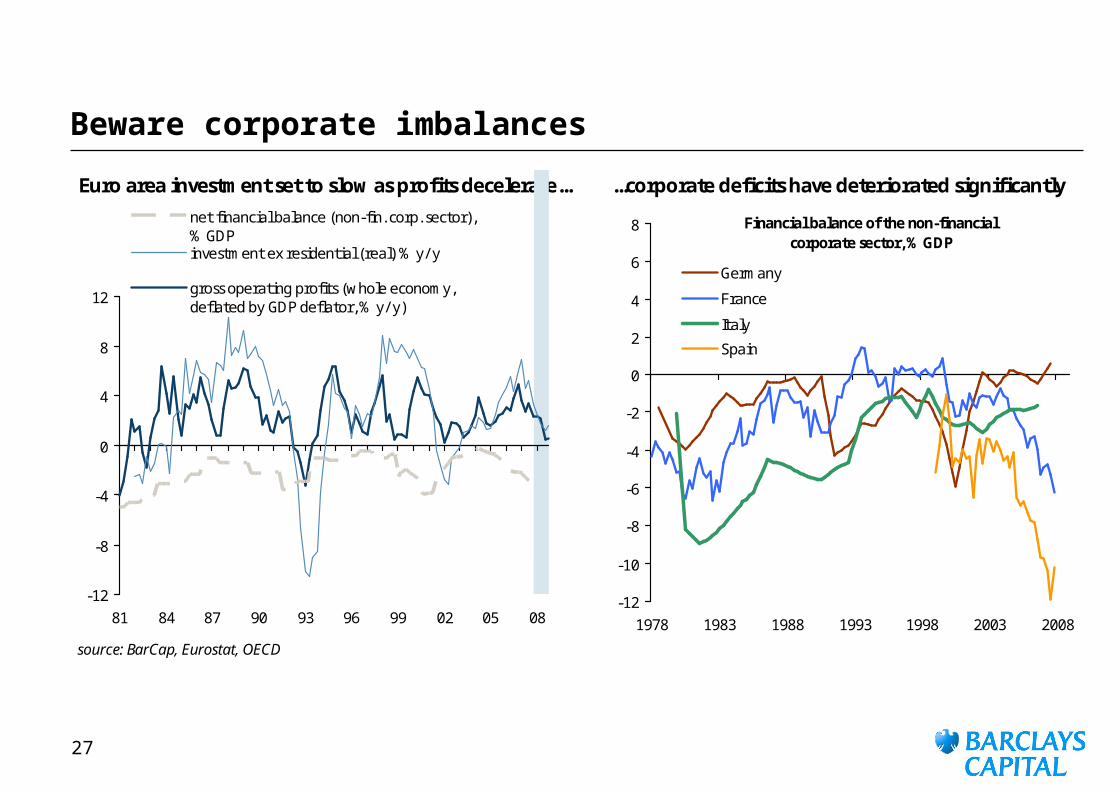
Beware corporate imbalances
Euro area investment set to slow as profits decelerate... ...corporate deficits have deteriorated significantly
source: BarCap, Eurostat, OECD
-12
-8
-4
0
4
8
12
81 84 87 90 93 96 99 02 05 08
net financial balance (non-fin. corp. sector), % GDPinvestment ex residential (real) % y/ y
gross operating profits (whole economy,deflated by GDP deflator, % y/ y)
-12
-10
-8
-6
-4
-2
0
2
4
6
8
1978 1983 1988 1993 1998 2003 2008
Germany
France
Italy
Spain
Financial balance of the non-financial corporate sector, % GDP
28
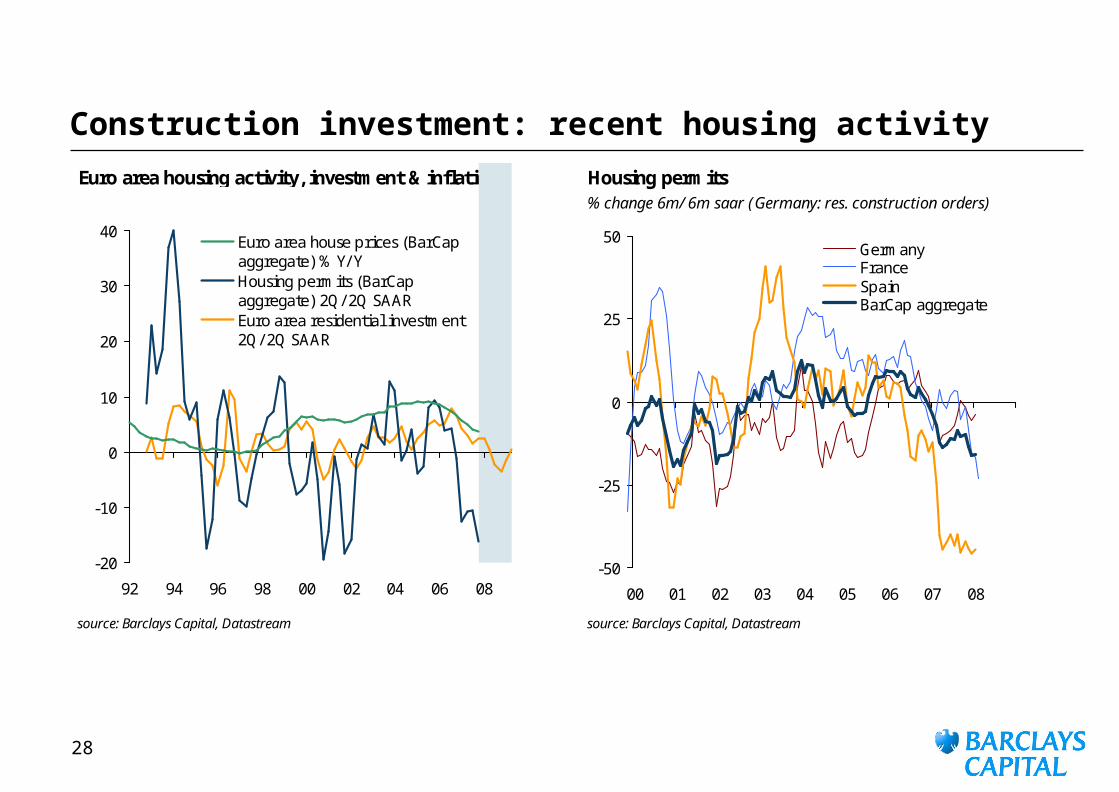
Construction investment: recent housing activity
Euro area housing activity, investment & inflation Housing permits% change 6m/ 6m saar (Germany: res. construction orders)
*Germany: residential orders
source: Barclays Capital, Datastream source: Barclays Capital, Datastream
-20
-10
0
10
20
30
40
92 94 96 98 00 02 04 06 08
Euro area house prices (BarCapaggregate) % Y/ YHousing permits (BarCapaggregate) 2Q/ 2Q SAAREuro area residential investment2Q/ 2Q SAAR
-50
-25
0
25
50
00 01 02 03 04 05 06 07 08
GermanyFranceSpainBarCap aggregate
29
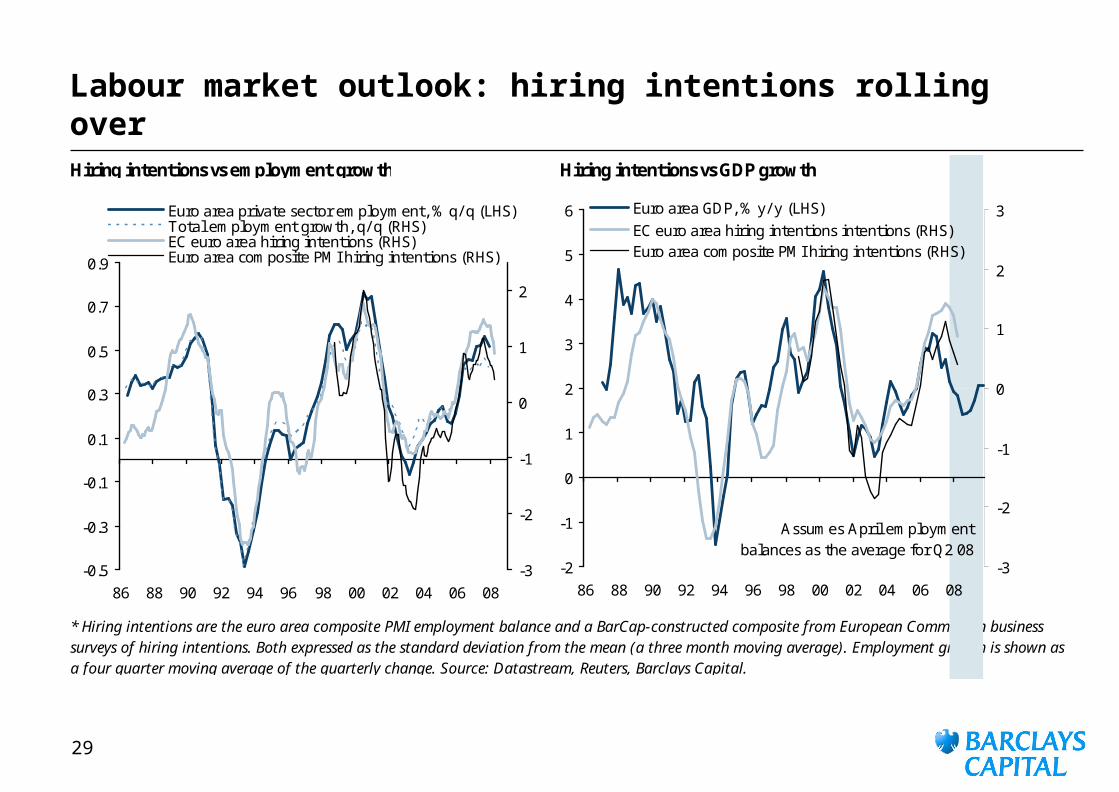
Labour market outlook: hiring intentions rolling overHiring intentions vs employment growth Hiring intentions vs GDP growth
* Hiring intentions are the euro area composite PMI employment balance and a BarCap-constructed composite from European Commission business surveys of hiring intentions. Both expressed as the standard deviation from the mean (a three month moving average). Employment growth is shown as a four quarter moving average of the quarterly change. Source: Datastream, Reuters, Barclays Capital.
-0.5
-0.3
-0.1
0.1
0.3
0.5
0.7
0.9
86 88 90 92 94 96 98 00 02 04 06 08
-3
-2
-1
0
1
2
Euro area private sector employment, % q/ q (LHS)Total employment growth, q/ q (RHS)EC euro area hiring intentions (RHS)Euro area composite PMI hiring intentions (RHS)
-2
-1
0
1
2
3
4
5
6
86 88 90 92 94 96 98 00 02 04 06 08
-3
-2
-1
0
1
2
3Euro area GDP, % y/ y (LHS)
EC euro area hiring intentions intentions (RHS)Euro area composite PMI hiring intentions (RHS)
Assumes April employment balances as the average for Q2 08

30
Euro area retail PMIs
Retail sales values include BarCap estimate for autos based on registrations and HICP data. German retail sales series adjusted for Jan. 06 structural break.
Source: Datastream, Ecowin, Bloomberg, Barclays Capital
Euro area Germany
France
(nominal retail sales shown as % y/ y; retail PMI balances are "sales versus a year ago"; both series nsa)
Italy
Retail sales vs. retail PMI sales vs a year ago
-8
-4
0
4
8
04 05 06 07 08
20
30
40
50
60
Retail sales (LHS)
Retail PMI (RHS)
-1
1
3
5
7
9
04 05 06 07 08
40
45
50
55
60
65
70Retail sales (LHS)
Retail PMI (RHS)
-4
-2
0
2
4
6
04 05 06 07 08
35
40
45
50
55
60Retail sales
Retail PMI (RHS)
0
1
2
3
4
5
6
04 05 06 07 08
40
45
50
55
60Retail sales (LHS)
Retail PMI (RHS)
31
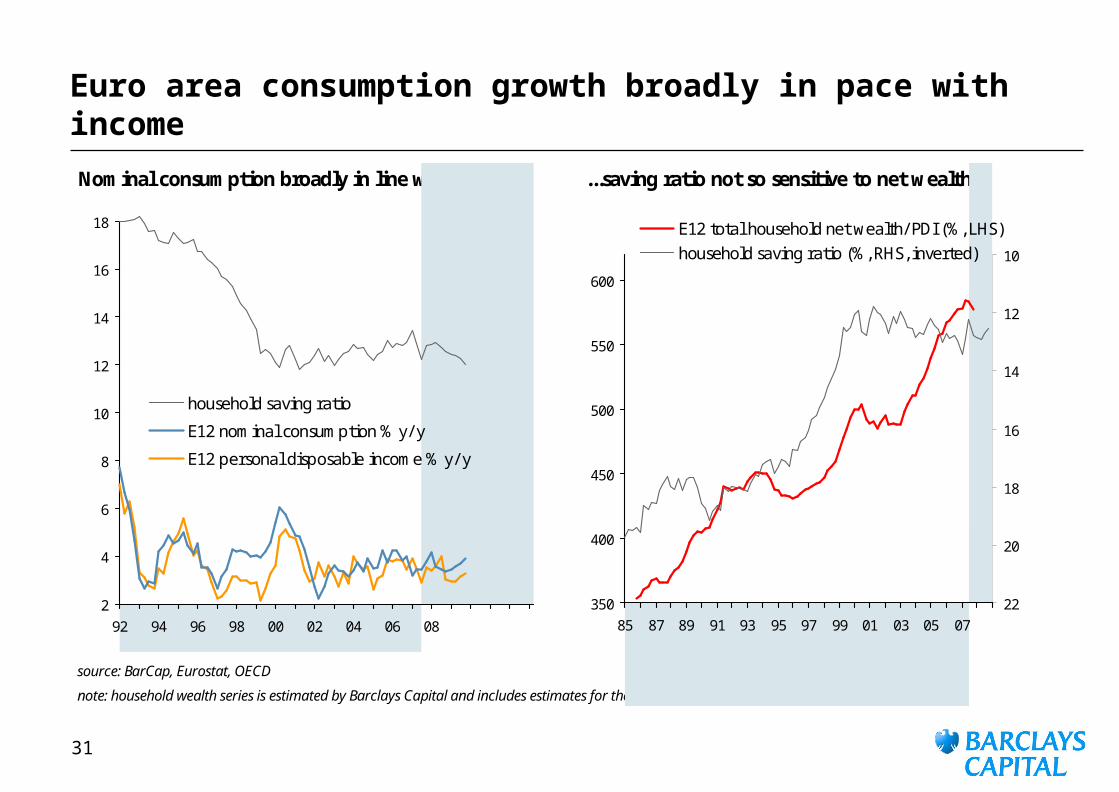
Euro area consumption growth broadly in pace with income
Nominal consumption broadly in line with income ...saving ratio not so sensitive to net wealth
source: BarCap, Eurostat, OECD
note: household wealth series is estimated by Barclays Capital and includes estimates for the stock of housing wealth
2
4
6
8
10
12
14
16
18
92 94 96 98 00 02 04 06 08
household saving ratio
E12 nominal consumption % y/ y
E12 personal disposable income % y/ y
350
400
450
500
550
600
85 87 89 91 93 95 97 99 01 03 05 07
10
12
14
16
18
20
22
E12 total household net wealth/ PDI (%, LHS)
household saving ratio (%, RHS, inverted)
32
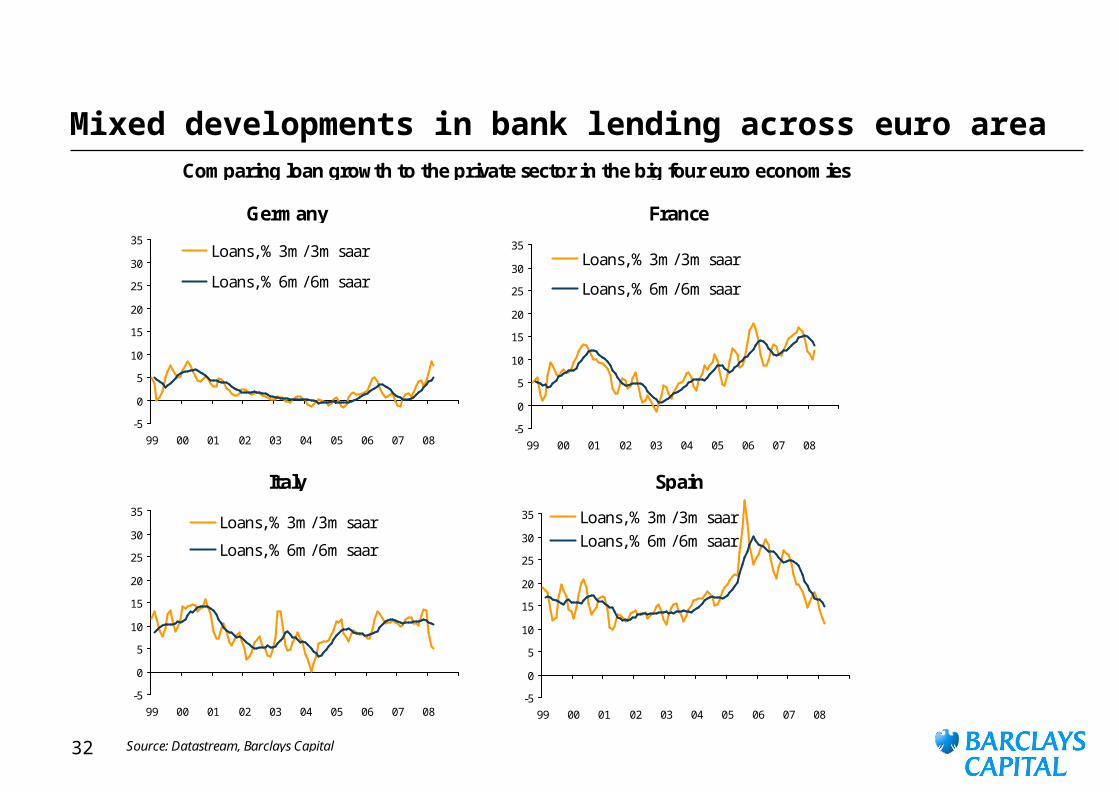
Mixed developments in bank lending across euro area
Source: Datastream, Barclays Capital
Comparing loan growth to the private sector in the big four euro economies
Germany France
Italy Spain
-5
0
5
10
15
20
25
30
35
99 00 01 02 03 04 05 06 07 08
Loans, % 3m/ 3m saar
Loans, % 6m/ 6m saar
-5
0
5
10
15
20
25
30
35
99 00 01 02 03 04 05 06 07 08
Loans, % 3m/ 3m saar
Loans, % 6m/ 6m saar
-5
0
5
10
15
20
25
30
35
99 00 01 02 03 04 05 06 07 08
Loans, % 3m/ 3m saar
Loans, % 6m/ 6m saar
-5
0
5
10
15
20
25
30
35
99 00 01 02 03 04 05 06 07 08
Loans, % 3m/ 3m saarLoans, % 6m/ 6m saar
33
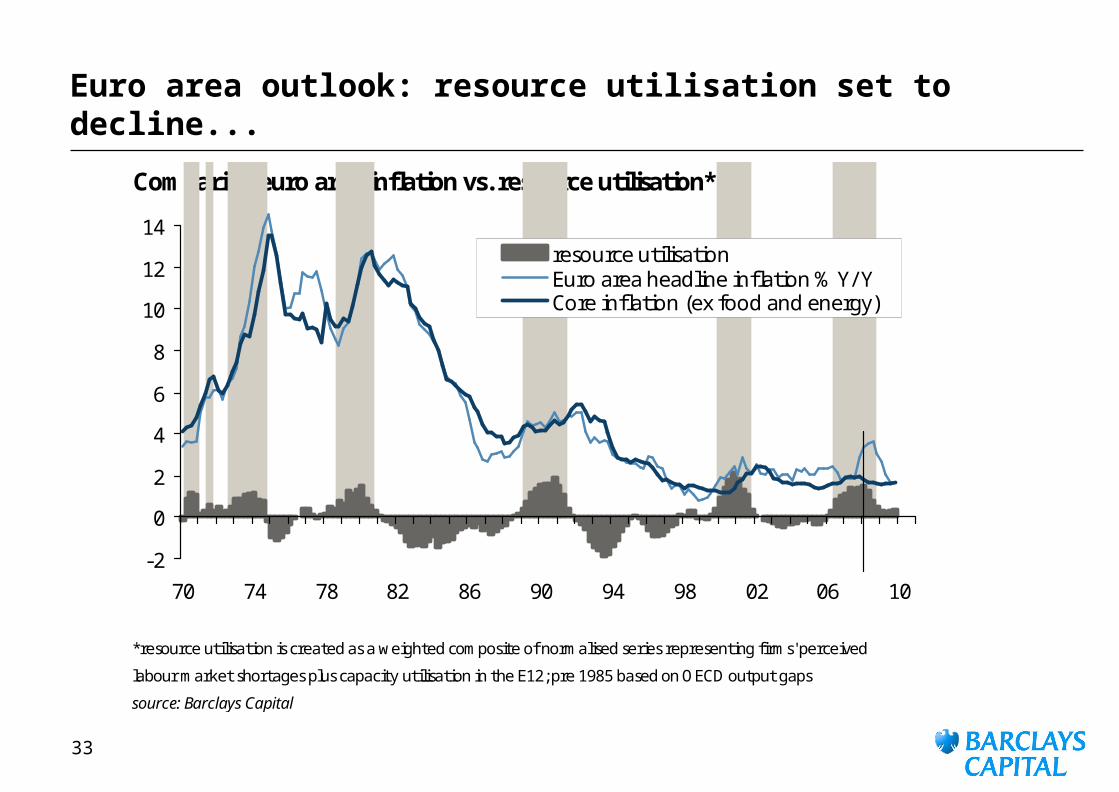
Euro area outlook: resource utilisation set to decline...
Comparing euro area inflation vs. resource utilisation*
*resource utilisation is created as a weighted composite of normalised series representing firms' perceived
labour market shortages plus capacity utilisation in the E12; pre 1985 based on OECD output gaps
source: Barclays Capital
-2
0
2
4
6
8
10
12
14
70 74 78 82 86 90 94 98 02 06 10
resource utilisationEuro area headline inflation % Y/ YCore inflation (ex food and energy)
34
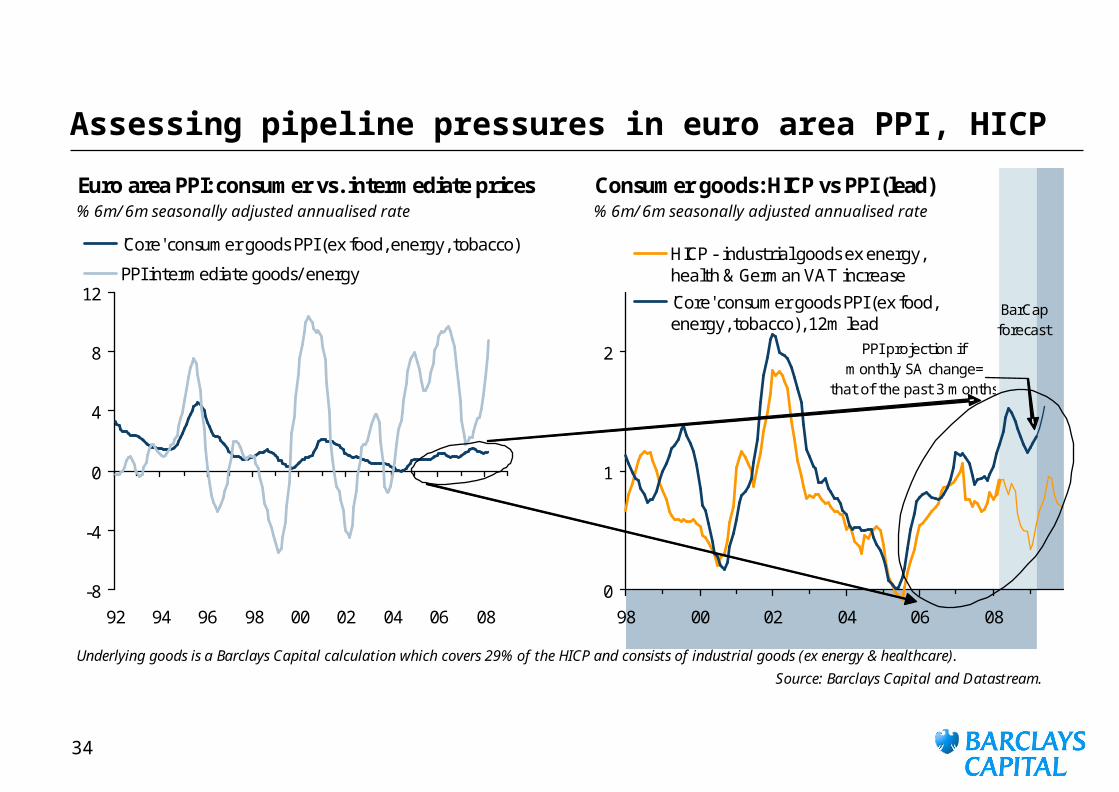
Assessing pipeline pressures in euro area PPI, HICP
Euro area PPI: consumer vs. intermediate prices Consumer goods: HICP vs PPI (lead)% 6m/ 6m seasonally adjusted annualised rate % 6m/ 6m seasonally adjusted annualised rate
Underlying goods is a Barclays Capital calculation which covers 29% of the HICP and consists of industrial goods (ex energy & healthcare).
Source: Barclays Capital and Datastream.
0
1
2
98 00 02 04 06 08
HICP - industrial goods ex energy,health & German VAT increase
'Core' consumer goods PPI (ex food,energy, tobacco), 12m lead
BarCapforecast
PPI projection ifmonthly SA change=
that of the past 3 months
-8
-4
0
4
8
12
92 94 96 98 00 02 04 06 08
'Core' consumer goods PPI (ex food, energy, tobacco)
PPI intermediate goods/ energy

35
A stronger euro should help to keep a lid on industrial price rises
Source: Barclays Capital, FSO.
'Underlying' goods: industrial goods (ex energy & healthcare), excluding BarCap estimates of the impact of the 2007 German VAT increase
% changes 6m/ 6m seasonally adjusted, annualised
German import prices for ex-euro area* consumer durables, vs euro area "underlying" goods HICP inflation
-6
-4
-2
0
2
4
6
97 98 99 00 01 02 03 04 05 06 07 08 09
-0.5
0.0
0.5
1.0
1.5
2.0
German import prices for consumer durable goods(ex-EMU*), 17m lead (LHS)
Euro area HICP - 'Underlying' goods (RHS)
* pre-2000 inc. EMU
HICP - Underlying goods forecast
36
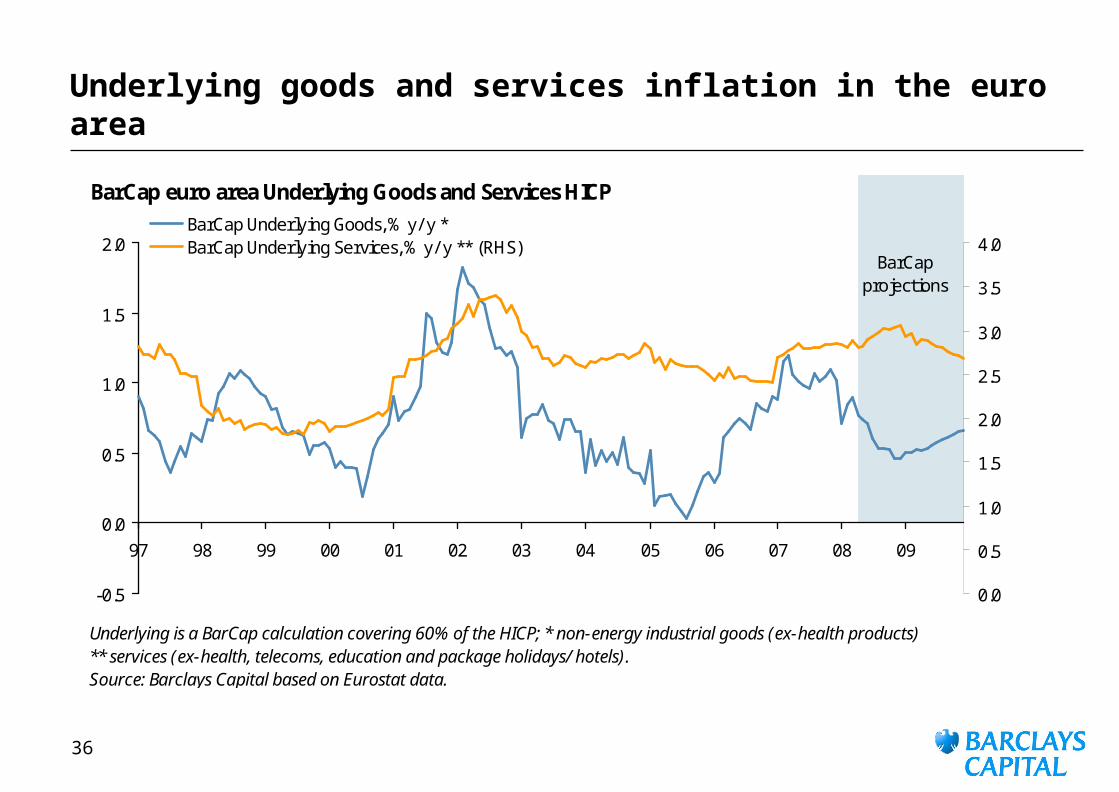
Underlying goods and services inflation in the euro area
BarCap euro area Underlying Goods and Services HICP
Underlying is a BarCap calculation covering 60% of the HICP; * non-energy industrial goods (ex-health products) ** services (ex-health, telecoms, education and package holidays/ hotels).Source: Barclays Capital based on Eurostat data.
-0.5
0.0
0.5
1.0
1.5
2.0
97 98 99 00 01 02 03 04 05 06 07 08 09
0.0
0.5
1.0
1.5
2.0
2.5
3.0
3.5
4.0BarCap Underlying Goods, % y/ y *BarCap Underlying Services, % y/ y ** (RHS)
BarCap projections
37
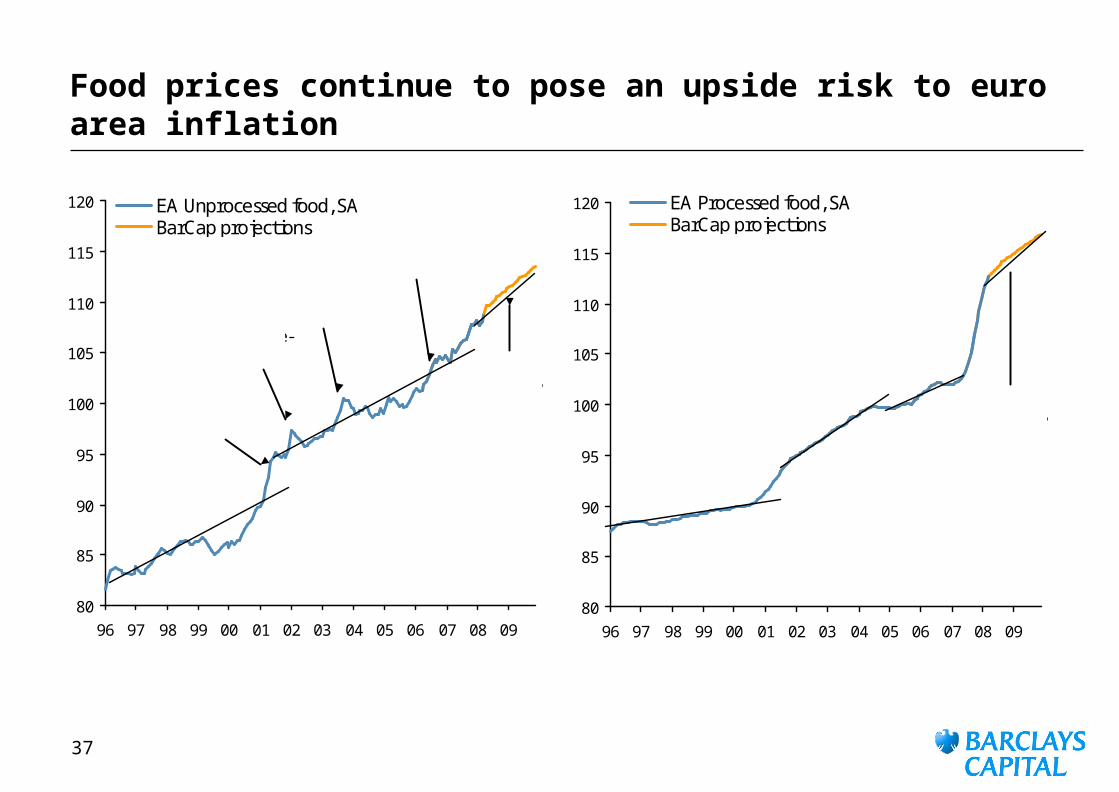
Food prices continue to pose an upside risk to euro area inflation
80
85
90
95
100
105
110
115
120
96 97 98 99 00 01 02 03 04 05 06 07 08 09
EA Unprocessed food, SABarCap projections
newtrend-line?
Major food price shock (BSE, foot & mouth, vegetables)
€ change-over
Summer 03 heat-wave
July 06 heat-wave
80
85
90
95
100
105
110
115
120
96 97 98 99 00 01 02 03 04 05 06 07 08 09
EA Processed food, SABarCap projections
newtrend-line?
38
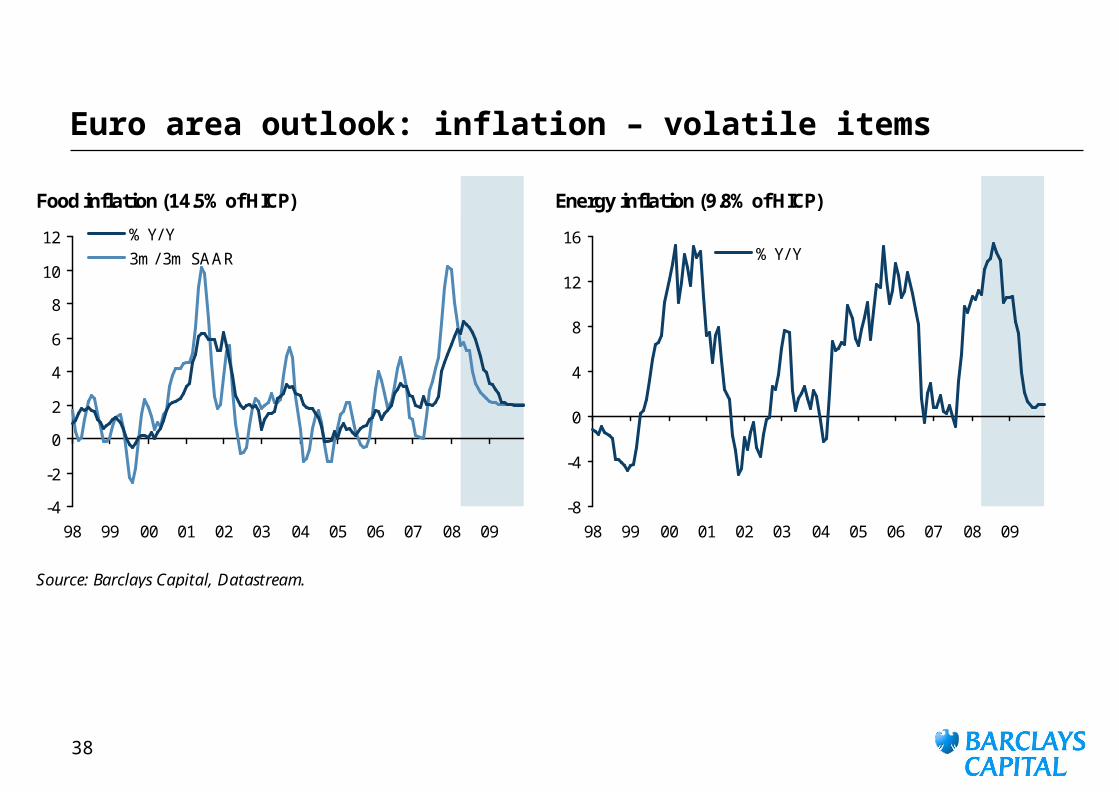
Euro area outlook: inflation – volatile items
Food inflation (14.5% of HICP) Energy inflation (9.8% of HICP)
Source: Barclays Capital, Datastream.
-4
-2
0
2
4
6
8
10
12
98 99 00 01 02 03 04 05 06 07 08 09
% Y/ Y3m/ 3m SAAR
-8
-4
0
4
8
12
16
98 99 00 01 02 03 04 05 06 07 08 09
% Y/ Y
39
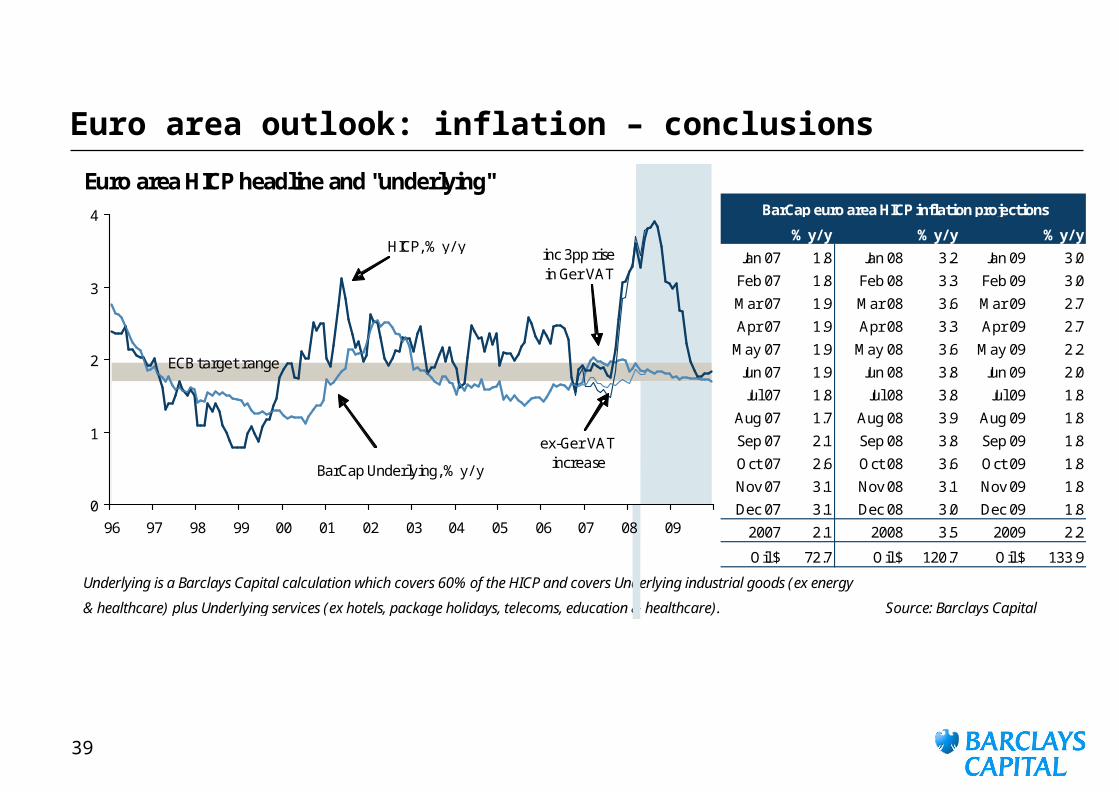
Euro area outlook: inflation – conclusions
Euro area HICP headline and "underlying"
% y/y % y/ y % y/ y
Jan 07 1.8 Jan 08 3.2 Jan 09 3.0
Feb 07 1.8 Feb 08 3.3 Feb 09 3.0
Mar 07 1.9 Mar 08 3.6 Mar 09 2.7
Apr 07 1.9 Apr 08 3.3 Apr 09 2.7
May 07 1.9 May 08 3.6 May 09 2.2
Jun 07 1.9 Jun 08 3.8 Jun 09 2.0
Jul 07 1.8 Jul 08 3.8 Jul 09 1.8
Aug 07 1.7 Aug 08 3.9 Aug 09 1.8
Sep 07 2.1 Sep 08 3.8 Sep 09 1.8
Oct 07 2.6 Oct 08 3.6 Oct 09 1.8
Nov 07 3.1 Nov 08 3.1 Nov 09 1.8
Dec 07 3.1 Dec 08 3.0 Dec 09 1.8
2007 2.1 2008 3.5 2009 2.2
Oil $ 72.7 Oil $ 120.7 Oil $ 133.9
Underlying is a Barclays Capital calculation which covers 60% of the HICP and covers Underlying industrial goods (ex energy
& healthcare) plus Underlying services (ex hotels, package holidays, telecoms, education & healthcare). Source: Barclays Capital
BarCap euro area HICP inflation projections
0
1
2
3
4
96 97 98 99 00 01 02 03 04 05 06 07 08 09
ECB target range
BarCap Underlying, % y/ y
HICP, % y/ y
ex-Ger VATincrease
inc 3pp rise in Ger VAT
40
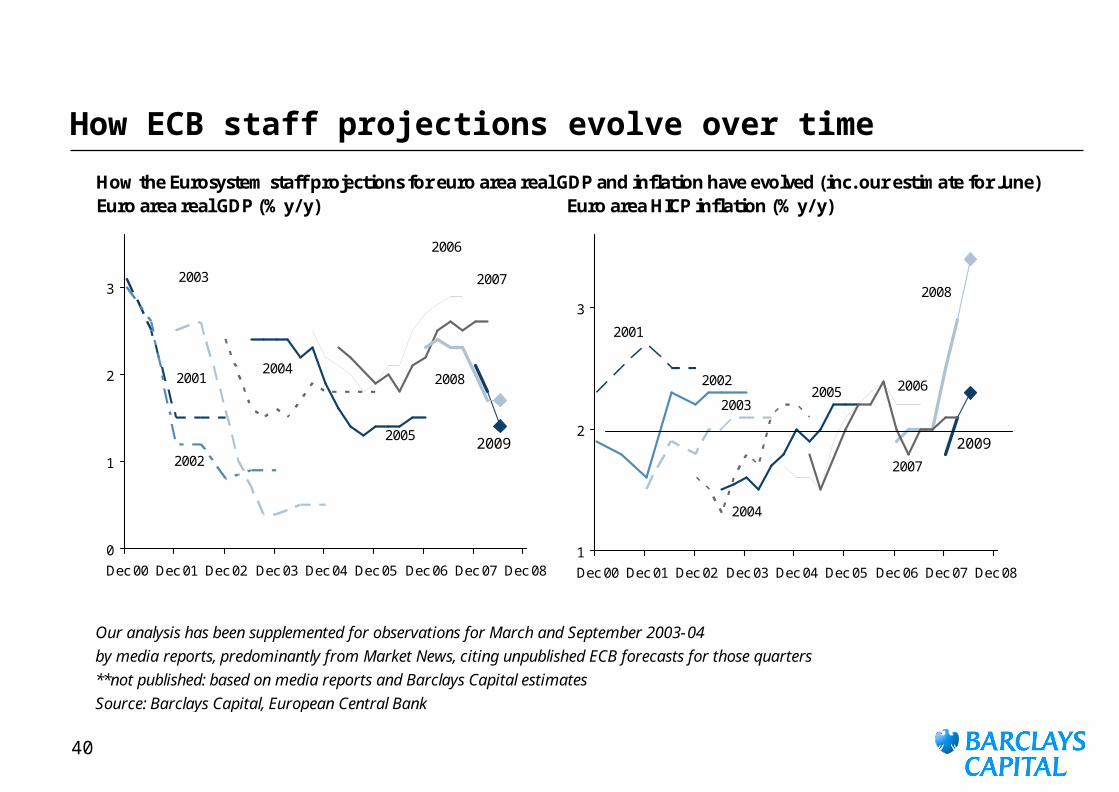
How ECB staff projections evolve over time
How the Eurosystem staff projections for euro area real GDP and inflation have evolved (inc. our estimate for June)Euro area real GDP (% y/y) Euro area HICP inflation (% y/y)
`
Our analysis has been supplemented for observations for March and September 2003-04
by media reports, predominantly from Market News, citing unpublished ECB forecasts for those quarters
**not published: based on media reports and Barclays Capital estimates
Source: Barclays Capital, European Central Bank
0
1
2
3
Dec 00 Dec 01 Dec 02 Dec 03 Dec 04 Dec 05 Dec 06 Dec 07 Dec 08
2001
2002
2003
2004
2005
2006
2007
2008
2009
1
2
3
Dec 00 Dec 01 Dec 02 Dec 03 Dec 04 Dec 05 Dec 06 Dec 07 Dec 08
2001
2002
2003
2004
2005 2006
2007
2008
2009
41
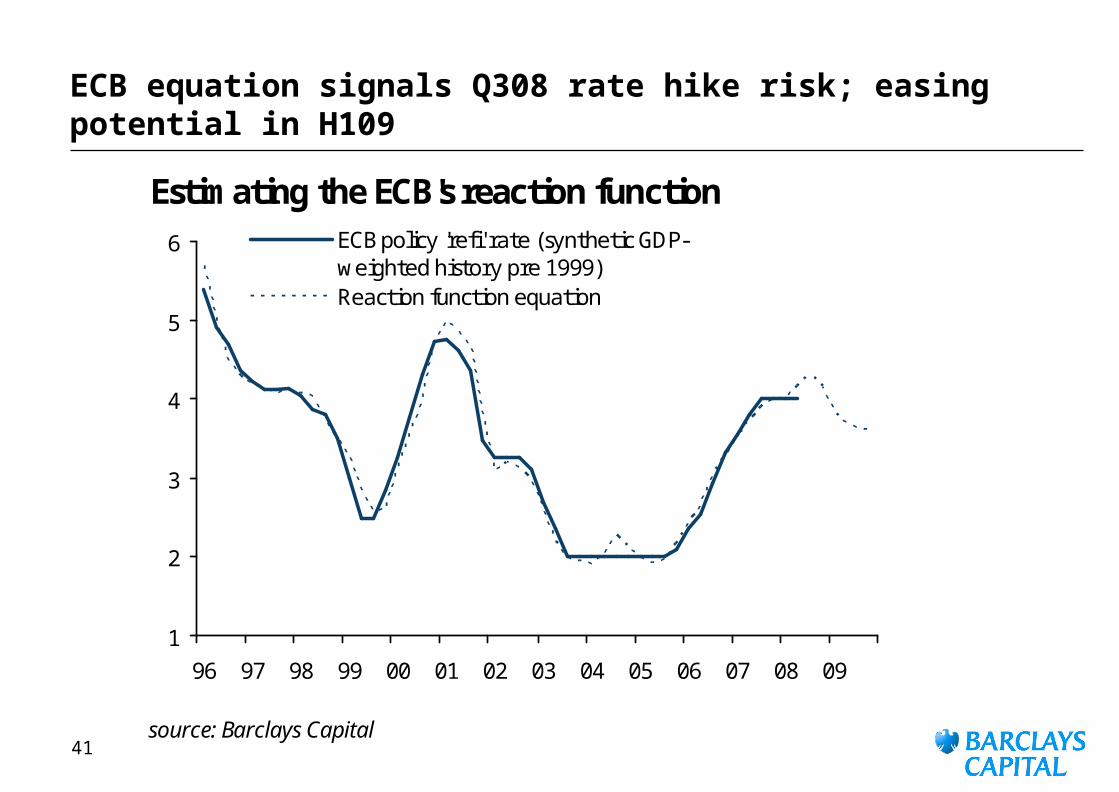
ECB equation signals Q308 rate hike risk; easing potential in H109
Estimating the ECB's reaction function
source: Barclays Capital
1
2
3
4
5
6
96 97 98 99 00 01 02 03 04 05 06 07 08 09
ECB policy 'refi' rate (synthetic GDP-weighted history pre 1999)Reaction function equation
42
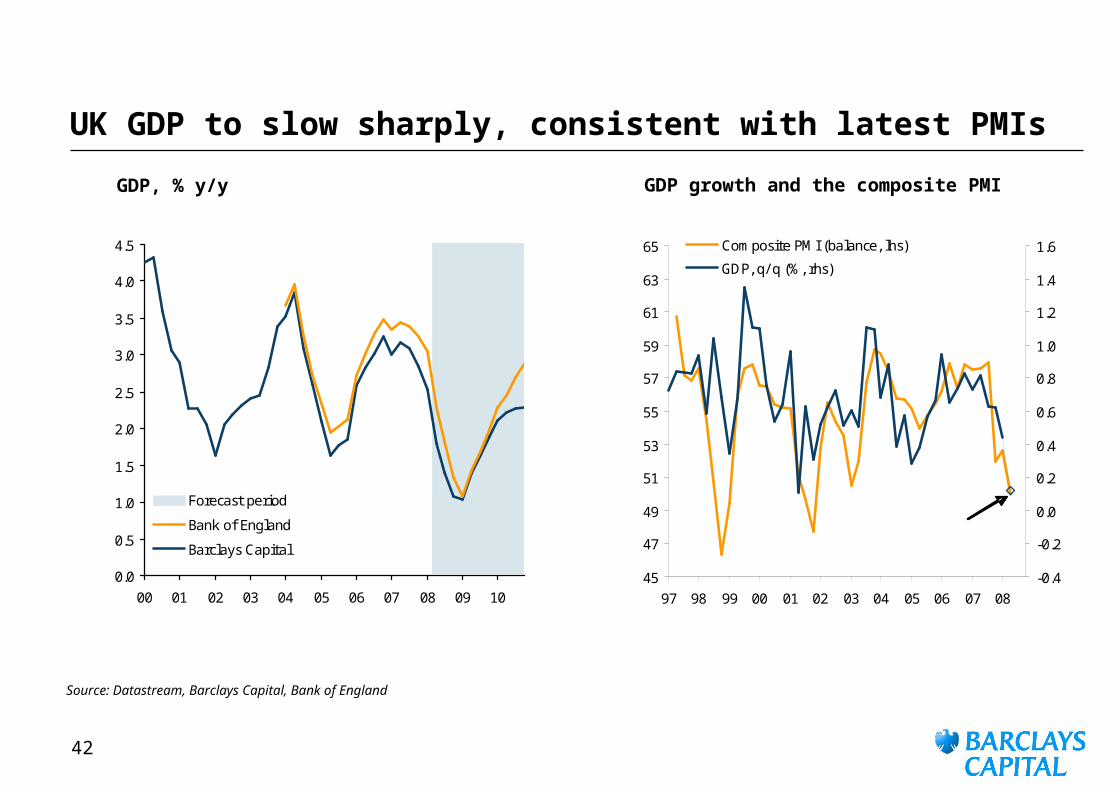
UK GDP to slow sharply, consistent with latest PMIs
0.0
0.5
1.0
1.5
2.0
2.5
3.0
3.5
4.0
4.5
00 01 02 03 04 05 06 07 08 09 10
Forecast period
Bank of England
Barclays Capital
45
47
49
51
53
55
57
59
61
63
65
97 98 99 00 01 02 03 04 05 06 07 08-0.4
-0.2
0.0
0.2
0.4
0.6
0.8
1.0
1.2
1.4
1.6Composite PMI (balance, lhs)
GDP, q/ q (%, rhs)
BarCap Q2 GDP forecast
GDP, % y/y GDP growth and the composite PMI
Source: Datastream, Barclays Capital, Bank of England
43
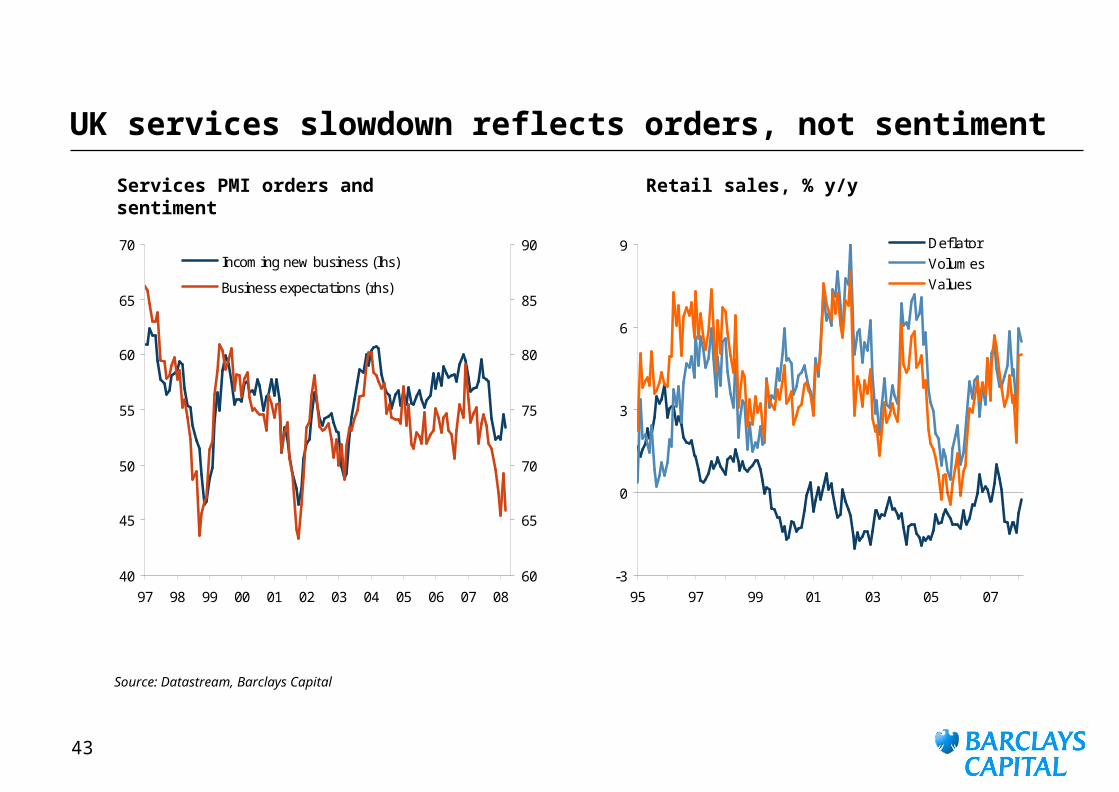
UK services slowdown reflects orders, not sentiment
Services PMI orders and sentiment
Retail sales, % y/y
Source: Datastream, Barclays Capital
40
45
50
55
60
65
70
97 98 99 00 01 02 03 04 05 06 07 0860
65
70
75
80
85
90Incoming new business (lhs)
Business expectations (rhs)
-3
0
3
6
9
95 97 99 01 03 05 07
DeflatorVolumes Values
44
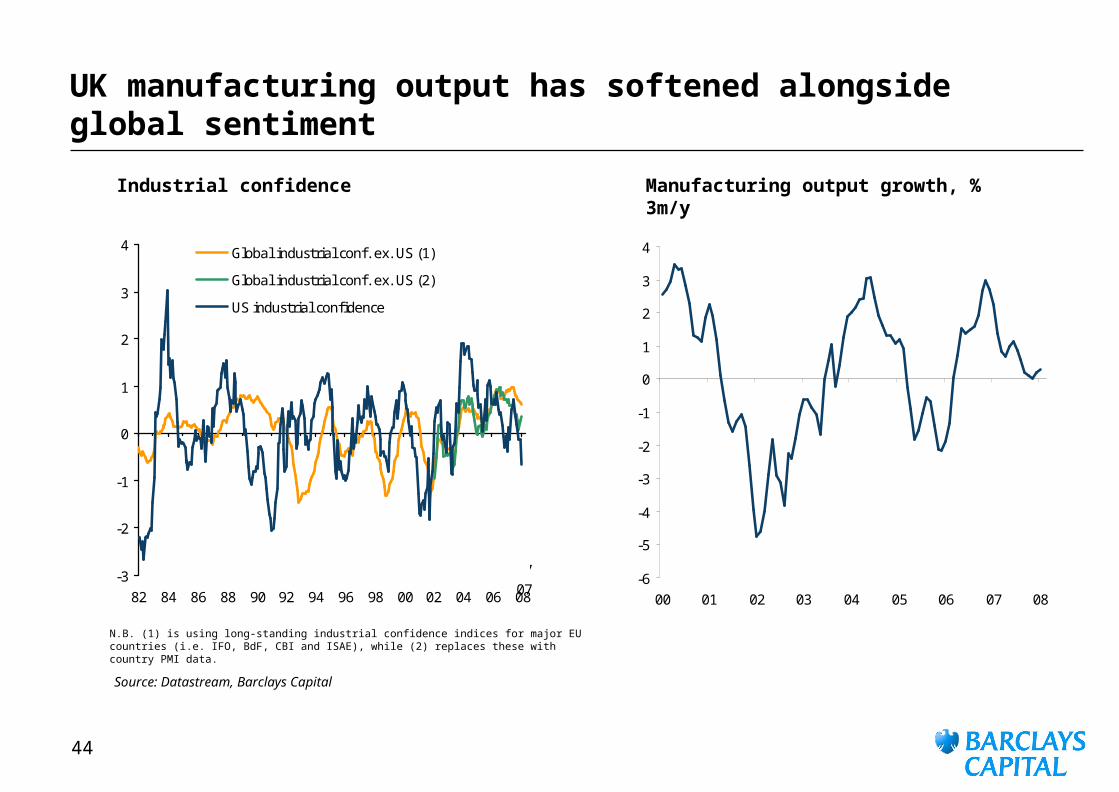
UK manufacturing output has softened alongside global sentiment
Industrial confidence Manufacturing output growth, % 3m/y
Source: Datastream, Barclays Capital
-3
-2
-1
0
1
2
3
4
82 84 86 88 90 92 94 96 98 00 02 04 06 08
Global industrial conf. ex. US (1)
Global industrial conf. ex. US (2)
US industrial confidence
Latest: Dec 07 07
N.B. (1) is using long-standing industrial confidence indices for major EU countries (i.e. IFO, BdF, CBI and ISAE), while (2) replaces these with country PMI data.
-6
-5
-4
-3
-2
-1
0
1
2
3
4
00 01 02 03 04 05 06 07 08
45
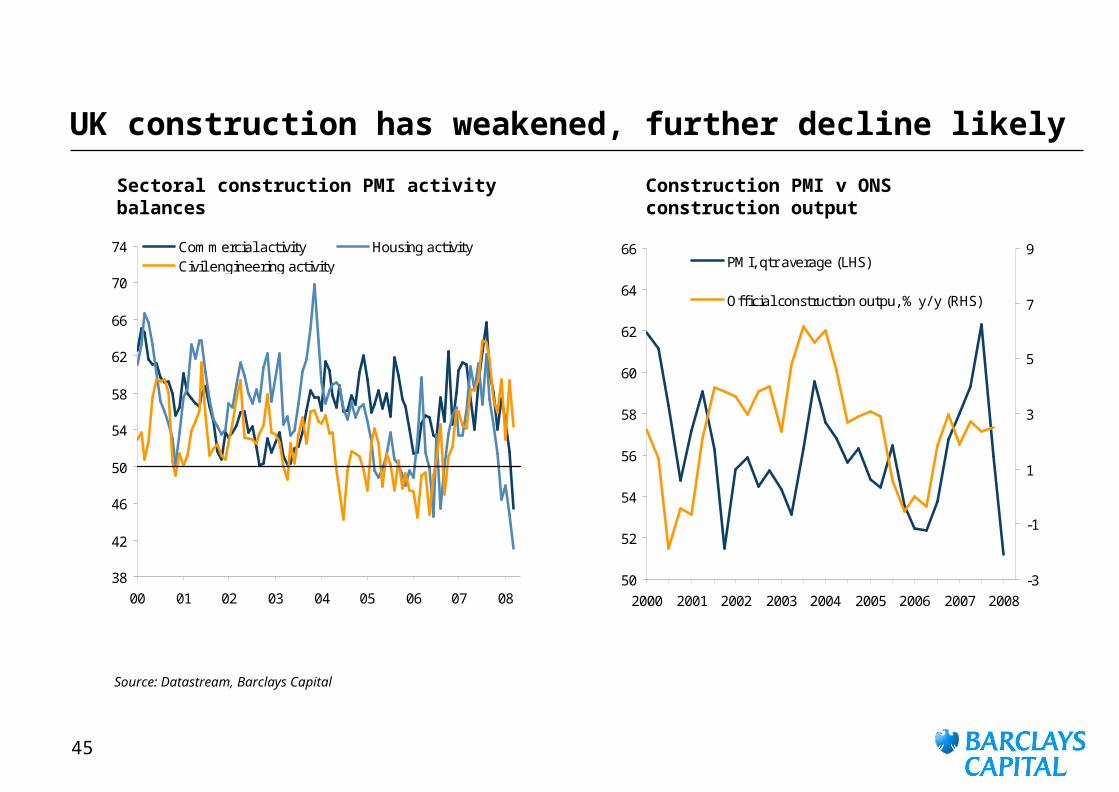
UK construction has weakened, further decline likely
Sectoral construction PMI activity balances
Construction PMI v ONS construction output
Source: Datastream, Barclays Capital
38
42
46
50
54
58
62
66
70
74
00 01 02 03 04 05 06 07 08
Commercial activity Housing activityCivil engineering activity
50
52
54
56
58
60
62
64
66
2000 2001 2002 2003 2004 2005 2006 2007 2008-3
-1
1
3
5
7
9PMI, qtr average (LHS)
Official construction outpu, % y/ y (RHS)
46
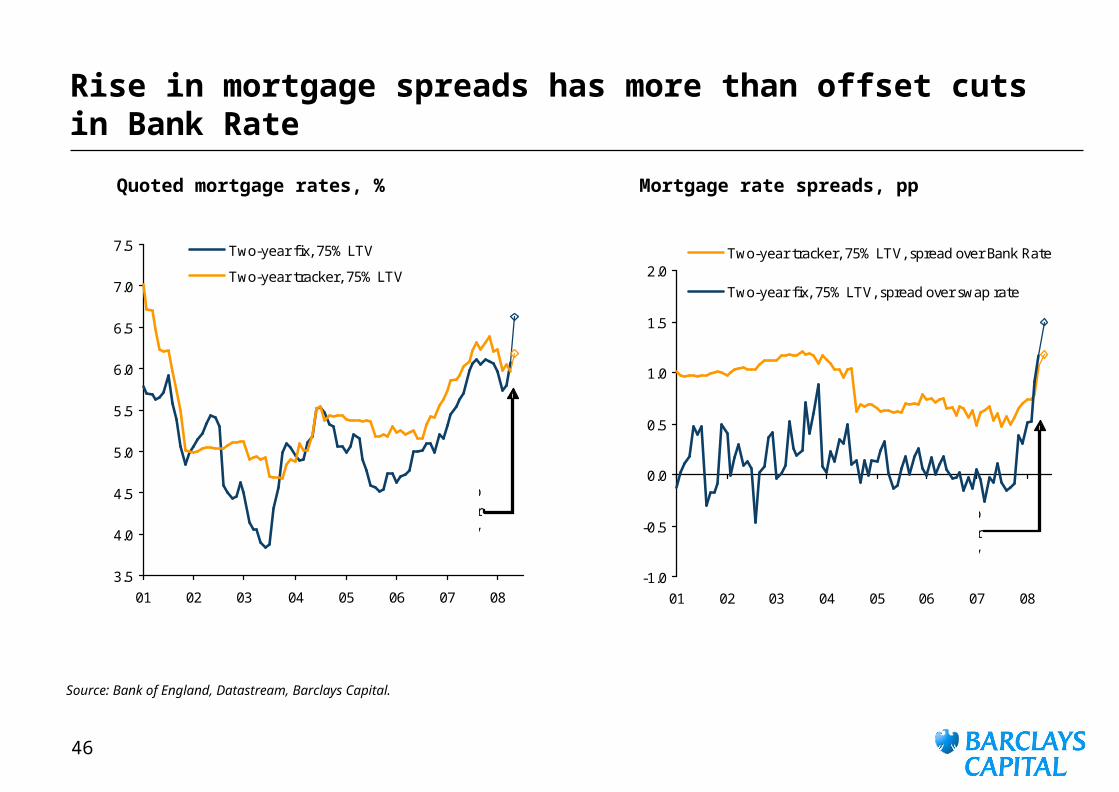
Rise in mortgage spreads has more than offset cuts in Bank Rate
Quoted mortgage rates, % Mortgage rate spreads, pp
Source: Bank of England, Datastream, Barclays Capital.
3.5
4.0
4.5
5.0
5.5
6.0
6.5
7.0
7.5
01 02 03 04 05 06 07 08
Two-year fix, 75% LTV
Two-year tracker, 75% LTV
BarCap estimates for
May
-1.0
-0.5
0.0
0.5
1.0
1.5
2.0
01 02 03 04 05 06 07 08
Two-year tracker, 75% LTV, spread over Bank Rate
Two-year fix, 75% LTV, spread over swap rate
BarCap estimates for
May
47
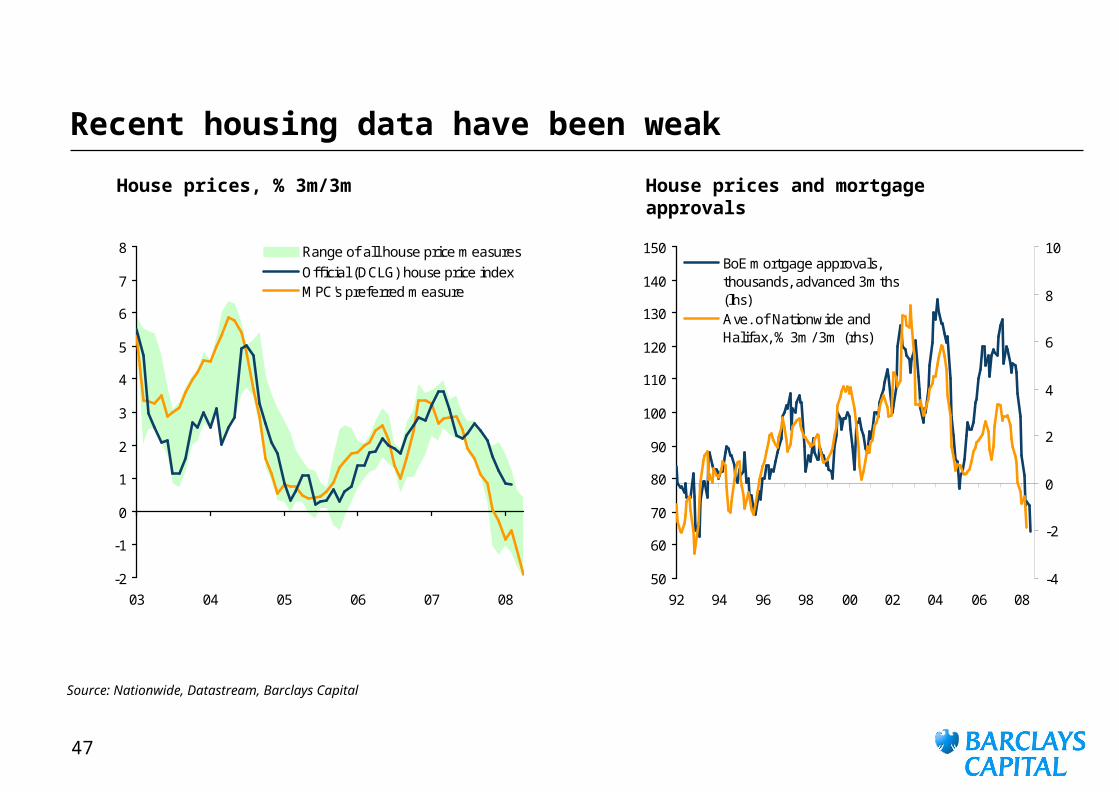
Recent housing data have been weak
House prices, % 3m/3m House prices and mortgage approvals
Source: Nationwide, Datastream, Barclays Capital
-2
-1
0
1
2
3
4
5
6
7
8
03 04 05 06 07 08
Range of all house price measuresOfficial (DCLG) house price indexMPC's preferred measure
50
60
70
80
90
100
110
120
130
140
150
92 94 96 98 00 02 04 06 08-4
-2
0
2
4
6
8
10BoE mortgage approvals,thousands, advanced 3mths(lhs)Ave. of Nationwide andHalifax, % 3m/ 3m (rhs)
48
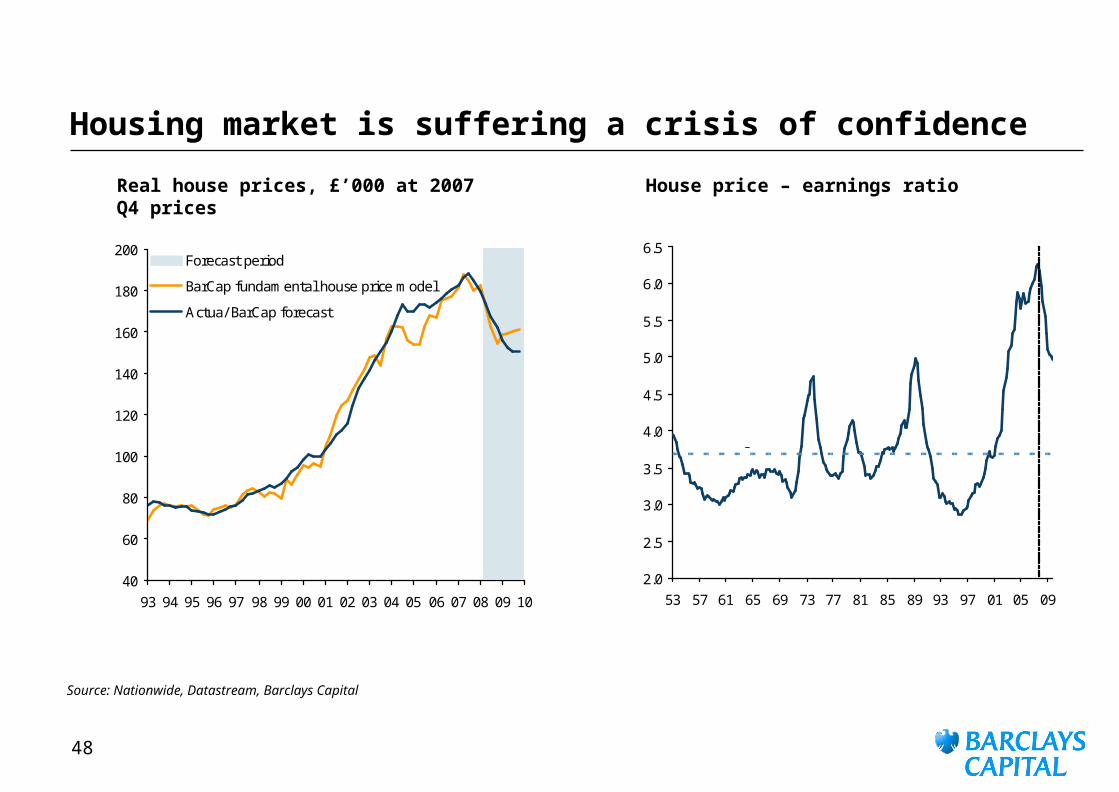
Housing market is suffering a crisis of confidence
Real house prices, £’000 at 2007 Q4 prices
House price – earnings ratio
Source: Nationwide, Datastream, Barclays Capital
40
60
80
100
120
140
160
180
200
93 94 95 96 97 98 99 00 01 02 03 04 05 06 07 08 09 10
Forecast period
BarCap fundamental house price model
Actua/ BarCap forecast
2.0
2.5
3.0
3.5
4.0
4.5
5.0
5.5
6.0
6.5
53 57 61 65 69 73 77 81 85 89 93 97 01 05 09
Average
49
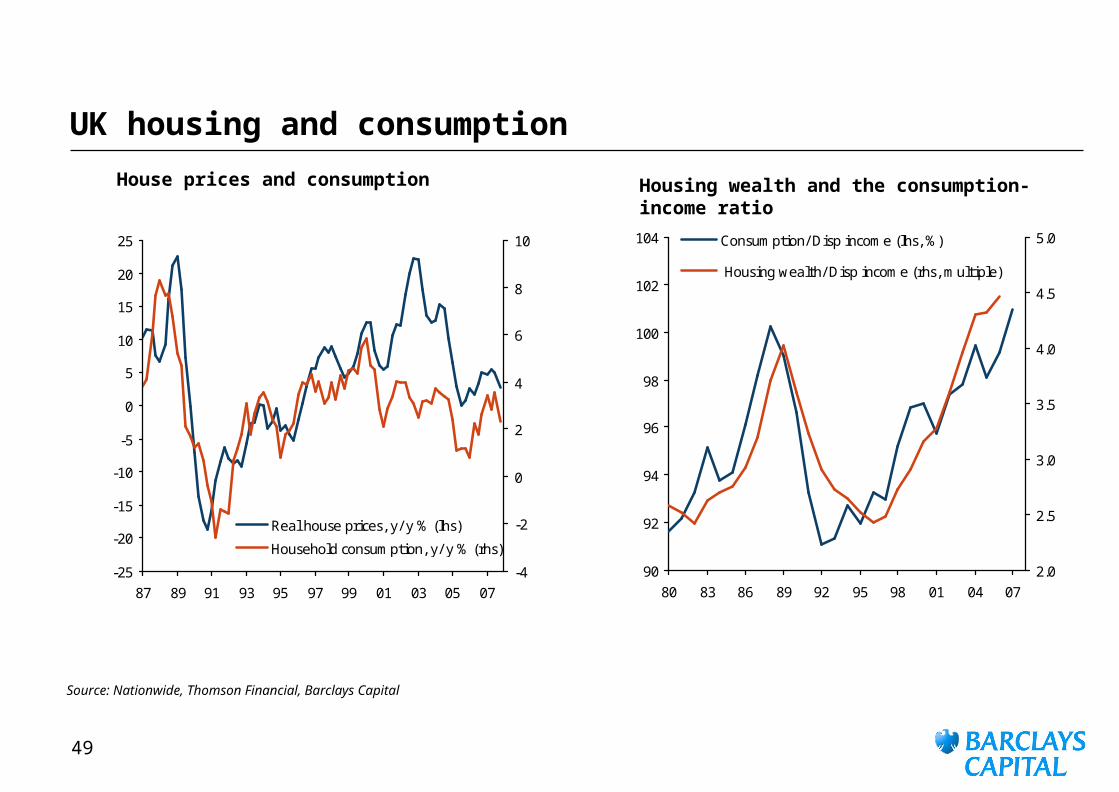
UK housing and consumption
House prices and consumption Housing wealth and the consumption-income ratio
Source: Nationwide, Thomson Financial, Barclays Capital
-25
-20
-15
-10
-5
0
5
10
15
20
25
87 89 91 93 95 97 99 01 03 05 07-4
-2
0
2
4
6
8
10
Real house prices, y/ y % (lhs)
Household consumption, y/ y % (rhs)
90
92
94
96
98
100
102
104
80 83 86 89 92 95 98 01 04 072.0
2.5
3.0
3.5
4.0
4.5
5.0Consumption/ Disp income (lhs, %)
Housing wealth/ Disp income (rhs, multiple)
50
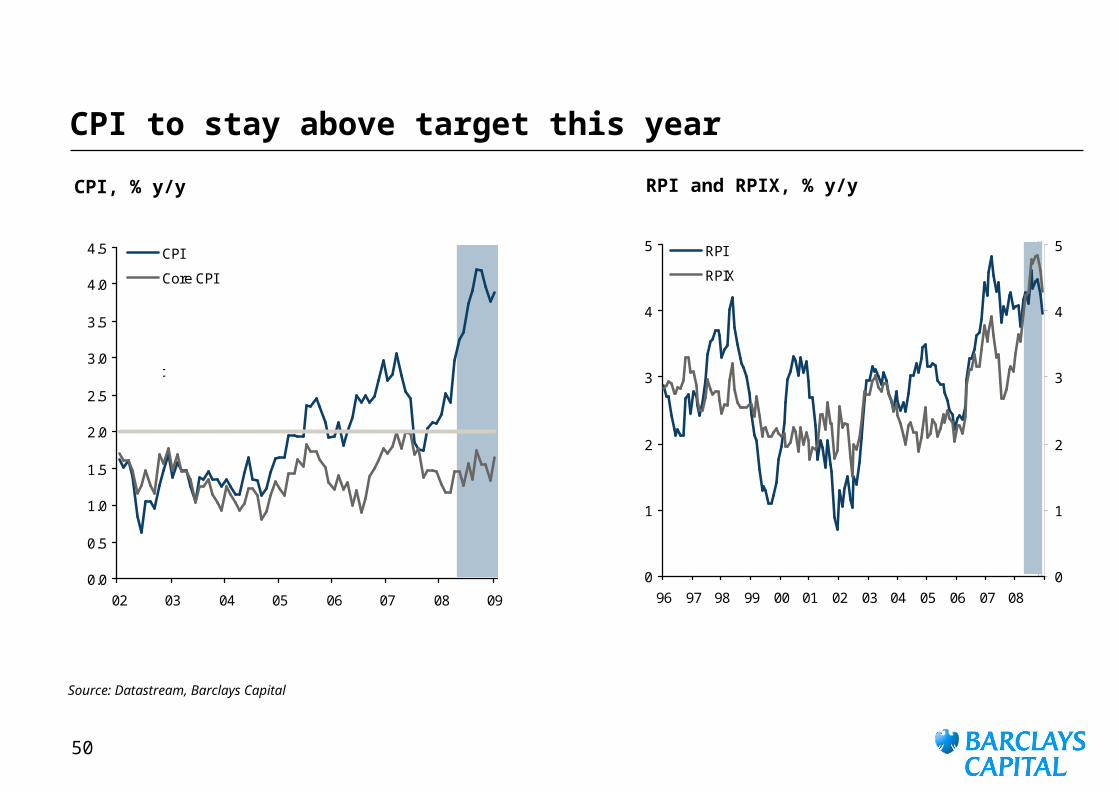
CPI to stay above target this year
RPI and RPIX, % y/yCPI, % y/y
Source: Datastream, Barclays Capital
0.0
0.5
1.0
1.5
2.0
2.5
3.0
3.5
4.0
4.5
02 03 04 05 06 07 08 09
CPI
Core CPI
Target
0
1
2
3
4
5
96 97 98 99 00 01 02 03 04 05 06 07 080
1
2
3
4
5RPI
RPIX
51
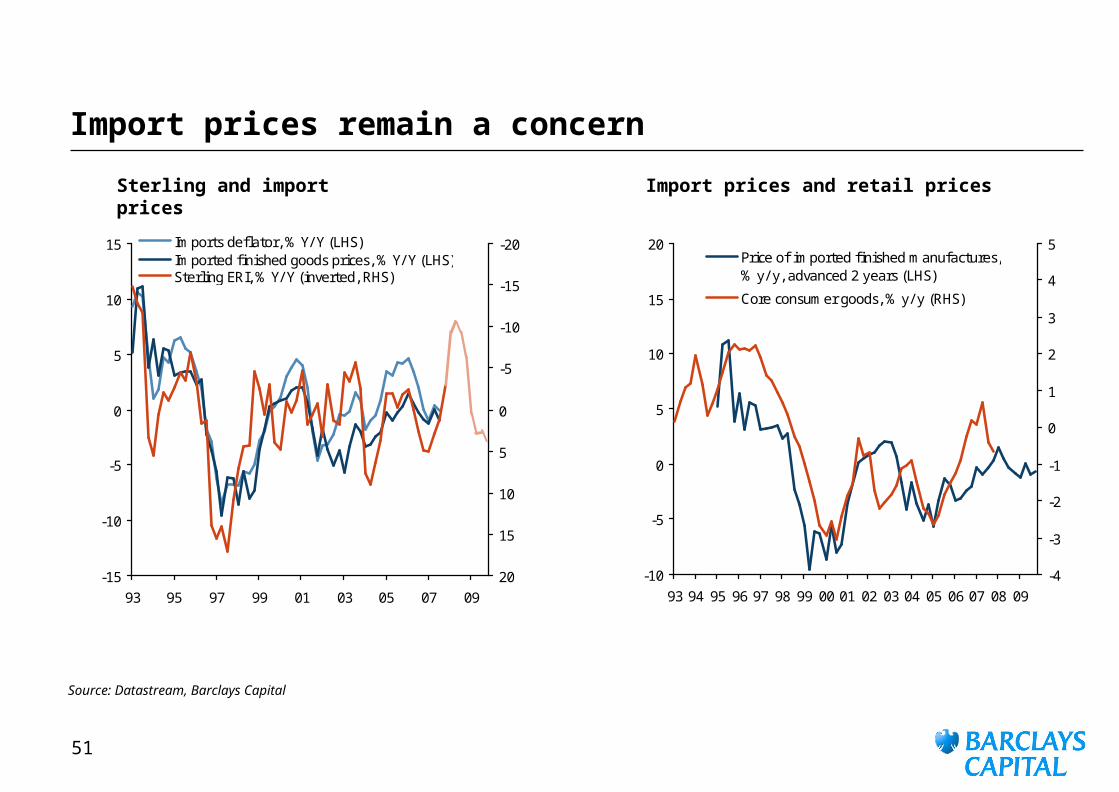
Import prices remain a concern
Import prices and retail pricesSterling and import prices
Source: Datastream, Barclays Capital
-15
-10
-5
0
5
10
15
93 95 97 99 01 03 05 07 09
-20
-15
-10
-5
0
5
10
15
20
Imports deflator, % Y/ Y (LHS)Imported finished goods prices, % Y/ Y (LHS)Sterling ERI, % Y/ Y (inverted, RHS)
BarCap forecast
-10
-5
0
5
10
15
20
93 94 95 96 97 98 99 00 01 02 03 04 05 06 07 08 09-4
-3
-2
-1
0
1
2
3
4
5Price of imported finished manufactures,% y/ y, advanced 2 years (LHS)
Core consumer goods, % y/ y (RHS)
52
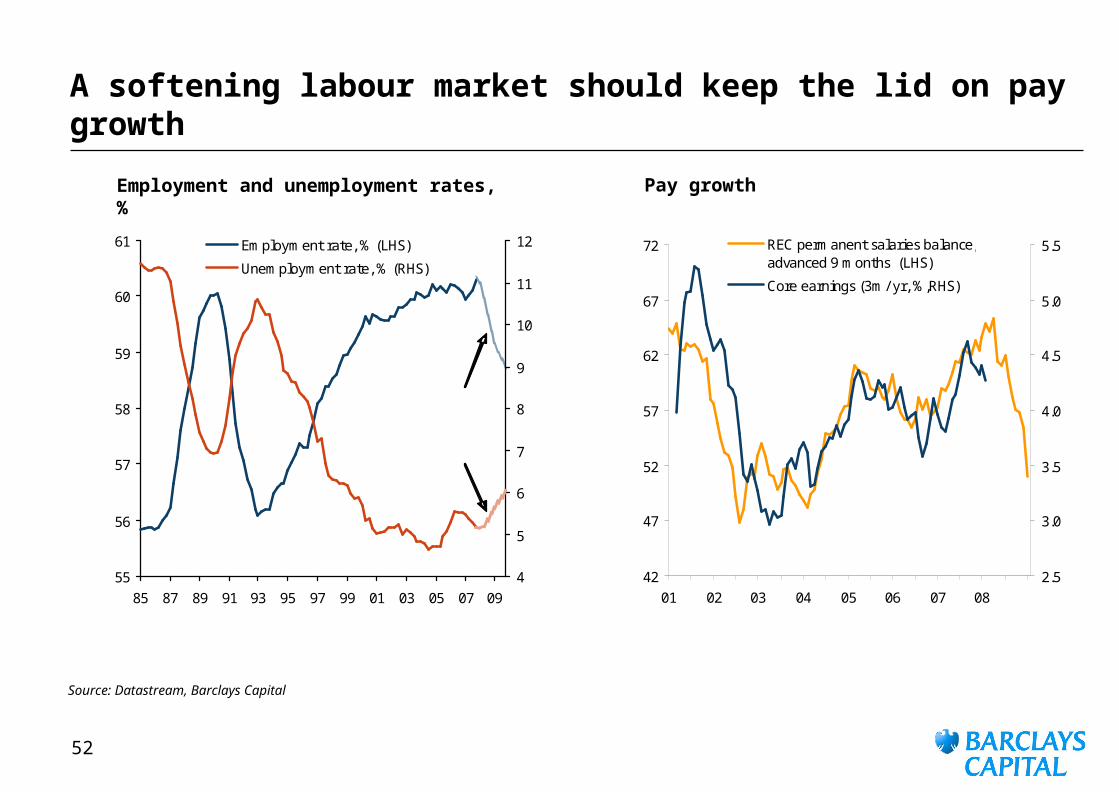
A softening labour market should keep the lid on pay growth
Employment and unemployment rates, %
Pay growth
Source: Datastream, Barclays Capital
55
56
57
58
59
60
61
85 87 89 91 93 95 97 99 01 03 05 07 094
5
6
7
8
9
10
11
12Employment rate, % (LHS)
Unemployment rate, % (RHS)
BarCap forecasts
42
47
52
57
62
67
72
01 02 03 04 05 06 07 082.5
3.0
3.5
4.0
4.5
5.0
5.5REC permanent salaries balance,advanced 9 months (LHS)
Core earnings (3m/ yr, %,RHS)
53
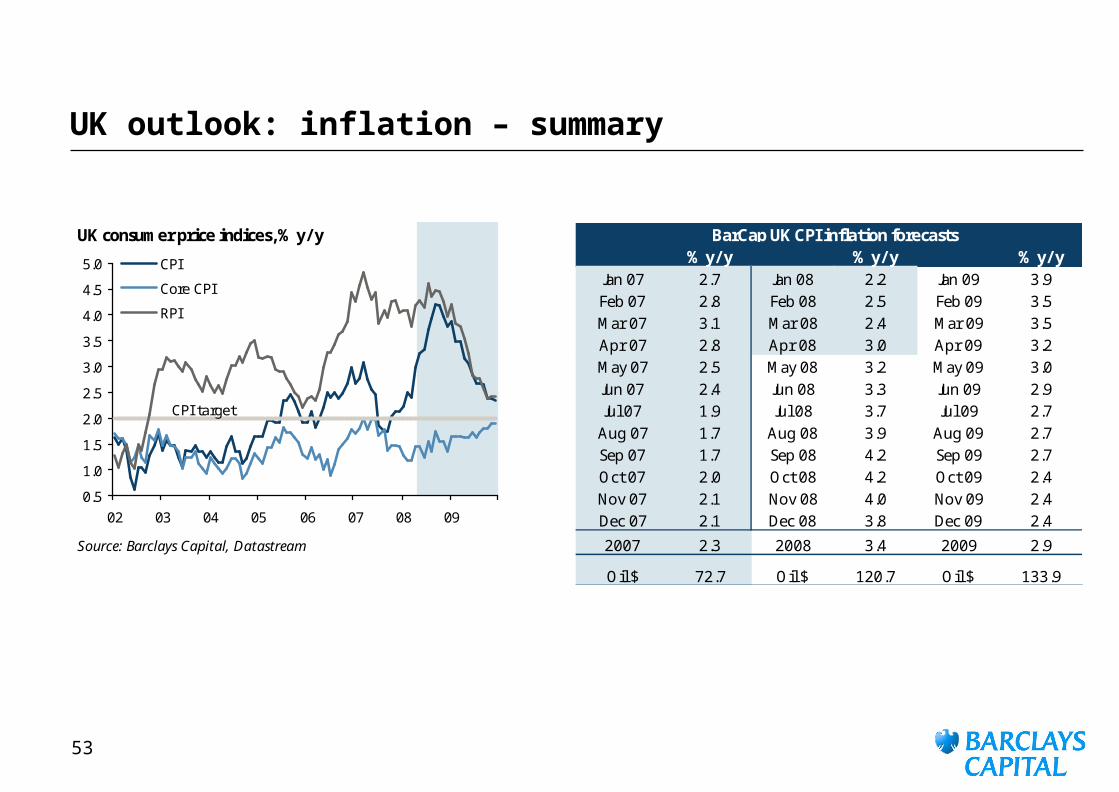
UK outlook: inflation – summary
UK consumer price indices, % y/ y% y/ y % y/ y % y/ y
Jan 07 2.7 Jan 08 2.2 Jan 09 3.9Feb 07 2.8 Feb 08 2.5 Feb 09 3.5Mar 07 3.1 Mar 08 2.4 Mar 09 3.5Apr 07 2.8 Apr 08 3.0 Apr 09 3.2May 07 2.5 May 08 3.2 May 09 3.0Jun 07 2.4 Jun 08 3.3 Jun 09 2.9Jul 07 1.9 Jul 08 3.7 Jul 09 2.7
Aug 07 1.7 Aug 08 3.9 Aug 09 2.7Sep 07 1.7 Sep 08 4.2 Sep 09 2.7Oct 07 2.0 Oct 08 4.2 Oct 09 2.4Nov 07 2.1 Nov 08 4.0 Nov 09 2.4Dec 07 2.1 Dec 08 3.8 Dec 09 2.4
Source: Barclays Capital, Datastream 2007 2.3 2008 3.4 2009 2.9
Oil $ 72.7 Oil $ 120.7 Oil $ 133.9
BarCap UK CPI inflation forecasts
0.5
1.0
1.5
2.0
2.5
3.0
3.5
4.0
4.5
5.0
02 03 04 05 06 07 08 09
CPI
Core CPI
RPI
CPI target
54
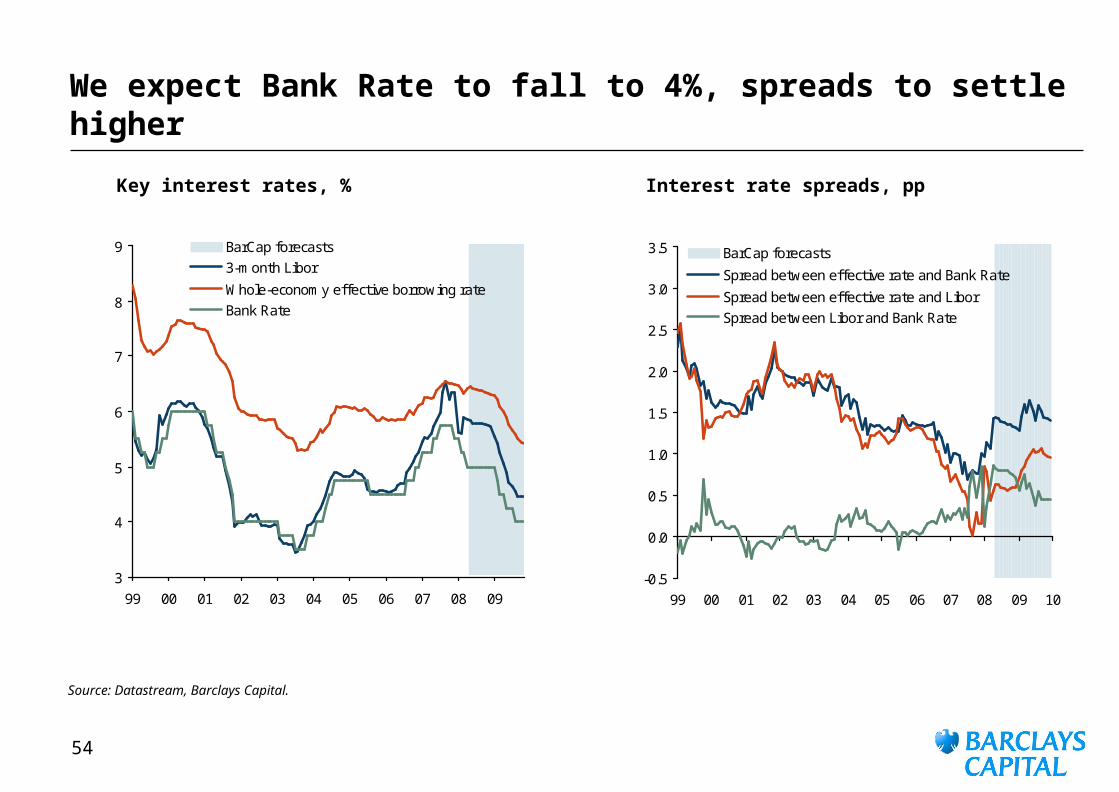
We expect Bank Rate to fall to 4%, spreads to settle higher
Key interest rates, % Interest rate spreads, pp
Source: Datastream, Barclays Capital.
3
4
5
6
7
8
9
99 00 01 02 03 04 05 06 07 08 09
BarCap forecasts3-month Libor
Whole-economy effective borrowing rateBank Rate
-0.5
0.0
0.5
1.0
1.5
2.0
2.5
3.0
3.5
99 00 01 02 03 04 05 06 07 08 09 10
BarCap forecasts
Spread between effective rate and Bank Rate
Spread between effective rate and LiborSpread between Libor and Bank Rate
55
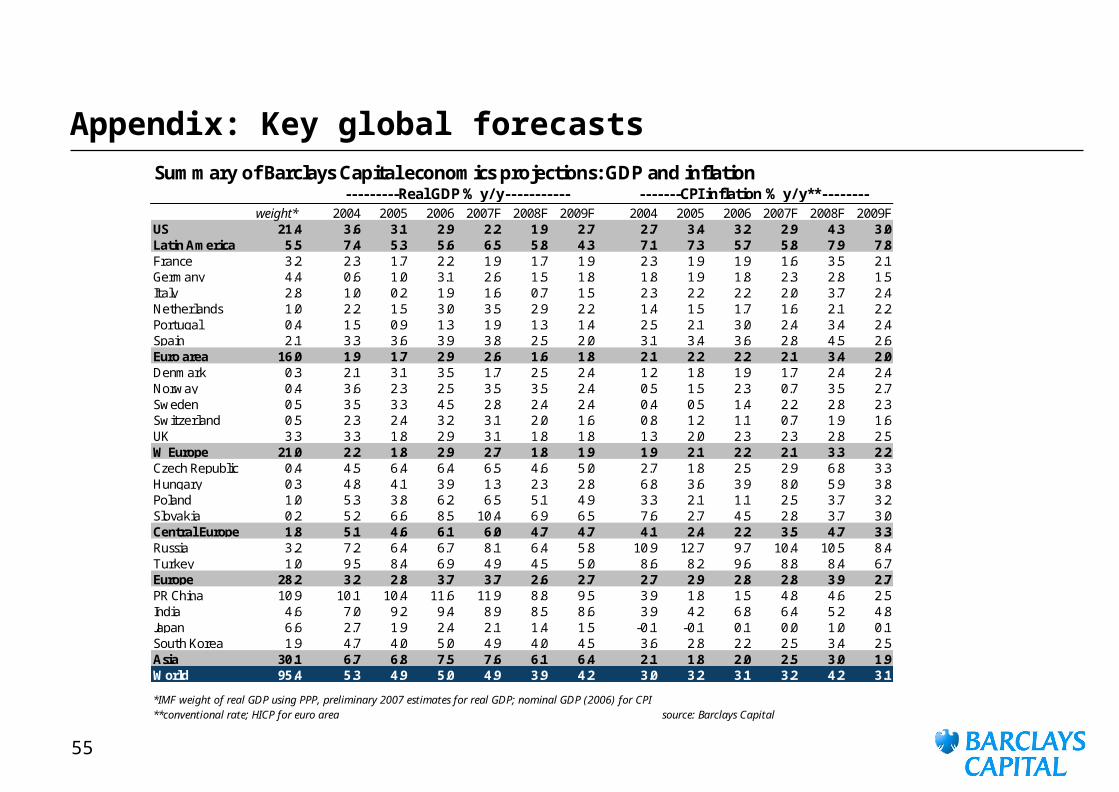
Appendix: Key global forecastsSummary of Barclays Capital economics projections: GDP and inflation
weight* 2004 2005 2006 2007F 2008F 2009F 2004 2005 2006 2007F 2008F 2009FUS 21.4 3.6 3.1 2.9 2.2 1.9 2.7 2.7 3.4 3.2 2.9 4.3 3.0Latin America 5.5 7.4 5.3 5.6 6.5 5.8 4.3 7.1 7.3 5.7 5.8 7.9 7.8France 3.2 2.3 1.7 2.2 1.9 1.7 1.9 2.3 1.9 1.9 1.6 3.5 2.1Germany 4.4 0.6 1.0 3.1 2.6 1.5 1.8 1.8 1.9 1.8 2.3 2.8 1.5Italy 2.8 1.0 0.2 1.9 1.6 0.7 1.5 2.3 2.2 2.2 2.0 3.7 2.4Netherlands 1.0 2.2 1.5 3.0 3.5 2.9 2.2 1.4 1.5 1.7 1.6 2.1 2.2Portugal 0.4 1.5 0.9 1.3 1.9 1.3 1.4 2.5 2.1 3.0 2.4 3.4 2.4Spain 2.1 3.3 3.6 3.9 3.8 2.5 2.0 3.1 3.4 3.6 2.8 4.5 2.6Euro area 16.0 1.9 1.7 2.9 2.6 1.6 1.8 2.1 2.2 2.2 2.1 3.4 2.0Denmark 0.3 2.1 3.1 3.5 1.7 2.5 2.4 1.2 1.8 1.9 1.7 2.4 2.4Norway 0.4 3.6 2.3 2.5 3.5 3.5 2.4 0.5 1.5 2.3 0.7 3.5 2.7Sweden 0.5 3.5 3.3 4.5 2.8 2.4 2.4 0.4 0.5 1.4 2.2 2.8 2.3Switzerland 0.5 2.3 2.4 3.2 3.1 2.0 1.6 0.8 1.2 1.1 0.7 1.9 1.6UK 3.3 3.3 1.8 2.9 3.1 1.8 1.8 1.3 2.0 2.3 2.3 2.8 2.5W Europe 21.0 2.2 1.8 2.9 2.7 1.8 1.9 1.9 2.1 2.2 2.1 3.3 2.2Czech Republic 0.4 4.5 6.4 6.4 6.5 4.6 5.0 2.7 1.8 2.5 2.9 6.8 3.3Hungary 0.3 4.8 4.1 3.9 1.3 2.3 2.8 6.8 3.6 3.9 8.0 5.9 3.8Poland 1.0 5.3 3.8 6.2 6.5 5.1 4.9 3.3 2.1 1.1 2.5 3.7 3.2Slovakia 0.2 5.2 6.6 8.5 10.4 6.9 6.5 7.6 2.7 4.5 2.8 3.7 3.0Central Europe 1.8 5.1 4.6 6.1 6.0 4.7 4.7 4.1 2.4 2.2 3.5 4.7 3.3Russia 3.2 7.2 6.4 6.7 8.1 6.4 5.8 10.9 12.7 9.7 10.4 10.5 8.4Turkey 1.0 9.5 8.4 6.9 4.9 4.5 5.0 8.6 8.2 9.6 8.8 8.4 6.7Europe 28.2 3.2 2.8 3.7 3.7 2.6 2.7 2.7 2.9 2.8 2.8 3.9 2.7PR China 10.9 10.1 10.4 11.6 11.9 8.8 9.5 3.9 1.8 1.5 4.8 4.6 2.5India 4.6 7.0 9.2 9.4 8.9 8.5 8.6 3.9 4.2 6.8 6.4 5.2 4.8Japan 6.6 2.7 1.9 2.4 2.1 1.4 1.5 -0.1 -0.1 0.1 0.0 1.0 0.1South Korea 1.9 4.7 4.0 5.0 4.9 4.0 4.5 3.6 2.8 2.2 2.5 3.4 2.5Asia 30.1 6.7 6.8 7.5 7.6 6.1 6.4 2.1 1.8 2.0 2.5 3.0 1.9World 95.4 5.3 4.9 5.0 4.9 3.9 4.2 3.0 3.2 3.1 3.2 4.2 3.1
*IMF weight of real GDP using PPP, preliminary 2007 estimates for real GDP; nominal GDP (2006) for CPI**conventional rate; HICP for euro area source: Barclays Capital
---------Real GDP % y/y----------- -------CPI inflation % y/ y**--------
56
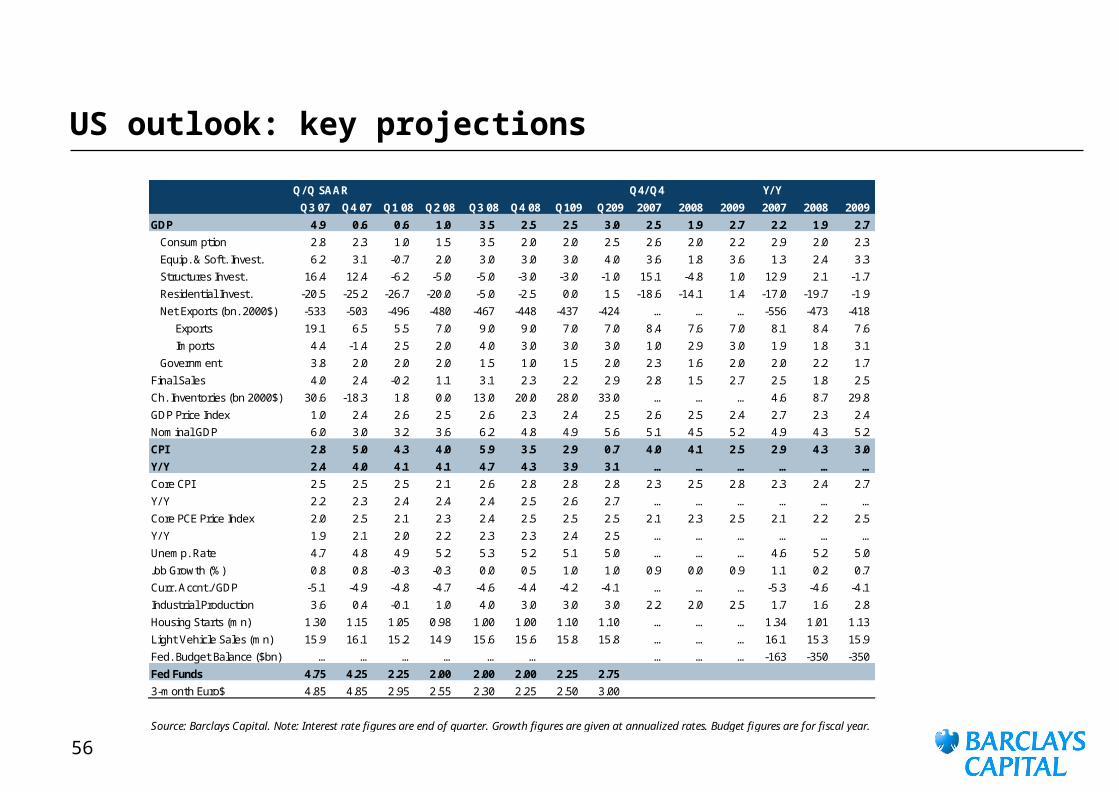
US outlook: key projections
Q/ Q SAAR Q4/ Q4 Y/ Y
Q3 07 Q4 07 Q1 08 Q2 08 Q3 08 Q4 08 Q109 Q209 2007 2008 2009 2007 2008 2009
GDP 4.9 0.6 0.6 1.0 3.5 2.5 2.5 3.0 2.5 1.9 2.7 2.2 1.9 2.7
Consumption 2.8 2.3 1.0 1.5 3.5 2.0 2.0 2.5 2.6 2.0 2.2 2.9 2.0 2.3
Equip. & Soft. Invest. 6.2 3.1 -0.7 2.0 3.0 3.0 3.0 4.0 3.6 1.8 3.6 1.3 2.4 3.3
Structures Invest. 16.4 12.4 -6.2 -5.0 -5.0 -3.0 -3.0 -1.0 15.1 -4.8 1.0 12.9 2.1 -1.7
Residential Invest. -20.5 -25.2 -26.7 -20.0 -5.0 -2.5 0.0 1.5 -18.6 -14.1 1.4 -17.0 -19.7 -1.9
Net Exports (bn. 2000$) -533 -503 -496 -480 -467 -448 -437 -424 … … … -556 -473 -418
Exports 19.1 6.5 5.5 7.0 9.0 9.0 7.0 7.0 8.4 7.6 7.0 8.1 8.4 7.6
Imports 4.4 -1.4 2.5 2.0 4.0 3.0 3.0 3.0 1.0 2.9 3.0 1.9 1.8 3.1
Government 3.8 2.0 2.0 2.0 1.5 1.0 1.5 2.0 2.3 1.6 2.0 2.0 2.2 1.7
Final Sales 4.0 2.4 -0.2 1.1 3.1 2.3 2.2 2.9 2.8 1.5 2.7 2.5 1.8 2.5
Ch. Inventories (bn 2000$) 30.6 -18.3 1.8 0.0 13.0 20.0 28.0 33.0 … … … 4.6 8.7 29.8
GDP Price Index 1.0 2.4 2.6 2.5 2.6 2.3 2.4 2.5 2.6 2.5 2.4 2.7 2.3 2.4
Nominal GDP 6.0 3.0 3.2 3.6 6.2 4.8 4.9 5.6 5.1 4.5 5.2 4.9 4.3 5.2
CPI 2.8 5.0 4.3 4.0 5.9 3.5 2.9 0.7 4.0 4.1 2.5 2.9 4.3 3.0
Y/ Y 2.4 4.0 4.1 4.1 4.7 4.3 3.9 3.1 … … … … … …
Core CPI 2.5 2.5 2.5 2.1 2.6 2.8 2.8 2.8 2.3 2.5 2.8 2.3 2.4 2.7
Y/ Y 2.2 2.3 2.4 2.4 2.4 2.5 2.6 2.7 … … … … … …
Core PCE Price Index 2.0 2.5 2.1 2.3 2.4 2.5 2.5 2.5 2.1 2.3 2.5 2.1 2.2 2.5
Y/ Y 1.9 2.1 2.0 2.2 2.3 2.3 2.4 2.5 … … … … … …
Unemp. Rate 4.7 4.8 4.9 5.2 5.3 5.2 5.1 5.0 … … … 4.6 5.2 5.0
Job Growth (%) 0.8 0.8 -0.3 -0.3 0.0 0.5 1.0 1.0 0.9 0.0 0.9 1.1 0.2 0.7
Curr. Accnt./ GDP -5.1 -4.9 -4.8 -4.7 -4.6 -4.4 -4.2 -4.1 … … … -5.3 -4.6 -4.1
Industrial Production 3.6 0.4 -0.1 1.0 4.0 3.0 3.0 3.0 2.2 2.0 2.5 1.7 1.6 2.8
Housing Starts (mn) 1.30 1.15 1.05 0.98 1.00 1.00 1.10 1.10 … … … 1.34 1.01 1.13
Light Vehicle Sales (mn) 15.9 16.1 15.2 14.9 15.6 15.6 15.8 15.8 … … … 16.1 15.3 15.9
Fed. Budget Balance ($bn) … … … … … … … … … -163 -350 -350
Fed Funds 4.75 4.25 2.25 2.00 2.00 2.00 2.25 2.75
3-month Euro$ 4.85 4.85 2.95 2.55 2.30 2.25 2.50 3.00
Source: Barclays Capital. Note: Interest rate figures are end of quarter. Growth figures are given at annualized rates. Budget figures are for fiscal year.
57
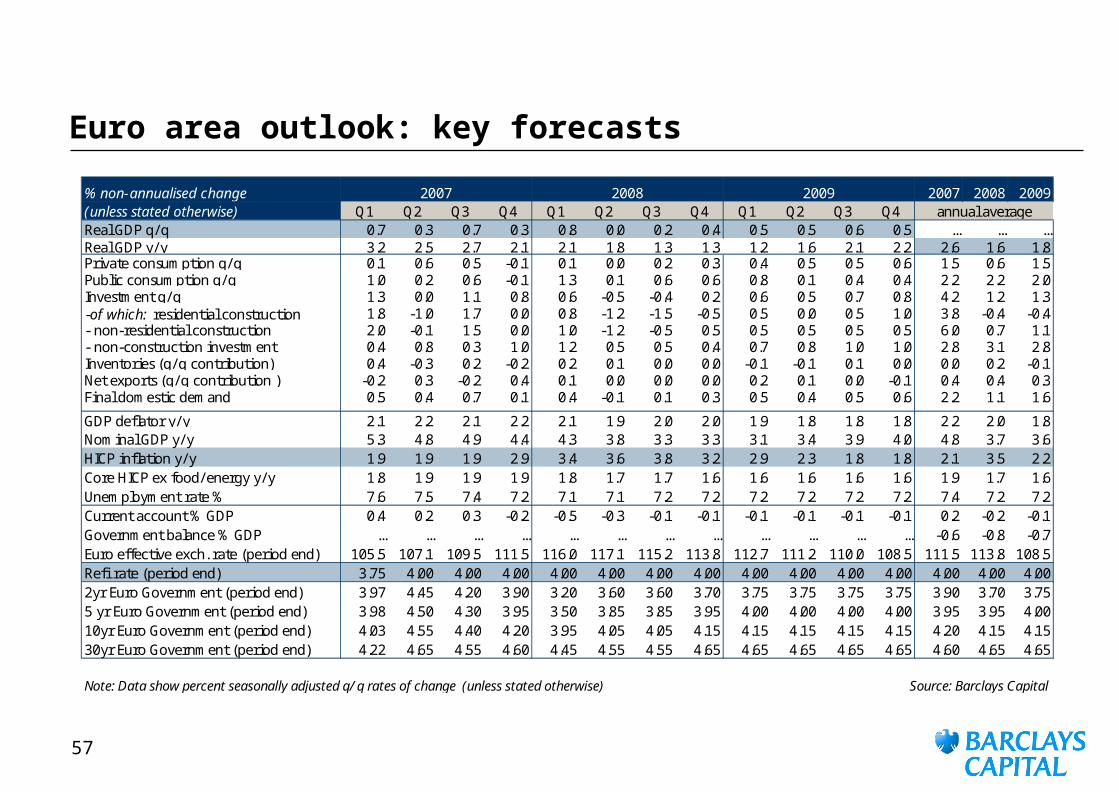
Euro area outlook: key forecasts
% non-annualised change 2007 2008 2009(unless stated otherwise) Q1 Q2 Q3 Q4 Q1 Q2 Q3 Q4 Q1 Q2 Q3 Q4Real GDP q/ q 0.7 0.3 0.7 0.3 0.8 0.0 0.2 0.4 0.5 0.5 0.6 0.5 ... ... ...Real GDP y/ y 3.2 2.5 2.7 2.1 2.1 1.8 1.3 1.3 1.2 1.6 2.1 2.2 2.6 1.6 1.8Private consumption q/ q 0.1 0.6 0.5 -0.1 0.1 0.0 0.2 0.3 0.4 0.5 0.5 0.6 1.5 0.6 1.5Public consumption q/ q 1.0 0.2 0.6 -0.1 1.3 0.1 0.6 0.6 0.8 0.1 0.4 0.4 2.2 2.2 2.0Investment q/ q 1.3 0.0 1.1 0.8 0.6 -0.5 -0.4 0.2 0.6 0.5 0.7 0.8 4.2 1.2 1.3-of which: residential construction 1.8 -1.0 1.7 0.0 0.8 -1.2 -1.5 -0.5 0.5 0.0 0.5 1.0 3.8 -0.4 -0.4- non-residential construction 2.0 -0.1 1.5 0.0 1.0 -1.2 -0.5 0.5 0.5 0.5 0.5 0.5 6.0 0.7 1.1- non-construction investment 0.4 0.8 0.3 1.0 1.2 0.5 0.5 0.4 0.7 0.8 1.0 1.0 2.8 3.1 2.8Inventories (q/ q contribution) 0.4 -0.3 0.2 -0.2 0.2 0.1 0.0 0.0 -0.1 -0.1 0.1 0.0 0.0 0.2 -0.1Net exports (q/ q contribution ) -0.2 0.3 -0.2 0.4 0.1 0.0 0.0 0.0 0.2 0.1 0.0 -0.1 0.4 0.4 0.3Final domestic demand 0.5 0.4 0.7 0.1 0.4 -0.1 0.1 0.3 0.5 0.4 0.5 0.6 2.2 1.1 1.6
GDP deflator y/ y 2.1 2.2 2.1 2.2 2.1 1.9 2.0 2.0 1.9 1.8 1.8 1.8 2.2 2.0 1.8Nominal GDP y/ y 5.3 4.8 4.9 4.4 4.3 3.8 3.3 3.3 3.1 3.4 3.9 4.0 4.8 3.7 3.6HICP inflation y/ y 1.9 1.9 1.9 2.9 3.4 3.6 3.8 3.2 2.9 2.3 1.8 1.8 2.1 3.5 2.2Core HICP ex food/ energy y/ y 1.8 1.9 1.9 1.9 1.8 1.7 1.7 1.6 1.6 1.6 1.6 1.6 1.9 1.7 1.6Unemployment rate % 7.6 7.5 7.4 7.2 7.1 7.1 7.2 7.2 7.2 7.2 7.2 7.2 7.4 7.2 7.2Current account % GDP 0.4 0.2 0.3 -0.2 -0.5 -0.3 -0.1 -0.1 -0.1 -0.1 -0.1 -0.1 0.2 -0.2 -0.1Government balance % GDP ... ... ... ... ... ... ... ... ... ... ... ... -0.6 -0.8 -0.7Euro effective exch. rate (period end) 105.5 107.1 109.5 111.5 116.0 117.1 115.2 113.8 112.7 111.2 110.0 108.5 111.5 113.8 108.5Refi rate (period end) 3.75 4.00 4.00 4.00 4.00 4.00 4.00 4.00 4.00 4.00 4.00 4.00 4.00 4.00 4.002yr Euro Government (period end) 3.97 4.45 4.20 3.90 3.20 3.60 3.60 3.70 3.75 3.75 3.75 3.75 3.90 3.70 3.755 yr Euro Government (period end) 3.98 4.50 4.30 3.95 3.50 3.85 3.85 3.95 4.00 4.00 4.00 4.00 3.95 3.95 4.0010yr Euro Government (period end) 4.03 4.55 4.40 4.20 3.95 4.05 4.05 4.15 4.15 4.15 4.15 4.15 4.20 4.15 4.1530yr Euro Government (period end) 4.22 4.65 4.55 4.60 4.45 4.55 4.55 4.65 4.65 4.65 4.65 4.65 4.60 4.65 4.65
Note: Data show percent seasonally adjusted q/ q rates of change (unless stated otherwise) Source: Barclays Capital
annual average2007 2008 2009
58
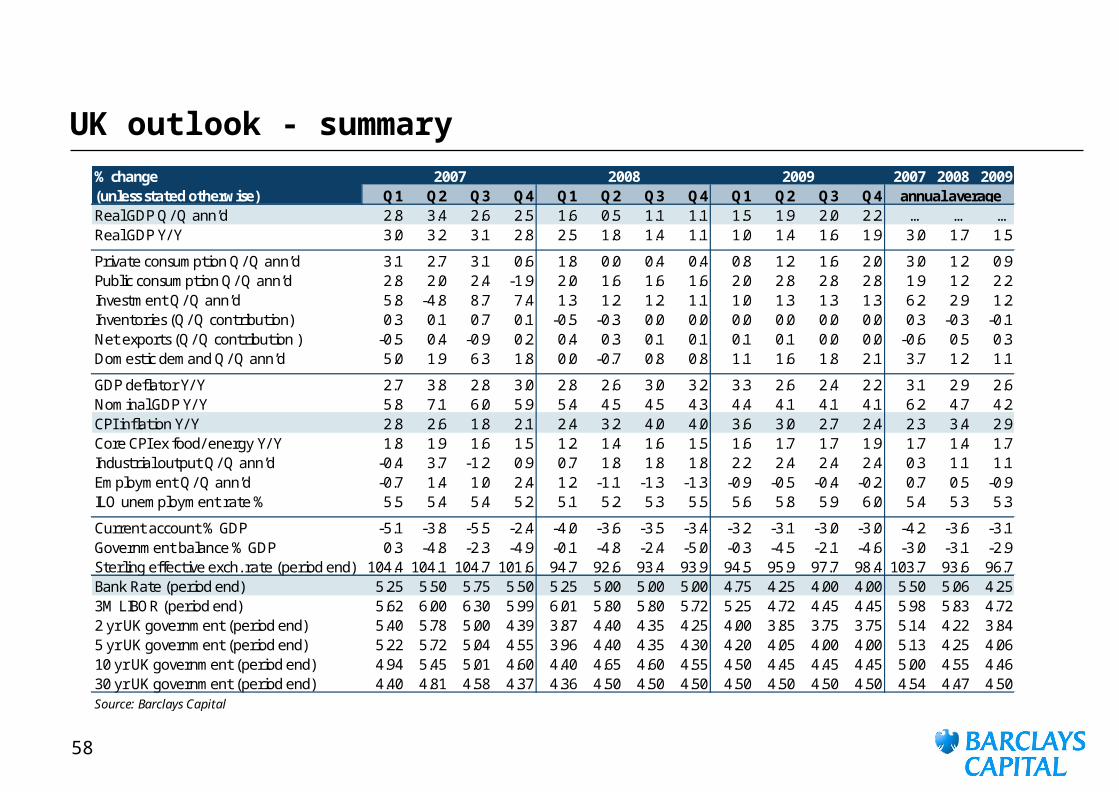
UK outlook - summary% change 2007 2008 2009(unless stated otherwise) Q1 Q2 Q3 Q4 Q1 Q2 Q3 Q4 Q1 Q2 Q3 Q4Real GDP Q/ Q ann’d 2.8 3.4 2.6 2.5 1.6 0.5 1.1 1.1 1.5 1.9 2.0 2.2 … … …Real GDP Y/ Y 3.0 3.2 3.1 2.8 2.5 1.8 1.4 1.1 1.0 1.4 1.6 1.9 3.0 1.7 1.5
Private consumption Q/ Q ann’d 3.1 2.7 3.1 0.6 1.8 0.0 0.4 0.4 0.8 1.2 1.6 2.0 3.0 1.2 0.9Public consumption Q/ Q ann’d 2.8 2.0 2.4 -1.9 2.0 1.6 1.6 1.6 2.0 2.8 2.8 2.8 1.9 1.2 2.2Investment Q/ Q ann’d 5.8 -4.8 8.7 7.4 1.3 1.2 1.2 1.1 1.0 1.3 1.3 1.3 6.2 2.9 1.2Inventories (Q/ Q contribution) 0.3 0.1 0.7 0.1 -0.5 -0.3 0.0 0.0 0.0 0.0 0.0 0.0 0.3 -0.3 -0.1Net exports (Q/ Q contribution ) -0.5 0.4 -0.9 0.2 0.4 0.3 0.1 0.1 0.1 0.1 0.0 0.0 -0.6 0.5 0.3Domestic demand Q/ Q ann’d 5.0 1.9 6.3 1.8 0.0 -0.7 0.8 0.8 1.1 1.6 1.8 2.1 3.7 1.2 1.1
GDP deflator Y/ Y 2.7 3.8 2.8 3.0 2.8 2.6 3.0 3.2 3.3 2.6 2.4 2.2 3.1 2.9 2.6Nominal GDP Y/ Y 5.8 7.1 6.0 5.9 5.4 4.5 4.5 4.3 4.4 4.1 4.1 4.1 6.2 4.7 4.2CPI inflation Y/ Y 2.8 2.6 1.8 2.1 2.4 3.2 4.0 4.0 3.6 3.0 2.7 2.4 2.3 3.4 2.9Core CPI ex food/ energy Y/ Y 1.8 1.9 1.6 1.5 1.2 1.4 1.6 1.5 1.6 1.7 1.7 1.9 1.7 1.4 1.7Industrial output Q/ Q ann’d -0.4 3.7 -1.2 0.9 0.7 1.8 1.8 1.8 2.2 2.4 2.4 2.4 0.3 1.1 1.1Employment Q/ Q ann’d -0.7 1.4 1.0 2.4 1.2 -1.1 -1.3 -1.3 -0.9 -0.5 -0.4 -0.2 0.7 0.5 -0.9ILO unemployment rate % 5.5 5.4 5.4 5.2 5.1 5.2 5.3 5.5 5.6 5.8 5.9 6.0 5.4 5.3 5.3
Current account % GDP -5.1 -3.8 -5.5 -2.4 -4.0 -3.6 -3.5 -3.4 -3.2 -3.1 -3.0 -3.0 -4.2 -3.6 -3.1Government balance % GDP 0.3 -4.8 -2.3 -4.9 -0.1 -4.8 -2.4 -5.0 -0.3 -4.5 -2.1 -4.6 -3.0 -3.1 -2.9Sterling effective exch. rate (period end) 104.4 104.1 104.7 101.6 94.7 92.6 93.4 93.9 94.5 95.9 97.7 98.4 103.7 93.6 96.7Bank Rate (period end) 5.25 5.50 5.75 5.50 5.25 5.00 5.00 5.00 4.75 4.25 4.00 4.00 5.50 5.06 4.253M LIBOR (period end) 5.62 6.00 6.30 5.99 6.01 5.80 5.80 5.72 5.25 4.72 4.45 4.45 5.98 5.83 4.722 yr UK government (period end) 5.40 5.78 5.00 4.39 3.87 4.40 4.35 4.25 4.00 3.85 3.75 3.75 5.14 4.22 3.845 yr UK government (period end) 5.22 5.72 5.04 4.55 3.96 4.40 4.35 4.30 4.20 4.05 4.00 4.00 5.13 4.25 4.0610 yr UK government (period end) 4.94 5.45 5.01 4.60 4.40 4.65 4.60 4.55 4.50 4.45 4.45 4.45 5.00 4.55 4.4630 yr UK government (period end) 4.40 4.81 4.58 4.37 4.36 4.50 4.50 4.50 4.50 4.50 4.50 4.50 4.54 4.47 4.50Source: Barclays Capital
2007 2008annual average
2009
59
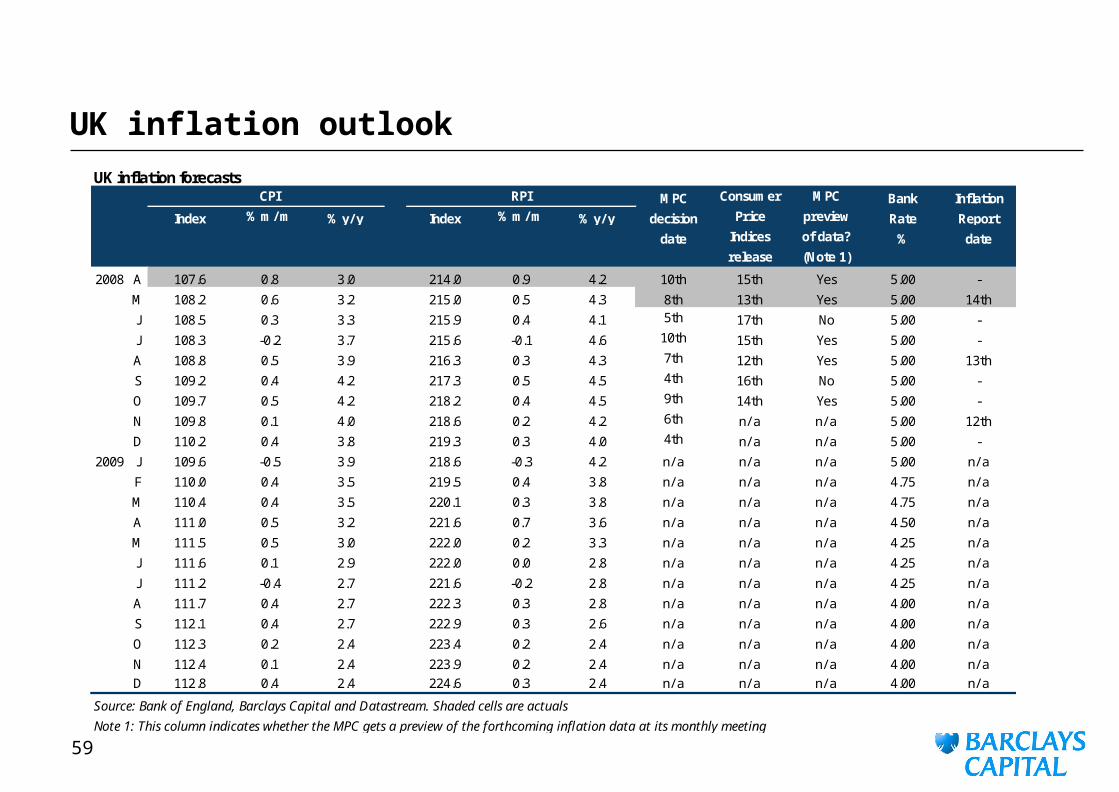
UK inflation outlookUK inflation forecasts
CPI RPI MPC Consumer MPC Bank Inflation
Index % m/ m % y/ y Index % m/ m % y/ y decision Price preview Rate Report
date Indices of data? % daterelease (Note 1)
2008 A 107.6 0.8 3.0 214.0 0.9 4.2 10th 15th Yes 5.00 -
M 108.2 0.6 3.2 215.0 0.5 4.3 8th 13th Yes 5.00 14th
J 108.5 0.3 3.3 215.9 0.4 4.1 5th 17th No 5.00 -
J 108.3 -0.2 3.7 215.6 -0.1 4.6 10th 15th Yes 5.00 -
A 108.8 0.5 3.9 216.3 0.3 4.3 7th 12th Yes 5.00 13th
S 109.2 0.4 4.2 217.3 0.5 4.5 4th 16th No 5.00 -
O 109.7 0.5 4.2 218.2 0.4 4.5 9th 14th Yes 5.00 -
N 109.8 0.1 4.0 218.6 0.2 4.2 6th n/ a n/ a 5.00 12th
D 110.2 0.4 3.8 219.3 0.3 4.0 4th n/ a n/ a 5.00 -
2009 J 109.6 -0.5 3.9 218.6 -0.3 4.2 n/ a n/ a n/ a 5.00 n/ a
F 110.0 0.4 3.5 219.5 0.4 3.8 n/ a n/ a n/ a 4.75 n/ a
M 110.4 0.4 3.5 220.1 0.3 3.8 n/ a n/ a n/ a 4.75 n/ a
A 111.0 0.5 3.2 221.6 0.7 3.6 n/ a n/ a n/ a 4.50 n/ a
M 111.5 0.5 3.0 222.0 0.2 3.3 n/ a n/ a n/ a 4.25 n/ a
J 111.6 0.1 2.9 222.0 0.0 2.8 n/ a n/ a n/ a 4.25 n/ a
J 111.2 -0.4 2.7 221.6 -0.2 2.8 n/ a n/ a n/ a 4.25 n/ a
A 111.7 0.4 2.7 222.3 0.3 2.8 n/ a n/ a n/ a 4.00 n/ a
S 112.1 0.4 2.7 222.9 0.3 2.6 n/ a n/ a n/ a 4.00 n/ a
O 112.3 0.2 2.4 223.4 0.2 2.4 n/ a n/ a n/ a 4.00 n/ a
N 112.4 0.1 2.4 223.9 0.2 2.4 n/ a n/ a n/ a 4.00 n/ aD 112.8 0.4 2.4 224.6 0.3 2.4 n/ a n/ a n/ a 4.00 n/ a
Source: Bank of England, Barclays Capital and Datastream. Shaded cells are actuals
Note 1: This column indicates whether the MPC gets a preview of the forthcoming inflation data at its monthly meeting
60
Disclaimer
For disclosures on issuers in this report see:
https://ecommerce.barcap.com/research/cgi-bin/public/disclosuresSearch.pl
The persons named as the authors of this report hereby certify that: (i) all of the views expressed in the research report accurately reflect the personal views of the authors about the subject securities and issuers; and (ii) no part of their compensation was, is, or will be, directly or indirectly, related to the specific recommendations or views expressed in the research report.
Investors should assume that Barclays Capital intends to seek investment banking or other business relationships for which it will receive compensation from the companies that are the subject of this report.
IRS Circular 230 Prepared Materials Disclaimer: Barclays Capital and its affiliates do not provide tax advice and nothing contained herein should be construed to be tax advice. Please be advised that any discussion of U.S. tax matters contained herein (including any attachments) (i) is not intended or written to be used, and cannot be used, by you for the purpose of avoiding U.S. tax-related penalties; and (ii) was written to support the promotion or marketing of the transactions or other matters addressed herein. Accordingly, you should seek advice based on your particular circumstances from an independent tax advisor.
This publication has been prepared by Barclays Capital (‘Barclays Capital’) - the investment banking division of Barclays Bank PLC. This publication is provided to you for information purposes only. Prices shown in this publication are indicative and Barclays Capital is not offering to buy or sell or soliciting offers to buy or sell any financial instrument. The information contained in this publication has been obtained from sources that Barclays Capital believes are reliable but we do not represent or warrant that it is accurate or complete. The views in this publication are those of Barclays Capital and are subject to change, and Barclays Capital has no obligation to update its opinions or the information in this publication. Barclays Capital and its affiliates and their respective officers, directors, partners and employees, including persons involved in the preparation or issuance of this document, may from time to time act as manager, co-manager or underwriter of a public offering or otherwise, in the capacity of principal or agent, deal in, hold or act as market-makers or advisors, brokers or commercial and/or investment bankers in relation to the securities or related derivatives which are the subject of this publication.
Neither Barclays Capital, nor any affiliate, nor any of their respective officers, directors, partners, or employees accepts any liability whatsoever for any direct or consequential loss arising from any use of this publication or its contents. The securities discussed in this publication may not be suitable for all investors. Barclays Capital recommends that investors independently evaluate each issuer, security or instrument discussed in this publication, and consult any independent advisors they believe necessary. The value of and income from any investment may fluctuate from day to day as a result of changes in relevant economic markets (including changes in market liquidity). The information in this publication is not intended to predict actual results, which may differ substantially from those reflected.
This communication is being made available in the UK and Europe to persons who are investment professionals as that term is defined in Article 19 of the Financial Services and Markets Act 2000 (Financial Promotion Order) 2005. It is directed at persons who have professional experience in matters relating to investments. The investments to which it relates are available only to such persons and will be entered into only with such persons. Barclays Capital - the investment banking division of Barclays Bank PLC, authorised and regulated by the Financial Services Authority (‘FSA’) and member of the London Stock Exchange.
BARCLAYS CAPITAL INC. IS DISTRIBUTING THIS MATERIAL IN THE UNITED STATES AND, IN CONNECTION THEREWITH, ACCEPTS RESPONSIBILITY FOR ITS CONTENTS. ANY U.S. PERSON WISHING TO EFFECT A TRANSACTION IN ANY SECURITY DISCUSSED HEREIN SHOULD DO SO ONLY BY CONTACTING A REPRESENTATIVE OF BARCLAYS CAPITAL INC. IN THE U.S., 200 Park Avenue, New York, New York 10166.
ABSA CAPITAL IS DISTRIBUTING THIS MATERIAL IN SOUTH AFRICA AND, IN CONNECTION THEREWITH, ACCEPTS RESPONSIBILITY FOR ITS CONTENTS. ANY SOUTH AFRICAN PERSON OR ENTITY WISHING TO EFFECT A TRANSACTION IN ANY SECURITY DISCUSSED HEREIN SHOULD DO SO ONLY BY CONTACTING A REPRESENTATIVE OF ABSA CAPITAL IN SOUTH AFRICA, ABSA TOWERS NORTH, 180 COMMISSIONER STREET, JOHANNESBURG, 2001. ABSA CAPITAL IS AN AFFILIATE OF BARCLAYS CAPITAL.
Non-U.S. persons should contact and execute transactions through a Barclays Bank PLC branch or affiliate in their home jurisdiction unless local regulations permit otherwise.
Barclays Bank PLC Frankfurt Branch is distributing this material in Germany under the supervision of Bundesanstalt fuer Finanzdienstleistungsaufsicht.
© Copyright Barclays Bank PLC (2008). All rights reserved. No part of this publication may be reproduced in any manner without the prior written permission of Barclays Capital. Barclays Bank PLC is registered in England No. 1026167. Registered office 1 Churchill Place, London, E14 5HP.
Additional information regarding this publication will be furnished upon request.


