Global Economic Prospects 2004: Realizing the Development Promise of the Doha Agenda. Mick Riordan and Richard Newfarmer World Bank. Sept 3, 2003. Main messages…. Global recovery, though still fragile, is now underway, and developing countries are likely to grow faster than rich countries. - PowerPoint PPT Presentation
Global Economic Prospects 2004: Global Economic Prospects 2004: Realizing the Development Realizing the Development Promise Promise of the Doha Agenda of the Doha Agenda Sept 3, 2003 Mick Riordan and Richard Newfarmer World Bank
Transcript
Global Economic Prospects 2004:Global Economic Prospects 2004:
Realizing the Development Realizing the Development PromisePromise
of the Doha Agendaof the Doha Agenda
Sept 3, 2003
Mick Riordan and Richard NewfarmerWorld Bank
Global recovery, though still fragile, is now underway, and developing countries are likely to grow faster than rich countries.
The Doha Agenda has the potential to speed growth, raise incomes, and reduce poverty, and all countries have an interest in its success.
But to realize this potential, governments have to tackle inequities in the world trading system – and to forge an agreement than benefits the poor.
Main messages…Main messages…
0
1
2
3
4
5
1981 82 83 84 85 86 87 88 89
1990 91 92 93 94 95 96 97 98 99
2000 1 2 3 4
2005
Early 1990s recession
East Asia financial crisis
2001 downturn
The rich countries: a moderate recovery...The rich countries: a moderate recovery...Real GDP, percent changeReal GDP, percent change
Early 1980s recession
High income countriesHigh income countries
ForecastForecast
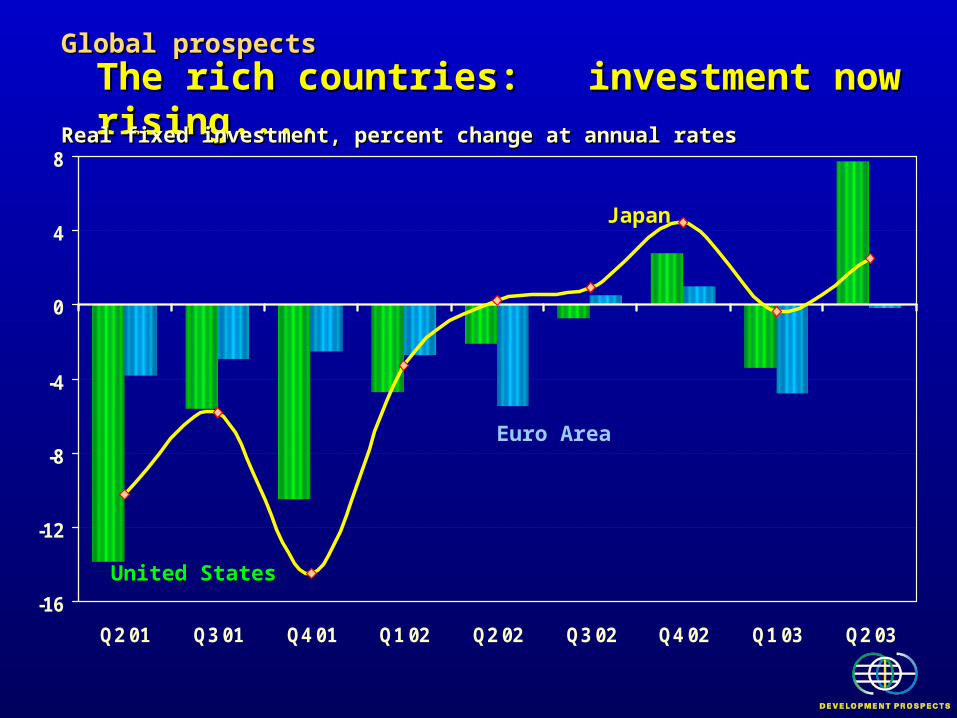
The rich countries: investment now rising....The rich countries: investment now rising....Global prospectsGlobal prospects
Real fixed investment, percent change at annual ratesReal fixed investment, percent change at annual rates
Longer-term structural problems persist in the rich countries
Potential for additional geopolitical shocks
And macro policy has largely run its course— may be insufficient to meet new challenges
- Interest rates at lows - Fiscal deficits widen across
the rich countries
Global prospectsGlobal prospects
... But risks remain... But risks remain
-8.0
-7.0
-6.0
-5.0
-4.0
-3.0
-2.0
-1.0
0.0
Germany United States Japan
General government financial balances, % GDPGeneral government financial balances, % GDP
Source: OECD data and projections.
20012001
20022002 20032003
Global prospectsGlobal prospects
... But risks remain... But risks remainGeneral government financial balances, % GDPGeneral government financial balances, % GDP
Source: OECD data and projections.
20012001
20022002 20032003
Longer-term structural problems persist in the rich countries
Potential for additional geopolitical shocks
And macro policy has largely run its course— may be insufficient to meet new challenges
- Interest rates at lows - Fiscal deficits widen across
the rich countries
Hence, addressing the structural issues is key
-8.0
-7.0
-6.0
-5.0
-4.0
-3.0
-2.0
-1.0
0.0
Germany United States Japan
0
1
2
3
4
5
Early 1980s debt crisis
1990s recession Transition countries
East Asia financial crisis
2001 Global downturn
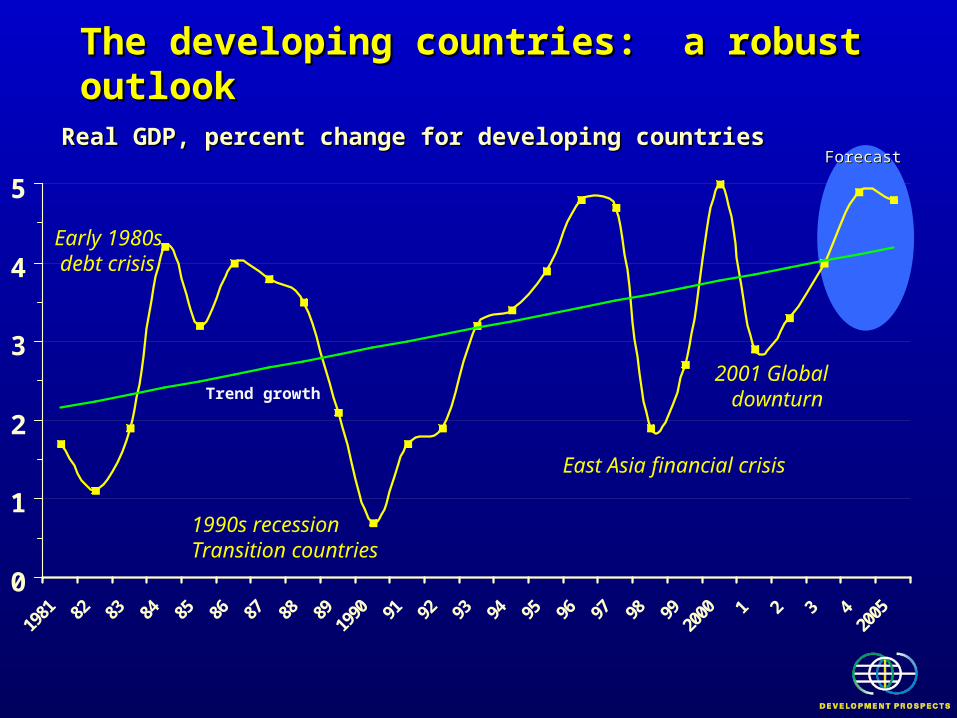
Real GDP, percent change for developing countriesReal GDP, percent change for developing countriesForecastForecast
The developing countries: a robust outlook The developing countries: a robust outlook
0
1
2
3
4
5
Early 1980s debt crisis
1990s recession Transition countries
East Asia financial crisis
2001 Global downturn
The developing countries: a robust outlook The developing countries: a robust outlook
Real GDP, percent change for developing countriesReal GDP, percent change for developing countries
Trend growth
ForecastForecast
6.1
-0.2
3.2 3.0
6.5
5.4
4.3
3.13.5 3.4
4.6
3.4
-1.0
0.5
2.0
3.5
5.0
6.5
East Asia South Asia East. Eur. &Central Asia
LatinAmerica
Middle East& NorthAfrica
Sub-SaharanAfrica
2001-2002 2003-2005
Global prospectsGlobal prospects
Real GDP growth, 2001-2005Real GDP growth, 2001-2005
Near-term step up in growth across regions... Near-term step up in growth across regions...
Global prospectsGlobal prospects
Real GDP Real GDP per capitaper capita growth, 1990s and 2006-2015 growth, 1990s and 2006-2015
... and improved per-capita growth longer term ... and improved per-capita growth longer term
6.4
3.3
1.71.2
-0.2
5.4
4.13.3
2.5 2.5
1.6
-1.8-2.5
-1.0
0.5
2.0
3.5
5.0
6.5
East Asia South Asia East. Eur. &Central Asia
LatinAmerica
Middle East& NorthAfrica
Sub-SaharanAfrica
1990s 2006-2015
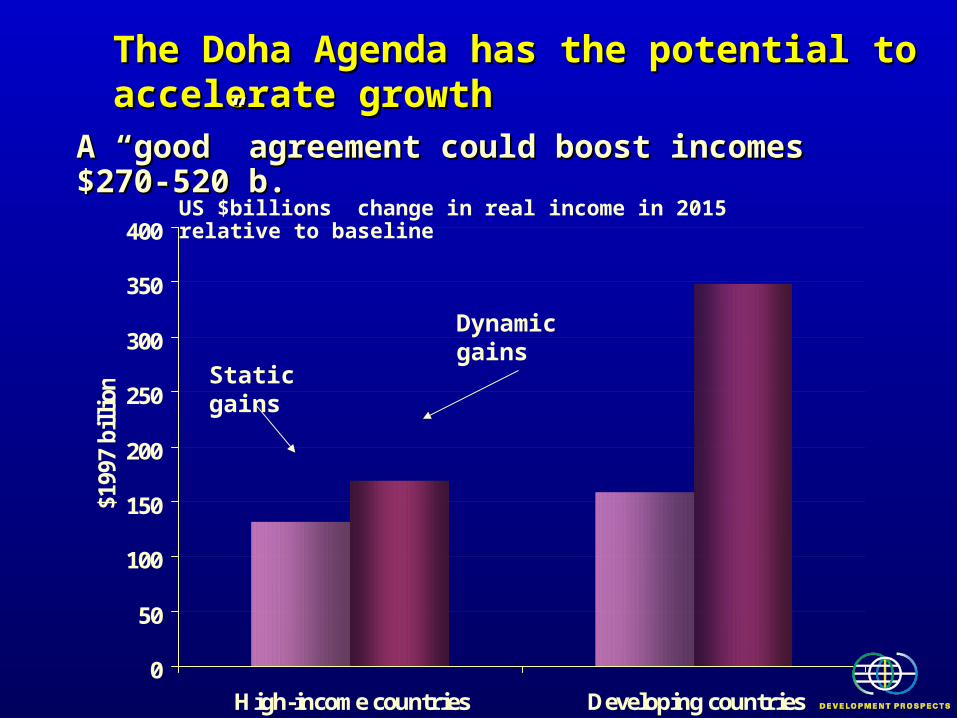
The Doha Agenda has the potential to The Doha Agenda has the potential to accelerate growth accelerate growth
0
50
100
150
200
250
300
350
400
High-income countries Developing countries
$199
7 bi
llion
Static gains
Dynamic gains
US $billions change in real income in 2015 relative to baseline
A “good” agreement could boost incomes $270-520 b. A “good” agreement could boost incomes $270-520 b.
More people would be lifted above the More people would be lifted above the poverty line…140 million…many in Africapoverty line…140 million…many in Africa
0
10
20
30
40
50
60
70
East Asiaand Pacific
Europe andCentral Asia
LatinAmerica and
theCaribbean
Middle Eastand North
Africa
South Asia Sub-SaharanAfrica
Mill
ions
Source: World Bank staff simulations.
change in the number of poor in 2015 relative to the baseline
$1 per day$1 per day
$2 per day$2 per day
Agriculture is a priority, particularly reducing border protection and subsidies in rich countries
Reducing protection on manufactures, particularly in the South
Helping low-income countries reduce reliance on trade preferences and increase competitiveness exports
But to realize development promise, an But to realize development promise, an agreement has to reduce barriers to the agreement has to reduce barriers to the products the poor produceproducts the poor produce
Developing countries have failed to penetrate agricultural markets of rich countries
0
5
10
15
20
25
30
1980 1990 2000
Exports to poor countriesExports to poor countries
Exports to rich countriesExports to rich countries
0
5
10
15
20
25
30
1980 1990 2000
Developing countries’ share of total world exportsDeveloping countries’ share of total world exports
ManufacturingManufacturing AgricultureAgriculture
Exports to rich countriesExports to rich countries
Exports to poor countriesExports to poor countries
Protection in rich countries is high and unchanged since Protection in rich countries is high and unchanged since the Uruguay round…the Uruguay round…
Industrial countries: Producer SupportIndustrial countries: Producer Support
Direct subsidies
* As a percent of output at world pricesSource: OECD
perc
e nt *
Border protection
0
50
100
150
200
250
300
86-88 99-01 86-88 99-01 86-88 99-01Other
industrialEU US Japan
86-88 99-01
Protection in rich countries is high and unchanged since Protection in rich countries is high and unchanged since the Uruguay round…though developing countries have the Uruguay round…though developing countries have reduced barriersreduced barriers
Developing countries: average tariffs for Developing countries: average tariffs for agricultureagriculture
Industrial countries: Producer Support EstimateIndustrial countries: Producer Support Estimate
Direct subsidies
* As a percent of output at world pricesSource: OECD
perc
e nt *
perc
e nt
Border protection
0
50
100
150
200
250
300
86-88 99-01 86-88 99-01 86-88 99-01Other
industrialEU US Japan
86-88 99-01
Source: TRAINS
0
50
100
150
200
250
300
1990 1995 2000
Rich countries levy higher tariffs on imports Rich countries levy higher tariffs on imports from developing countriesfrom developing countries
0123456789
Industrial LatinAmerica
andCaribbean
Sub-SaharanAfrica
East Asia Europeand
CentralAsia
MiddleEast
SouthAsia
Av tariffs of industrial countries charged to exporters Av tariffs of industrial countries charged to exporters from various regions, 1997 (percent)from various regions, 1997 (percent)
……and so do other developing countriesand so do other developing countries
0
5
10
15
20
25
East Asia Europeand
CentralAsia
LatinAmerica
MiddleEast
SouthAsia
Sub-SaharanAfrica
Industrial
Protection rates faced by Latin American exporters of manufactures, 1997
percent
Developing countries pay more of their foreign Developing countries pay more of their foreign tariffs to rich countries and to neighborstariffs to rich countries and to neighbors
0102030405060708090
100
Industrial East Asia Europe andCentral
Asia
LatinAmerica
andCaribbean
Middle Eastand North
Africa
South Asia Sub-SaharanAfrica
Share of tariff burden, percent
Rest of worldRest of world
Intra-regionIntra-region
IndustrialIndustrial
Developing countries have an interest in reducing protection Developing countries have an interest in reducing protection in the South as well as the Northin the South as well as the North
Share of LDCs in EU and US imports, 1966–2002 (percent)
Low income countries have relied too much Low income countries have relied too much on trade preferences..with only marginal on trade preferences..with only marginal successsuccess
Share of LDCs in EU and US imports, 1966–2002 (percent)
Low income countries have relied too much Low income countries have relied too much on trade preferences..with only marginal on trade preferences..with only marginal successsuccess
0.0%
0.2%0.4%
0.6%0.8%
1.0%
1.2%1.4%
1.6%1.8%
2.0%
1996 1997 1998 1999 2000 2001 2002
CBI
AGOA
Andean
Share of preferential programs in US imports, 1966–2002 (percent)
Improving trade logistics can be as Improving trade logistics can be as important as cutting tariffs…ports, customs, important as cutting tariffs…ports, customs, transporttransport
0 2 4 6 8 10 12
South Asia
Africa
Latin Americaand Caribbean
East Asia andPacific
Developed
Average number of days to clear customs for sea cargo
Source: International Exhibition Logistics Associates, based on a sample of countries in each region
Development assistance is key to improving ports, customsDevelopment assistance is key to improving ports, customsand trade infrastructureand trade infrastructure
For the development promise of the Doha For the development promise of the Doha agenda to be realized, all countries have to agenda to be realized, all countries have to take responsibilitytake responsibility
Rich countries have to lead in agriculture, labor- intensive manufactures, and development assistance as well as in services (mode 4)
Middle-income countries have to be willing to lower high external tariffs—benefiting themselves and their neighbors
Low-income countries have to rely less on preferences and reform trade-related institutions.
Global Economic Prospects 2004:Global Economic Prospects 2004:
Realizing the Development Realizing the Development PromisePromise