18
www.futuresource-consulting.com GLOBAL ED TECH DEVELOPMENTS IN 2014 18 th March 2015 Spending trends and key market developments Presenters: Mike Fisher Colin Messenger [email protected]

www.futuresource-consulting.com
GLOBAL ED TECH DEVELOPMENTS IN 2014
18th March 2015
Spending trends and key market developments
Presenters: Mike Fisher
Colin Messenger
| Futuresource Introduction
| Global Spend On Education Hardware in 2014
| Interactive Display Developments
| Computing in K-12 Developments
| Focus on Classroom Collaboration
| Questions
2 | © 2015 Futuresource Consulting Ltd
AGENDA
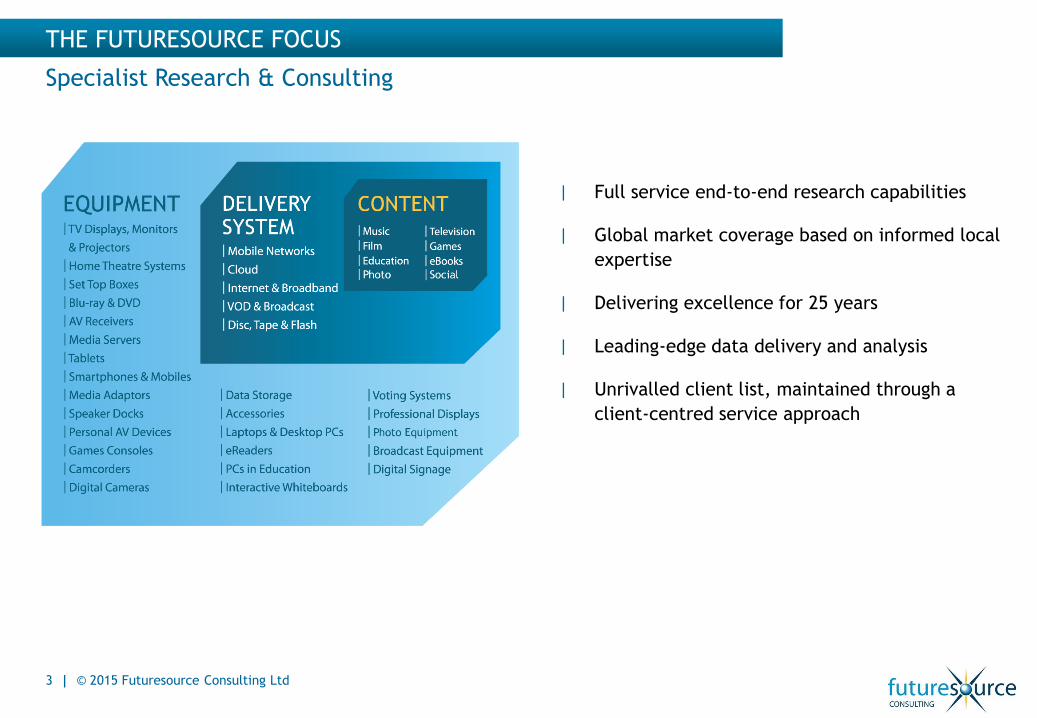
| Full service end-to-end research capabilities
| Global market coverage based on informed local
expertise
| Delivering excellence for 25 years
| Leading-edge data delivery and analysis
| Unrivalled client list, maintained through a
client-centred service approach
THE FUTURESOURCE FOCUS
Specialist Research & Consulting
3 | © 2015 Futuresource Consulting Ltd

6.18.1
9.4 10.2 10.5 10.6 11.5 12.3
4.5
4.3
5.25.0 4.6 4.2
4.13.8
0.6
0.5
0.40.3 0.3 0.2
0.20.2
0
2
4
6
8
10
12
14
16
18
2012 2013 2014 2015 2016 2017 2018 2019
Billions
ComplementaryDevices
ClassroomDisplays
Mobile PCs
11.2
12.9
14.915.5 15.115.3 15.7
16.3
GLOBAL K-12 EDUCATION HARDWARE SPEND
Total 2014 Worldwide Spend On Education Hardware – US$ 14.9 billion
4 | © 2015 Futuresource Consulting Ltd
# Market Value represents End User price excluding Tax
# Mobile PCs includes Notebooks, Netbooks, Chromebooks and Tablets purchased by institutions (not including ‘Bring Your Own’)
# Complementary devices includes Visualisers, Voting handsets, Voice Amplification, Lectern Panels and Education Slates

GLOBAL EDUCATION TECHNOLOGY SPEND - OVERVIEW 2014
Mobile PCs
$9.4 Bn
Classroom Displays
$5.2 BnIncluding:
IWB,
IFPD,
Interactive Projectors,
Projectors,
Attachment Devices,
Complementary Devices
$369mIncluding:
Visualisers,
Lectern Panels,
Voice Amplification,
Voting Systems,
Education Slates/Tablets
Mobile PC Account For 63% Of The Market
63%
35%
2%
5 | © 2015 Futuresource Consulting Ltd

INTERACTIVE DISPLAY MARKET REMAINS RESILIENT
Volumes To Decrease Slightly in 2015 But Value Increased By 19%
751
866
1,0
38
1,3
03
1,3
20
1,2
93
1,2
78
1,1
96
1,0
42
1,0
35
1,0
15
1.09
1.23
1.42
1.92
2.24
2.682.79
2.46
2.24 2.222.09
0.0
0.5
1.0
1.5
2.0
2.5
3.0
0
400
800
1,200
1,600
2,000
Valu
e –
Billions
(US$)
Volu
mes
-M
illions
Annual sales
Value $ M
6 | © 2015 Futuresource Consulting Ltd
# Market Value represents End User price excluding Tax
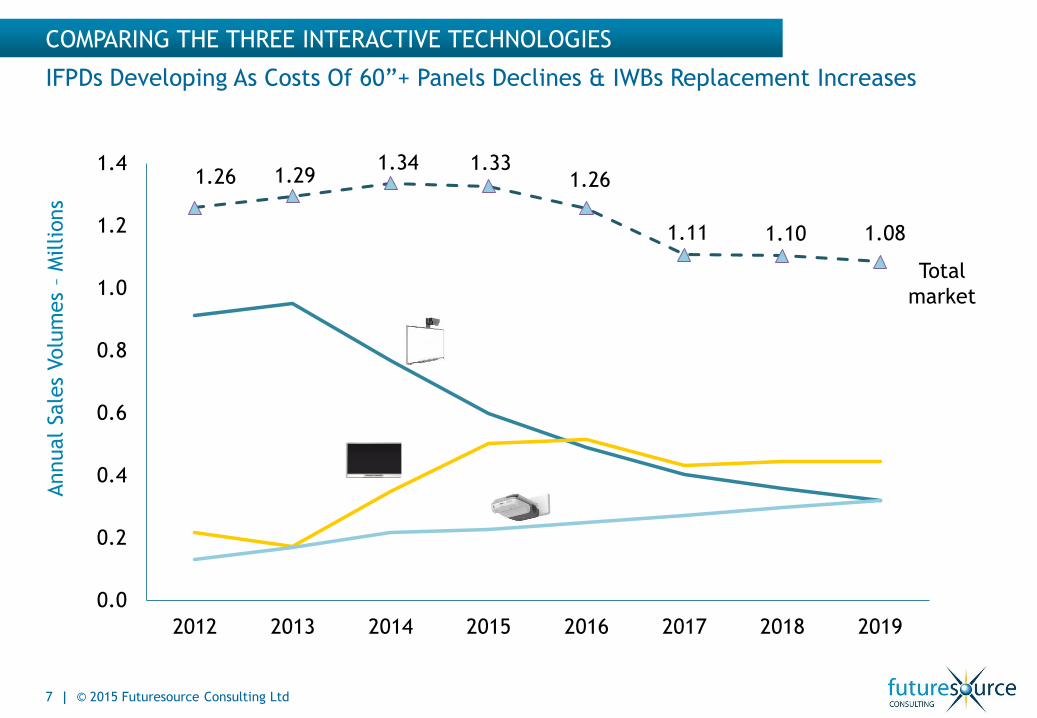
COMPARING THE THREE INTERACTIVE TECHNOLOGIES
1.26 1.291.34 1.33
1.26
1.11 1.10 1.08
0.0
0.2
0.4
0.6
0.8
1.0
1.2
1.4
2012 2013 2014 2015 2016 2017 2018 2019
Annual
Sale
s Volu
mes
–M
illions
7 | © 2015 Futuresource Consulting Ltd
IFPDs Developing As Costs Of 60”+ Panels Declines & IWBs Replacement Increases
Total
market
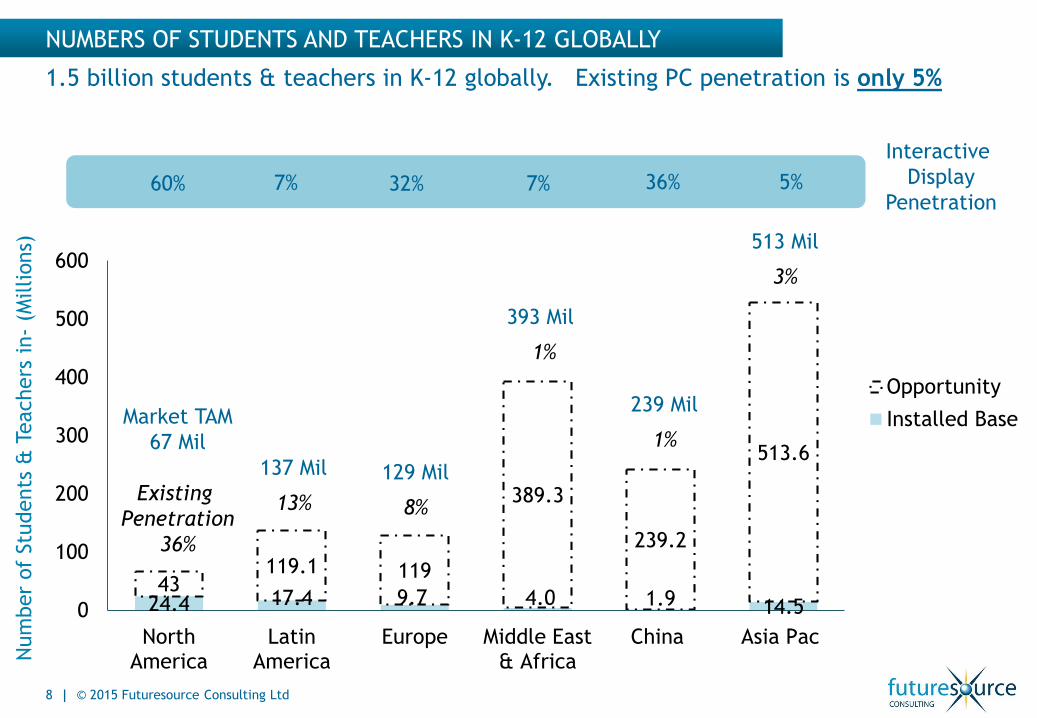
24.4 17.4 9.7 4.0 1.9 14.543
119.1 119
389.3
239.2
513.6
0
100
200
300
400
500
600
NorthAmerica
LatinAmerica
Europe Middle East& Africa
China Asia Pac
Opportunity
Installed Base
Num
ber
of
Stu
dents
& T
eachers
in-
(Millions)
1.5 billion students & teachers in K-12 globally. Existing PC penetration is only 5%
NUMBERS OF STUDENTS AND TEACHERS IN K-12 GLOBALLY
8 | © 2015 Futuresource Consulting Ltd
Market TAM
67 Mil
Existing
Penetration
36%
137 Mil
13%
129 Mil
8%
393 Mil
1%
239 Mil
1%
513 Mil
3%
60% 7% 36%32% 7% 5%
Interactive
Display
Penetration

MOBILE PC/TABLET SHIPMENTS INTO K-12 INSTITUTIONS
9 | © 2015 Futuresource Consulting Ltd
5.5 6.99.6 10.6 11.5
4.45.8
6.47.4 7.4
3.4
3.8
4.95.6
7.0
4.0
5.9
5.7
6.16.2
0
10
20
30
40
2012 2013 2014 2015 2016
Volu
mes,
millions
North America South America EMEA Asia-Pacific
32.2
17.3
22.5
26.6
29.8
26.6 Million Devices Sold In 2014, Representing A 15% Growth
# Mobile PCs includes Notebooks, Netbooks, Chromebooks and Tablets purchased by institutions (not including ‘Bring Your Own’)

10 | © 2015 Futuresource Consulting Ltd
COUNTRIES WITH LARGE SCALE 1:1 PROJECTS IN 2014
France
Mexico
Nigeria Saudi
Arabia Brazil
India
Argentina
AustraliaBolivia
Chile
Colombia
Uruguay
Italy
Turkmenistan
Georgia
Russia
Spain
Turkey
USA
UAE
Thailand
Venezuela
Canada

11 | © 2015 Futuresource Consulting Ltd
COUNTRIES WITH EXPECTED & POTENTIAL NEW PROJECTS IN 2015
South
Africa
Japan
France
Mexico
Ecuador
Qatar Saudi Arabia
Peru
Brazil
India
Argentina
Bolivia
Chile
Colombia
Costa
Rica
Djibouti
Uruguay
El Salvador
Honduras
Italy
Turkmenistan
Georgia
Spain
KenyaMauritius
Turkey
USA
ThailandVenezuela
Tanzania
Nigeria
Uganda
Suriname
Canada
Panama

Chromebook yet to gain Significant Traction Outside of North America
38%32%
24%19%
50%56%
40%31%
67%
51%
16% 42%2%
4%
3%
2%
2% 62%
36%
17% 2%
22%
6%
4%44%35%
14%
45%
29%37% 38%
63%
19%
55%
0%
20%
40%
60%
80%
100%
Tablet
Netbook
Chromebook
Notebook
Europe Asia-PacificSouth AmericaNorth
America
FORM FACTOR MARKET SHARE BY REGION – SHIPMENT BASED
Middle
East
& Africa
2013 2014 2013 2014 2013 2014 2013 2014 2013 2014
12 | © 2015 Futuresource Consulting Ltd
# Mobile PCs includes Notebooks, Netbooks, Chromebooks and Tablets purchased by k-12 institutions (not including ‘Bring Your Own’)
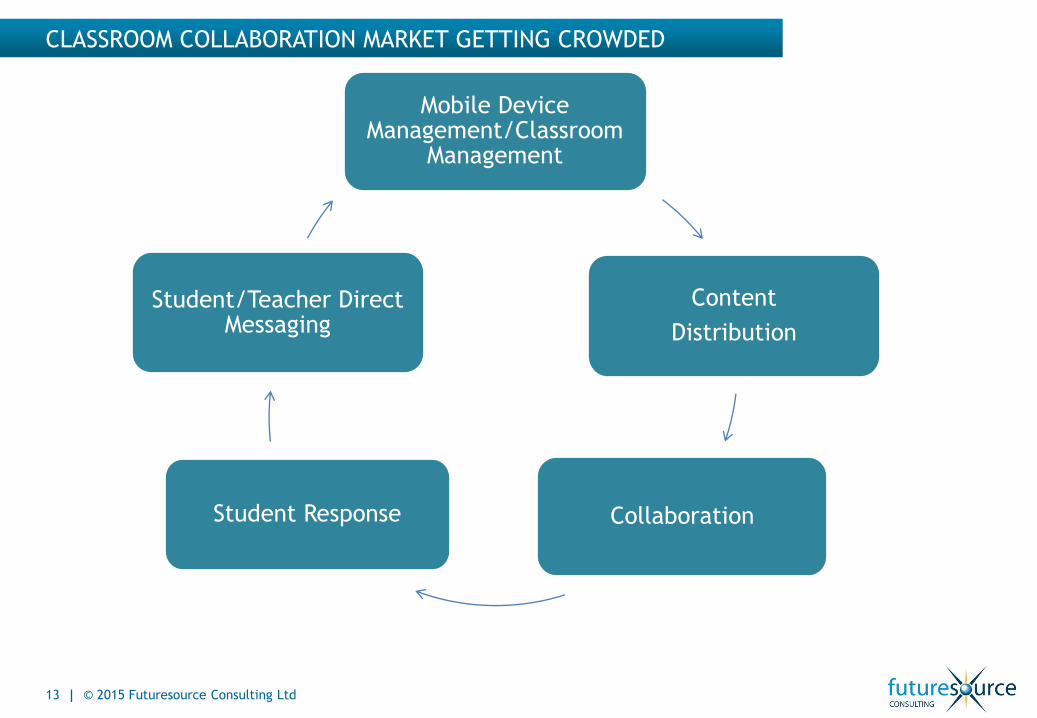
CLASSROOM COLLABORATION MARKET GETTING CROWDED
13 | © 2015 Futuresource Consulting Ltd
Mobile Device Management/Classroom
Management
Content
Distribution
CollaborationStudent Response
Student/Teacher Direct Messaging

14 | © 2015 Futuresource Consulting Ltd
MANY DIFFERENT SUPPLIERS APPROACHING FROM DIFFERENT ANGLES
Mobile Device
Management
Classroom
ManagementInteractive
Display
Software
Cloud
Based
Productivity
2 Way
Content
Sharing
MDM/Classroom
Management
Content
DistributionCollaboration
Student
Response
Vendor &
Background
Content
Distribution
Content
Mirroring
Q & A
Student/Teacher
Direct Messaging
Instant
Messaging
Adaptive
Q & A
Full
Communicat
ion
IT Based Classroom
Management Specialists
Voting Specialists
Publishers
Productivity Providers
Standard offering
Some providers
offering
Collaboration Focused
Software Houses
Interactive Display
Specialists

| Futuresource Introduction
| Global Spend On Education Hardware in 2014
| Interactive Display Developments
| Computing in K-12 Developments
| Focus on Classroom Collaboration
| Questions
• Futuresource Universe Of Education Spend Report
15 | © 2015 Futuresource Consulting Ltd
AGENDA
16 | © 2015 Futuresource Consulting Ltd
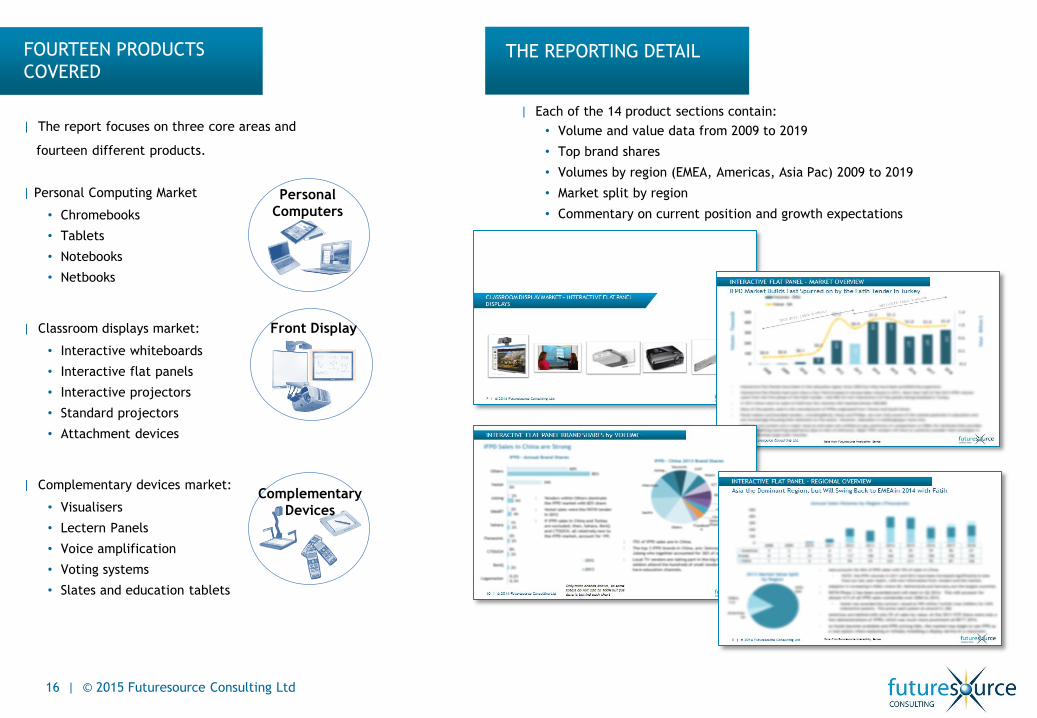
FOURTEEN PRODUCTS
COVERED
| Each of the 14 product sections contain:
• Volume and value data from 2009 to 2019
• Top brand shares
• Volumes by region (EMEA, Americas, Asia Pac) 2009 to 2019
• Market split by region
• Commentary on current position and growth expectations
| Personal Computing Market
• Chromebooks
• Tablets
• Notebooks
• Netbooks
| Classroom displays market:
• Interactive whiteboards
• Interactive flat panels
• Interactive projectors
• Standard projectors
• Attachment devices
| Complementary devices market:
• Visualisers
• Lectern Panels
• Voice amplification
• Voting systems
• Slates and education tablets
| The report focuses on three core areas and
fourteen different products.
THE REPORTING DETAIL
Complementary
Devices
Front Display
Personal
Computers

17 | © 2015 Futuresource Consulting Ltd
ANALYST OVERVIEW
PRESENTATION
| The value-added PPT presentation allows our analysts to explore
trends and hot topics in greater detail adding insight and meaning to
the raw data.
| The report contents will include:
• Report Background, Objectives and Methodology
• Global Classroom Technology Spend Overview
• Category volume, value and share
• Spend by region, product and category
• Key developments impacting the EdTech market
• Data privacy issues
• The rise of Chromebooks
• The drive to Vocational learning
• Coding
• Classroom collaboration
• Who is offering what?
• Analysis of trends in classroom collaboration
• Global Education Decision-Making and Funding
• How decision making works
• Four typical processes and mapping key countries to
these
• Tenders and Large-Scale Nationwide Investments
• Analysis of large scale EdTech deployments taking place
as well as new projects developing. Over 30 countries
covered.

About Futuresource Consulting
Futuresource Consulting is a specialist research and knowledge-based consulting
company with a heritage stretching back to the 1980s.
Its insight and global market coverage are based on informed regional expertise,
ensuring its portfolio of world-class clients is fully supported in research, analysis,
strategic planning and decision making.
| Consumer Electronics
| Print & Imaging
| Entertainment Content & Distribution
| Education Technology
| Optical Disc Manufacturing
| Broadcast Equipment
| Professional Displays talk to us…
Futuresource Consulting
+44 (0)1582 500 100
www.futuresource-consulting.com
18 | © 2015 Futuresource Consulting Ltd


