CorrigendumPlease note that despite our best efforts to ensure quality control, errors have slipped into Global EV Outlook 2017.The text in pages 2, 32 has changed. It should be replaced by the following pages.
Acronyms, abbreviations and units of measure.............................................................................. 65
Acronyms and abbreviations ....................................................................................................... 65
Units of measurement ................................................................................................................ 66
List of figures Figure 1 ● Evolution of the global electric car stock, 2010-16 .................................................................. 5 Figure 2 ● Deployment scenarios for the stock of electric cars to 2030 .......................................................... 6 Figure 3 ● GHG emission budgets and emission trajectories to 2100 for the energy sector,
2DS and B2DS................................................................................................................................... 8 Figure 4 ● EVI member countries and country coverage of the Global EV Outlook 2017 ............................. 11 Figure 5 ● Electric car sales, market share, and BEV and PHEV sales shares in selected
countries, 2010-16 ......................................................................................................................... 12 Figure 6 ● Evolution of battery energy density and cost ............................................................................... 14 Figure 7 ● Comparative cost of PLDV technologies by country/region in the 2DS, 2015 and 2030 .............. 20 Figure 8 ● Evolution of the global electric car stock, 2010-16 ....................................................................... 22 Figure 9 ● Deployment scenarios for the stock of electric cars to 2030 ........................................................ 25 Figure 10 ● On-road well-to-wheel CO2 emissions for PLDVs for various powertrain
technologies by country or region: RTS and 2DS, 2015 to 2030 .................................................... 26 Figure 11 ● Global EVSE outlets, 2010-16 ...................................................................................................... 31 Figure 12 ● Electric car stock and publicly available EVSE outlets by country and
type of charger, 2016 ..................................................................................................................... 32 Figure 13 ● Charging habits for a sample of Norwegian electric car users, 2016 .......................................... 33 Figure 14 ● Market share of electric cars in leading EV countries compared to high-performing
EV cities, 2016 ................................................................................................................................ 37 Figure 15 ● EVSE outlets by country and by type of charger, 2016 ............................................................... 39 Figure 16 ● EVSE outlets by country and by type of charger, 2016 ............................................................... 40 Figure 17 ● Impact of electric car deployment on global electricity demand, 2DS ....................................... 41 Figure 18 ● Local demand profile and electric car charging in the European Union on a typical day,
B2DS, 2030 ..................................................................................................................................... 42 Figure 19 ● Development of charging infrastructure in buildings with rising numbers of
electric cars .................................................................................................................................... 43 Figure 20 ● Impact of electric car deployment on a generic local grid in the European Union,
B2DS (left) and 2DS (right) ............................................................................................................. 44
List of tables Table 1 ● BEV and PHEV incentives developments in a selection of countries, 2016 ................................ 18 Table 2 ● List of OEMs announcements on electric car ambitions as of April 2017 .................................. 24 Table 3 ● Overview of the level (power output) and type (socket and connector) of EVSE
used in China, Europe, Japan and the United States .............................................................. 30 Table 4 ● Electric car stock (BEV and PHEV) by country, 2005-16 (thousands) ......................................... 49 Table 5 ● Battery electric cars, stock by country, 2005-16 (thousands) ................................................... 49 Table 6 ● Plug-in hybrid electric cars, stock by country, 2005-16 (thousands) ......................................... 49 Table 7 ● Electric cars (BEV and PHEV), new registrations by country, 2005-16 (thousands) .................... 50 Table 8 ● Battery electric cars, new registrations by country, 2005-16 (thousands) ................................. 50 Table 9 ● Plug-in hybrid electric cars, new registrations by country, 2005-16 (thousands) ....................... 50
chargers as a prerequisite for EV adoption and the nascent nature of most of the electric car markets.30
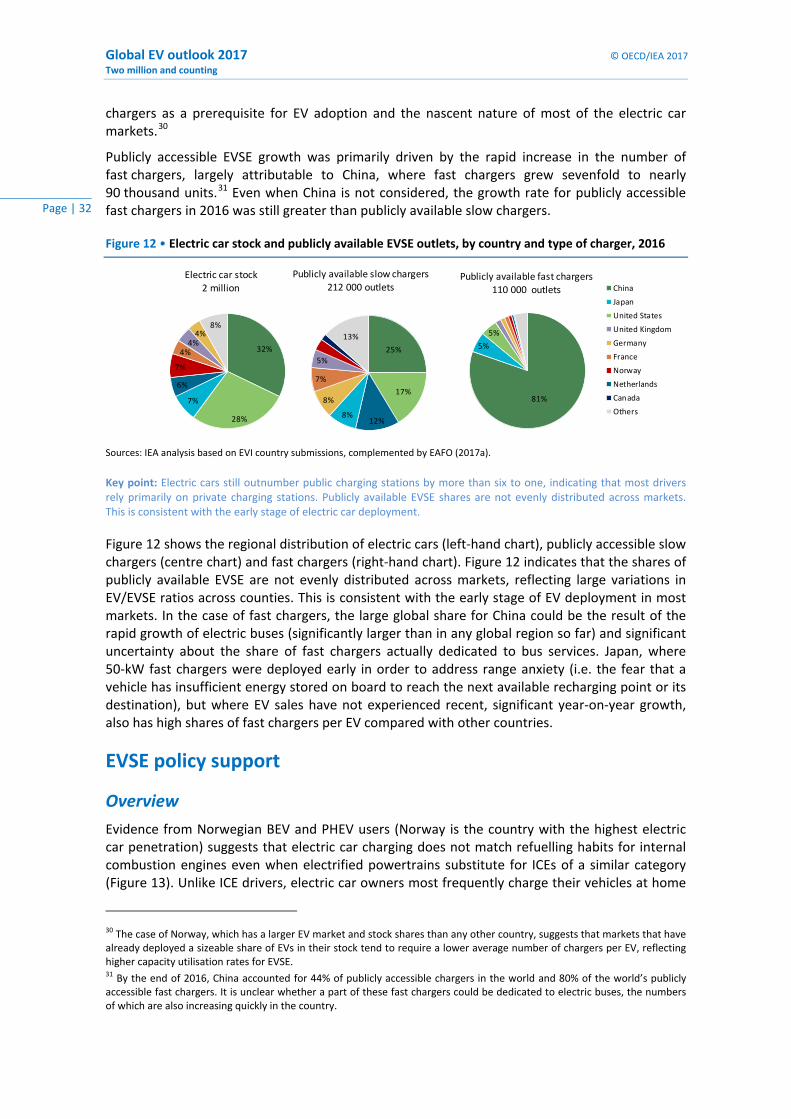
Publicly accessible EVSE growth was primarily driven by the rapid increase in the number of fast chargers, largely attributable to China, where fast chargers grew sevenfold to nearly 90 thousand units.31 Even when China is not considered, the growth rate for publicly accessible fast chargers in 2016 was still greater than publicly available slow chargers.
Figure 12 • Electric car stock and publicly available EVSE outlets, by country and type of charger, 2016
Sources: IEA analysis based on EVI country submissions, complemented by EAFO (2017a).
Key point: Electric cars still outnumber public charging stations by more than six to one, indicating that most drivers rely primarily on private charging stations. Publicly available EVSE shares are not evenly distributed across markets. This is consistent with the early stage of electric car deployment.
Figure 12 shows the regional distribution of electric cars (left-hand chart), publicly accessible slow chargers (centre chart) and fast chargers (right-hand chart). Figure 12 indicates that the shares of publicly available EVSE are not evenly distributed across markets, reflecting large variations in EV/EVSE ratios across counties. This is consistent with the early stage of EV deployment in most markets. In the case of fast chargers, the large global share for China could be the result of the rapid growth of electric buses (significantly larger than in any global region so far) and significant uncertainty about the share of fast chargers actually dedicated to bus services. Japan, where 50-kW fast chargers were deployed early in order to address range anxiety (i.e. the fear that a vehicle has insufficient energy stored on board to reach the next available recharging point or its destination), but where EV sales have not experienced recent, significant year-on-year growth, also has high shares of fast chargers per EV compared with other countries.
EVSE policy support
Overview
Evidence from Norwegian BEV and PHEV users (Norway is the country with the highest electric car penetration) suggests that electric car charging does not match refuelling habits for internal combustion engines even when electrified powertrains substitute for ICEs of a similar category (Figure 13). Unlike ICE drivers, electric car owners most frequently charge their vehicles at home
30 The case of Norway, which has a larger EV market and stock shares than any other country, suggests that markets that have already deployed a sizeable share of EVs in their stock tend to require a lower average number of chargers per EV, reflecting higher capacity utilisation rates for EVSE. 31 By the end of 2016, China accounted for 44% of publicly accessible chargers in the world and 80% of the world’s publicly accessible fast chargers. It is unclear whether a part of these fast chargers could be dedicated to electric buses, the numbers of which are also increasing quickly in the country.
32%
28%
7%
6%
7%
4%4%
4%8%
Electric car stock2 million
25%
17%
12%8%
8%
7%
5%
13%
Publicly available slow chargers212 000 outlets
81%
5%
5%
Publicly available fast chargers110 000 outlets China