Page 1
Global evidence that deforestation amplifies flood riskand severity in the developing world
C O R E Y J . A . B R A D S H A W *, N AV J O T S . S O D H I w , K E LV I N S . - H . P E H wz and
B A R R Y W. B R O O K *1
*School for Environmental Research, Institute of Advanced Studies, Charles Darwin University, Darwin, Northern Territory 0909,
Australia, wDepartment of Biological Sciences, National University of Singapore, 14 Science Drive 4, Singapore 117543, Singapore,
zSchool of Geography, University of Leeds, Leeds LS2 9JT, UK
Abstract
With the wide acceptance of forest-protection policies in the developing world comes a
requirement for clear demonstrations of how deforestation may erode human well-being
and economies. For centuries, it has been believed that forests provide protection against
flooding. However, such claims have given rise to a heated polemic, and broad-scale
quantitative evidence of the possible role of forests in flood protection has not been
forthcoming. Using data collected from 1990 to 2000 from 56 developing countries, we
show using generalized linear and mixed-effects models contrasted with information-
theoretic measures of parsimony that flood frequency is negatively correlated with the
amount of remaining natural forest and positively correlated with natural forest area loss
(after controlling for rainfall, slope and degraded landscape area). The most parsimo-
nious models accounted for over 65% of the variation in flood frequency, of which nearly
14% was due to forest cover variables alone. During the decade investigated, nearly
100 000 people were killed and 320 million people were displaced by floods, with total
reported economic damages exceeding US$1151 billion. Extracted measures of flood
severity (flood duration, people killed and displaced, and total damage) showed some
weaker, albeit detectable correlations to natural forest cover and loss. Based on an
arbitrary decrease in natural forest area of 10%, the model-averaged prediction of flood
frequency increased between 4% and 28% among the countries modeled. Using the same
hypothetical decline in natural forest area resulted in a 4–8% increase in total flood
duration. These correlations suggest that global-scale patterns in mean forest trends
across countries are meaningful with respect to flood dynamics. Unabated loss of forests
may increase or exacerbate the number of flood-related disasters, negatively impact
millions of poor people, and inflict trillions of dollars in damage in disadvantaged
economies over the coming decades. This first global-scale empirical demonstration that
forests are correlated with flood risk and severity in developing countries reinforces the
imperative for large-scale forest protection to protect human welfare, and suggests that
reforestation may help to reduce the frequency and severity of flood-related catastrophes.
Keywords: conservation, damage, flooding events, forest loss, generalized linear mixed-effects models,
generalized linear models, human displacement, projected costs, rainfall
Received 17 August 2006; revised version received 27 January 2007 and accepted 1 June 2007
Introduction
With the alarming loss of natural habitats around much
of the world (Kerr & Currie, 1995; Laurance, 1999; Achard
et al., 2002; Balmford et al., 2003; Brook et al., 2003),
humanity is being robbed of essential ecosystem services
such as air purification, weather regulation, maintenance
of soil fertility and stability, waste detoxification and pest
Correspondence: Corey J. A. Bradshaw, tel. 161 8946 6713,
fax 131 8946 7720, e-mail: [email protected]
1Present address: Research Institute for Climate Change and
Sustainability, School of Earth and Environmental Sciences, Uni-
versity of Adelaide, South Australia 5005, Australia.
Global Change Biology (2007) 13, 2379–2395, doi: 10.1111/j.1365-2486.2007.01446.x
r 2007 The AuthorsJournal compilation r 2007 Blackwell Publishing Ltd 2379
Page 2
control (Daily, 1997; Laurance & Williamson, 2001;
Chivian, 2002; Dıaz et al., 2006; Vittor et al., 2006).
Economic losses through the degradation of natural
services have been used to argue for the imperative of
conservation (Balmford et al., 2002; Ricketts et al., 2004),
but only to a limited extent. As such, for conservation
to receive wide political and popular attention and
priority, especially in the developing world, there needs
to be empirical evidence of nature’s role in supporting
human well-being. For example, research can test the
degree to which the loss of natural habitats drives
disasters that disrupt human lives and property (Kar
& Kar, 1999). This is most urgent in developing nations
where the highest levels of biotic endemism are gen-
erally found (Myers et al., 2000), rates of natural habitat
loss are disproportionately high (Laurance, 1999;
Achard et al., 2002; Sodhi et al., 2007), and where,
ironically, politicians and the populace generally remain
apathetic toward the loss of natural habitats (Jepson,
2001) or do not see value in their conservation.
For centuries it has been vehemently claimed, and
hotly disputed, that forests provide natural protection
from floods (the rising of water bodies and their over-
flowing onto normally dry land) (Agarwal & Chak,
1991; Blaikie & Muldavin, 2004; Bruijnzeel, 2004; FAO
& CIFOR, 2005; Calder & Aylward, 2006). Each year,
extreme floods kill and displace hundreds of thousands
of people and result in billions of dollars in damages to
property and infrastructure, particularly in developing
countries with large rural and agrarian populations
(FAO & CIFOR, 2005; Jonkman, 2005). Despite consid-
erable variation in the interrelated conditions imping-
ing on flood formation, such as geological composition,
terrain slope, soil permeability, porosity, crusting and
prior wetness, and incident rainfall intensity and dura-
tion (Reed, 2002), there is some evidence that forest
loss imposes an additional vulnerability on landscapes
to floods; at least in certain circumstances (Clark, 1987;
Bruijnzeel, 1990, 2004). The proposed mechanism is that
loss of vegetation can lead to increased runoff due to
reductions in the interception of rainfall and the eva-
poration of water from the tree canopy, coupled with
reductions in the hydraulic conductivity (infiltration
rate) of soils (Clark, 1987). Thus, the high rate at which
forests are currently being lost (Laurance, 1999; Achard
et al., 2002) has led to the hypothesis that natural habitat
loss increases the risk and severity of extreme floods
and their associated cost to human life and property
(Clark, 1987). Yet, because the claim lacks broad-scale
empirical support, the development and implementa-
tion of clear flood-mitigation policies regularly stall
(FAO & CIFOR, 2005; Calder & Aylward, 2006).
Here, we provide the first global-scale evidence that
the amount of remaining natural forest cover and the
rate of its loss are correlated with flood risk and severity
in developing countries where such disasters have and
will continue to impact human well-being and suppress
economic prosperity. We used data collected between
1990 and 2000, from 56 developing countries in Africa,
Asia and Central/South America, to determine the role
of forests in mediating flood dynamics. We tested two
general, but linked hypotheses: (i) that flooding fre-
quency (risk) increases as natural forest cover decreases
and (ii) that severity (measured as total flood duration,
the number of people killed or displaced, and infra-
structure damage) associated with floods is higher
when natural forest cover is lower.
Materials and methods
Flood frequency
There is a considerable body of literature devoted to the
development of complex, catchment-specific models to
predict the temporal frequency of floods (Cameron
et al., 2000; Arnaud & Lavabre, 2002; Cunderlik & Burn,
2002; Prudhomme et al., 2002); however, no attempts
have been made to predict flood frequency over broader
spatial scales. As such, we investigated global patterns
of flood frequency using the country as the unit of
investigation because: (i) we postulate that only over
broad spatial scales will general patterns emerge and
(ii) too few data at the global scale exist for within-
country (i.e. catchment level) model designs.
Our first aim was, therefore, to test the hypothesis
that a country’s flood frequency increases as its forest
cover decreases. This can be examined in two ways: (i)
flood frequency is correlated with the total forest cover
(natural and plantation) and/or (ii) flood frequency is
correlated with the total forest cover loss over the
period of interest. The dependent variable (flood fre-
quency) was the frequency of flooding events (number
of floods observed between 1990 and 2000), extracted
from remotely sensed flood data from the Dartmouth
Flood Observatory (www.dartmouth.edu/~floods/
index.html). The Flood Observatory uses a collection
of tools [e.g. MODIS (Moderate Resolution Imaging
Spectroradiometer, http://modis.gsfc.nasa.gov) optical
remote sensing, which provides frequent updates of
surface water condition worldwide] to detect and locate
river flood events. The minimum flood size recorded
was 4–5 ha. Only floods caused by heavy or brief
torrential rain were included; those caused by ty-
phoons, cyclones, dam breakage and tsunamis were
excluded because they represent events that originate
independently of landscape characteristics (although
the magnitude of their impact may be subsequently
2380 C . J . A . B R A D S H A W et al.
r 2007 The AuthorsJournal compilation r 2007 Blackwell Publishing Ltd, Global Change Biology, 13, 2379–2395
Page 3
influenced by them). The average flood sizes in terms of
area affected ranged from 1170 to 78 900 km2.
The explanatory variables considered were: (i) the
mean cover of natural forest from 1990 to 2000 and (ii)
the annual loss of natural forest cover between 1990 and
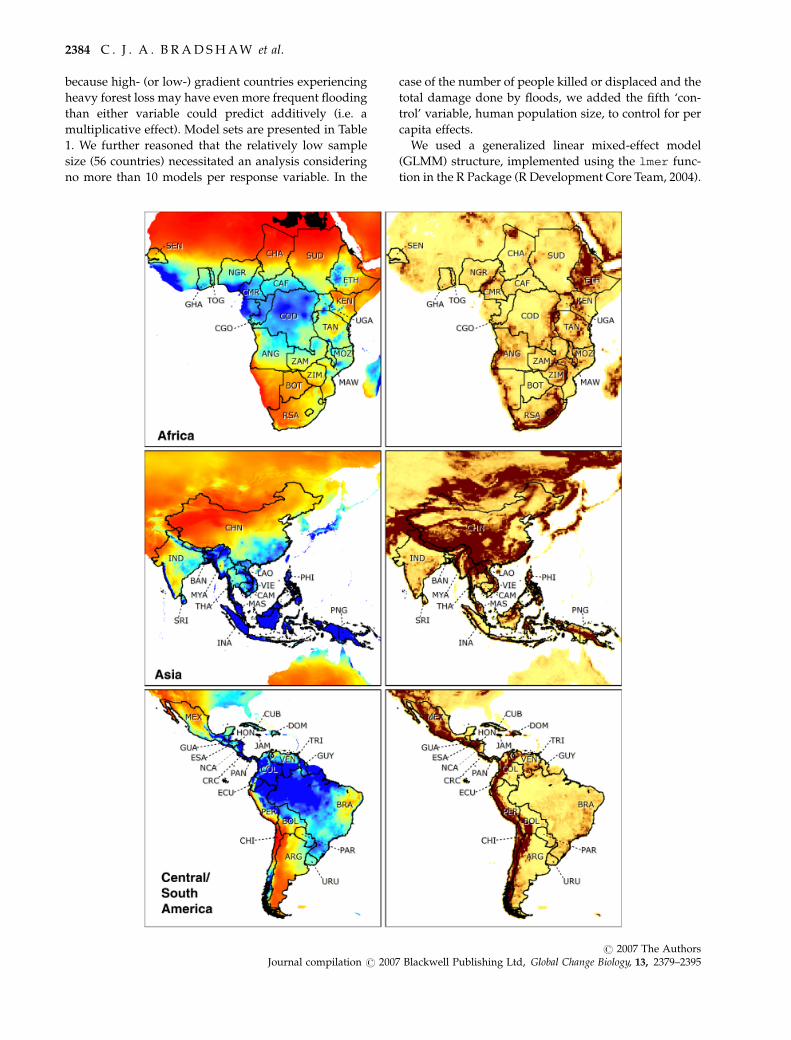
2000 (Fig. 1). Data on natural forest cover and natural
forest loss during the same period were obtained from
the World Resources Institute (www.wri.org, Earth-
trends Forests, Grasslands and Drylands data tables),
which bases much of its compiled datasets on informa-
tion provided by the Food and Agricultural Organiza-
tion (FAO, www.fao.org). The area of each country
was obtained from the FAO databases (www.fao.org).
However, a simple comparison of flood frequency
and forest cover/loss at the global scale is unfeasible
given the large number of confounding variables that
will potentially influence the number of floods a parti-
cular country experiences. As such, a number of
‘control’ variables were considered in the model struc-
ture (see below for methods and statistical details) in
an attempt to determine the contribution of forest
cover/loss to flood frequency above and beyond the
average climatic, landscape and soil characteristics par-
ticular to each country. For these reasons, we also
collected information on average total annual precipita-
tion, an index of average steepness (slope), major soil
moisture regime and area of degraded land (see details
below).
It is well known that climate variation affects flood
risk and frequency through the modification of rainfall
intensity and pattern (Franks & Kuczera, 2002; Muzik,
2002; Kiem et al., 2003). Indeed, the principal flood-
generating factor is rainfall intensity and duration with-
in a catchment’s boundary (Reed, 2002). We therefore
included a coarse index of spatial variation in precipita-
tion for the countries investigated that was derived
from the WorldClim global climate grids (www.
worldclim.org). We used the 5 arc-minute resolution
of the annual precipitation (mm) grid describing mean
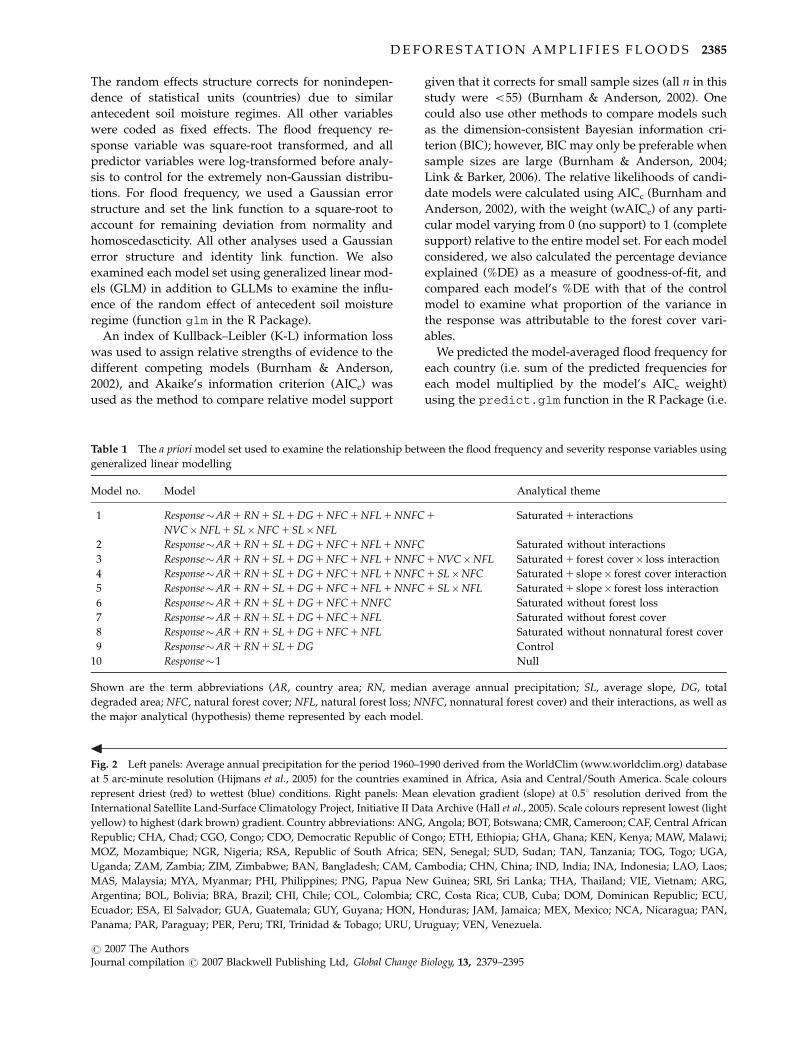
values from 1960 to 1990 (Hijmans et al., 2005) (Fig. 2).
For each country, we extracted the corresponding pre-
cipitation averages and calculated a country’s median
value because of the typically skewed distribution of
precipitation over an entire country’s surface.
Another potential control variable influencing the
spatial variation in flood frequency among countries is
the average ‘ruggedness,’ or ‘steepness,’ of the terrain,
which governs the residence time of water and the
speed of baseflow recession (Ward & Robinson, 1990;
Reed, 2002). We calculated an index of steepness as the
mean elevation gradient (or ‘slope,’ at 0.51 resolution)
for each country (Fig. 2) from the International Satellite
Land-Surface Climatology Project, Initiative II Data
Archive (Hall et al., 2005).
The type of postforest land cover can have a large
hydrological impact in tropical catchments (Bruijnzeel,
2004). Increases in urbanization, area under heavy
grazing pressure and intensive annual cropping can
all lead to large changes in water flow patterns (Costa
et al., 2003; Bruijnzeel, 2004). We therefore collected data
on the total ‘degraded’ area of each country devoted to
urbanization, cropland and cropland/natural vegeta-
tion mosaic from the Global Land Cover Characteristics
Database (GLCCD) (Loveland et al., 2000). ‘Urbaniza-
tion’ was defined as the area covered by buildings and
other man-made structures; ‘croplands’ were defined as
lands covered with temporary crops followed by har-
vest and a bare soil period; cropland/natural vegetation
mosaics consist of croplands, forests, shrublands and
grasslands in which no one component comprises more
than 60% of the landscape (Loveland et al., 2000).
The underlying soil moisture regime can have pro-
found effects on the frequency and severity of flooding;
for example, relatively small amounts of water accu-
mulation from rainfall in an arid region can lead to
temporary flash flooding, whereas an equivalent
amount of rain falling on perhumid soils may not
result in any particularly noticeable accumulation of
surface water (Beljaars et al., 1996; Cassardo et al., 2002).
Therefore, we also considered antecedent soil moisture
regime of each country based on the world Soil
Moisture Regimes Map (Natural Resources Conserva-
tion Service, 1997). For each country considered we
classified the dominant (the largest area class within
that country) soil moisture regime as: (1) arid/semi-arid
when the regime was aridic (limiting plant growth
during much of the growing season) or xeric (deficient
in available moisture for the support of life); (2) sub-
humid when the regime was ustic (characterized by
limited moisture during most of the year but with at
least one rainy season of �3 months’ duration when
the soil is moist); or (3) perhumid when the regime
was udic (the soil is not dry for as long as 90 cumula-
tive days) or perudic (rainfall exceeds evapotranspira-
tion throughout the year and the soil never dries
completely) (Natural Resources Conservation Service,
1997). Raw data are presented in Tables A1 and A2.
Flood severity
The frequency of flooding does not necessarily charac-
terize the severity of the events in terms of their
negative impacts on the landscape, human life and
property. We therefore tested the relationships between
forest area/deforestation and four measures of flood
severity: (1) flood frequency weighted by the average
duration of floods; (2) the number of people killed by
flooding; (3) the number of people displaced by flood-
D E F O R E S T AT I O N A M P L I F I E S F L O O D S 2381
r 2007 The AuthorsJournal compilation r 2007 Blackwell Publishing Ltd, Global Change Biology, 13, 2379–2395
Page 4
ing; and (4) the total economic damage done by flood-
ing. The Flood Observatory database provides the
average duration of all floods occurring between 1990
and 2000, as well as the average area flooded. However,
the latter data (area flooded) were missing for 25
countries, so we only weighted the number of floods
by their average duration (in days) as the response
variable.
The Flood Observatory database also provides the
number of people killed or displaced over the period of
1990–2000, as well as the infrastructure damage (mean
estimated cost in $US) attributed to floods during that
2382 C . J . A . B R A D S H A W et al.
r 2007 The AuthorsJournal compilation r 2007 Blackwell Publishing Ltd, Global Change Biology, 13, 2379–2395
Page 5
period. However, some flood statistics were unavailable
for certain floods, so we calculated the average severity
values per country and multiplied these by the flood
frequency to obtain approximate total values. Thus, our
next hypothesis was that the number of people affected,
and damage done by extreme floods, increases as
natural forest cover decreases. In the case of the total
damage done by floods, the total gross damage (in $US)
is potentially confounded by variation in the local cost
of living (economic prosperity) among countries. To
control for this, we also considered the total gross
damage corrected for purchasing power parity (PPP)
as a damage response variable. PPP equalizes the costs
among countries in terms of their purchasing power
and standards of living (www.worldbank.org). To ob-
tain PPP correction data, we accessed the World Bank
website and obtained the 2002 Gross National Income
(GNI) and the PPP-adjusted GNI (PPP-GNI) for each
country (http://siteresources.worldbank.org/ICPINT/
Resources/Table1_1.pdf). The PPP conversion factor
was expressed simply as the ratio of PPP-GNI to GNI,
and this was applied to the total damage figures and the
analysis repeated.
All control and explanatory variables described
above for the relationships to flood frequency were
used for the severity responses, with the addition of
the estimated human population size for each country
(i.e. additional control variable). Mean human popula-
tion sizes for 1999 were obtained from the Food and
Agricultural Organization databases (www.fao.org).
Some data were not available for all countries, so
sample sizes vary depending on the severity response
variable used in analysis. Raw data are presented in
Tables A1 and A2.
Statistical analyses
Given the probable complexity of the relationship be-
tween flood frequency and severity and the hypothe-
sized correlates, simple linear multiple regression and
stepwise model building were considered inappropri-
ate (Whittingham et al., 2006). We instead used a multi-
model, inferential approach based on information
theory (Burnham & Anderson, 2002) to construct a
limited a priori model set to examine our major hypoth-
eses. Our model building strategy was based on the
following logic:
(1) The number of floods experienced in any one
country should depend on the total area of the country
(i.e. more area 5 higher total frequency), the average
rainfall it receives, the average gradient (slope), and the
amount of degraded land (the sum of the area devoted
to urbanization, cropland and cropland/natural vegeta-
tion mosaic). As such, all models considered these four
covariates as ‘control’ variables (flood frequency and
forest cover values were not first divided by country
area to avoid spurious positive correlations) (Jackson &
Somers, 1991);
(2) The antecedent soil moisture regime of a given
country was considered as a random factor (arid/semi-
arid, subhumid or perhumid) for all models considered
(see model structure below);
(3) We reasoned that natural forest area (in 2000)
and natural forest loss (between 1990 and 2000) would
not influence flood frequency in a mutually exclu-
sive fashion considering the ‘natural’ condition of
a country may have varying forest coverage for
reasons independent of human deforestation activities;
therefore, both were considered simultaneously in
certain models, with an interaction between them
considered plausible given that flood frequency may
also depend on the amount of forest loss relative to the
initial state;
(4) Natural and total forest cover are highly correlated
(data not shown), but the difference [‘nonnatural’ (plan-
tation or nonnative) vegetation] may explain some
additional variance in flood frequency given that non-
native forest cover may not always affect water yields in
the same manner as native vegetation (Bruijnzeel, 2004);
(5) Finally, we hypothesized two other potential inter-
actions between slope and natural forest cover and
between slope and natural forest loss; the former be-
cause countries with higher gradients may experience
more floods regardless of their forest cover; the latter
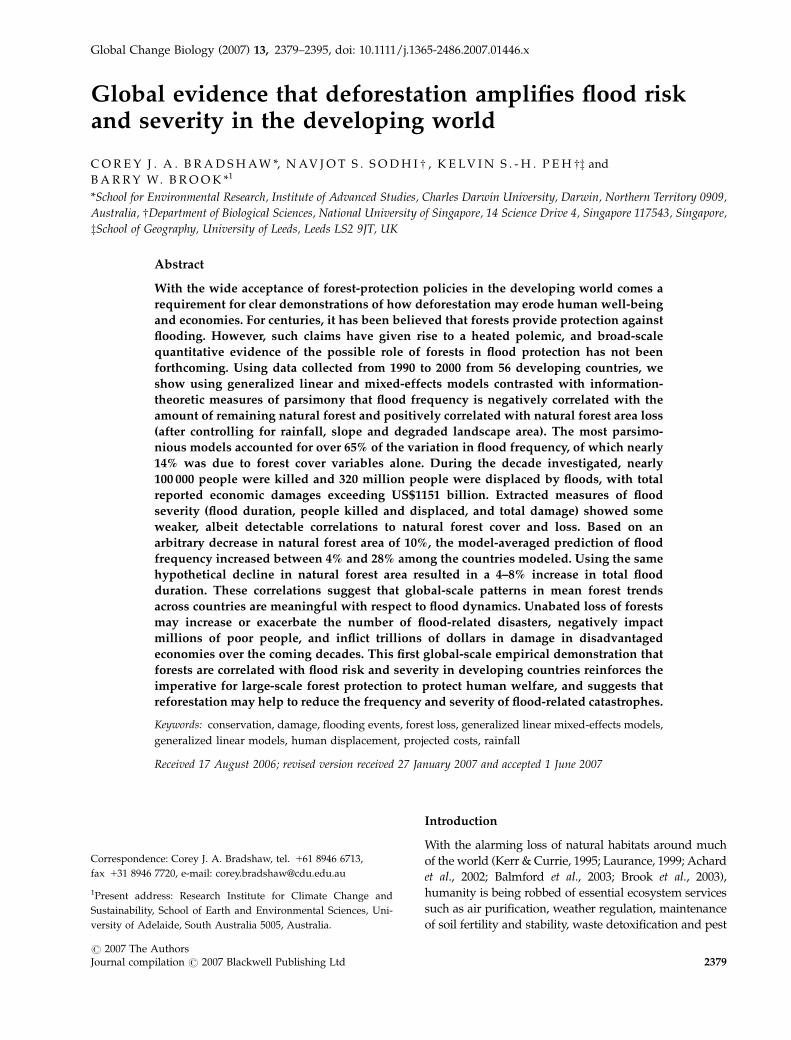
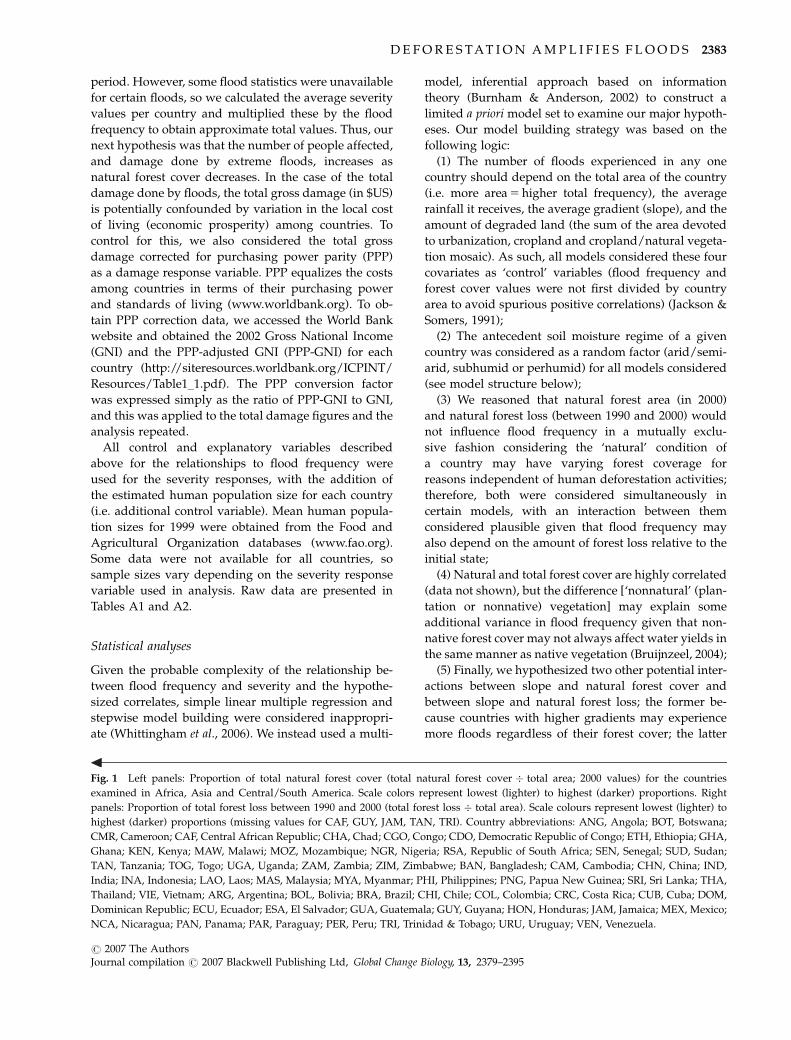
Fig. 1 Left panels: Proportion of total natural forest cover (total natural forest cover � total area; 2000 values) for the countries
examined in Africa, Asia and Central/South America. Scale colors represent lowest (lighter) to highest (darker) proportions. Right
panels: Proportion of total forest loss between 1990 and 2000 (total forest loss � total area). Scale colours represent lowest (lighter) to
highest (darker) proportions (missing values for CAF, GUY, JAM, TAN, TRI). Country abbreviations: ANG, Angola; BOT, Botswana;
CMR, Cameroon; CAF, Central African Republic; CHA, Chad; CGO, Congo; CDO, Democratic Republic of Congo; ETH, Ethiopia; GHA,
Ghana; KEN, Kenya; MAW, Malawi; MOZ, Mozambique; NGR, Nigeria; RSA, Republic of South Africa; SEN, Senegal; SUD, Sudan;
TAN, Tanzania; TOG, Togo; UGA, Uganda; ZAM, Zambia; ZIM, Zimbabwe; BAN, Bangladesh; CAM, Cambodia; CHN, China; IND,
India; INA, Indonesia; LAO, Laos; MAS, Malaysia; MYA, Myanmar; PHI, Philippines; PNG, Papua New Guinea; SRI, Sri Lanka; THA,
Thailand; VIE, Vietnam; ARG, Argentina; BOL, Bolivia; BRA, Brazil; CHI, Chile; COL, Colombia; CRC, Costa Rica; CUB, Cuba; DOM,
Dominican Republic; ECU, Ecuador; ESA, El Salvador; GUA, Guatemala; GUY, Guyana; HON, Honduras; JAM, Jamaica; MEX, Mexico;
NCA, Nicaragua; PAN, Panama; PAR, Paraguay; PER, Peru; TRI, Trinidad & Tobago; URU, Uruguay; VEN, Venezuela.
D E F O R E S T AT I O N A M P L I F I E S F L O O D S 2383
r 2007 The AuthorsJournal compilation r 2007 Blackwell Publishing Ltd, Global Change Biology, 13, 2379–2395
Page 6
because high- (or low-) gradient countries experiencing
heavy forest loss may have even more frequent flooding
than either variable could predict additively (i.e. a
multiplicative effect). Model sets are presented in Table
1. We further reasoned that the relatively low sample
size (56 countries) necessitated an analysis considering
no more than 10 models per response variable. In the
case of the number of people killed or displaced and the
total damage done by floods, we added the fifth ‘con-
trol’ variable, human population size, to control for per
capita effects.
We used a generalized linear mixed-effect model
(GLMM) structure, implemented using the lmer func-
tion in the R Package (R Development Core Team, 2004).
2384 C . J . A . B R A D S H A W et al.
r 2007 The AuthorsJournal compilation r 2007 Blackwell Publishing Ltd, Global Change Biology, 13, 2379–2395
Page 7
The random effects structure corrects for nonindepen-
dence of statistical units (countries) due to similar
antecedent soil moisture regimes. All other variables
were coded as fixed effects. The flood frequency re-
sponse variable was square-root transformed, and all
predictor variables were log-transformed before analy-
sis to control for the extremely non-Gaussian distribu-
tions. For flood frequency, we used a Gaussian error
structure and set the link function to a square-root to
account for remaining deviation from normality and
homoscedascticity. All other analyses used a Gaussian
error structure and identity link function. We also
examined each model set using generalized linear mod-
els (GLM) in addition to GLLMs to examine the influ-
ence of the random effect of antecedent soil moisture
regime (function glm in the R Package).
An index of Kullback–Leibler (K-L) information loss
was used to assign relative strengths of evidence to the
different competing models (Burnham & Anderson,
2002), and Akaike’s information criterion (AICc) was
used as the method to compare relative model support
given that it corrects for small sample sizes (all n in this
study were o55) (Burnham & Anderson, 2002). One
could also use other methods to compare models such
as the dimension-consistent Bayesian information cri-
terion (BIC); however, BIC may only be preferable when
sample sizes are large (Burnham & Anderson, 2004;
Link & Barker, 2006). The relative likelihoods of candi-
date models were calculated using AICc (Burnham and
Anderson, 2002), with the weight (wAICc) of any parti-
cular model varying from 0 (no support) to 1 (complete
support) relative to the entire model set. For each model
considered, we also calculated the percentage deviance
explained (%DE) as a measure of goodness-of-fit, and
compared each model’s %DE with that of the control
model to examine what proportion of the variance in
the response was attributable to the forest cover vari-
ables.
We predicted the model-averaged flood frequency for
each country (i.e. sum of the predicted frequencies for
each model multiplied by the model’s AICc weight)
using the predict.glm function in the R Package (i.e.
Table 1 The a priori model set used to examine the relationship between the flood frequency and severity response variables using
generalized linear modelling
Model no. Model Analytical theme
1 Response�AR 1 RN 1 SL 1 DG 1 NFC 1 NFL 1 NNFC 1
NVC�NFL 1 SL�NFC 1 SL�NFL
Saturated 1 interactions
2 Response�AR 1 RN 1 SL 1 DG 1 NFC 1 NFL 1 NNFC Saturated without interactions
3 Response�AR 1 RN 1 SL 1 DG 1 NFC 1 NFL 1 NNFC 1 NVC�NFL Saturated 1 forest cover� loss interaction
4 Response�AR 1 RN 1 SL 1 DG 1 NFC 1 NFL 1 NNFC 1 SL�NFC Saturated 1 slope� forest cover interaction
5 Response�AR 1 RN 1 SL 1 DG 1 NFC 1 NFL 1 NNFC 1 SL�NFL Saturated 1 slope� forest loss interaction
6 Response�AR 1 RN 1 SL 1 DG 1 NFC 1 NNFC Saturated without forest loss
7 Response�AR 1 RN 1 SL 1 DG 1 NFC 1 NFL Saturated without forest cover
8 Response�AR 1 RN 1 SL 1 DG 1 NFC 1 NFL Saturated without nonnatural forest cover
9 Response�AR 1 RN 1 SL 1 DG Control
10 Response�1 Null
Shown are the term abbreviations (AR, country area; RN, median average annual precipitation; SL, average slope, DG, total
degraded area; NFC, natural forest cover; NFL, natural forest loss; NNFC, nonnatural forest cover) and their interactions, as well as
the major analytical (hypothesis) theme represented by each model.
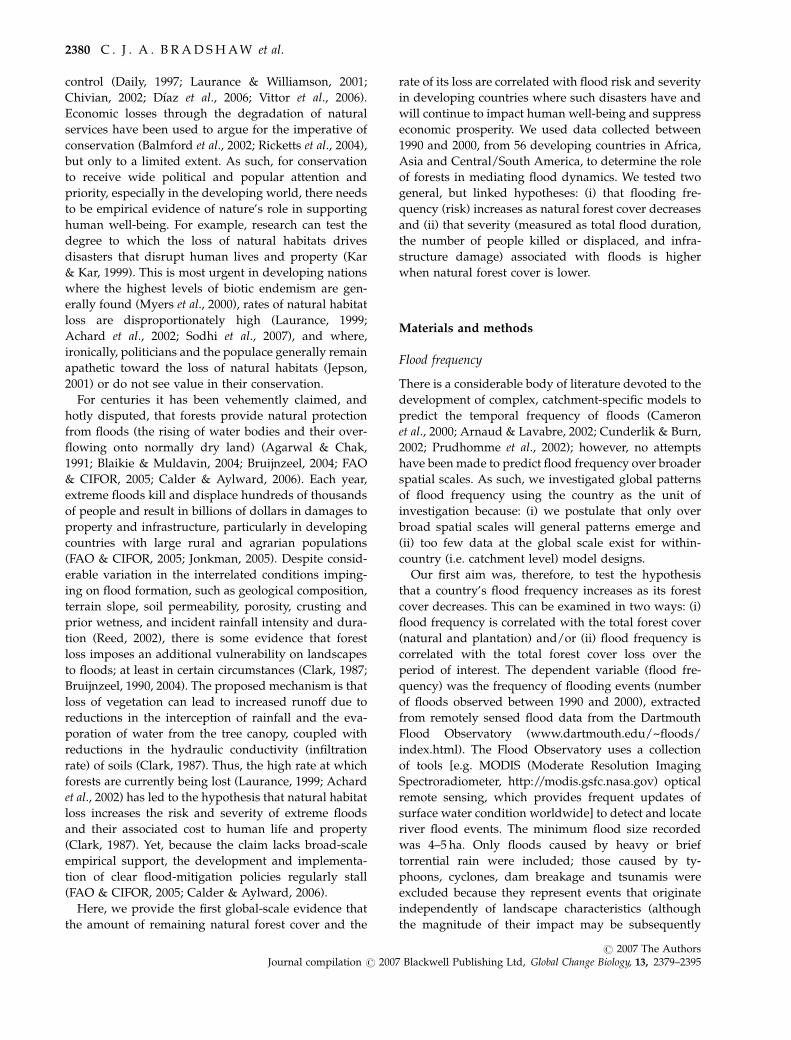
Fig. 2 Left panels: Average annual precipitation for the period 1960–1990 derived from the WorldClim (www.worldclim.org) database
at 5 arc-minute resolution (Hijmans et al., 2005) for the countries examined in Africa, Asia and Central/South America. Scale colours
represent driest (red) to wettest (blue) conditions. Right panels: Mean elevation gradient (slope) at 0.51 resolution derived from the
International Satellite Land-Surface Climatology Project, Initiative II Data Archive (Hall et al., 2005). Scale colours represent lowest (light
yellow) to highest (dark brown) gradient. Country abbreviations: ANG, Angola; BOT, Botswana; CMR, Cameroon; CAF, Central African
Republic; CHA, Chad; CGO, Congo; CDO, Democratic Republic of Congo; ETH, Ethiopia; GHA, Ghana; KEN, Kenya; MAW, Malawi;
MOZ, Mozambique; NGR, Nigeria; RSA, Republic of South Africa; SEN, Senegal; SUD, Sudan; TAN, Tanzania; TOG, Togo; UGA,
Uganda; ZAM, Zambia; ZIM, Zimbabwe; BAN, Bangladesh; CAM, Cambodia; CHN, China; IND, India; INA, Indonesia; LAO, Laos;
MAS, Malaysia; MYA, Myanmar; PHI, Philippines; PNG, Papua New Guinea; SRI, Sri Lanka; THA, Thailand; VIE, Vietnam; ARG,
Argentina; BOL, Bolivia; BRA, Brazil; CHI, Chile; COL, Colombia; CRC, Costa Rica; CUB, Cuba; DOM, Dominican Republic; ECU,
Ecuador; ESA, El Salvador; GUA, Guatemala; GUY, Guyana; HON, Honduras; JAM, Jamaica; MEX, Mexico; NCA, Nicaragua; PAN,
Panama; PAR, Paraguay; PER, Peru; TRI, Trinidad & Tobago; URU, Uruguay; VEN, Venezuela.
D E F O R E S T AT I O N A M P L I F I E S F L O O D S 2385
r 2007 The AuthorsJournal compilation r 2007 Blackwell Publishing Ltd, Global Change Biology, 13, 2379–2395
Page 8
ignoring the weak random effect of antecedent soil
moisture regime – see ‘Results’). We then arbitrarily
reduced each country’s natural forest cover by 10% (and
concomitantly added the residual to natural forest loss),
and then recalculated the model-averaged predicted
flood frequency for each country. We report the range
of predicted percentage change in flood frequency and
severity responses with this 10% additional loss of
natural forest cover.
Results
Examination of the residual plots for all analyses
identified several extreme outliers for China, so this
country’s values were removed from all analyses.
The GLMM incorporating the antecedent soil
moisture regime accounted for additional deviance in
the responses relative to the simpler GLM by only a
small (o1%) amount, so we only present the GLM
results.
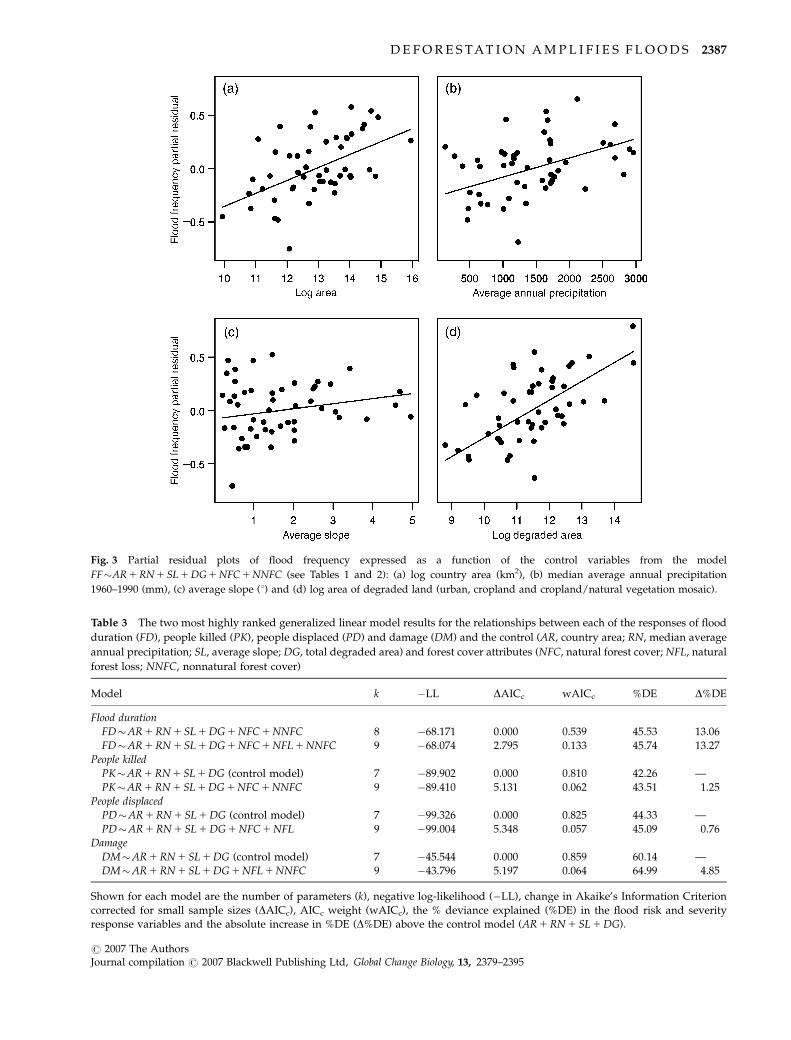
Flood frequency
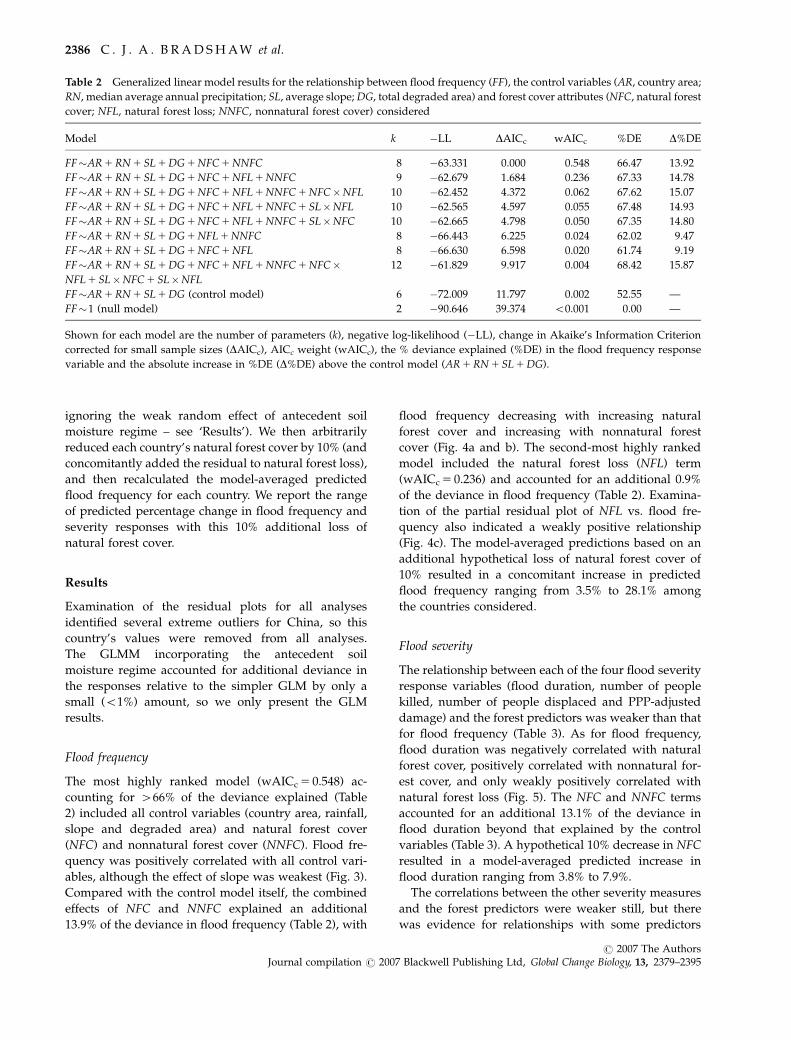
The most highly ranked model (wAICc 5 0.548) ac-
counting for 466% of the deviance explained (Table
2) included all control variables (country area, rainfall,
slope and degraded area) and natural forest cover
(NFC) and nonnatural forest cover (NNFC). Flood fre-
quency was positively correlated with all control vari-
ables, although the effect of slope was weakest (Fig. 3).
Compared with the control model itself, the combined
effects of NFC and NNFC explained an additional
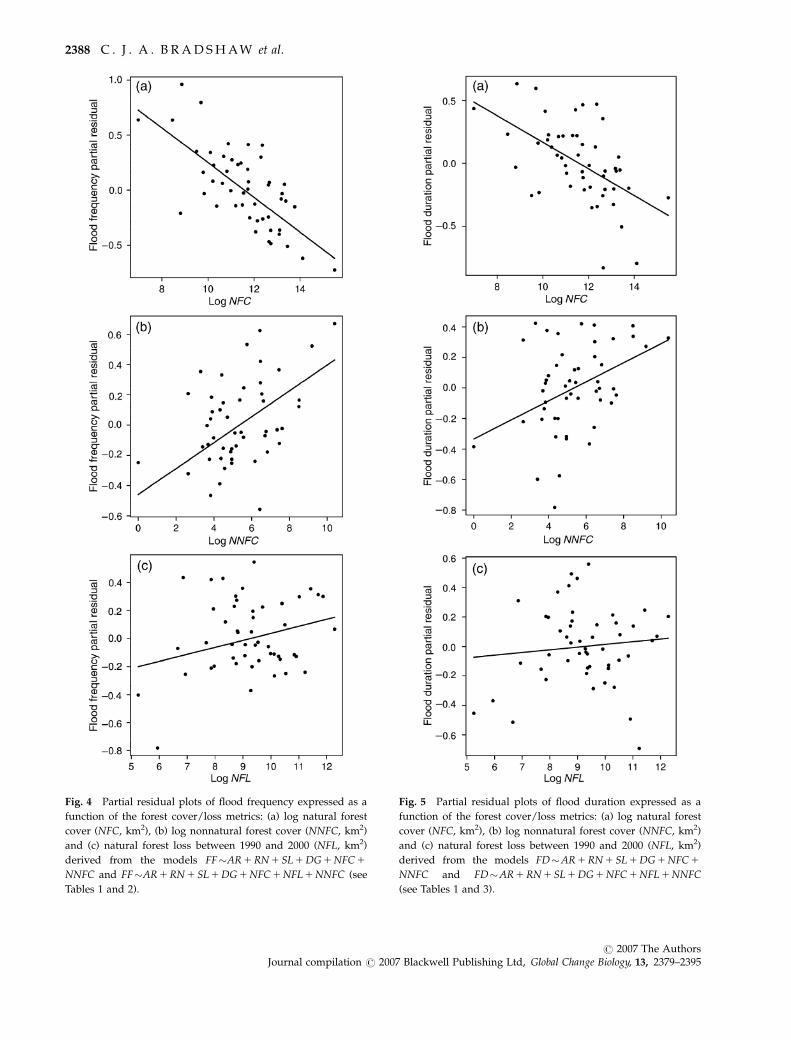
13.9% of the deviance in flood frequency (Table 2), with
flood frequency decreasing with increasing natural
forest cover and increasing with nonnatural forest
cover (Fig. 4a and b). The second-most highly ranked
model included the natural forest loss (NFL) term
(wAICc 5 0.236) and accounted for an additional 0.9%
of the deviance in flood frequency (Table 2). Examina-
tion of the partial residual plot of NFL vs. flood fre-
quency also indicated a weakly positive relationship
(Fig. 4c). The model-averaged predictions based on an
additional hypothetical loss of natural forest cover of
10% resulted in a concomitant increase in predicted
flood frequency ranging from 3.5% to 28.1% among
the countries considered.
Flood severity
The relationship between each of the four flood severity
response variables (flood duration, number of people
killed, number of people displaced and PPP-adjusted
damage) and the forest predictors was weaker than that
for flood frequency (Table 3). As for flood frequency,
flood duration was negatively correlated with natural
forest cover, positively correlated with nonnatural for-
est cover, and only weakly positively correlated with
natural forest loss (Fig. 5). The NFC and NNFC terms
accounted for an additional 13.1% of the deviance in
flood duration beyond that explained by the control
variables (Table 3). A hypothetical 10% decrease in NFC
resulted in a model-averaged predicted increase in
flood duration ranging from 3.8% to 7.9%.
The correlations between the other severity measures
and the forest predictors were weaker still, but there
was evidence for relationships with some predictors
Table 2 Generalized linear model results for the relationship between flood frequency (FF), the control variables (AR, country area;
RN, median average annual precipitation; SL, average slope; DG, total degraded area) and forest cover attributes (NFC, natural forest
cover; NFL, natural forest loss; NNFC, nonnatural forest cover) considered
Model k �LL DAICc wAICc %DE D%DE
FF�AR 1 RN 1 SL 1 DG 1 NFC 1 NNFC 8 �63.331 0.000 0.548 66.47 13.92
FF�AR 1 RN 1 SL 1 DG 1 NFC 1 NFL 1 NNFC 9 �62.679 1.684 0.236 67.33 14.78
FF�AR 1 RN 1 SL 1 DG 1 NFC 1 NFL 1 NNFC 1 NFC�NFL 10 �62.452 4.372 0.062 67.62 15.07
FF�AR 1 RN 1 SL 1 DG 1 NFC 1 NFL 1 NNFC 1 SL�NFL 10 �62.565 4.597 0.055 67.48 14.93
FF�AR 1 RN 1 SL 1 DG 1 NFC 1 NFL 1 NNFC 1 SL�NFC 10 �62.665 4.798 0.050 67.35 14.80
FF�AR 1 RN 1 SL 1 DG 1 NFL 1 NNFC 8 �66.443 6.225 0.024 62.02 9.47
FF�AR 1 RN 1 SL 1 DG 1 NFC 1 NFL 8 �66.630 6.598 0.020 61.74 9.19
FF�AR 1 RN 1 SL 1 DG 1 NFC 1 NFL 1 NNFC 1 NFC�NFL 1 SL�NFC 1 SL�NFL
12 �61.829 9.917 0.004 68.42 15.87
FF�AR 1 RN 1 SL 1 DG (control model) 6 �72.009 11.797 0.002 52.55 —
FF�1 (null model) 2 �90.646 39.374 o0.001 0.00 —
Shown for each model are the number of parameters (k), negative log-likelihood (�LL), change in Akaike’s Information Criterion
corrected for small sample sizes (DAICc), AICc weight (wAICc), the % deviance explained (%DE) in the flood frequency response
variable and the absolute increase in %DE (D%DE) above the control model (AR 1 RN 1 SL 1 DG).
2386 C . J . A . B R A D S H A W et al.
r 2007 The AuthorsJournal compilation r 2007 Blackwell Publishing Ltd, Global Change Biology, 13, 2379–2395
Page 9
Fig. 3 Partial residual plots of flood frequency expressed as a function of the control variables from the model
FF�AR 1 RN 1 SL 1 DG 1 NFC 1 NNFC (see Tables 1 and 2): (a) log country area (km2), (b) median average annual precipitation
1960–1990 (mm), (c) average slope (1) and (d) log area of degraded land (urban, cropland and cropland/natural vegetation mosaic).
Table 3 The two most highly ranked generalized linear model results for the relationships between each of the responses of flood
duration (FD), people killed (PK), people displaced (PD) and damage (DM) and the control (AR, country area; RN, median average
annual precipitation; SL, average slope; DG, total degraded area) and forest cover attributes (NFC, natural forest cover; NFL, natural
forest loss; NNFC, nonnatural forest cover)
Model k �LL DAICc wAICc %DE D%DE
Flood durationFD�AR 1 RN 1 SL 1 DG 1 NFC 1 NNFC 8 �68.171 0.000 0.539 45.53 13.06
FD�AR 1 RN 1 SL 1 DG 1 NFC 1 NFL 1 NNFC 9 �68.074 2.795 0.133 45.74 13.27
People killedPK�AR 1 RN 1 SL 1 DG (control model) 7 �89.902 0.000 0.810 42.26 —
PK�AR 1 RN 1 SL 1 DG 1 NFC 1 NNFC 9 �89.410 5.131 0.062 43.51 1.25
People displacedPD�AR 1 RN 1 SL 1 DG (control model) 7 �99.326 0.000 0.825 44.33 —
PD�AR 1 RN 1 SL 1 DG 1 NFC 1 NFL 9 �99.004 5.348 0.057 45.09 0.76
DamageDM�AR 1 RN 1 SL 1 DG (control model) 7 �45.544 0.000 0.859 60.14 —
DM�AR 1 RN 1 SL 1 DG 1 NFL 1 NNFC 9 �43.796 5.197 0.064 64.99 4.85
Shown for each model are the number of parameters (k), negative log-likelihood (�LL), change in Akaike’s Information Criterion
corrected for small sample sizes (DAICc), AICc weight (wAICc), the % deviance explained (%DE) in the flood risk and severity
response variables and the absolute increase in %DE (D%DE) above the control model (AR 1 RN 1 SL 1 DG).
D E F O R E S T AT I O N A M P L I F I E S F L O O D S 2387
r 2007 The AuthorsJournal compilation r 2007 Blackwell Publishing Ltd, Global Change Biology, 13, 2379–2395
Page 10
Fig. 4 Partial residual plots of flood frequency expressed as a
function of the forest cover/loss metrics: (a) log natural forest
cover (NFC, km2), (b) log nonnatural forest cover (NNFC, km2)
and (c) natural forest loss between 1990 and 2000 (NFL, km2)
derived from the models FF�AR 1 RN 1 SL 1 DG 1 NFC 1
NNFC and FF�AR 1 RN 1 SL 1 DG 1 NFC 1 NFL 1 NNFC (see
Tables 1 and 2).
Fig. 5 Partial residual plots of flood duration expressed as a
function of the forest cover/loss metrics: (a) log natural forest
cover (NFC, km2), (b) log nonnatural forest cover (NNFC, km2)
and (c) natural forest loss between 1990 and 2000 (NFL, km2)
derived from the models FD�AR 1 RN 1 SL 1 DG 1 NFC 1
NNFC and FD�AR 1 RN 1 SL 1 DG 1 NFC 1 NFL 1 NNFC
(see Tables 1 and 3).
2388 C . J . A . B R A D S H A W et al.
r 2007 The AuthorsJournal compilation r 2007 Blackwell Publishing Ltd, Global Change Biology, 13, 2379–2395
Page 11
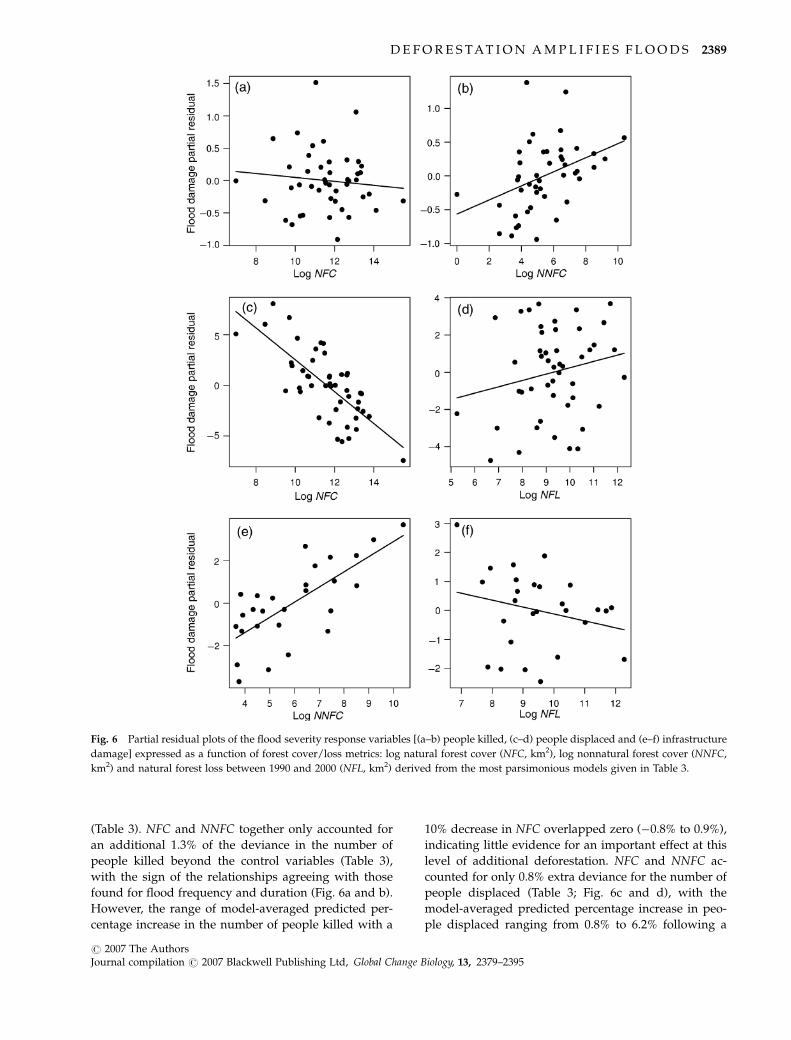
(Table 3). NFC and NNFC together only accounted for
an additional 1.3% of the deviance in the number of
people killed beyond the control variables (Table 3),
with the sign of the relationships agreeing with those
found for flood frequency and duration (Fig. 6a and b).
However, the range of model-averaged predicted per-
centage increase in the number of people killed with a
10% decrease in NFC overlapped zero (�0.8% to 0.9%),
indicating little evidence for an important effect at this
level of additional deforestation. NFC and NNFC ac-
counted for only 0.8% extra deviance for the number of
people displaced (Table 3; Fig. 6c and d), with the
model-averaged predicted percentage increase in peo-
ple displaced ranging from 0.8% to 6.2% following a
Fig. 6 Partial residual plots of the flood severity response variables [(a–b) people killed, (c–d) people displaced and (e–f) infrastructure
damage] expressed as a function of forest cover/loss metrics: log natural forest cover (NFC, km2), log nonnatural forest cover (NNFC,
km2) and natural forest loss between 1990 and 2000 (NFL, km2) derived from the most parsimonious models given in Table 3.
D E F O R E S T AT I O N A M P L I F I E S F L O O D S 2389
r 2007 The AuthorsJournal compilation r 2007 Blackwell Publishing Ltd, Global Change Biology, 13, 2379–2395
Page 12
10% decrease in NFC. NFL and NNFC together ac-
counted for nearly 5% additional deviance in the damage
response (Table 3; Fig. 6d and e), but the model-
averaged prediction indicated little effect of decreasing
NFC given this term’s lack of explanatory support in the
models considered (Table 3).
Discussion
Our results provide the first globally comprehensive
and empirical link between deforestation and flood
frequency, and support the conclusions drawn from
previously localized studies, such as those from the
Amazon (Sternberg, 1987), China (Lang, 2002) and
Tanzania (Sandstrom, 1995) which sustain this notion.
However, not all local studies have pointed to defor-
estation as a key driver of floods (FAO & CIFOR, 2005;
Calder & Aylward, 2006), implying that broad-scale
patterns are not always mimicked at finer scales, and
vice versa (Bruijnzeel, 2004). Indeed, flood-risk estima-
tion is an inherently uncertain business, and even rain-
fall data can be surprisingly uninformative about flood
frequency at the catchment scale (Reed, 2002). The
mechanisms driving the increase in water flows follow-
ing vegetation removal are complex and still controver-
sial. The majority of the increased discharge is normally
observed as baseflow, provided the intake capacity of
the soil’s surface is not impaired too much during the
removal process (Bruijnzeel, 1990).
The complex interplay of factors such as rainfall
variation, elevation and distance to the coast, catchment
steepness, soil depth, the degree of disturbance to
undergrowth and soil, and soil fertility (reviewed in
Bruijnzeel, 2004) and their relative importance vary
widely among sites, so typically a suite of process
studies are required to understand the effects of vegeta-
tion removal on flooding frequency and intensity.
Moreover, the strong relationship between evapotran-
spiration rates and rainfall (Zhang et al., 2001) will
contribute further site-specific complexity to estimates
of flooding risk. Yet despite the suite of complex and
confounding relationships between these potential dri-
vers of flood risk, our models explained over 65% of the
deviance (analogous to a least-squares R2 value) in
flood frequency, and we found important contributions
of all control variables (area, slope, rainfall and de-
graded area). This is particularly notable when one
considers the broad spatial unit of investigation (coun-
try) and the diversity of catchment types within each
country. This apparent explanatory power thus sug-
gests that average values, examined over the global
scale, provide evidence that the variables considered
were valid and relevant predictors of flood risk.
Our analysis revealed a nontrivial correlation be-
tween natural forest cover/forest loss and flood fre-
quency at a global spatial scale, as opposed to temporal
predictions at the catchment scale. Of course, our re-
sults assume that all major variables accounting for
variation in flood frequency values among countries
were considered (i.e. the control variables included).
Our models showed model-averaged predictions of
increased flood frequency ranging from 4% to 28% with
just a 10% loss in natural forest cover. This reinforces the
conclusion that global-scale empirical studies such as
ours are critical for resolving the debate surrounding
the general role of forests in influencing flood fre-
quency, local factors notwithstanding. The result also
stresses the need for local governments to think at
broad spatial scales when planning flood mitigation
policies. However, some caution should be exercised
when interpreting the predicted ranges of expected
increases in flood risk. The forest cover data are derived
from a variety of sources and spatial scales, suggesting
that sometimes important errors in land cover assess-
ments may arise (Matthews, 2001). However, despite
the potential errors and the magnitude of the modelled
effects, and the assumption that all major drivers of
flood risk were considered, the relationships we found
are indicative of the role of natural forest cover in
mitigating flood risk.
The relationships between the various indices of
flood severity and forest cover were generally weaker;
however, there were still some detectable correlations.
The full models including control variables accounted
for 42–65% of the deviance in the responses (Table 3),
suggesting again that modelling flood characteristics at
the global scale using country-scale landscape features
is tractable. Of the responses considered, flood duration
had the strongest correlation with natural forest cover.
As for the other severity response variables (people
killed, people displaced and damage), they are prone
to many uncertainties, not least of which is each
country’s ability to prepare for floods and minimize
damage to property and human casualties. However,
the weaker relationships do not necessarily imply that
forest cover has little influence on flood severity. For
instance, our analyses did not take into account small
floods, nor did they consider potential changes in
hydrological regimes caused by global climate change
(Panagoulia & Dimou, 1997; Cameron et al., 2000;
Schreider et al., 2000). Modified weather patterns
(Meehl et al., 2000) resulting from global climate change
(Kerr, 2004; Murphy et al., 2004) will also act to increase
the complexity of interactions between land cover and
flooding frequency and severity (Bruijnzeel, 2004).
Moreover, our models could not incorporate the in-
creasing trend for people in land-restricted areas to
2390 C . J . A . B R A D S H A W et al.
r 2007 The AuthorsJournal compilation r 2007 Blackwell Publishing Ltd, Global Change Biology, 13, 2379–2395
Page 13
develop and settle in flood-prone areas around the
world that were avoided previously (FAO & CIFOR,
2005). Nonetheless, our empirical results indicate that
halting deforestation or reducing the rate of natural
forest loss should be beneficial in alleviating the inci-
dence and severity of floods that ultimately cause
undesirable societal disruption and damage to human
life and property.
The empirical links between deforestation and flood
risk and severity demonstrated here reinforce the no-
tion that politicians and landscape planners must im-
plement tangible actions, such as protection of existing
natural forests and reforestation activities (Carroll et al.,
2004). The latter should ideally be done using native
trees, because exotic tree species generally have lower
conservation value for native biodiversity (Sodhi et al.,
2005) and may not always affect water yields in the
same manner as native vegetation (Bruijnzeel, 2004).
Indeed, our models demonstrated a positive relation-
ship between nonnatural forest area (NNFC) and all but
one (people displaced) of the flood response variables
considered, suggesting that in some circumstances,
nonnative vegetation may do more harm than good in
mitigating flood severity. It should also be noted that
reforestation may not always bring about only positive
effects – for example, extensive reforestation in mon-
soonal climates can lead to severely diminished stream-
flows during the dry season that may engender a suite
of other problems, potentially offsetting any advantages
gained by flood reduction (Scott et al., 2005).
Demonstrations of the relationships between the con-
servation of nature and benefits to human welfare
(Lilley et al., 1997) provide the relevant perspective
that is often necessary to convince people of the value
of natural systems and encourage policy makers to
include social and economic planning with technologi-
cal approaches to water management (Calder, 1999).
This is particularly necessary for the developing world,
where funds to cope with disasters are extremely
limited, and flood-related catastrophes will suppress
economic growth and prosperity (Wang, 2004). The
concept of conservation of natural habitats needs to
extend beyond the notion of saving imperiled biotas
to include the welfare of disadvantaged humans around
the world.
Acknowledgements
This research was supported by the National University ofSingapore (R-154-000-264-112) and Charles Darwin University.We thank B. Campbell, M. Douglas, R. Wasson, L. Bruijnzeel andthree anonymous reviewers for helpful comments to improvethe manuscript. NSS conceived the research, K. S.-H. P. and C. J.A. B. constructed the database, C. J. A. B. and B. W. B. did theanalyses, and C. J. A. B., N. S. S., B. W. B. wrote the paper.
References
Achard F, Eva HD, Stibig HJ, Mayaux P, Gallego J, Richards T,
Malingreau JP (2002) Determination of deforestation rates of
the world’s humid tropical forests. Science, 297, 999–1002.
Agarwal A, Chak A (eds) (1991) State of India’s Environment 3.
Floods, Flood Plains and Environmental Myths. Centre for
Science and Environment, Excellent Printing House, New
Delhi, India.
Arnaud P, Lavabre J (2002) Coupled rainfall model and dis-
charge model for flood frequency estimation. Water Resources
Research, 38, 1075.
Balmford A, Bruner A, Cooper P et al. (2002) Economic reasons
for conserving wild nature. Science, 297, 950–953.
Balmford A, Green RE, Jenkins M (2003) Measuring the changing
state of nature. Trends in Ecology and Evolution, 18, 326–330.
Beljaars ACM, Viterbo P, Miller MJ, Betts AK (1996) The anom-
alous rainfall over the United States during July 1993: sensi-
tivity to land surface parameterization and soil moisture
anomalies. Monthly Weather Reviews, 124, 362–383.
Blaikie PM, Muldavin JSS (2004) Upstream, downstream, China,
India: the politics of environment in the Himalayan region.
Annals of the Association of American Geographers, 94, 520–548.
Brook BW, Sodhi NS, Ng PKL (2003) Catastrophic extinctions
follow deforestation in Singapore. Nature, 424, 420–423.
Bruijnzeel LA (1990) Hydrology of Moist Tropical Forest and Effects
of Conversion: A State of Knowledge Review. UNESCO/Vrije
Universiteit, Paris/Amsterdam, the Netherlands.
Bruijnzeel LA (2004) Hydrological functions of tropical forests:
not seeing the soil for the trees? Agriculture, Ecosystems and
Environment, 104, 185–228.
Burnham KP, Anderson DR (2002) Model Selection and Multimodal
Inference: A Practical Information-Theoretic Approach, 2nd edn.
Springer-Verlag, New York, USA.
Burnham KP, Anderson DR (2004) Understanding AIC and BIC
in model selection. Sociological Methods and Research, 33,
261–304.
Calder IR (1999) The Blue Revolution. Earthscan Publications,
London.
Calder IR, Aylward B (2006) Forests and floods: moving to an
evidence-based approach to watershed and integrated flood
management. Water International, 31, 87–99.
Cameron D, Beven K, Naden P (2000) Flood frequency estima-
tion by continuous simulation under climate change (with
uncertainty). Hydrology and Earth System Sciences, 4, 393–405.
Carroll ZL, Bird SB, Emmett BA, Reynolds B, Sinclair FL (2004)
Can tree shelterbelts on agricultural land reduce flood risk.
Soil Use and Management, 20, 257–359.
Cassardo C, Balsamo GP, Cacciamani C, Cesari D, Paccagnella T,
Pelosini R (2002) Impact of soil surface moisture initialization
on rainfall in a limited area model: a case study of the 1995
South Ticino flash flood. Hydrological Processes, 16, 1301–1317.
Chivian E (2002) Biodiversity: Its Importance to Human Health.
Center for Health and the Global Environment, Harvard
Medical School, Cambridge, MA.
Clark C (1987) Deforestation and floods. Environmental Conserva-
tion, 14, 67–69.
Costa MH, Botta A, Cardille JA (2003) Effects of large-scale
changes in land cover on the discharge of the Tocantins
D E F O R E S T AT I O N A M P L I F I E S F L O O D S 2391
r 2007 The AuthorsJournal compilation r 2007 Blackwell Publishing Ltd, Global Change Biology, 13, 2379–2395
Page 14
river, South Eastern Amazonia. Journal of Hydrology, 283,
206–217.
Cunderlik JM, Burn DH (2002) Analysis of the linkage between
rain and flood regime and its application to regional flood
frequency estimation. Journal of Hydrology, 261, 115–131.
Daily GC (1997) Nature’s Services. Island Press, Washington, DC.
Dıaz S, Fargione J, Chapin FS, Tilman D (2006) Biodiversity loss
threatens human well-being. PLoS Biology, 4, e277.
FAO, CIFOR (2005) Forests and Floods: Drowning in Fiction or
Thriving on Facts? Food and Agriculture Organization of
the United Nations and Center for International Forestry
Research, Bangkok, Thailand.
Franks SW, Kuczera G (2002) Flood frequency analysis: evidence
and implications of secular climate variability, New South
Wales. Water Resources Research, 38, 20-21–20-27.
Hall FG, Collatz G, Los S et al. (eds) (2005) ISLSCP Initiative II.
National Aeronautics and Space Administration DVD/CD-
ROM, Cape Canaveral, FL.
Hijmans RJ, Cameron SE, Parra JL, Jones PG, Jarvis A (2005) Very
high resolution interpolated climate surfaces for global land
areas. International Journal of Climatology, 2, 1965–1978.
Jackson DA, Somers KM (1991) The spectre of spurious correla-
tions. Oecologia, 86, 147–151.
Jepson P (2001) Global biodiversity plan needs to convince local
policy-makers. Nature, 409, 12.
Jonkman SN (2005) Global perspectives on loss of human life
caused by floods. Natural Hazards, 34, 151–175.
Kar R, Kar RK (1999) Mangroves can check the wrath of tsunami.
Current Science, 88, 675.
Kerr JT, Currie DJ (1995) Effects of human activity on global
extinction risk. Conservation Biology, 9, 1528–1538.
Kerr RA (2004) Climate change – three degrees of consensus.
Science, 305, 932–934.
Kiem AS, Franks SW, Kuczera G (2003) Multi-decadal variability
of flood risk. Geophysical Research Letters, 30, 7-1–7-4.
Lang G (2002) Forests, floods, and the environmental state in
China. Organization and Environment, 15, 109–130.
Laurance WF (1999) Reflections on the tropical deforestation
crisis. Biological Conservation, 91, 109–117.
Laurance WF, Williamson GB (2001) Positive feedbacks among
forest fragmentation, drought, and climate change in the
Amazon. Conservation Biology, 15, 1529–1535.
Lilley B, Lammie P, Dickerson J, Eberhard M (1997) An increase
in hookworm infection temporally associated with ecologic
change. Emerging Infectious Diseases, 3, 391–393.
Link WA, Barker RJ (2006) Model weights and the foundations of
multimodel inference. Ecology, 87, 2626–2635.
Loveland TR, Reed BC, Brown JF, Ohlen DO, Zhu Z, Yang L,
Merchant J (2000) Global Land Cover Characteristics Database
(GLCCD) Version 2.0. United States Geological Survey (USGS).
Available from: http://edcdaac.usgs.gov/glcc/
Matthews E (2001) Understanding the FRA 2000. World Resources
Institute Forest Briefing No. 1. World Resources Institute,
Washington, DC.
Meehl GA, Zwiers F, Evans J, Knutson T, Mearns L, Whetton P
(2000) Trends in extreme weather and climate events: issues
related to modeling extremes in projections of future climate
change. Bulletin of the Meteorological Society, 81, 427–436.
Murphy JM, Sexton DMH, Barnett DN, Jones GS, Webb MJ,
Collins M, Stainforth DA (2004) Quantification of modelling
uncertainties in a large ensemble of climate change simula-
tions. Nature, 430, 768–772.
Muzik I (2002) A first-order analysis of the climate change effect
on flood frequencies in a subalpine watershed by means of a
hydrological rainfall-runoff model. Journal of Hydrology, 267,
65–73.
Myers N, Mittermeier RA, Mittermeier CG, da Fonseca GAB,
Kent J (2000) Biodiversity hotspots for conservation priorities.
Nature, 403, 853–858.
Natural Resources Conservation Service (1997) Soil Climate Map.
United States Department of Agriculture, Natural Resources
Conservation Service, Soil Survey Division, World Soil Re-
sources, Washington, DC. Available from: http://soils.usda.
gov/use/worldsoils/mapindex/smr.html
Panagoulia D, Dimou G (1997) Sensitivity of flood events to
global climate change. Journal of Hydrology, 191, 208–222.
Prudhomme C, Reynard N, Crooks S (2002) Downscaling of
global climate models for flood frequency analysis: where are
we now? Hydrological Processes, 16, 1137–1150.
R Development Core Team (2004) R: A Language and Environ-
ment for Statistical Computing. R Foundation for Statistical
Computing, Vienna, Austria. Available from: http://www.
R-project.org
Reed DW (2002) Reinforcing flood-risk estimation. Philosophical
Transactions of the Royal Society of London Series A – Mathematical
Physical and Engineering Sciences, 360, 1373–1387.
Ricketts TH, Daily GC, Ehrlich PR, Michener CD (2004) Econom-
ic value of tropical forest to coffee production. Proceedings of the
National Academy of Sciences of the USA, 101, 12579–12582.
Sandstrom K (1995) The recent Lake Babati floods in semi-arid
Tanzania: a response to changes in land cover? Geografiska
Annaler Series A – Physical Geography, 77, 35–44.
Schreider SY, Smith DI, Jakeman AJ (2000) Climate change
impacts on urban flooding. Climatic Change, 47, 91–115.
Scott D, Bruijnzeel LA, Mackensen J (2005) The hydrological and
soil impacts of forestation in the tropics. In: Forests, Water and
People in the Humid Tropics (eds Bonnell M, Bruijnzeel LA), pp.
622–651. Cambridge University Press, Cambridge.
Sodhi NS, Brook BW, Bradshaw CJA (2007) Tropical Conservation
Biology. Blackwell Publishing, Oxford.
Sodhi NS, Soh MCK, Prawiradilaga DM, Darjono, Brook BW
(2005) Persistence of lowland rainforest birds in a recently
logged area in Java. Bird Conservation International, 15, 173–191.
Sternberg HO (1987) Aggravation of floods in the Amazon River
as a consequence of deforestation. Geografiska Annaler Series A
– Physical Geography, 69, 201–219.
Vittor AY, Gilman RH, Tielsch J, Glass G, Shields T, Lozano WS,
Pinedo-Cancino V, Patz JA (2006) The effect of deforestation on
the human-biting rate of Anopheles darlingi, the primary vector
of Falciparum malaria in the Peruvian Amazon. American Jour-
nal of Tropical Medicine and Hygiene, 74, 3–11.
Wang Y (2004) Environmental degradation and environmental
threats in China. Environmental Monitoring and Assessment, 90,
161–169.
Ward RC, Robinson M (1990) Principles of Hydrology, 2nd edn.
McGraw-Hill, London.
2392 C . J . A . B R A D S H A W et al.
r 2007 The AuthorsJournal compilation r 2007 Blackwell Publishing Ltd, Global Change Biology, 13, 2379–2395
Page 15
Whittingham MJ, Stephens PA, Bradbury RB, Freckleton RP
(2006) Why do we still use stepwise modelling in ecology
and behaviour? Journal of Animal Ecology, 75, 1182–1189.
Zhang L, Dawes WR, Walker GR (2001) Response of mean
annual evapotranspiration to vegetation changes at catchment
scale. Water Resources Research, 37, 701–708.
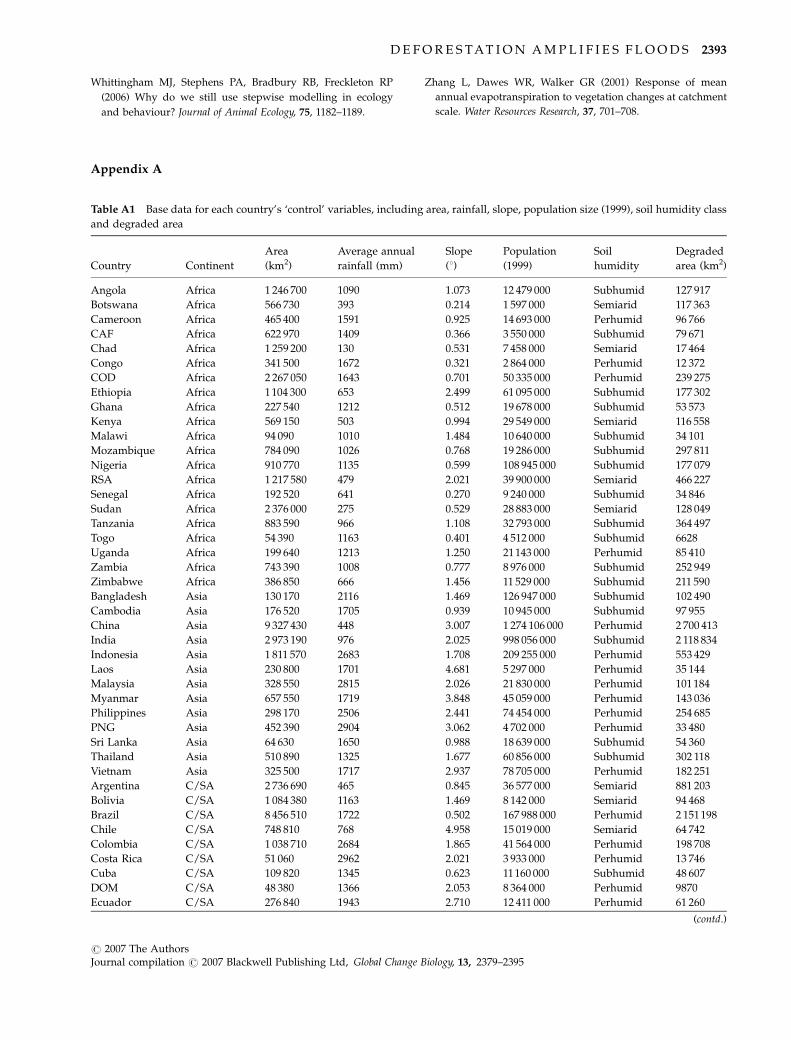
Table A1 Base data for each country’s ‘control’ variables, including area, rainfall, slope, population size (1999), soil humidity class
and degraded area
Country Continent
Area
(km2)
Average annual
rainfall (mm)
Slope
(1)
Population
(1999)
Soil
humidity
Degraded
area (km2)
Angola Africa 1 246 700 1090 1.073 12 479 000 Subhumid 127 917
Botswana Africa 566 730 393 0.214 1 597 000 Semiarid 117 363
Cameroon Africa 465 400 1591 0.925 14 693 000 Perhumid 96 766
CAF Africa 622 970 1409 0.366 3 550 000 Subhumid 79 671
Chad Africa 1 259 200 130 0.531 7 458 000 Semiarid 17 464
Congo Africa 341 500 1672 0.321 2 864 000 Perhumid 12 372
COD Africa 2 267 050 1643 0.701 50 335 000 Perhumid 239 275
Ethiopia Africa 1104 300 653 2.499 61 095 000 Subhumid 177 302
Ghana Africa 227 540 1212 0.512 19 678 000 Subhumid 53 573
Kenya Africa 569 150 503 0.994 29 549 000 Semiarid 116 558
Malawi Africa 94 090 1010 1.484 10 640 000 Subhumid 34 101
Mozambique Africa 784 090 1026 0.768 19 286 000 Subhumid 297 811
Nigeria Africa 910 770 1135 0.599 108 945 000 Subhumid 177 079
RSA Africa 1 217 580 479 2.021 39 900 000 Semiarid 466 227
Senegal Africa 192 520 641 0.270 9 240 000 Subhumid 34 846
Sudan Africa 2 376 000 275 0.529 28 883 000 Semiarid 128 049
Tanzania Africa 883 590 966 1.108 32 793 000 Subhumid 364 497
Togo Africa 54 390 1163 0.401 4 512 000 Subhumid 6628
Uganda Africa 199 640 1213 1.250 21143 000 Perhumid 85 410
Zambia Africa 743 390 1008 0.777 8 976 000 Subhumid 252 949
Zimbabwe Africa 386 850 666 1.456 11 529 000 Subhumid 211 590
Bangladesh Asia 130 170 2116 1.469 126 947 000 Subhumid 102 490
Cambodia Asia 176 520 1705 0.939 10 945 000 Subhumid 97 955
China Asia 9 327 430 448 3.007 1 274 106 000 Perhumid 2 700 413
India Asia 2 973 190 976 2.025 998 056 000 Subhumid 2 118 834
Indonesia Asia 1 811 570 2683 1.708 209 255 000 Perhumid 553 429
Laos Asia 230 800 1701 4.681 5 297 000 Perhumid 35 144
Malaysia Asia 328 550 2815 2.026 21 830 000 Perhumid 101184
Myanmar Asia 657 550 1719 3.848 45 059 000 Perhumid 143 036
Philippines Asia 298 170 2506 2.441 74 454 000 Perhumid 254 685
PNG Asia 452 390 2904 3.062 4 702 000 Perhumid 33 480
Sri Lanka Asia 64 630 1650 0.988 18 639 000 Subhumid 54 360
Thailand Asia 510 890 1325 1.677 60 856 000 Subhumid 302 118
Vietnam Asia 325 500 1717 2.937 78 705 000 Perhumid 182 251
Argentina C/SA 2 736 690 465 0.845 36 577 000 Semiarid 881 203
Bolivia C/SA 1 084 380 1163 1.469 8 142 000 Semiarid 94 468
Brazil C/SA 8 456 510 1722 0.502 167 988 000 Perhumid 2 151198
Chile C/SA 748 810 768 4.958 15 019 000 Semiarid 64 742
Colombia C/SA 1 038 710 2684 1.865 41 564 000 Perhumid 198 708
Costa Rica C/SA 51 060 2962 2.021 3 933 000 Perhumid 13 746
Cuba C/SA 109 820 1345 0.623 11160 000 Subhumid 48 607
DOM C/SA 48 380 1366 2.053 8 364 000 Perhumid 9870
Ecuador C/SA 276 840 1943 2.710 12 411 000 Perhumid 61 260
(contd.)
Appendix A
D E F O R E S T AT I O N A M P L I F I E S F L O O D S 2393
r 2007 The AuthorsJournal compilation r 2007 Blackwell Publishing Ltd, Global Change Biology, 13, 2379–2395
Page 16
Table A1. (Contd.)
Country Continent
Area
(km2)
Average annual
rainfall (mm)
Slope
(1)
Population
(1999)
Soil
humidity
Degraded
area (km2)
El Salvador C/SA 20 720 1829 4.571 6 154 000 Subhumid 13 555
Guatemala C/SA 108 430 1771 3.155 11 090 000 Perhumid 36 972
Guyana C/SA 214 980 1971 0.456 855 000 Perhumid 18 731
Honduras C/SA 111 890 1619 3.419 6 316 000 Perhumid 40 376
Jamaica C/SA 10 830 1853.5 1.663 2 560 000 Perhumid 1285
Mexico C/SA 1 908 690 616 2.613 97 365 000 Semiarid 326 063
Nicaragua C/SA 121 400 2237 1.439 4 938 000 Perhumid 44 783
Panama C/SA 74 430 2614.5 1.387 2 812 000 Perhumid 24 930
Paraguay C/SA 397 300 1048 0.355 5 358 000 Perhumid 53 676
Peru C/SA 1 280 000 1717 2.541 25 230 000 Perhumid 87 910
TRI C/SA 5130 2055 0.469 1 289 000 Perhumid 1422
Uruguay C/SA 174 810 1227 0.461 3 313 000 Perhumid 103 120
Venezuela C/SA 882 060 1740 1.293 23 706 000 Perhumid 93 475
CAF, Central African Republic; COD, Democratic Republic of Congo; RSA, Republic of South Africa; PNG, Papua New Guinea;
C/SA, Central/South America; DOM, Dominican Republic; TRI, Trinidad & Tobago.
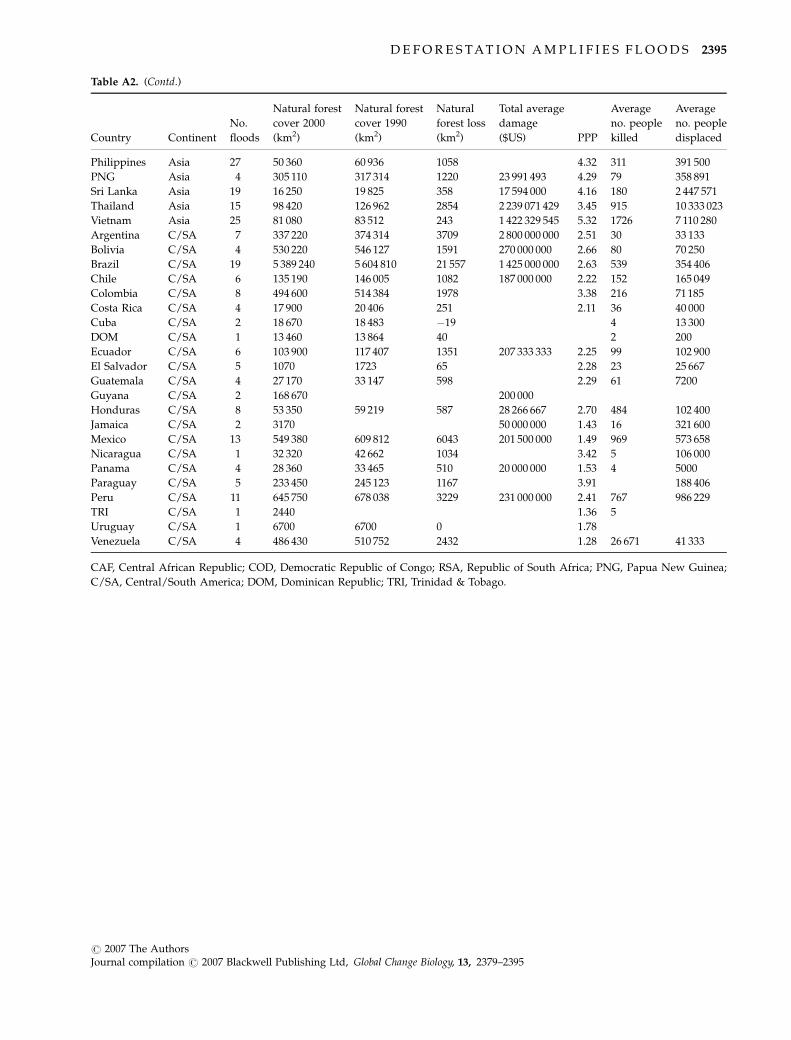
Table A2 Forest cover, flood frequency and flood severity data for each country
Country Continent
No.
floods
Natural forest
cover 2000
(km2)
Natural forest
cover 1990
(km2)
Natural
forest loss
(km2)
Total average
damage
($US) PPP
Average
no. people
killed
Average
no. people
displaced
Angola Africa 1 696 150 710 073 13 923 10 000 000 2.58 31 70 000
Botswana Africa 1 124 260 135 443 1118 2.55 20 2000
Cameroon Africa 2 237 780 259 180 2140 3.45 9 1000
CAF Africa 1 229 030 4.00 200
Chad Africa 2 126 780 134 387 761 4.44 2 260 000
Congo Africa 3 219 770 221 968 220 1.36 6000
COD Africa 2 1 351100 1 405 144 5404 6.40 16
Ethiopia Africa 18 43 770 47 709 394 28 800 000 8.00 921 826 721
Ghana Africa 5 62 590 73 856 1127 62 500 000 7.64 11 320 1 000 000
Kenya Africa 3 168 650 177 083 843 2.86 20 88 500
Malawi Africa 4 24 500 30 870 637 96 000 000 3.53 673 303 000
Mozambique Africa 8 305 510 311 620 611 169 600 000 5.00 247 1 092 000
Nigeria Africa 13 128 240 164 147 3591 2.68 313 992 333
RSA Africa 13 73 630 75 839 221 85 150 000 3.92 258 18 005
Senegal Africa 1 59 420 64 768 535 3.26
Sudan Africa 9 609 860 701 339 9148 180 810 000 4.67 215 1 047 825
Tanzania Africa 11 386 760 20 790 000 2.06 5328 5 692 156
Togo Africa 2 4720 6514 179 16 000 000 5.38 4 165 000
Uganda Africa 3 41 470 49 764 829 3 000 000 5.59 69 60 000
Zambia Africa 1 311 710 386 520 7481 0.06 12 000
Zimbabwe Africa 2 188 990 219 228 3024 1 500
Bangladesh Asia 48 7090 7657 57 4 631 698 286 4.72 3813 50 049 706
Cambodia Asia 8 92 450 97 997 555 221 000 000 6.58 688 1 966 957
China Asia 99 1183 970 1112 932 �7104 4.69 12 931 95 080 367
India Asia 67 315 350 435 183 11 983 8 392 033 765 5.61 11174 99 719 752
Indonesia Asia 41 951160 1 093 834 14 267 4 101 256 091 4.34 1112 2 236 140
Laos Asia 4 125 070 131 324 625 5.29 62 81 600
Malaysia Asia 7 175 430 199 990 2456 174 867 000 2.40 225 54 600
Myanmar Asia 7 335 980 386 377 5040 525 324 303
(contd.)
2394 C . J . A . B R A D S H A W et al.
r 2007 The AuthorsJournal compilation r 2007 Blackwell Publishing Ltd, Global Change Biology, 13, 2379–2395
Page 17
Table A2. (Contd.)
Country Continent
No.
floods
Natural forest
cover 2000
(km2)
Natural forest
cover 1990
(km2)
Natural
forest loss
(km2)
Total average
damage
($US) PPP
Average
no. people
killed
Average
no. people
displaced
Philippines Asia 27 50 360 60 936 1058 4.32 311 391 500
PNG Asia 4 305 110 317 314 1220 23 991 493 4.29 79 358 891
Sri Lanka Asia 19 16 250 19 825 358 17 594 000 4.16 180 2 447 571
Thailand Asia 15 98 420 126 962 2854 2 239 071 429 3.45 915 10 333 023
Vietnam Asia 25 81 080 83 512 243 1 422 329 545 5.32 1726 7 110 280
Argentina C/SA 7 337 220 374 314 3709 2 800 000 000 2.51 30 33 133
Bolivia C/SA 4 530 220 546 127 1591 270 000 000 2.66 80 70 250
Brazil C/SA 19 5 389 240 5 604 810 21 557 1 425 000 000 2.63 539 354 406
Chile C/SA 6 135 190 146 005 1082 187 000 000 2.22 152 165 049
Colombia C/SA 8 494 600 514 384 1978 3.38 216 71185
Costa Rica C/SA 4 17 900 20 406 251 2.11 36 40 000
Cuba C/SA 2 18 670 18 483 �19 4 13 300
DOM C/SA 1 13 460 13 864 40 2 200
Ecuador C/SA 6 103 900 117 407 1351 207 333 333 2.25 99 102 900
El Salvador C/SA 5 1070 1723 65 2.28 23 25 667
Guatemala C/SA 4 27 170 33 147 598 2.29 61 7200
Guyana C/SA 2 168 670 200 000
Honduras C/SA 8 53 350 59 219 587 28 266 667 2.70 484 102 400
Jamaica C/SA 2 3170 50 000 000 1.43 16 321 600
Mexico C/SA 13 549 380 609 812 6043 201 500 000 1.49 969 573 658
Nicaragua C/SA 1 32 320 42 662 1034 3.42 5 106 000
Panama C/SA 4 28 360 33 465 510 20 000 000 1.53 4 5000
Paraguay C/SA 5 233 450 245 123 1167 3.91 188 406
Peru C/SA 11 645 750 678 038 3229 231 000 000 2.41 767 986 229
TRI C/SA 1 2440 1.36 5
Uruguay C/SA 1 6700 6700 0 1.78
Venezuela C/SA 4 486 430 510 752 2432 1.28 26 671 41 333
CAF, Central African Republic; COD, Democratic Republic of Congo; RSA, Republic of South Africa; PNG, Papua New Guinea;
C/SA, Central/South America; DOM, Dominican Republic; TRI, Trinidad & Tobago.
D E F O R E S T AT I O N A M P L I F I E S F L O O D S 2395
r 2007 The AuthorsJournal compilation r 2007 Blackwell Publishing Ltd, Global Change Biology, 13, 2379–2395