25
Global Financial Stability Outlook José Viñals Financial Counsellor and Director of the Monetary and Capital Markets Department PIIE, October 21, 2015
Global Financial Stability
Outlook
José Viñals
Financial Counsellor and Director of the Monetary and Capital Markets Department
PIIE, October 21, 2015

Financial
Stability Not
Yet Assured
Financial stability in
advanced economies
improved…
…but risks continue
to rotate to emerging
markets
Three Global
Transitions
• China rebalancing
• U.S. monetary
normalization
• Unraveling of the
commodity cycle
1
Global Financial Stability Needs Urgent Policy Upgrade
Policy
Upgrade
Needed
Collective effort to
enhance confidence
and build resilience
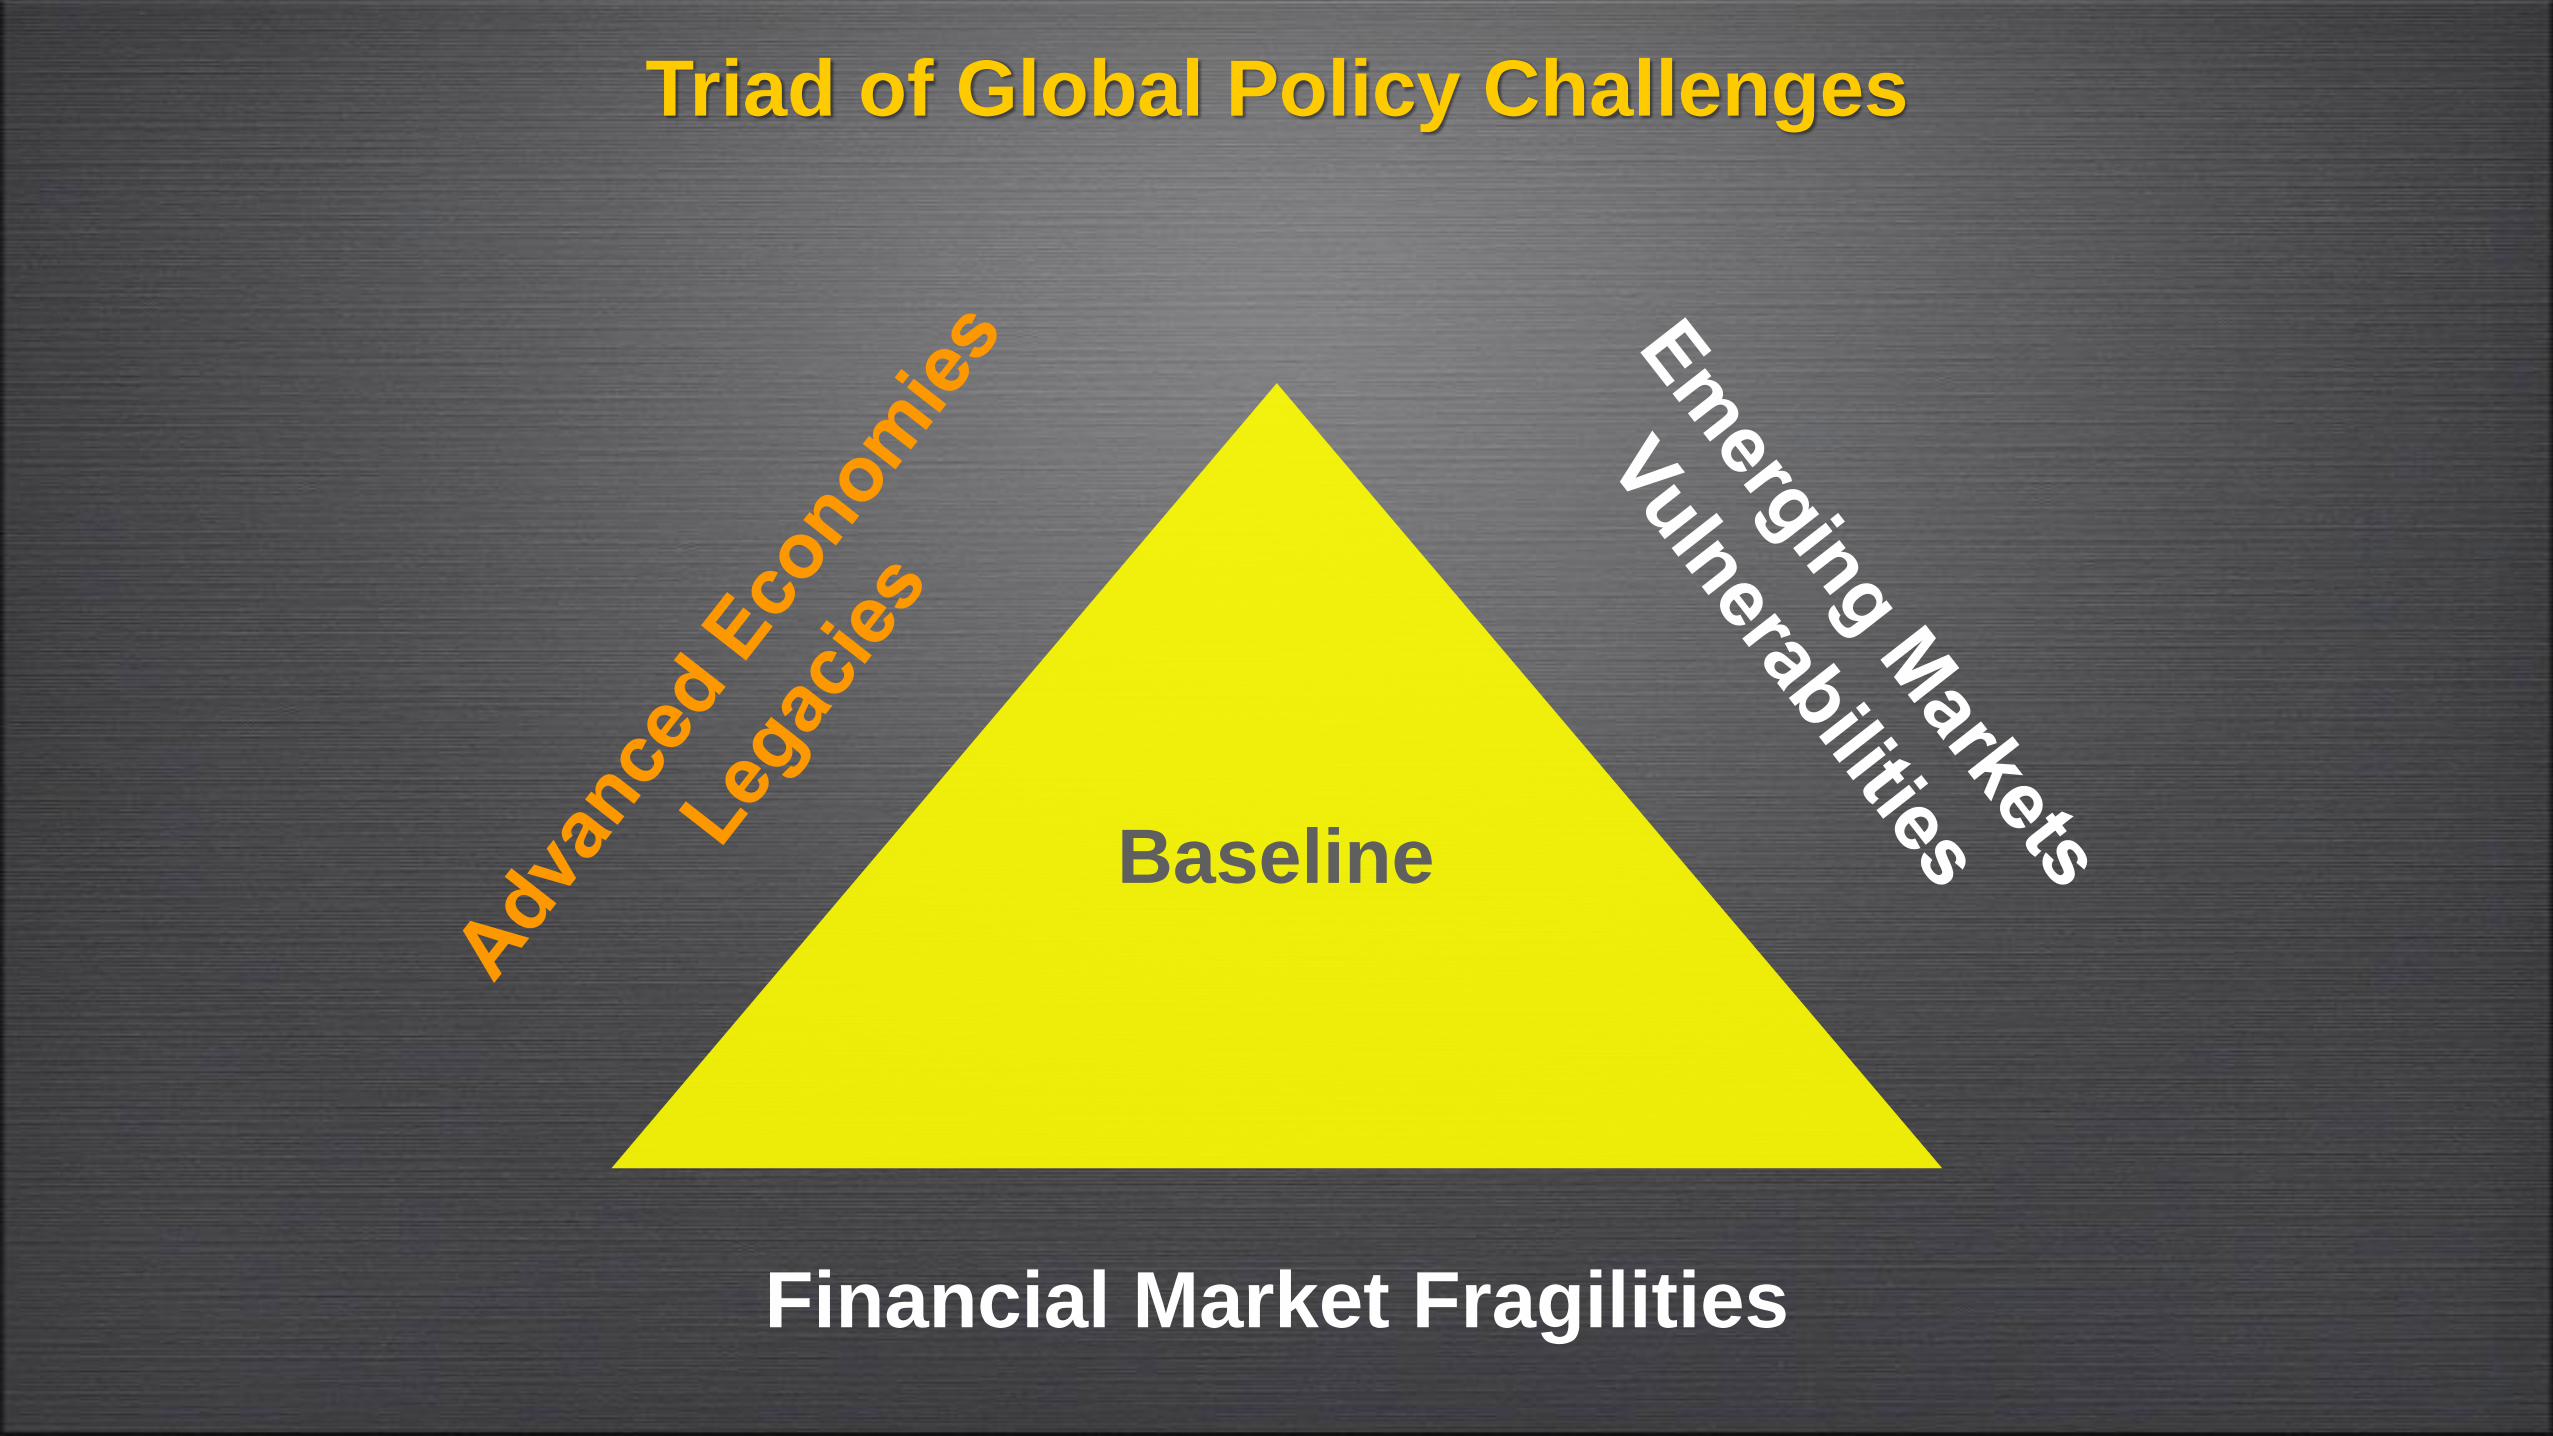
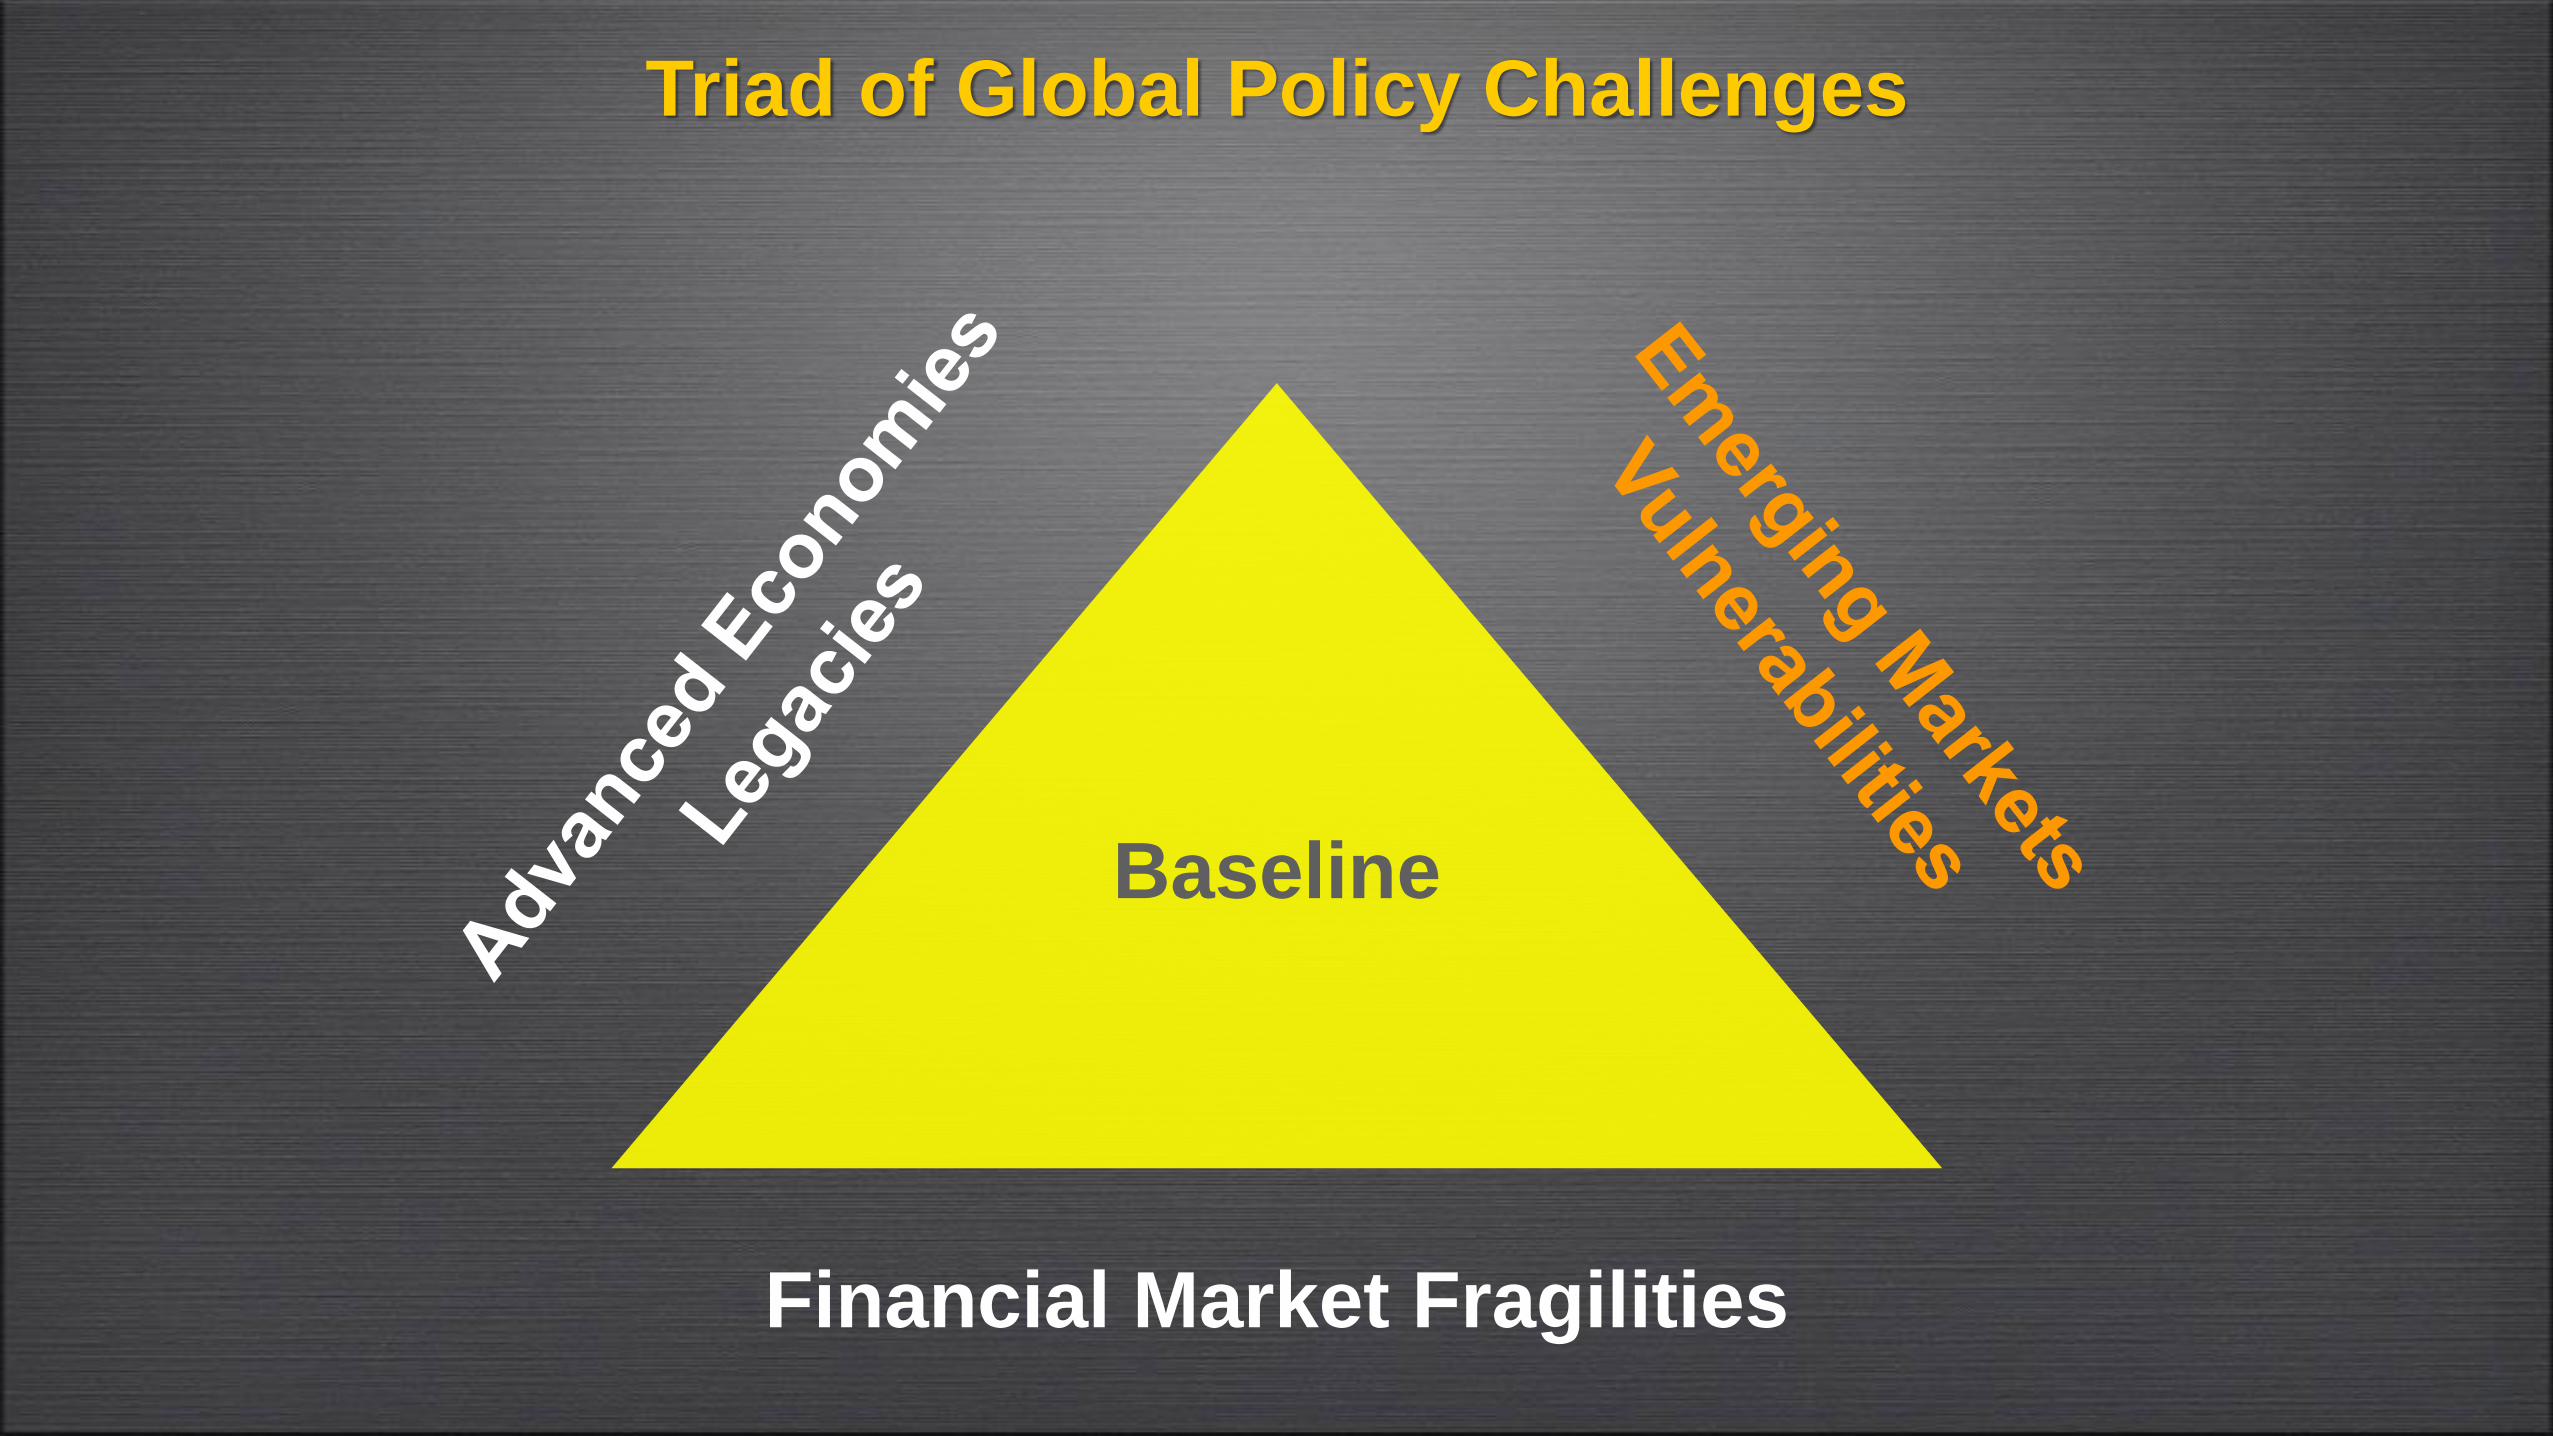
Triad of Global
Policy
Challenges
• Advanced economy
legacies
• Emerging market
vulnerabilities
• Financial market
fragilities

Financial Stability Overview
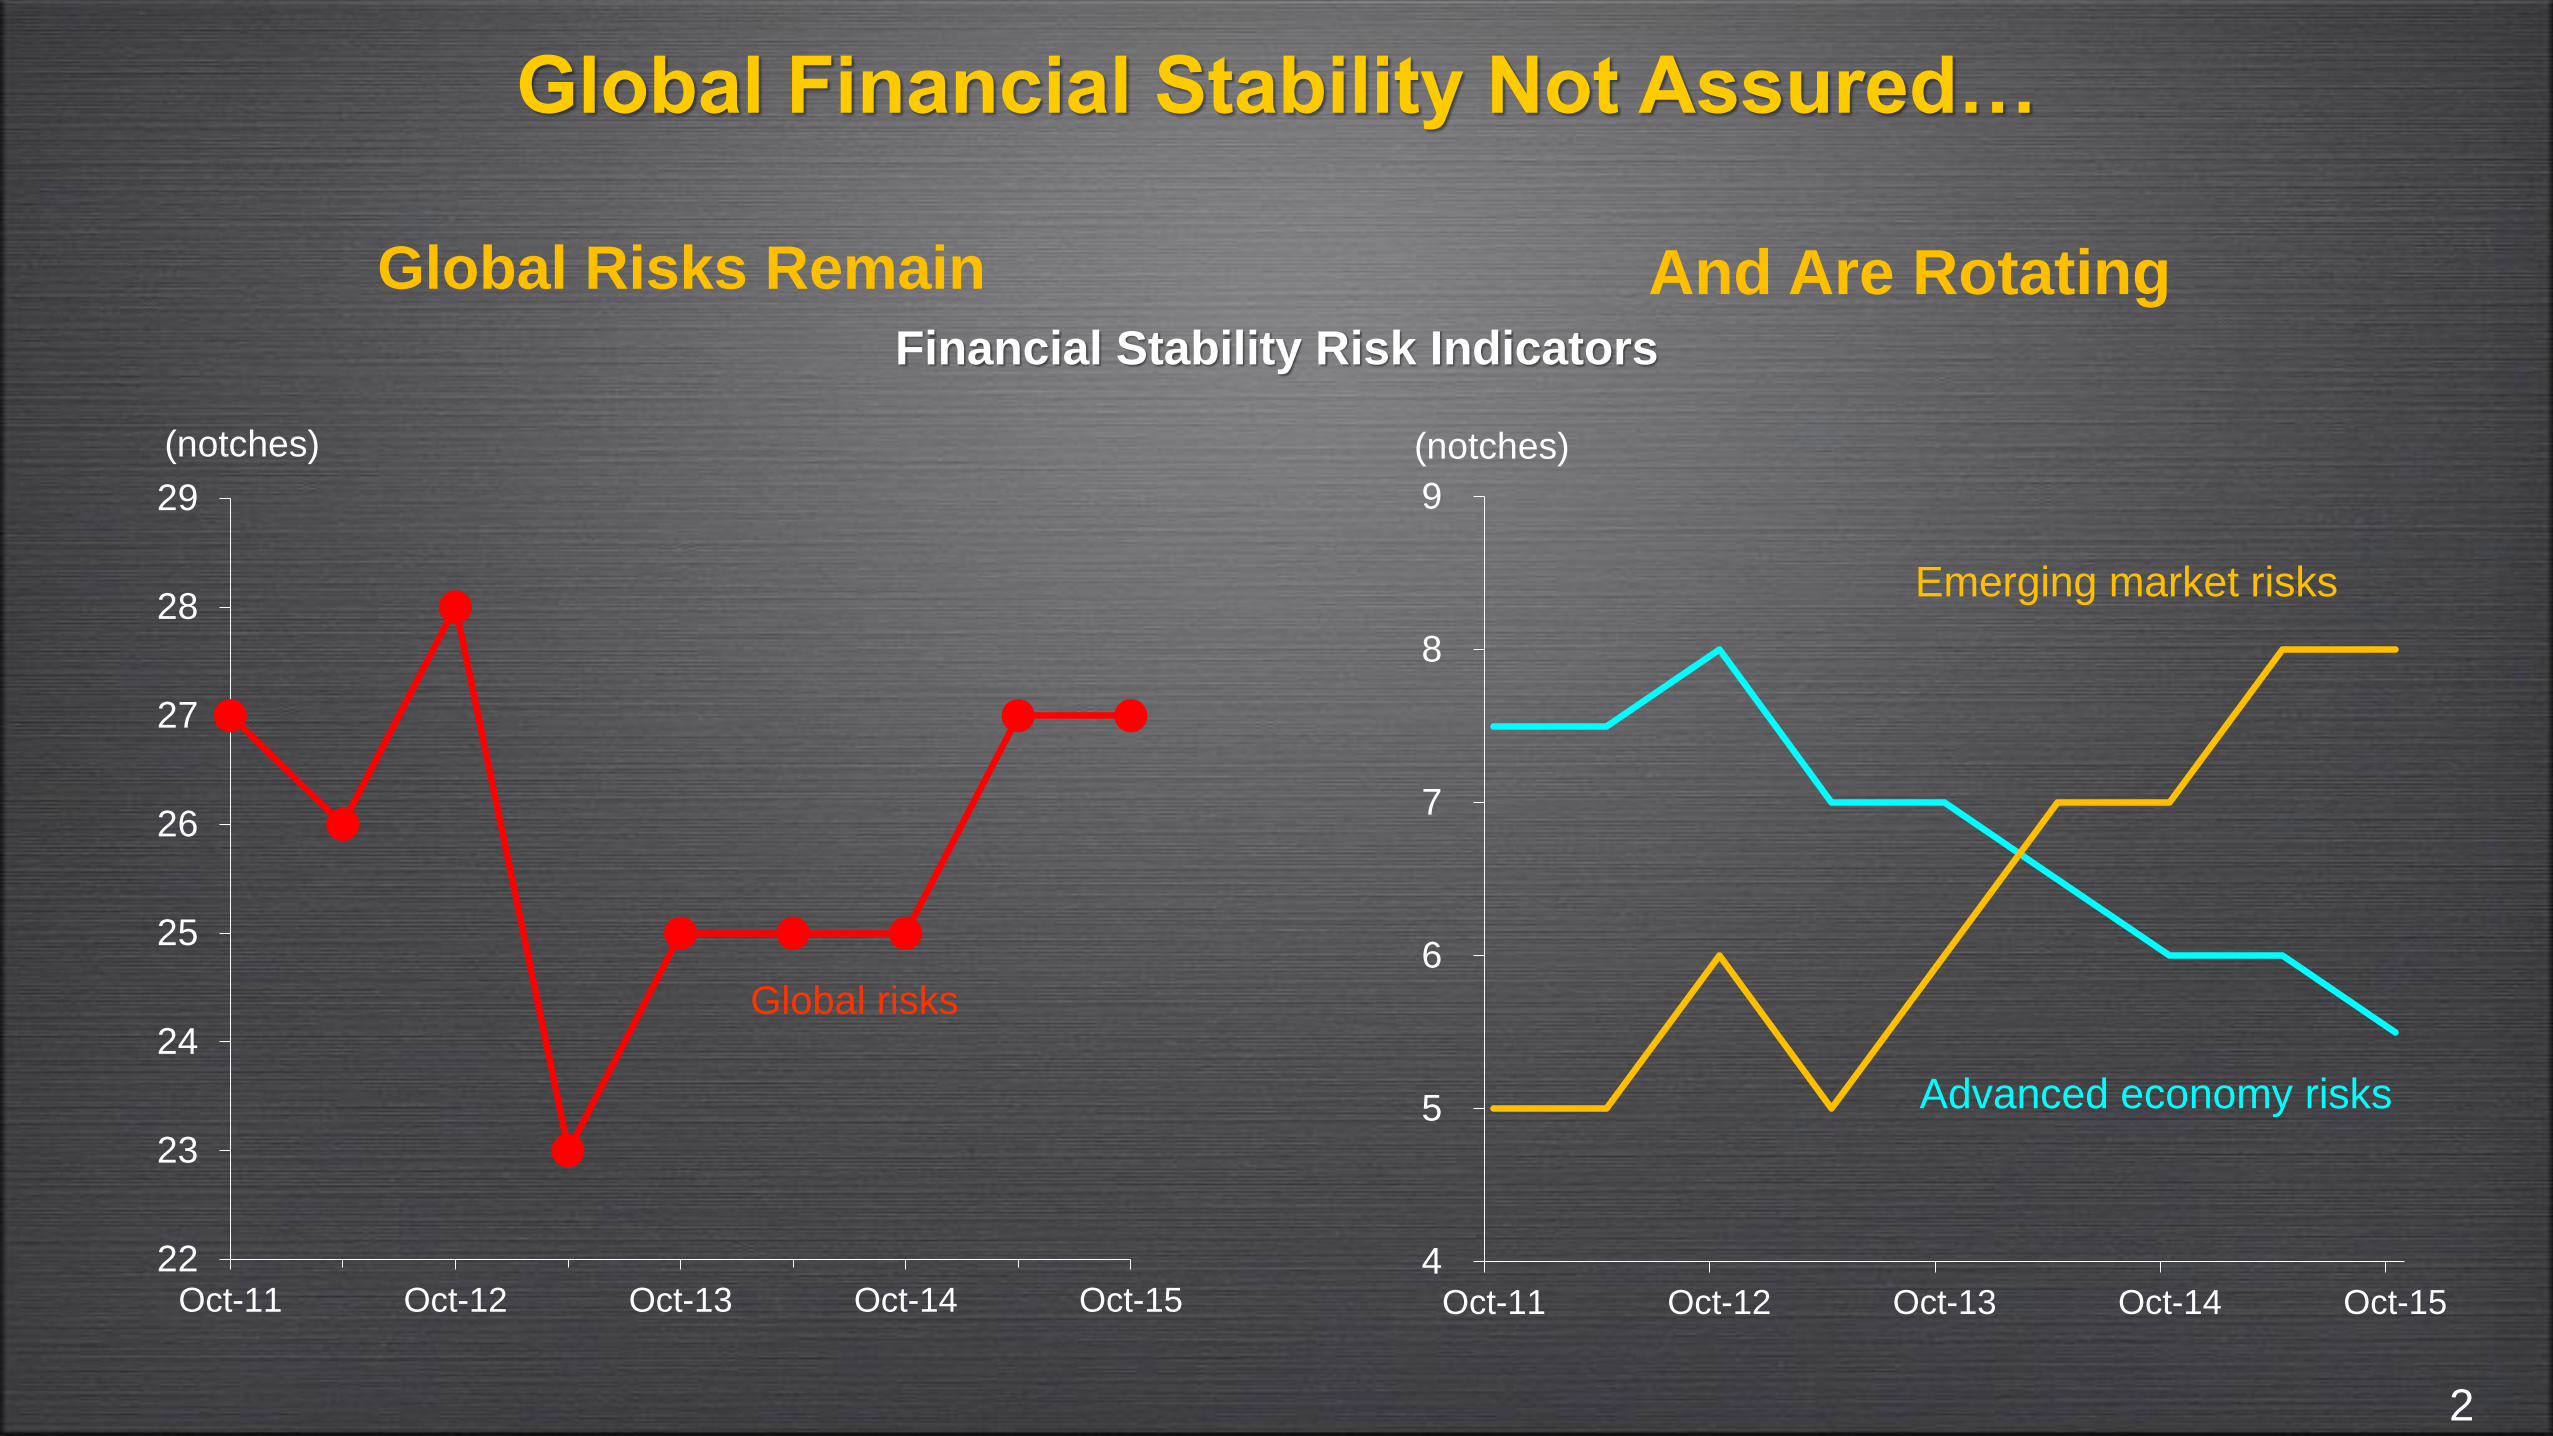
Global Financial Stability Not Assured…
And Are Rotating
22
23
24
25
26
27
28
29
Oct-11 Oct-12 Oct-13 Oct-14 Oct-15
(notches)
Global risks
Financial Stability Risk Indicators
2
Global Risks Remain
4
5
6
7
8
9
Oct-11 Oct-12 Oct-13 Oct-14 Oct-15
Advanced economy risks
Emerging market risks
(notches)
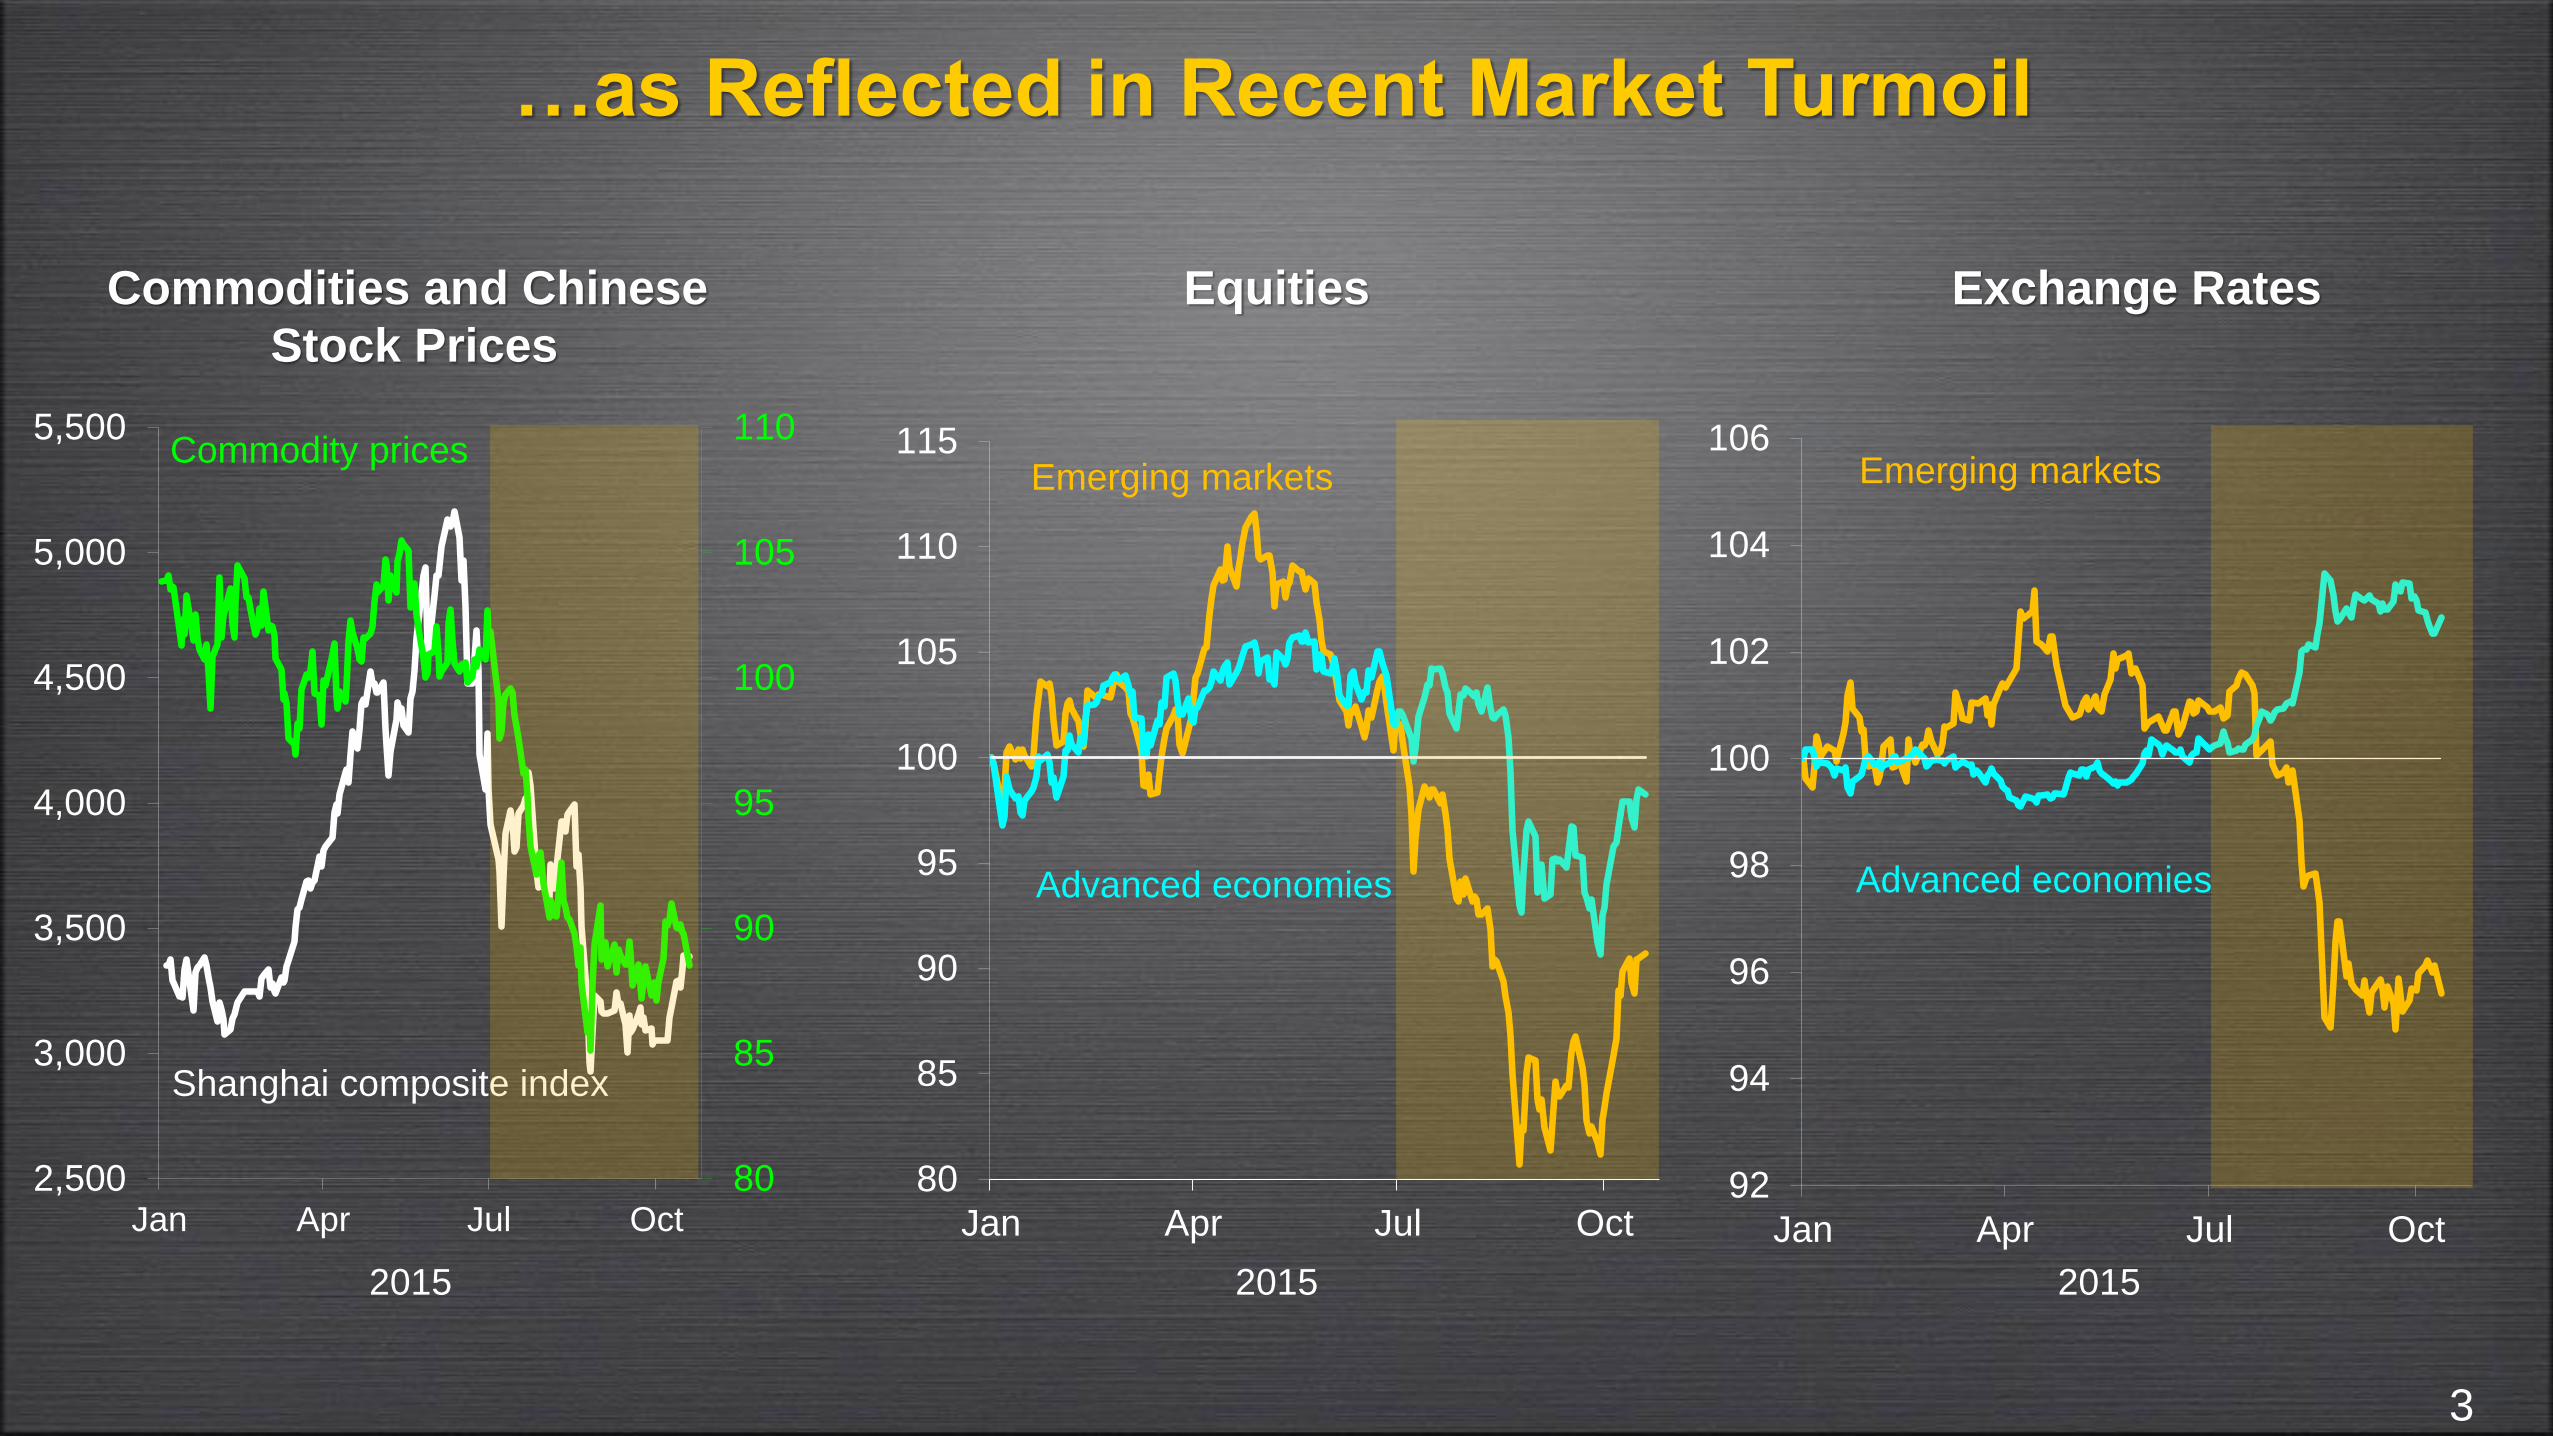
…as Reflected in Recent Market Turmoil
Commodities and Chinese
Stock Prices
Equities
2015 2015 2015
Exchange Rates
3
80
85
90
95
100
105
110
2,500
3,000
3,500
4,000
4,500
5,000
5,500
Jan Apr Jul Oct
Commodity prices
Shanghai composite index
80
85
90
95
100
105
110
115
Jan Apr Jul Oct
Emerging markets
Advanced economies
92
94
96
98
100
102
104
106
Jan Apr Jul Oct
Emerging markets
Advanced economies
Global Policy Challenges

Triad of Global Policy Challenges
Financial Market Fragilities
Baseline:
Financial Stability
Not Yet Assured
4
Triad of Global Policy Challenges
Financial Market Fragilities
Baseline
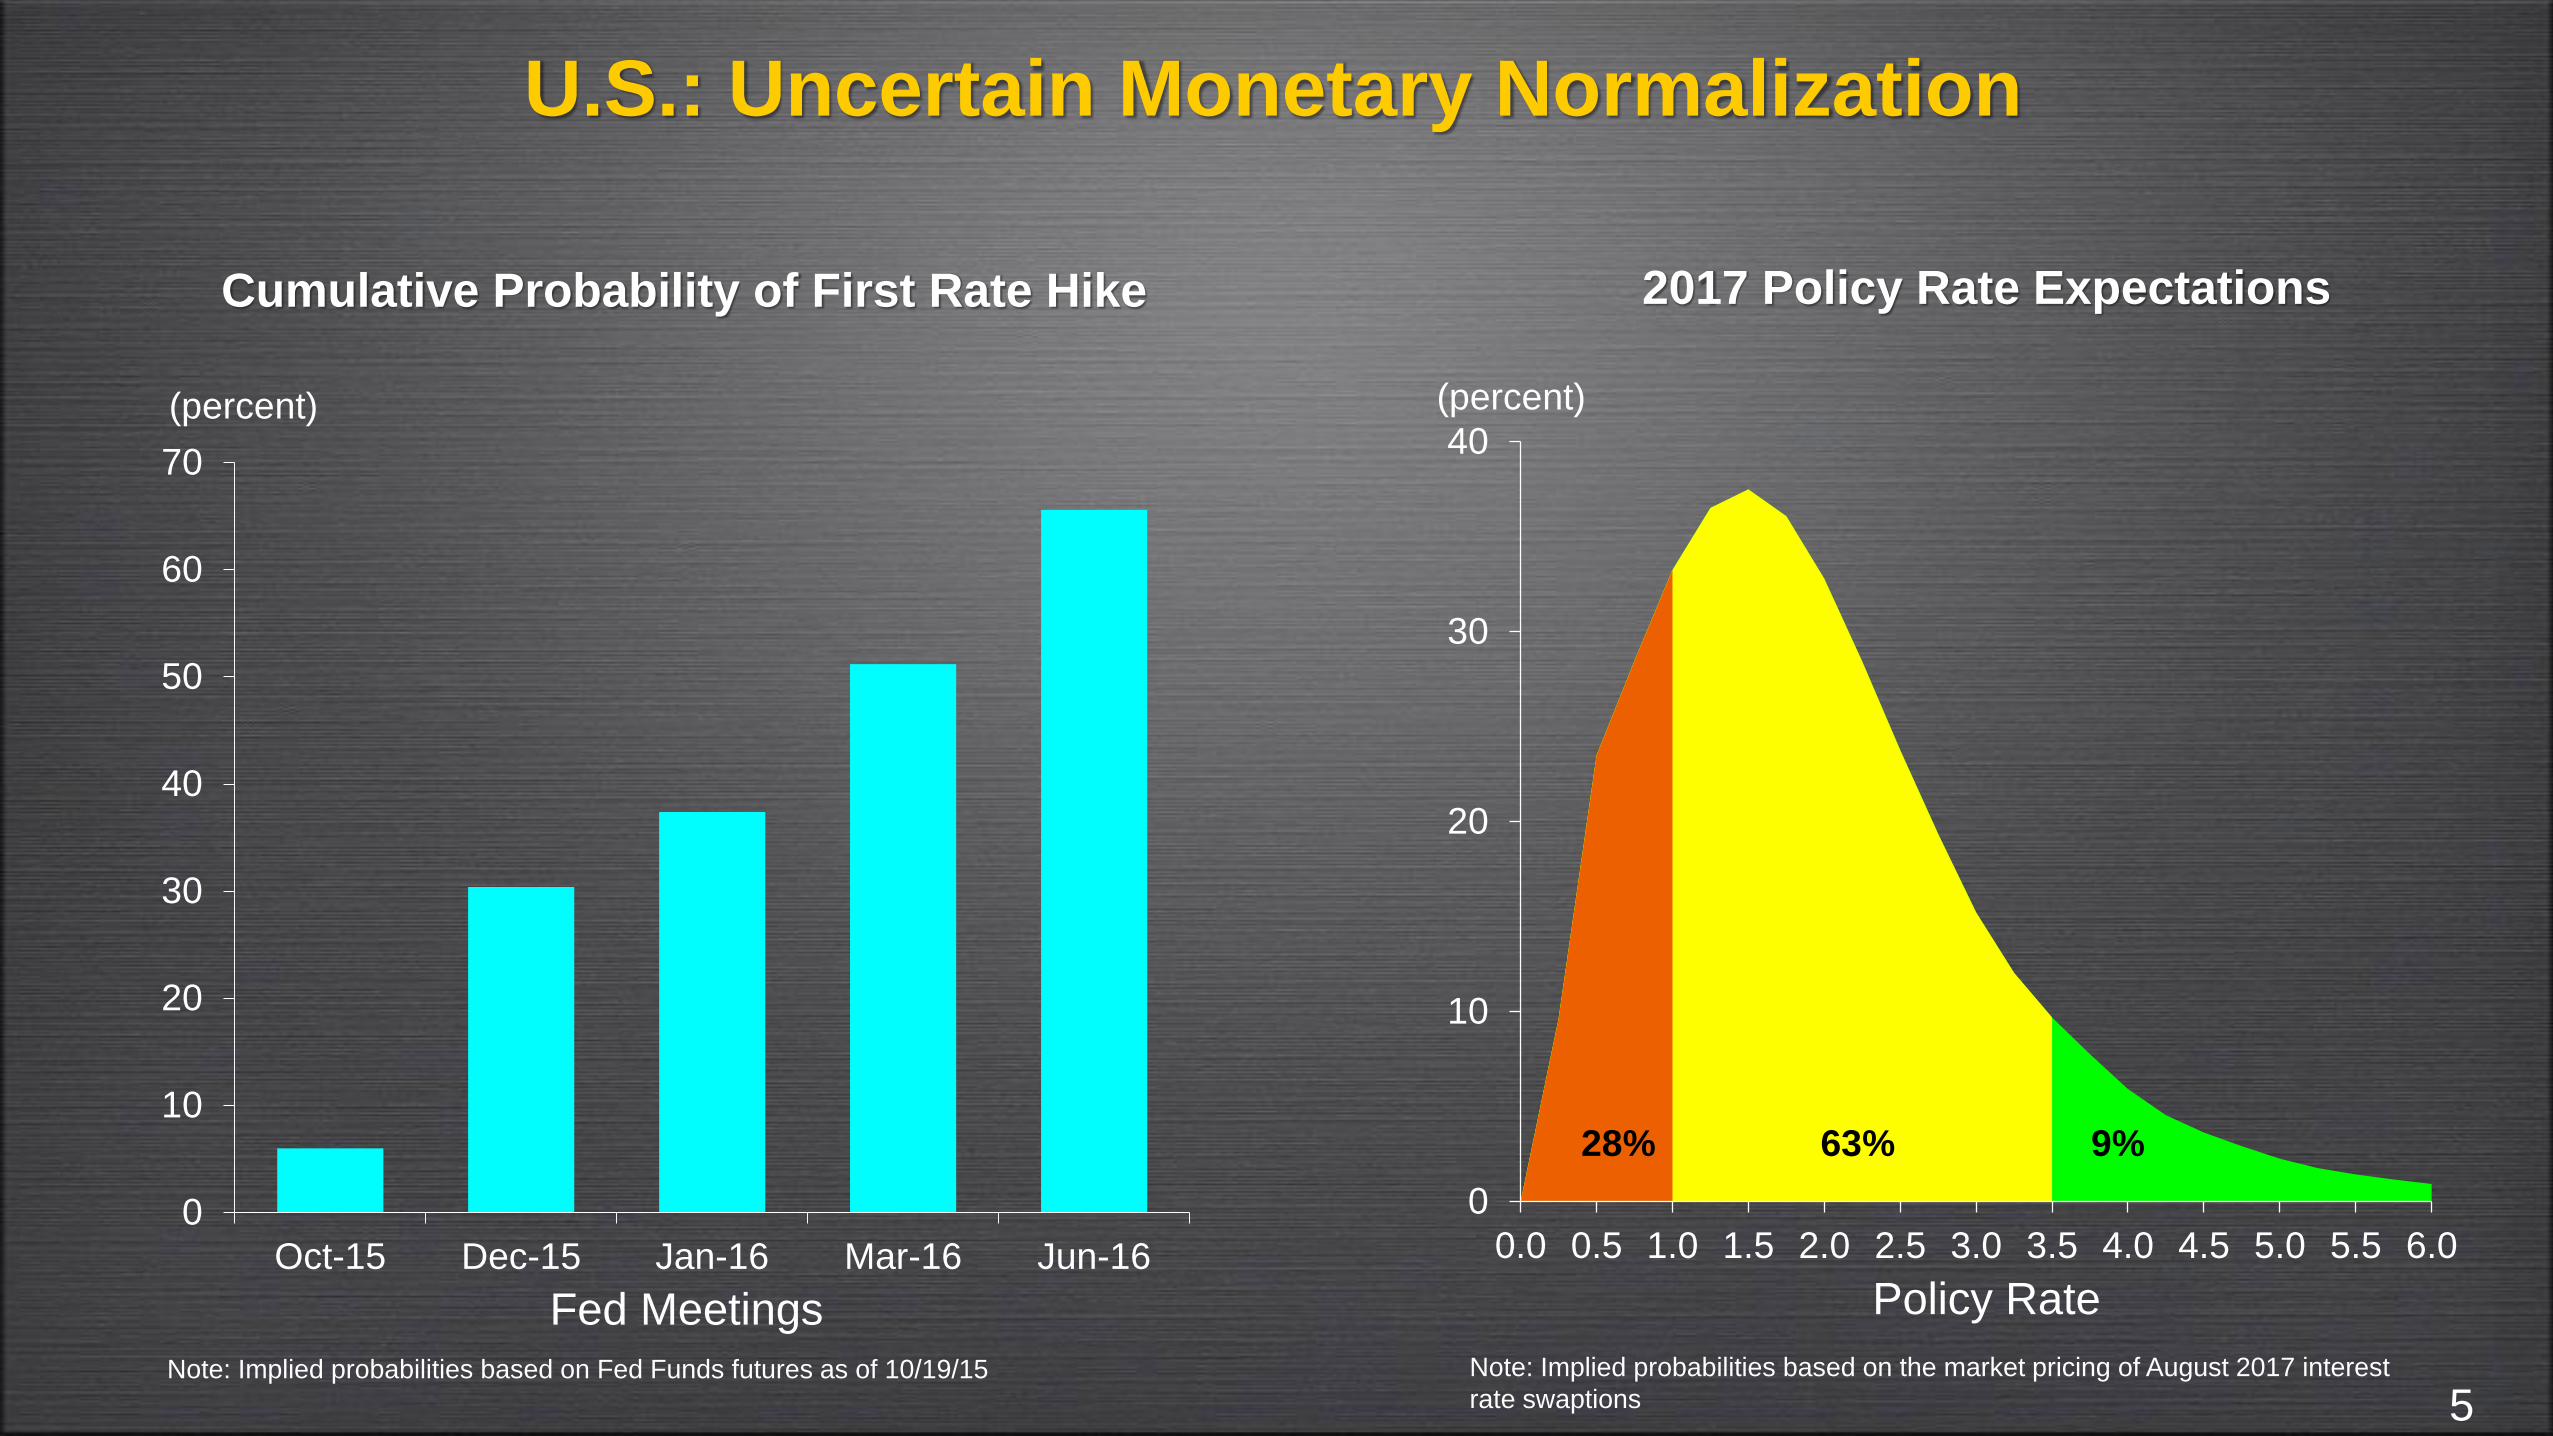
U.S.: Uncertain Monetary Normalization
Cumulative Probability of First Rate Hike 2017 Policy Rate Expectations
Policy Rate
Note: Implied probabilities based on Fed Funds futures as of 10/19/15 Note: Implied probabilities based on the market pricing of August 2017 interest
rate swaptions
Fed Meetings
5
0
10
20
30
40
0.0 0.5 1.0 1.5 2.0 2.5 3.0 3.5 4.0 4.5 5.0 5.5 6.0
(percent)
28% 63% 9%
0
10
20
30
40
50
60
70
Oct-15 Dec-15 Jan-16 Mar-16 Jun-16
(percent)
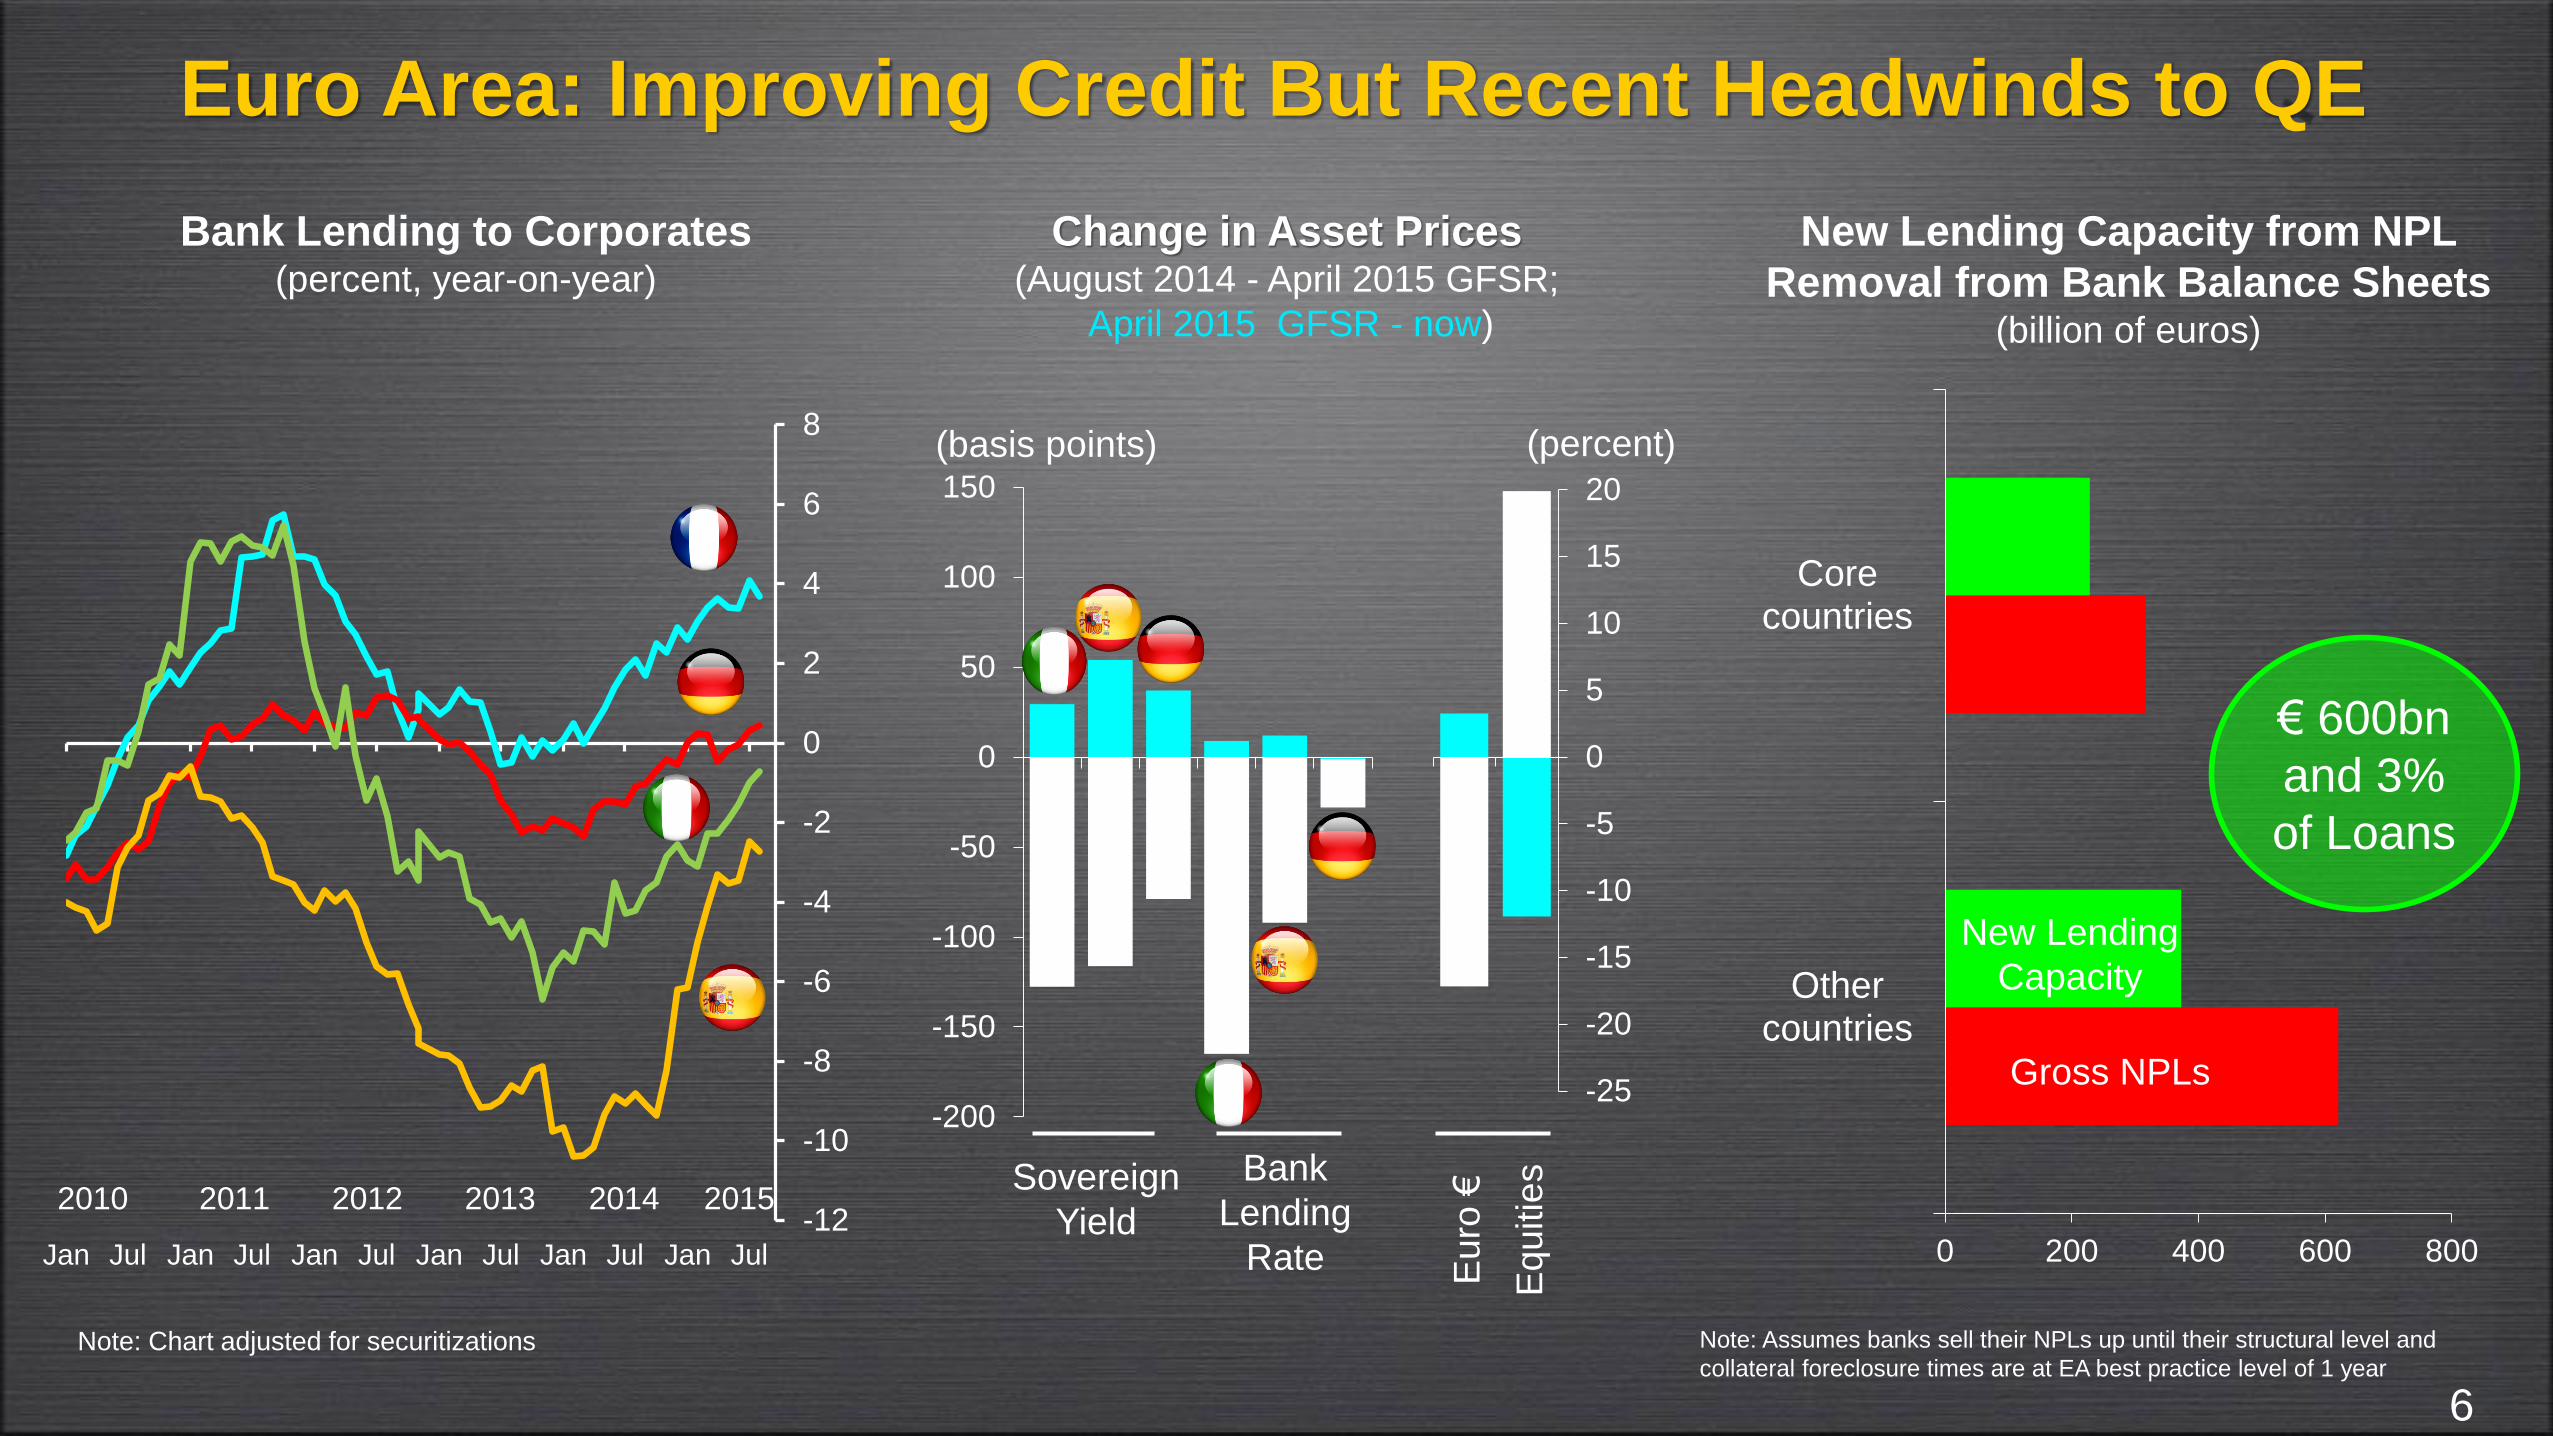
Euro Area: Improving Credit But Recent Headwinds to QE
Bank Lending to Corporates(percent, year-on-year)
New Lending Capacity from NPL
Removal from Bank Balance Sheets(billion of euros)
6
Note: Assumes banks sell their NPLs up until their structural level and
collateral foreclosure times are at EA best practice level of 1 yearNote: Chart adjusted for securitizations
€ 600bn
and 3%
of Loans
Change in Asset Prices(August 2014 - April 2015 GFSR;
April 2015 GFSR - now)
Sovereign
Yield
Bank
Lending
Rate
Equitie
s
Euro
€
-12
-10
-8
-6
-4
-2
0
2
4
6
8
Jan Jul Jan Jul Jan Jul Jan Jul Jan Jul Jan Jul
2010 2011 2012 2013 2014 2015
0 200 400 600 800
Othercountries
Corecountries
Gross NPLs
New Lending
Capacity
-200
-150
-100
-50
0
50
100
150
(basis points)
-25
-20
-15
-10
-5
0
5
10
15
20
(percent)
Triad of Global Policy Challenges
Financial Market Fragilities
Baseline
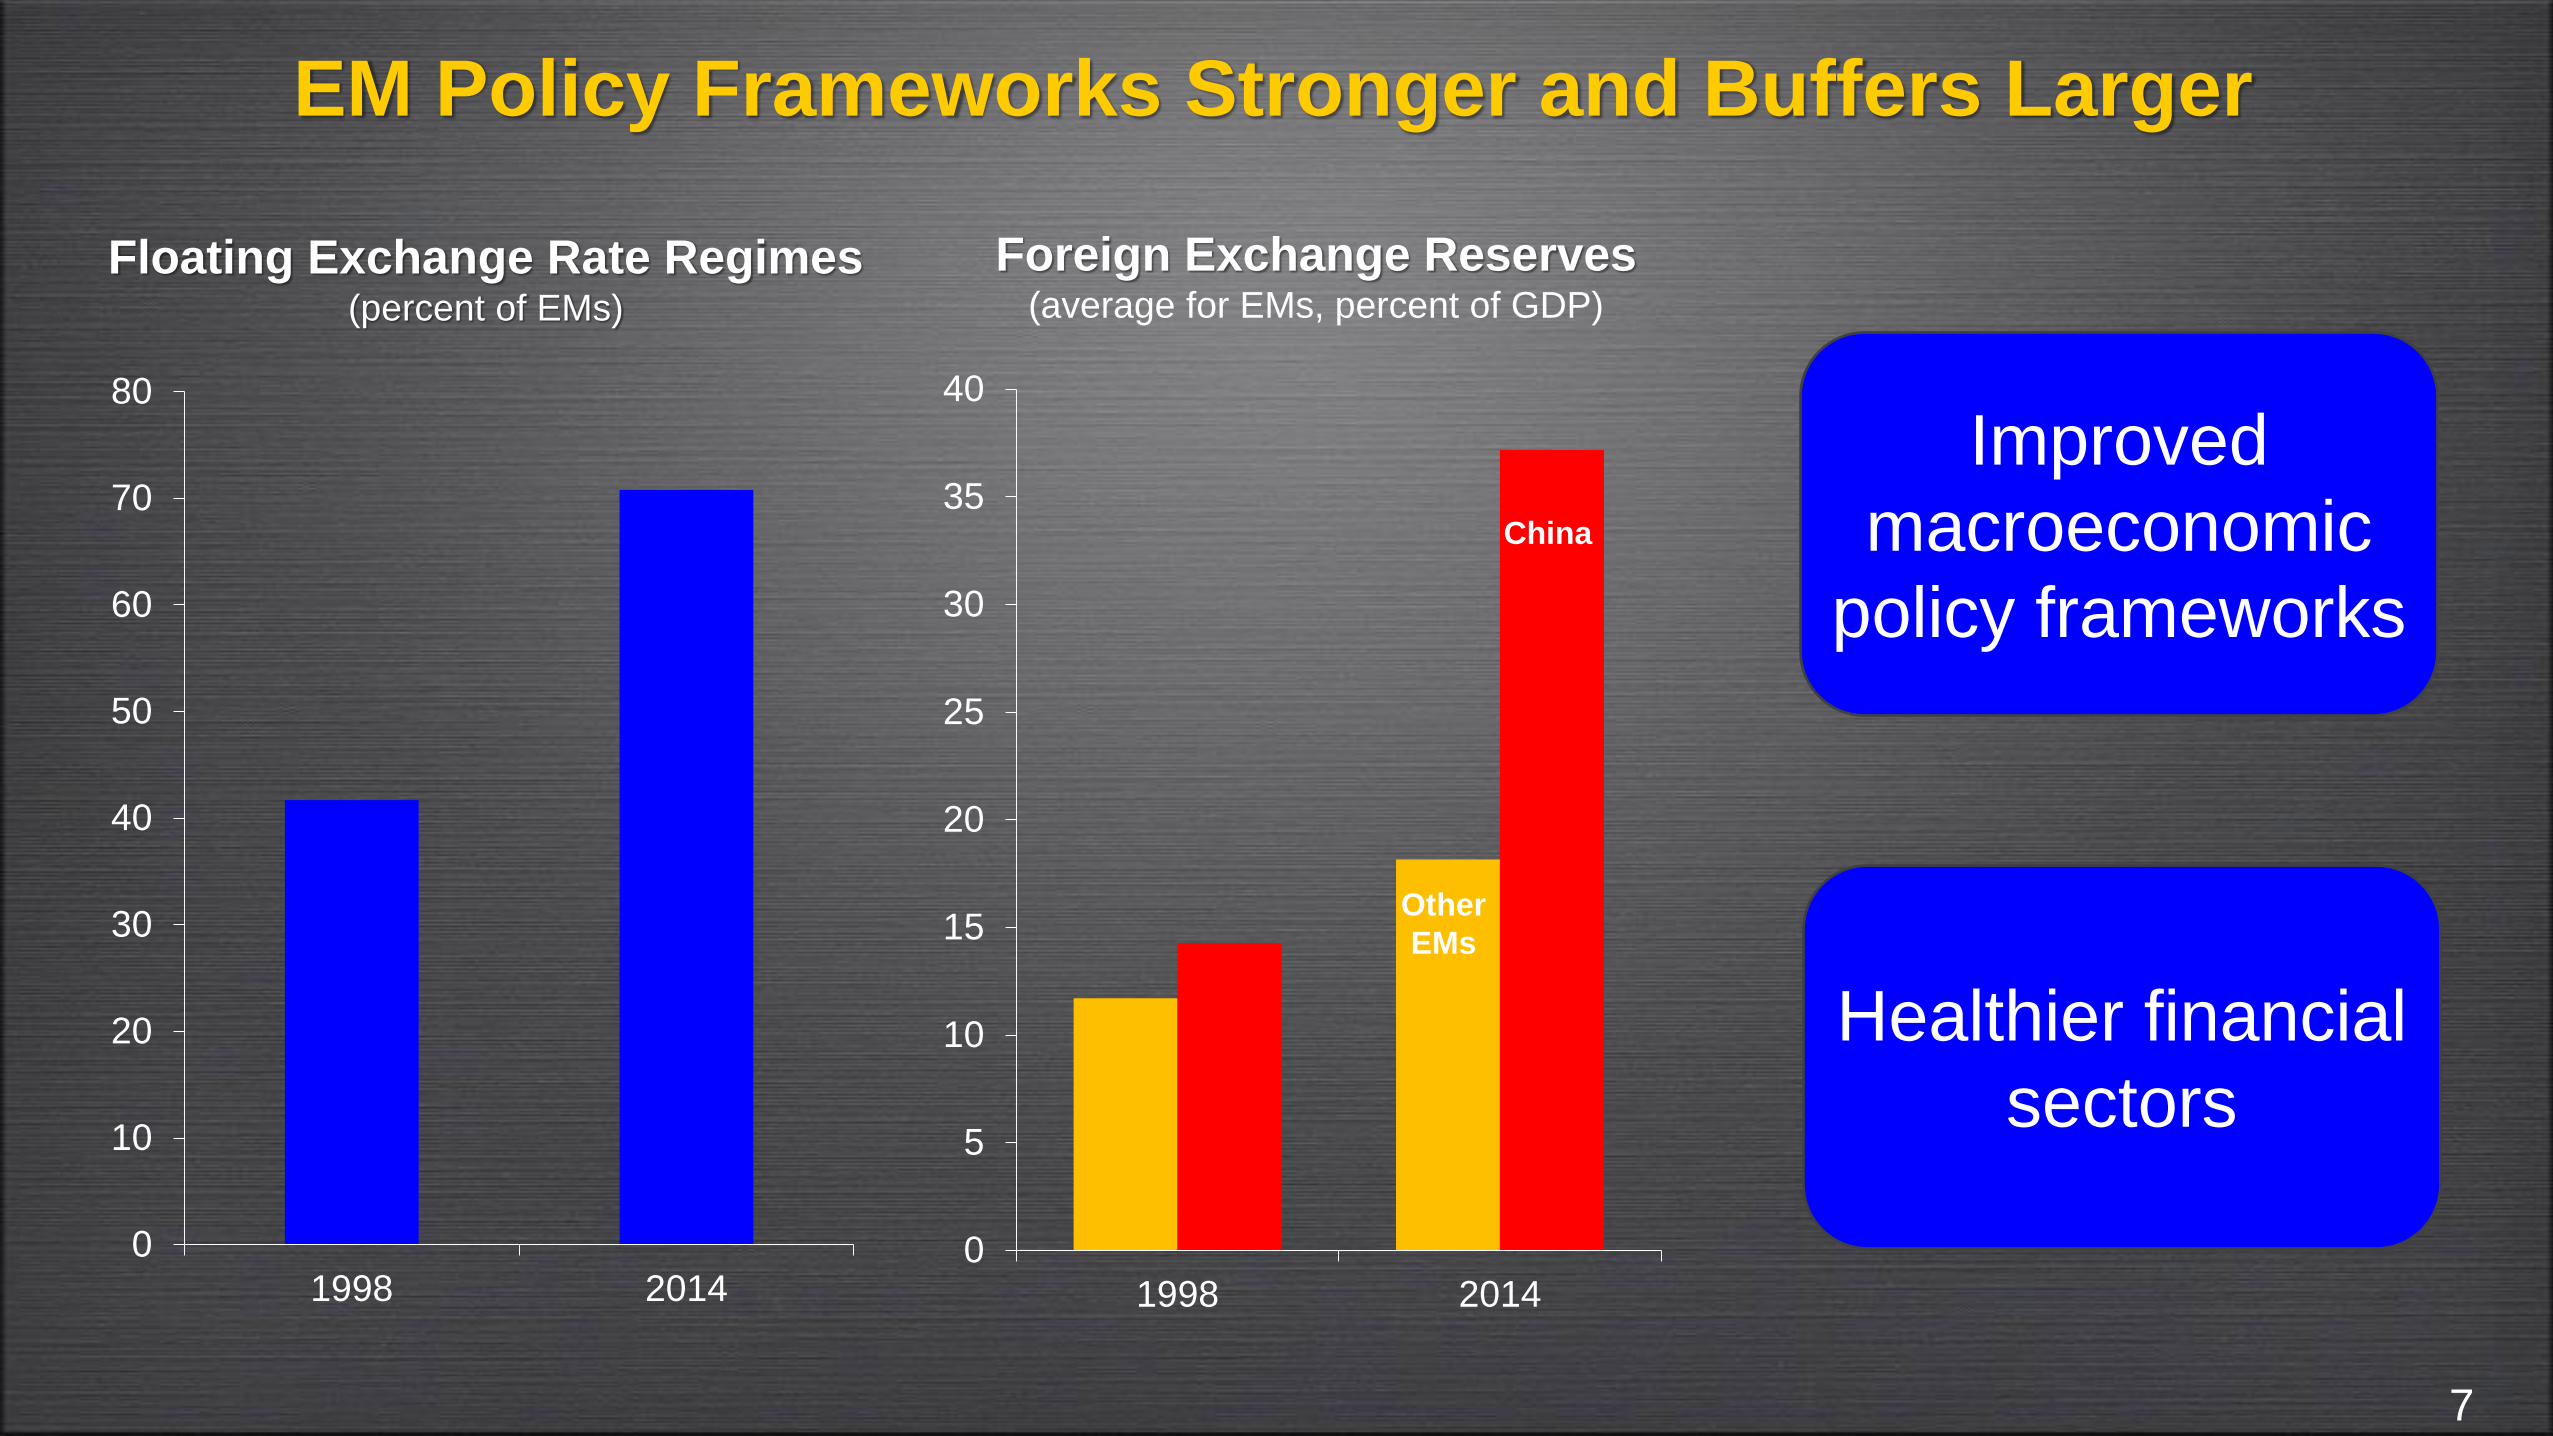
EM Policy Frameworks Stronger and Buffers Larger
Foreign Exchange Reserves(average for EMs, percent of GDP)
Floating Exchange Rate Regimes (percent of EMs)
7
Improved
macroeconomic
policy frameworks
Healthier financial
sectors
0
10
20
30
40
50
60
70
80
1998 20140
5
10
15
20
25
30
35
40
1998 2014
China
Other
EMs
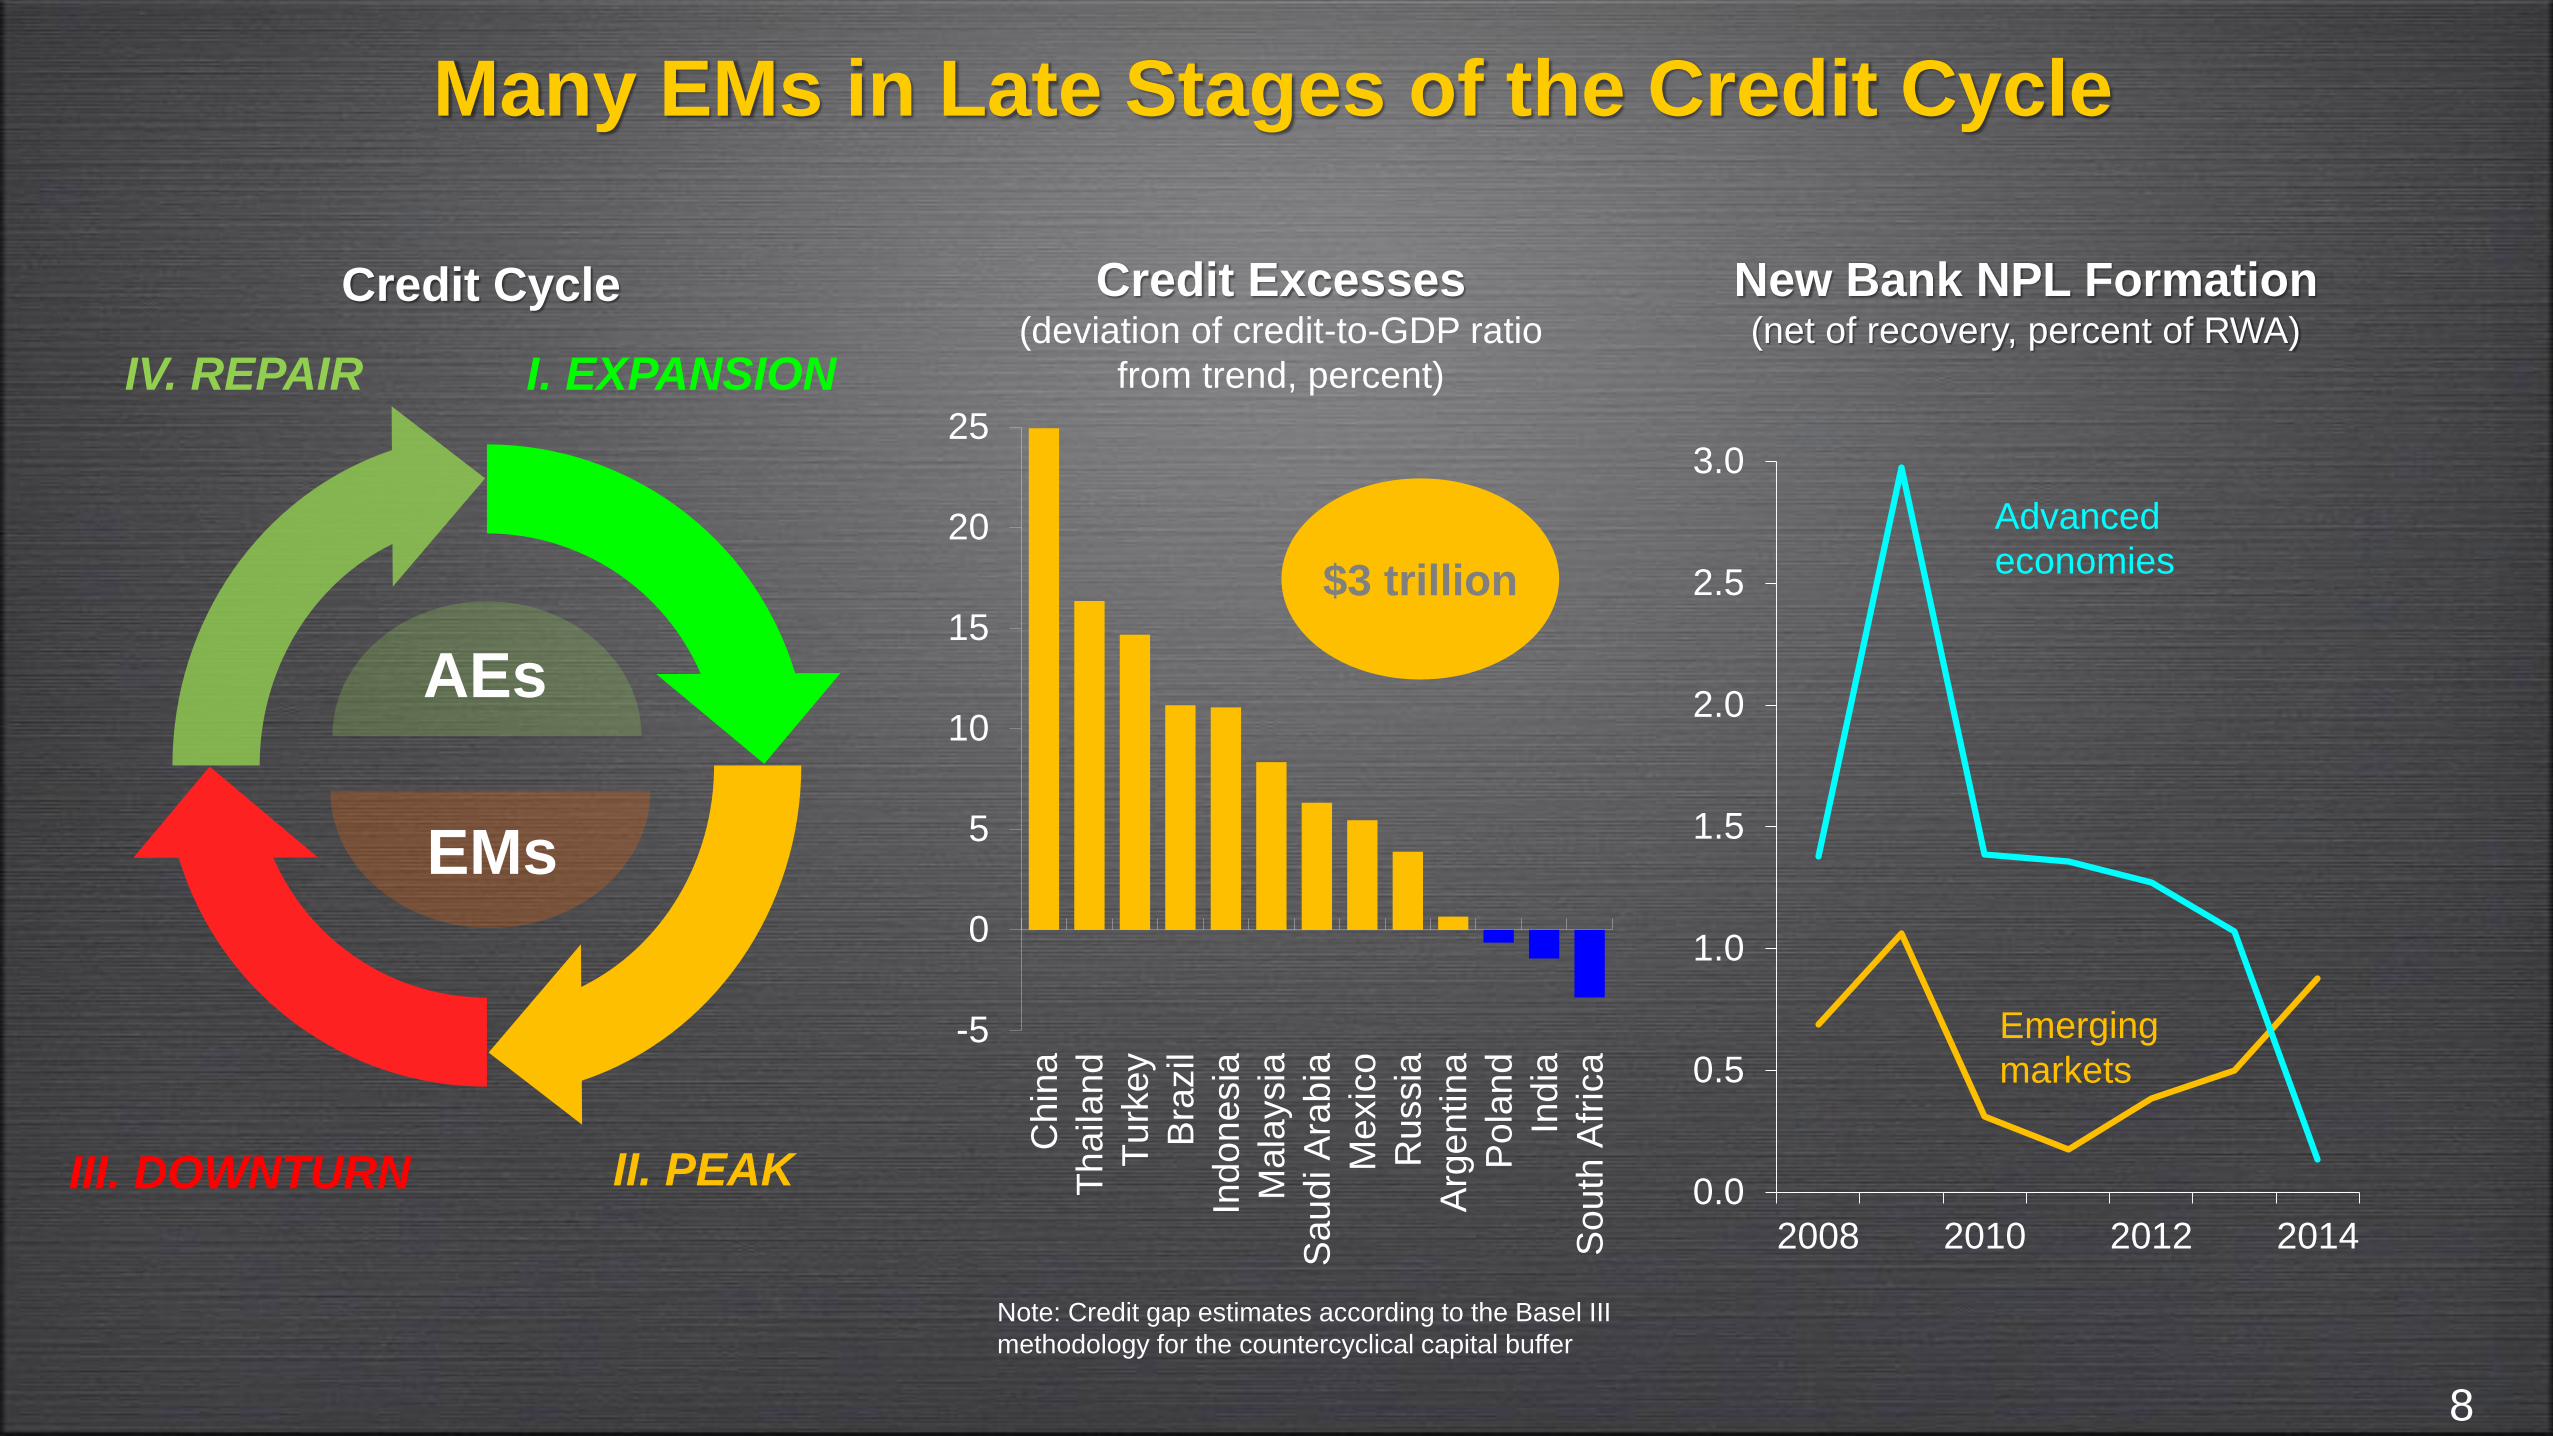
Many EMs in Late Stages of the Credit Cycle
Credit Excesses(deviation of credit-to-GDP ratio
from trend, percent)I. EXPANSIONIV. REPAIR
III. DOWNTURN II. PEAK
-5
0
5
10
15
20
25
Chin
a
Thaila
nd
Turk
ey
Bra
zil
Indon
esia
Mala
ysia
Saud
i A
rabia
Mexic
o
Russia
Arg
entina
Pola
nd
India
South
Afr
ica
$3 trillion
AEs
EMs
Note: Credit gap estimates according to the Basel III
methodology for the countercyclical capital buffer
New Bank NPL Formation (net of recovery, percent of RWA)
0.0
0.5
1.0
1.5
2.0
2.5
3.0
2014201220102008
Emerging
markets
Advanced
economies
8
Credit Cycle
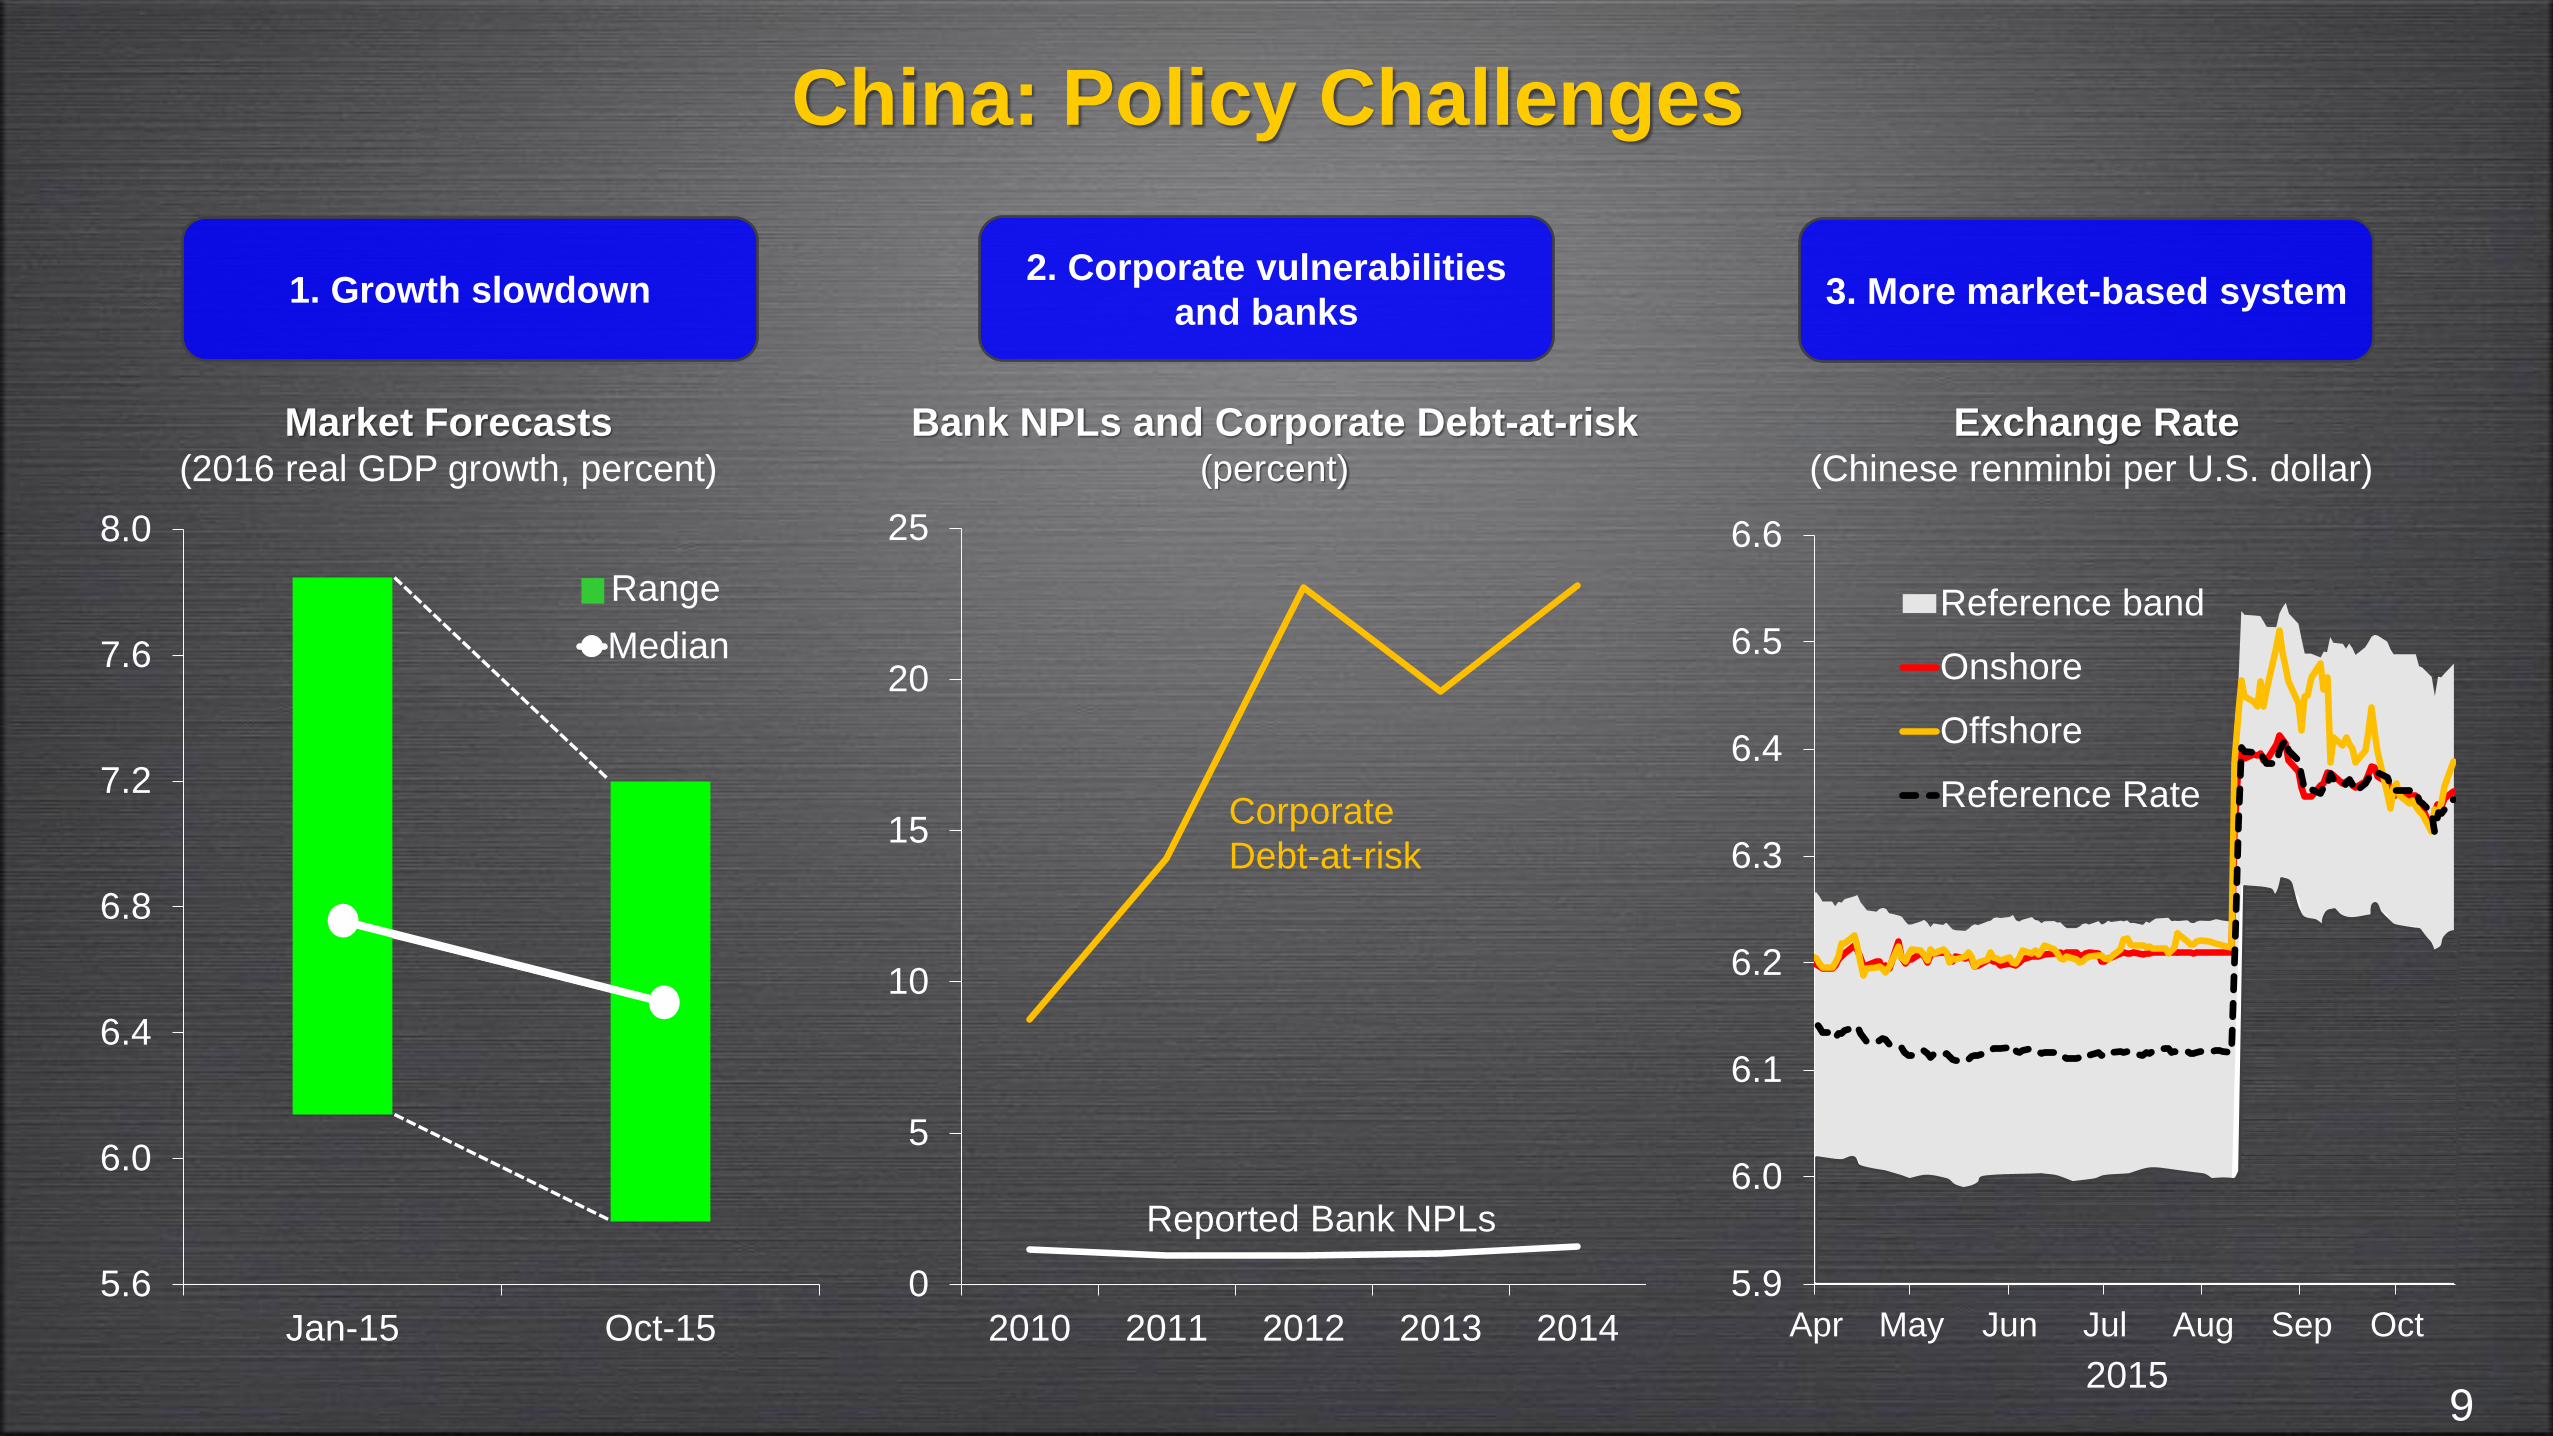
China: Policy Challenges
3. More market-based system
Exchange Rate(Chinese renminbi per U.S. dollar)
0
5
10
15
20
25
2010 2011 2012 2013 2014
Corporate
Debt-at-risk
Reported Bank NPLs
Bank NPLs and Corporate Debt-at-risk(percent)
92015
2. Corporate vulnerabilities
and banks1. Growth slowdown
Market Forecasts (2016 real GDP growth, percent)
5.9
6.0
6.1
6.2
6.3
6.4
6.5
6.6
Apr May Jun Jul Aug Sep Oct
Reference band
Onshore
Offshore
Reference Rate
5.6
6.0
6.4
6.8
7.2
7.6
8.0
Jan-15 Oct-15
Median
Range
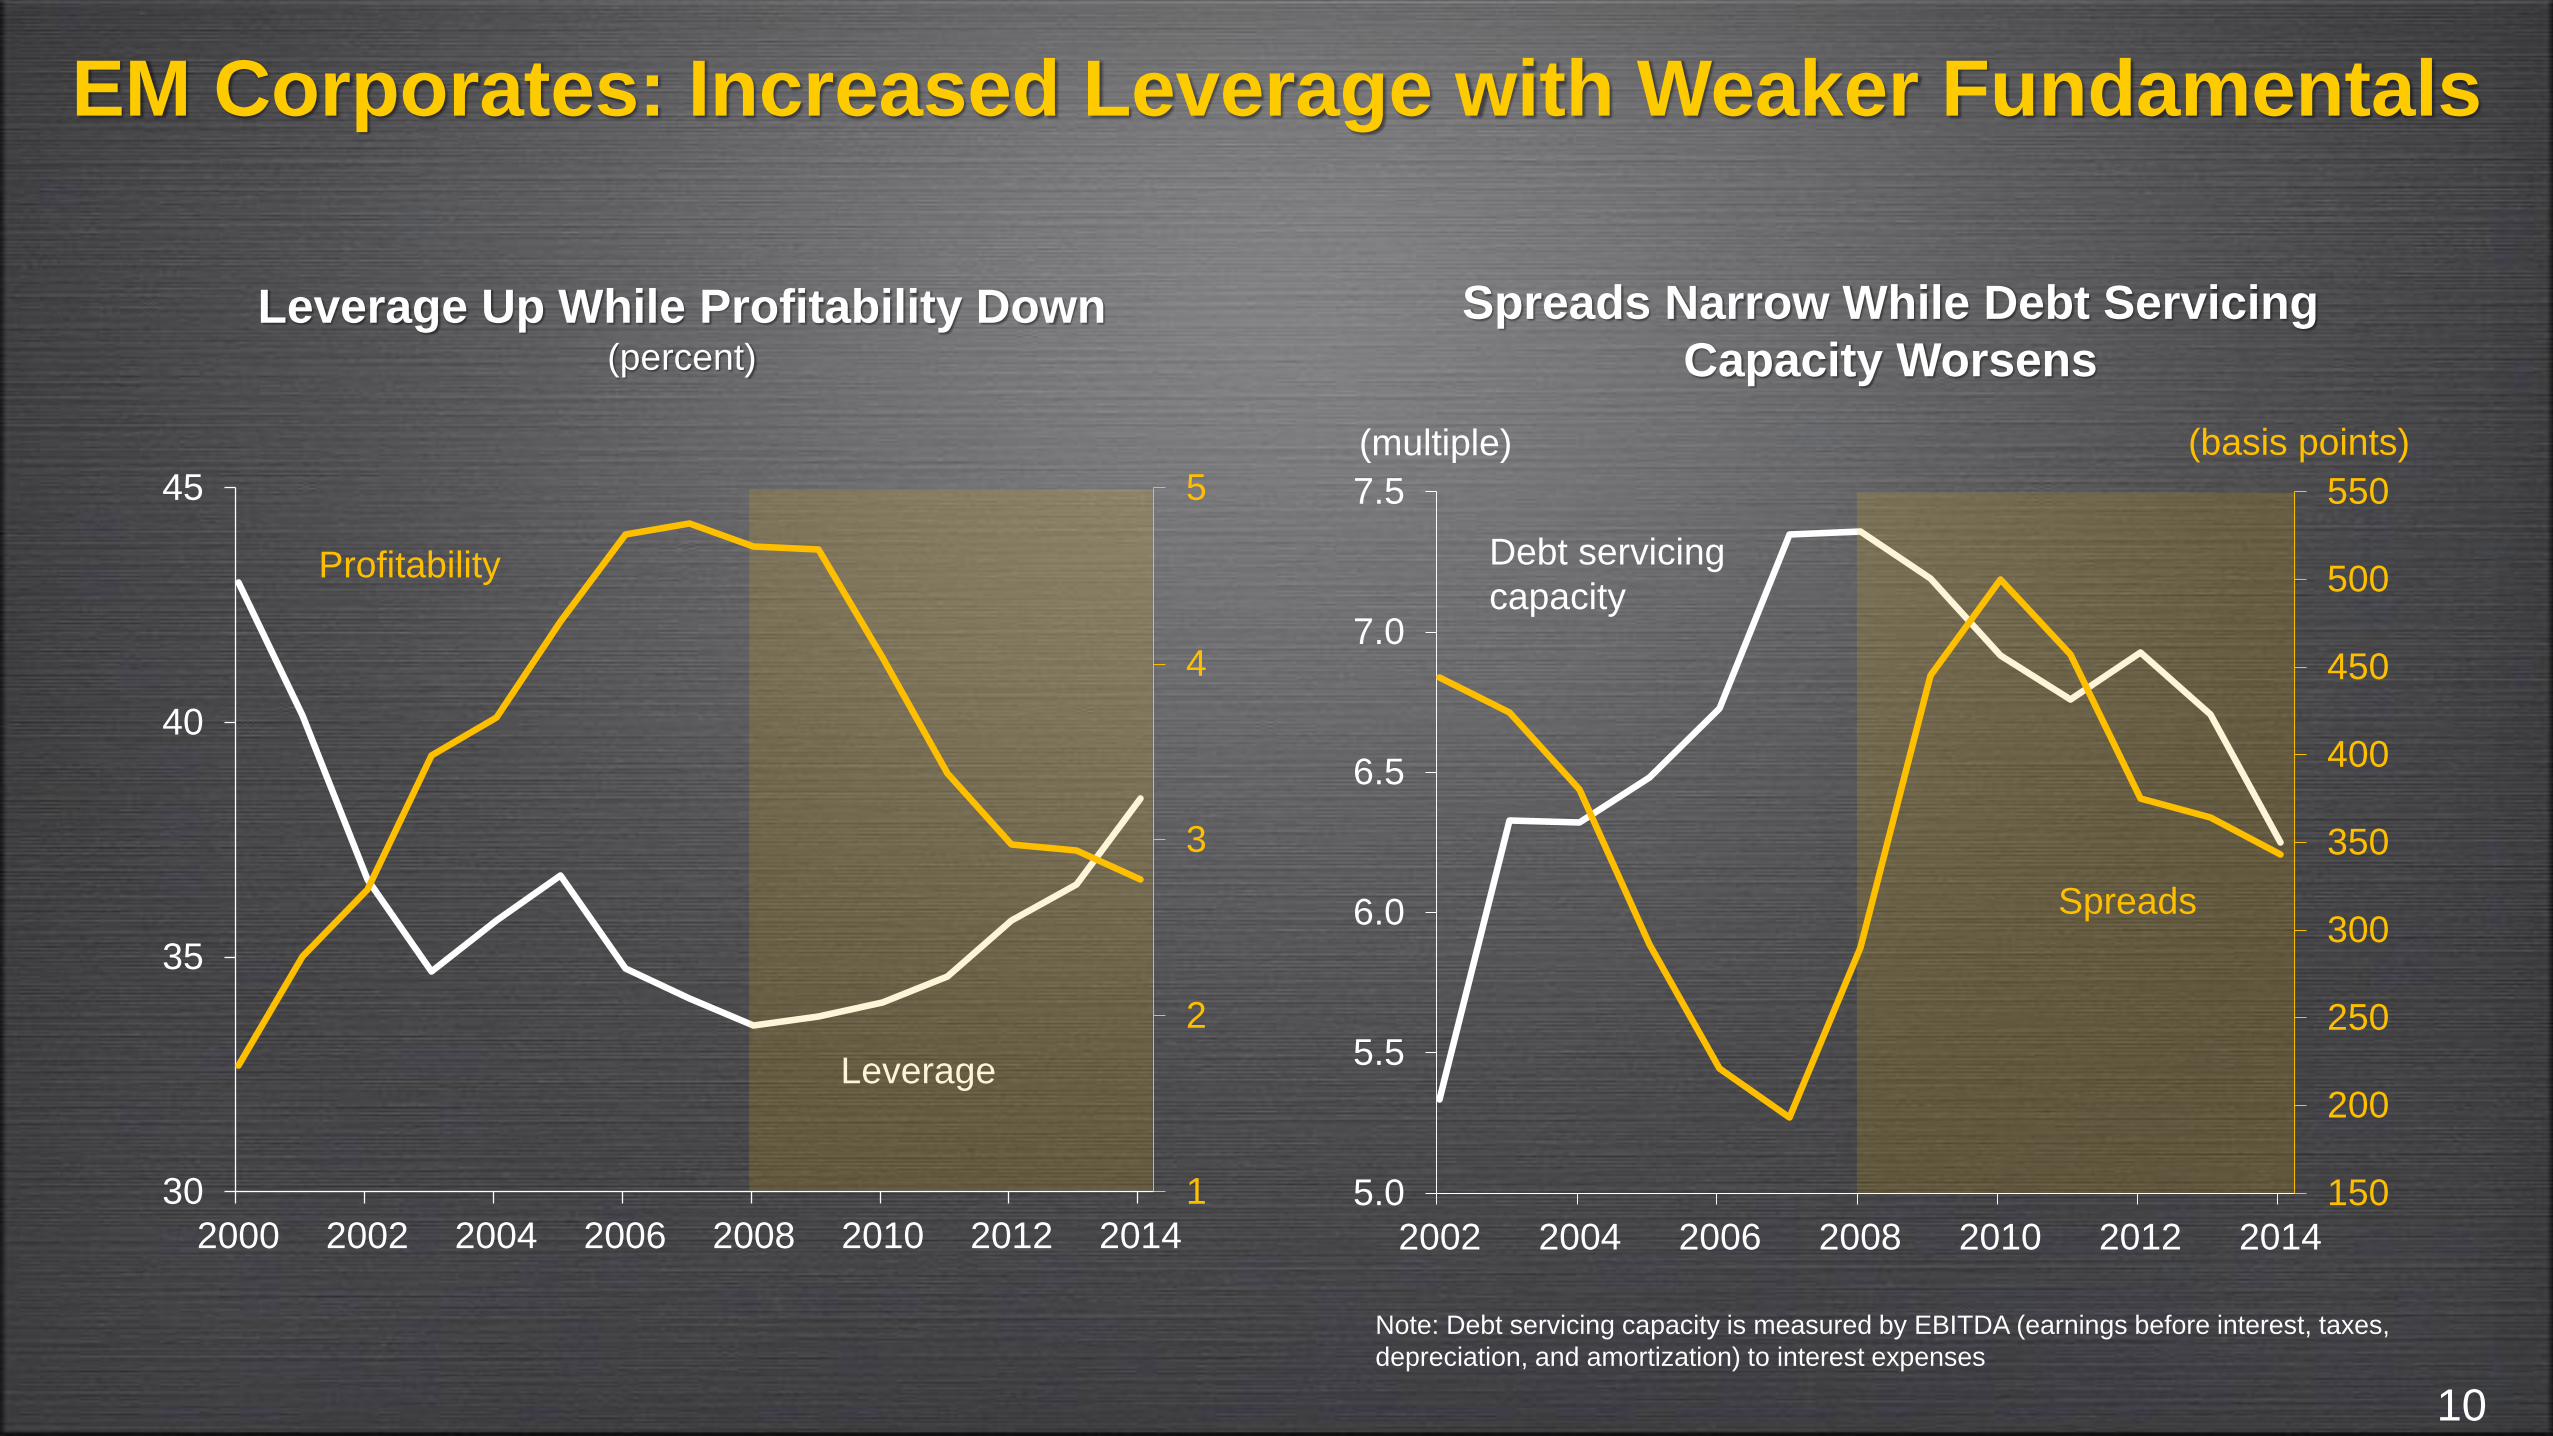
EM Corporates: Increased Leverage with Weaker Fundamentals
Leverage Up While Profitability Down(percent)
Spreads Narrow While Debt Servicing
Capacity Worsens
10
(multiple) (basis points)
Note: Debt servicing capacity is measured by EBITDA (earnings before interest, taxes,
depreciation, and amortization) to interest expenses
1
2
3
4
5
30
35
40
45
2000 2002 2004 2006 2008 2010 2012 2014
Profitability
Leverage
150
200
250
300
350
400
450
500
550
5.0
5.5
6.0
6.5
7.0
7.5
2002 2004 2006 2008 2010 2012 2014
Debt servicing
capacity
Spreads
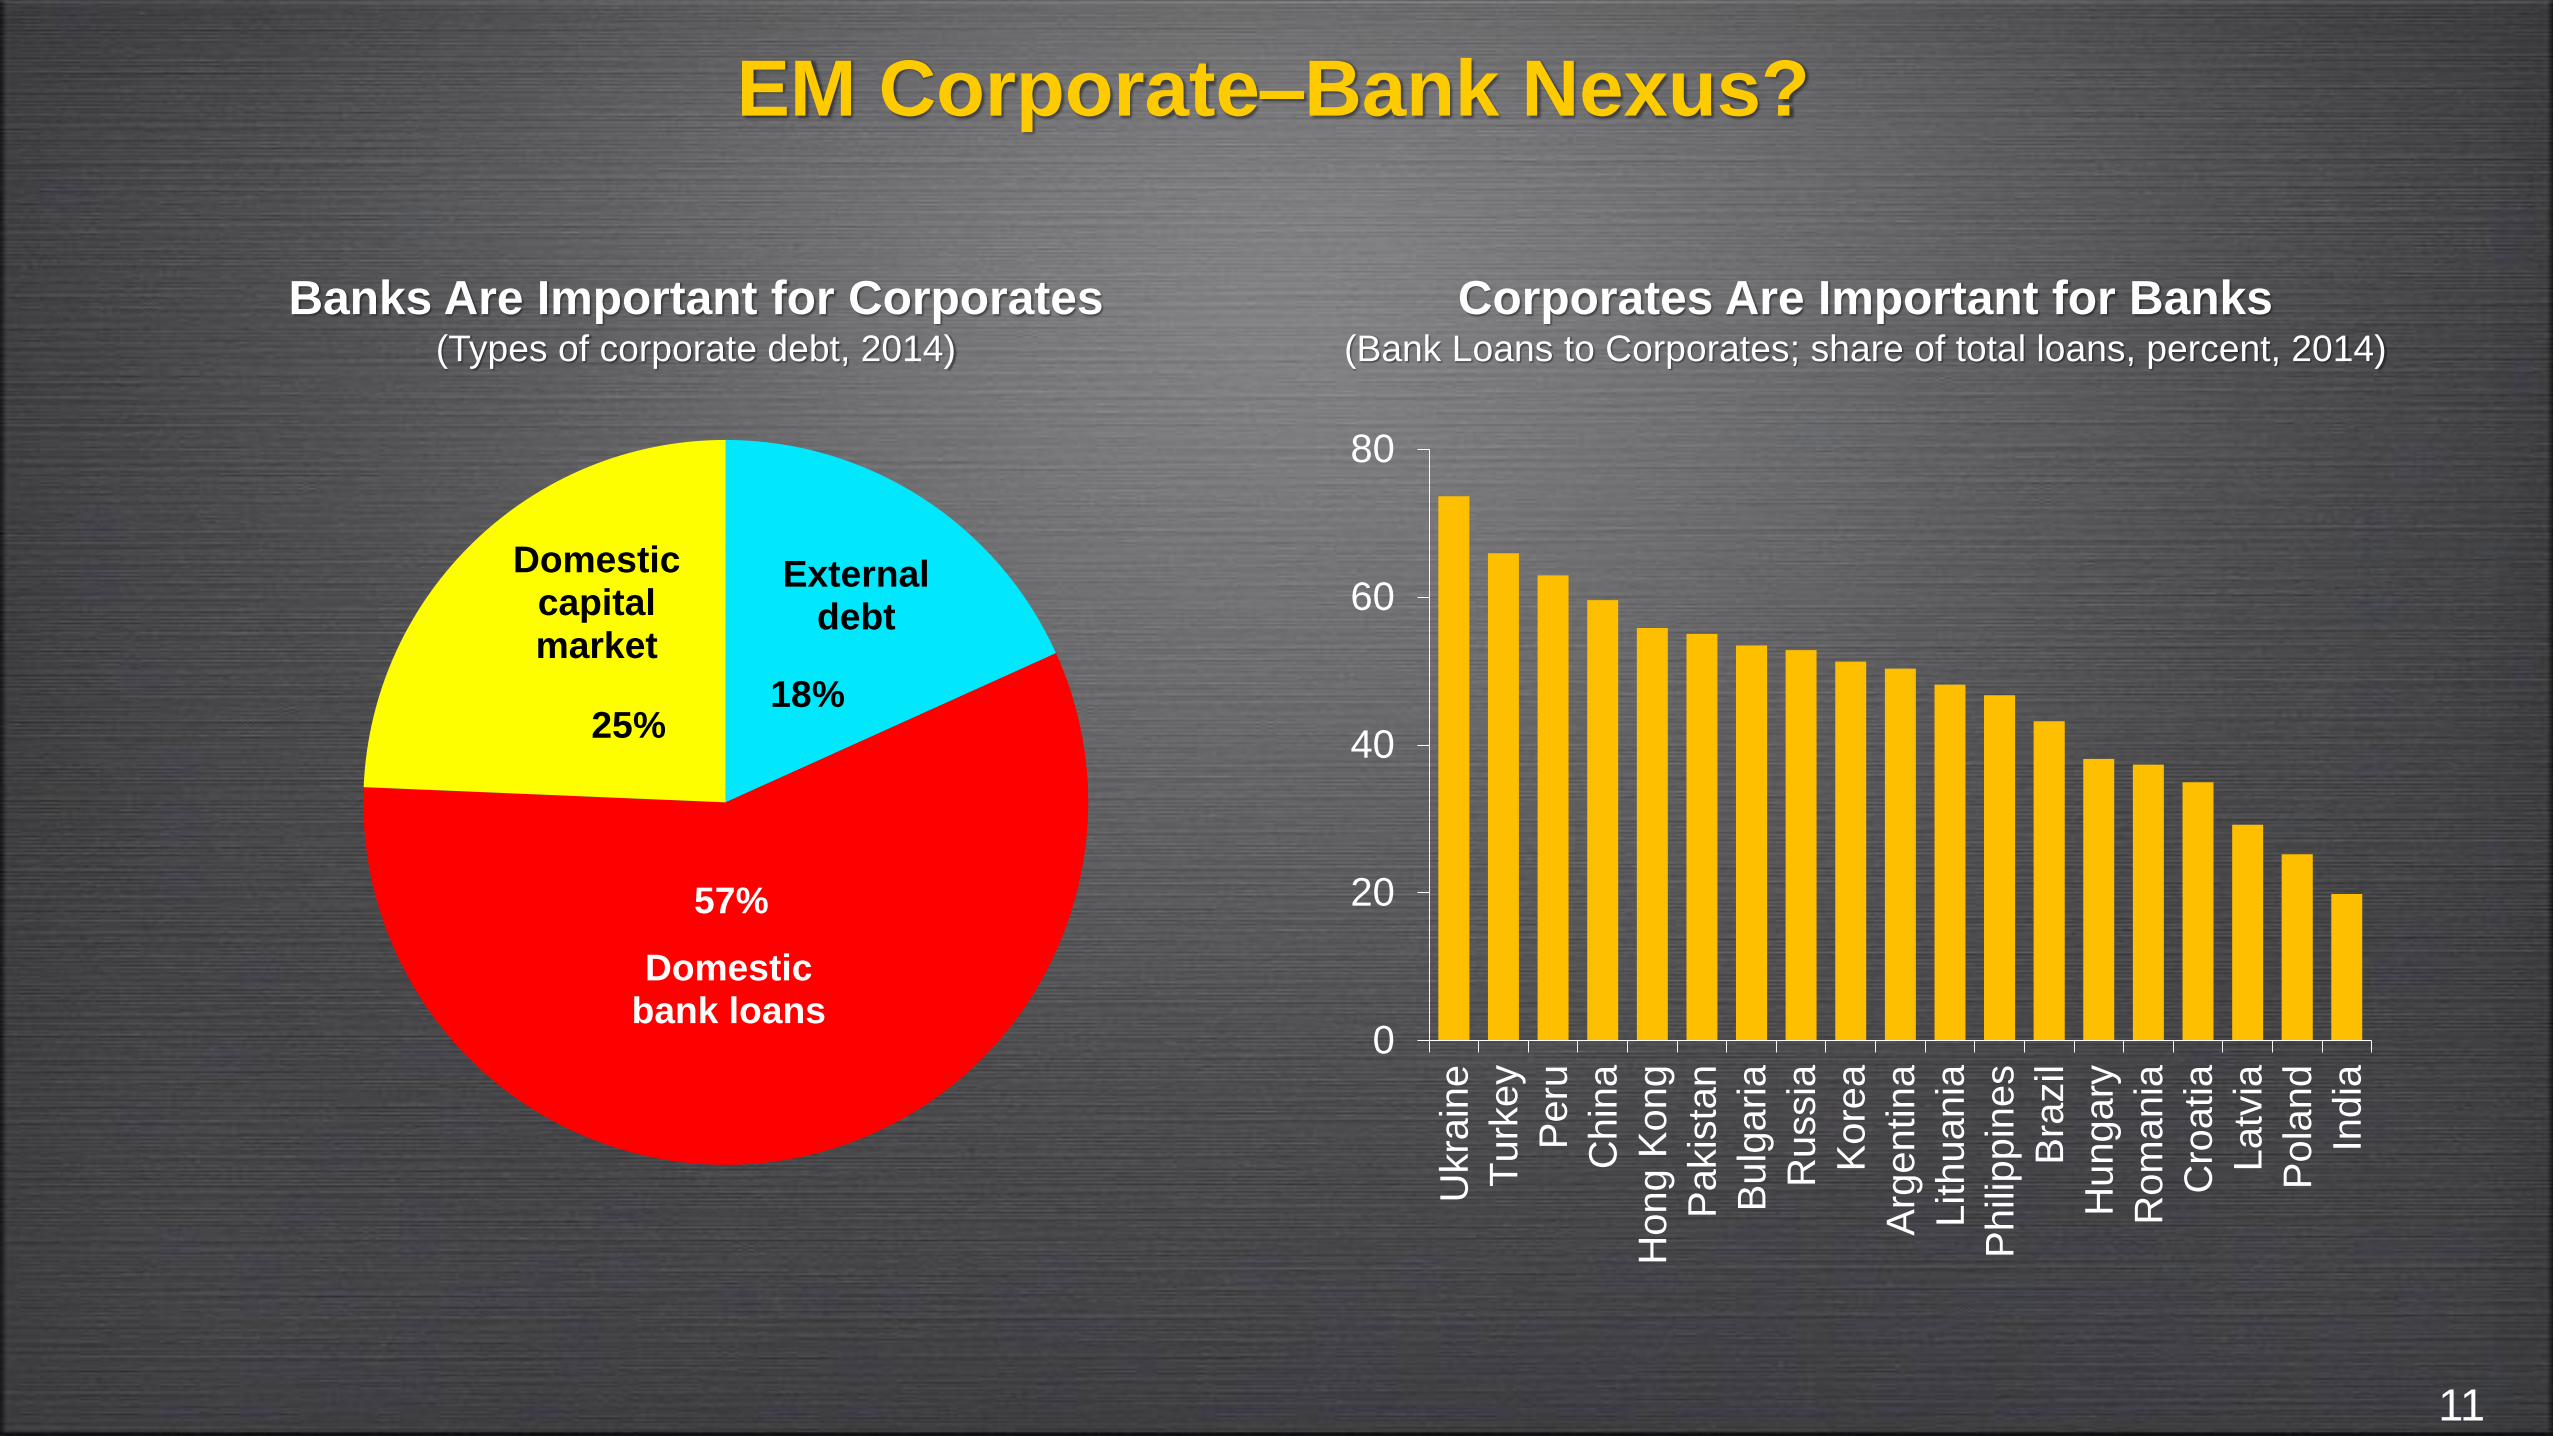
EM Corporate–Bank Nexus?
Corporates Are Important for Banks(Bank Loans to Corporates; share of total loans, percent, 2014)
Banks Are Important for Corporates(Types of corporate debt, 2014)
External debt
Domestic bank loans
Domestic capital market
57%
18%25%
11
0
20
40
60
80
Ukra
ine
Tu
rke
y
Pe
ru
Ch
ina
Hong K
ong
Pa
kis
tan
Bu
lgaria
Russia
Kore
a
Arg
entina
Lithuania
Phili
ppin
es
Bra
zil
Hungary
Ro
ma
nia
Cro
atia
Latv
ia
Po
land
India
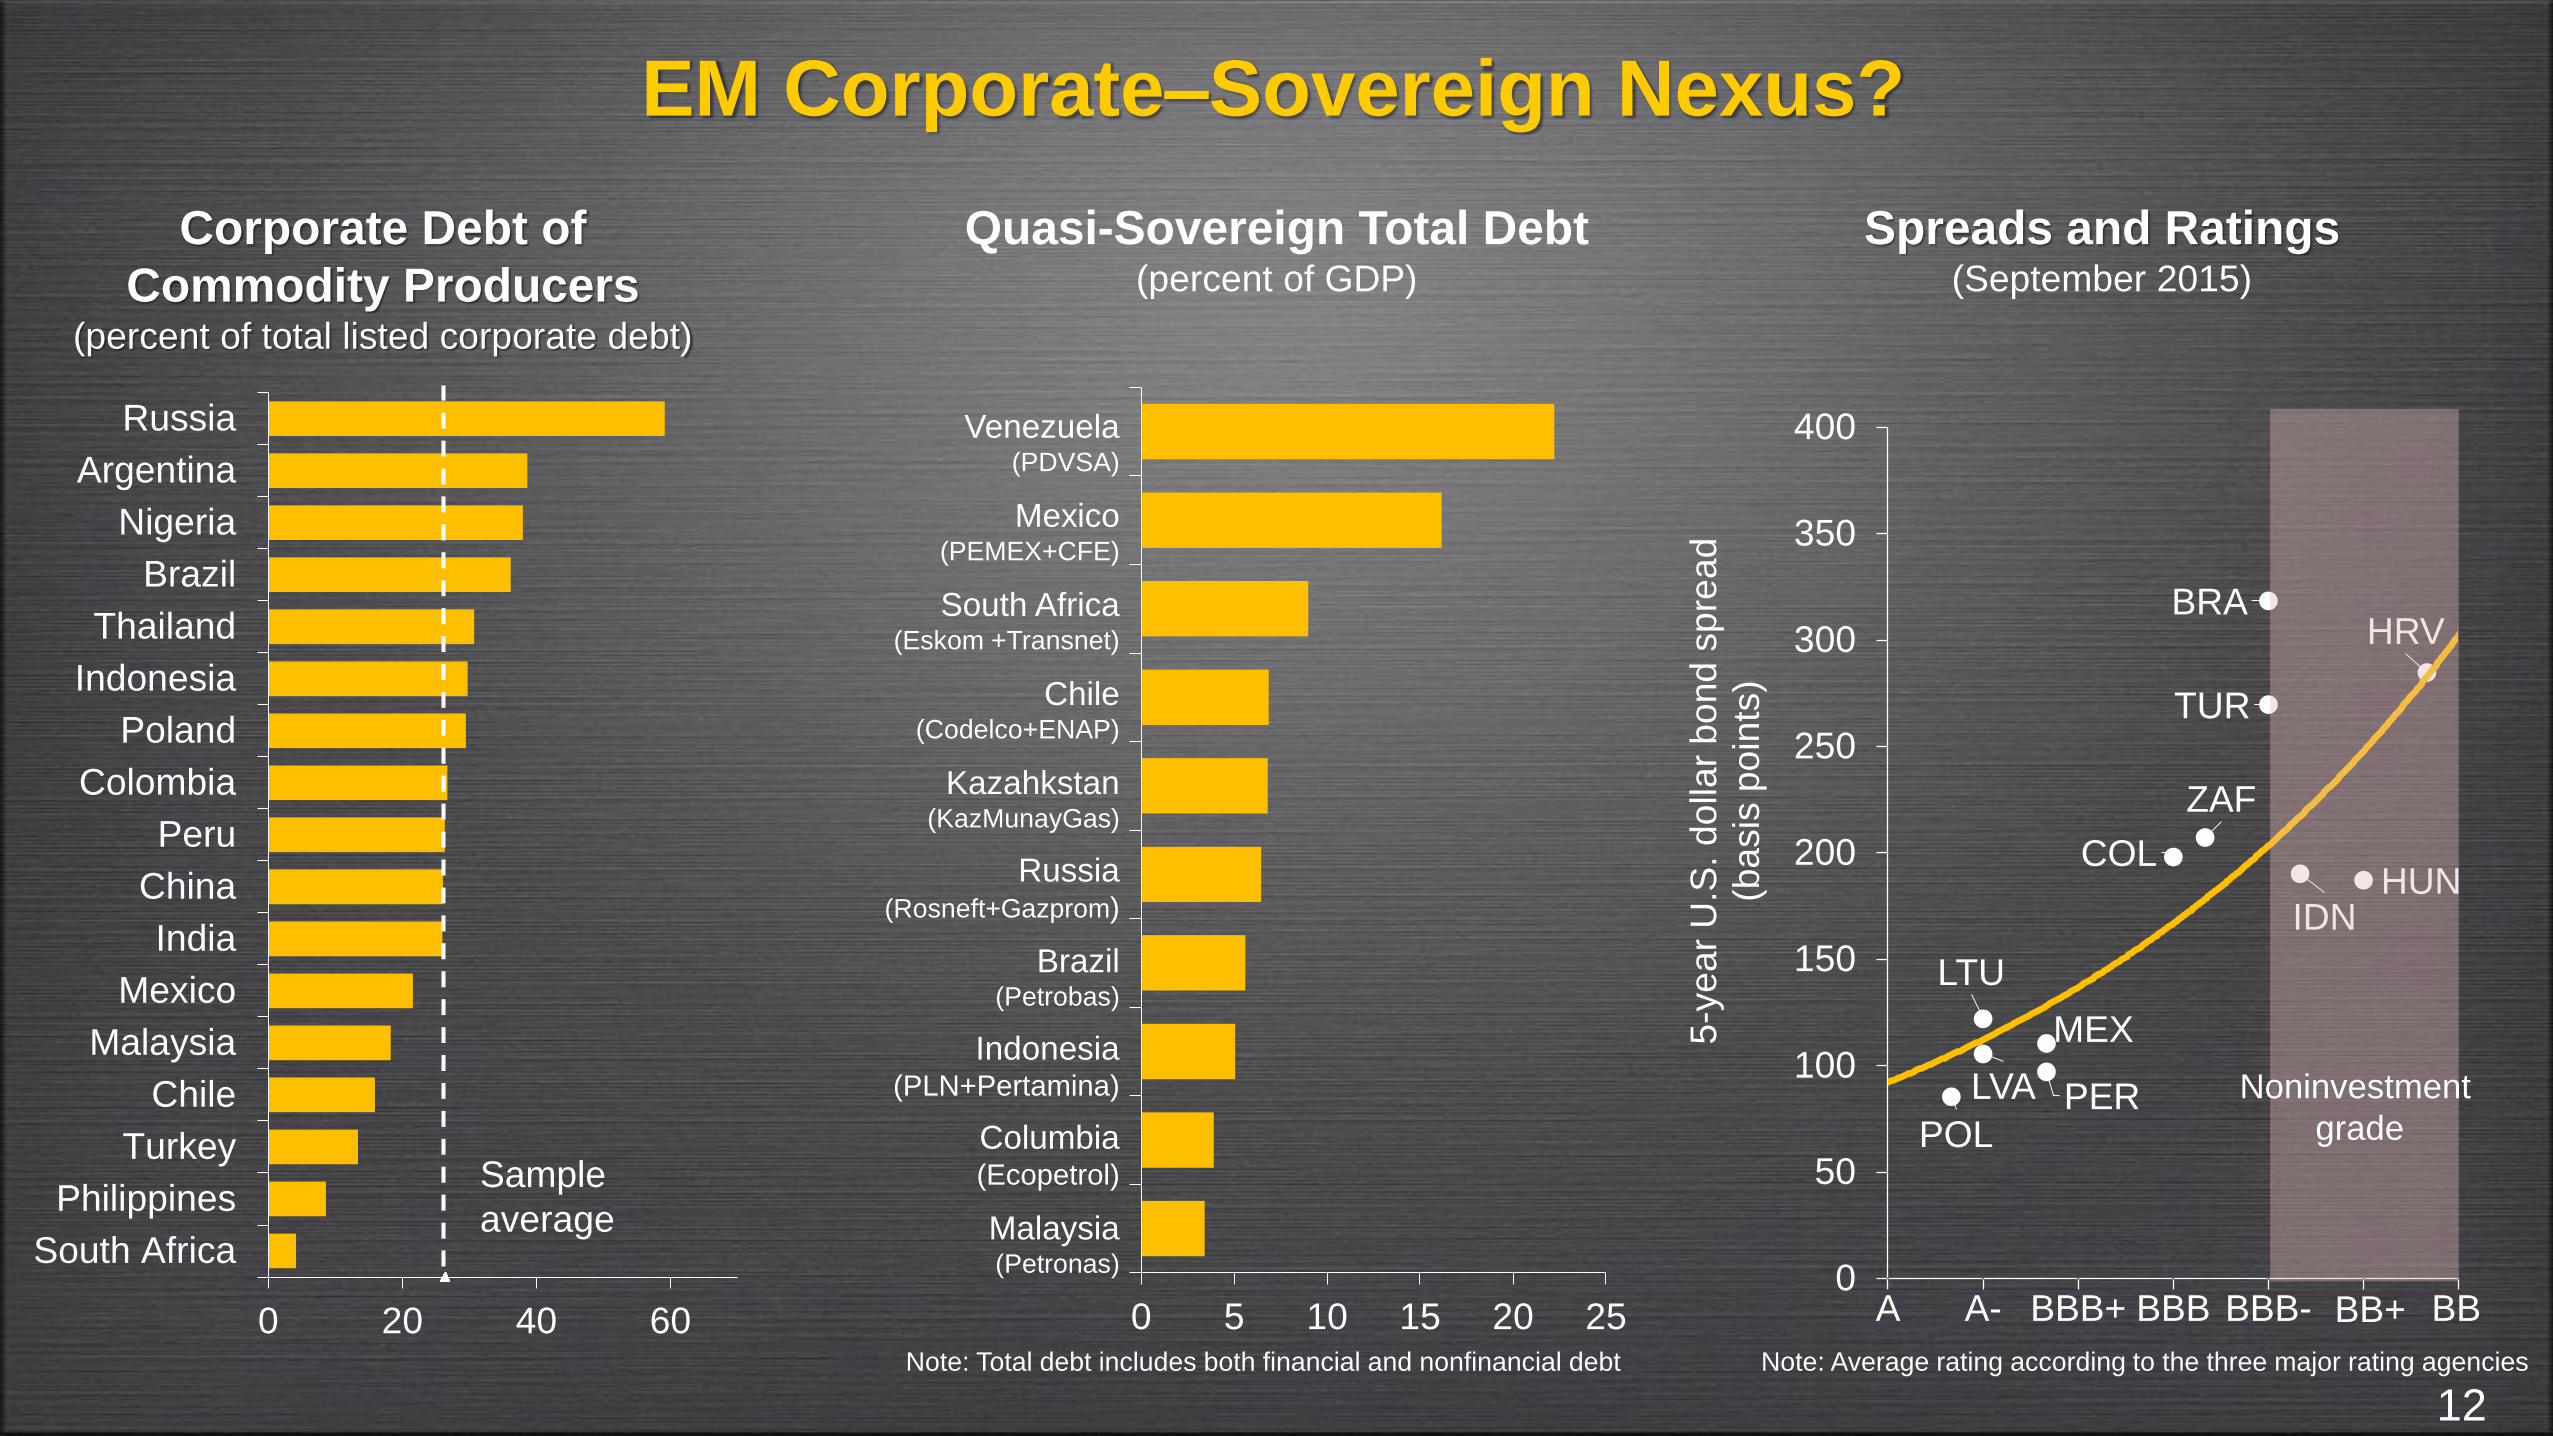
EM Corporate–Sovereign Nexus?
Spreads and Ratings(September 2015)
Note: Average rating according to the three major rating agencies
12
Quasi-Sovereign Total Debt(percent of GDP)
Corporate Debt of
Commodity Producers(percent of total listed corporate debt)
0 20 40 60
South Africa
Philippines
Turkey
Chile
Malaysia
Mexico
India
China
Peru
Colombia
Poland
Indonesia
Thailand
Brazil
Nigeria
Argentina
Russia
Sample
average
0 5 10 15 20 25
Venezuela (PDVSA)
Mexico(PEMEX+CFE)
South Africa(Eskom +Transnet)
Chile(Codelco+ENAP)
Kazahkstan(KazMunayGas)
Russia(Rosneft+Gazprom)
Brazil(Petrobas)
Indonesia(PLN+Pertamina)
Columbia(Ecopetrol)
Malaysia(Petronas)
Note: Total debt includes both financial and nonfinancial debt
BRA
COL
MEX
PER POL
HUN
TUR
ZAF
HRV
LTU
LVA
IDN
A A- BBB+ BBB BBB- BB+ BB0
50
100
150
200
250
300
350
400
5-y
ear
U.S
. do
llar
bo
nd
sp
read
(b
asis
po
ints
)
Noninvestment
grade

Triad of Global Policy Challenges
Financial Market Fragilities
Baseline

Amplifiers of Volatility: Market Illiquidity and Leverage
Note: Refers to regulated bond funds domiciled in Europe and the
U.S.
Bond Funds
Hidden Leverage(trillions of U.S. dollars)
Reduced Dealer Market-Making(trillions of U.S. dollars)
Lower Liquidity Raises Volatility(millions of U.S. dollars; index)
40
60
80
100
120
140
160
180
200
220
240
0 1,000 2,000 3,000 4,000
Hig
her
vola
tilit
y
Lower market depth
Latest 12 months
0.0
0.2
0.4
0.6
0.8
1.0
1.2
1.4
2010 2014
-22%
13
0.0
0.5
1.0
1.5
2.0
2.5
$1.5
tn
$0.6
tn
Derivative
exposures
Assets under
management
$2.1
tn
Note: Refers to U.S. banks
Putting It All Together:
Global Spillovers and Scenarios for Financial Stability

14
Financial Contagion
CommodityExporter
Credit Cycle
PHL
COL
CHN
POL
TUR
ARG CHL MYS SAUIND
BRA
MEXZAF
THA
IDN
RUS
Global Vulnerabilities and SpilloversEmerging Markets
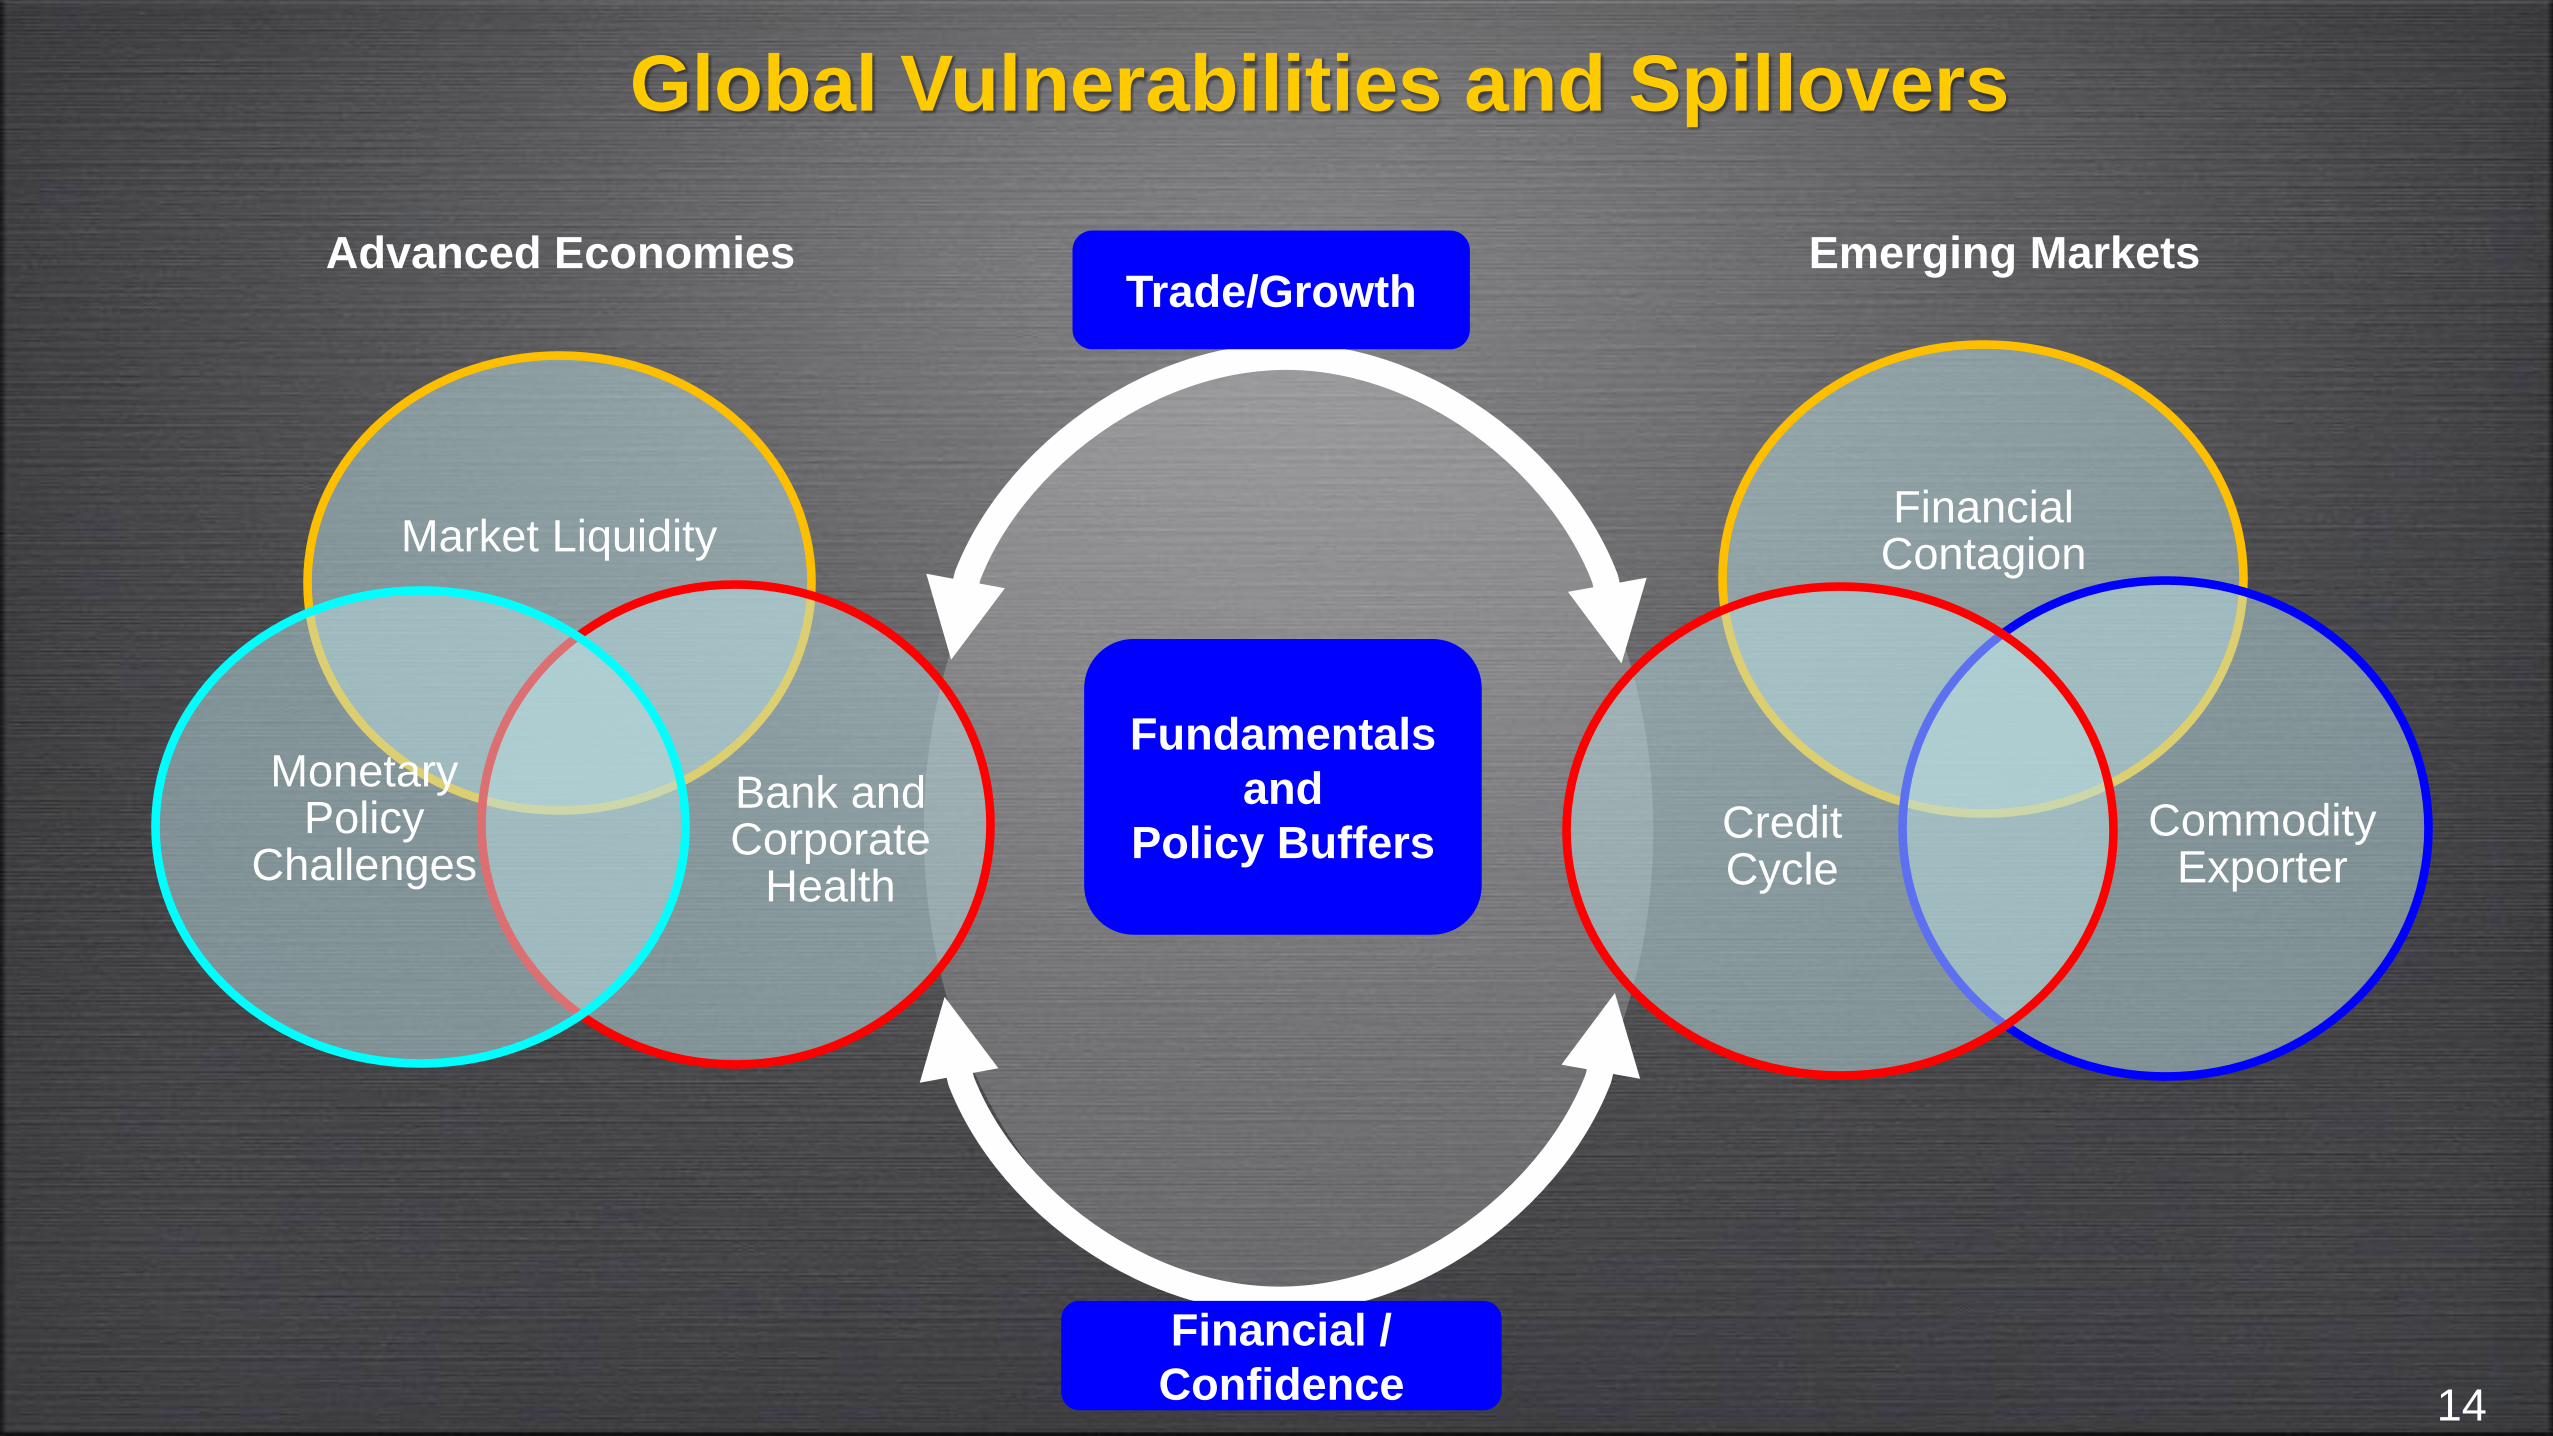
Market Liquidity
Bank and Corporate
Health
Monetary Policy
Challenges
14
Financial Contagion
Commodity Exporter
Credit Cycle
Advanced Economies Emerging MarketsTrade/Growth
Financial /
Confidence
Fundamentals
and
Policy Buffers
Global Vulnerabilities and Spillovers

Three Scenarios for Financial Stability
15
Disruptive
shifts in asset
markets
+0.4%
-2.4%
2.8%
Successful
normalization
Financial stability
not assuredBaseline
Global
output
Smooth
decompression
Abrupt
decompression
Risk premia
compressed

Financial Policy Upgrade: A Collective Effort
16
Build
resilience
Use policy
buffers wisely
Enhance
confidence
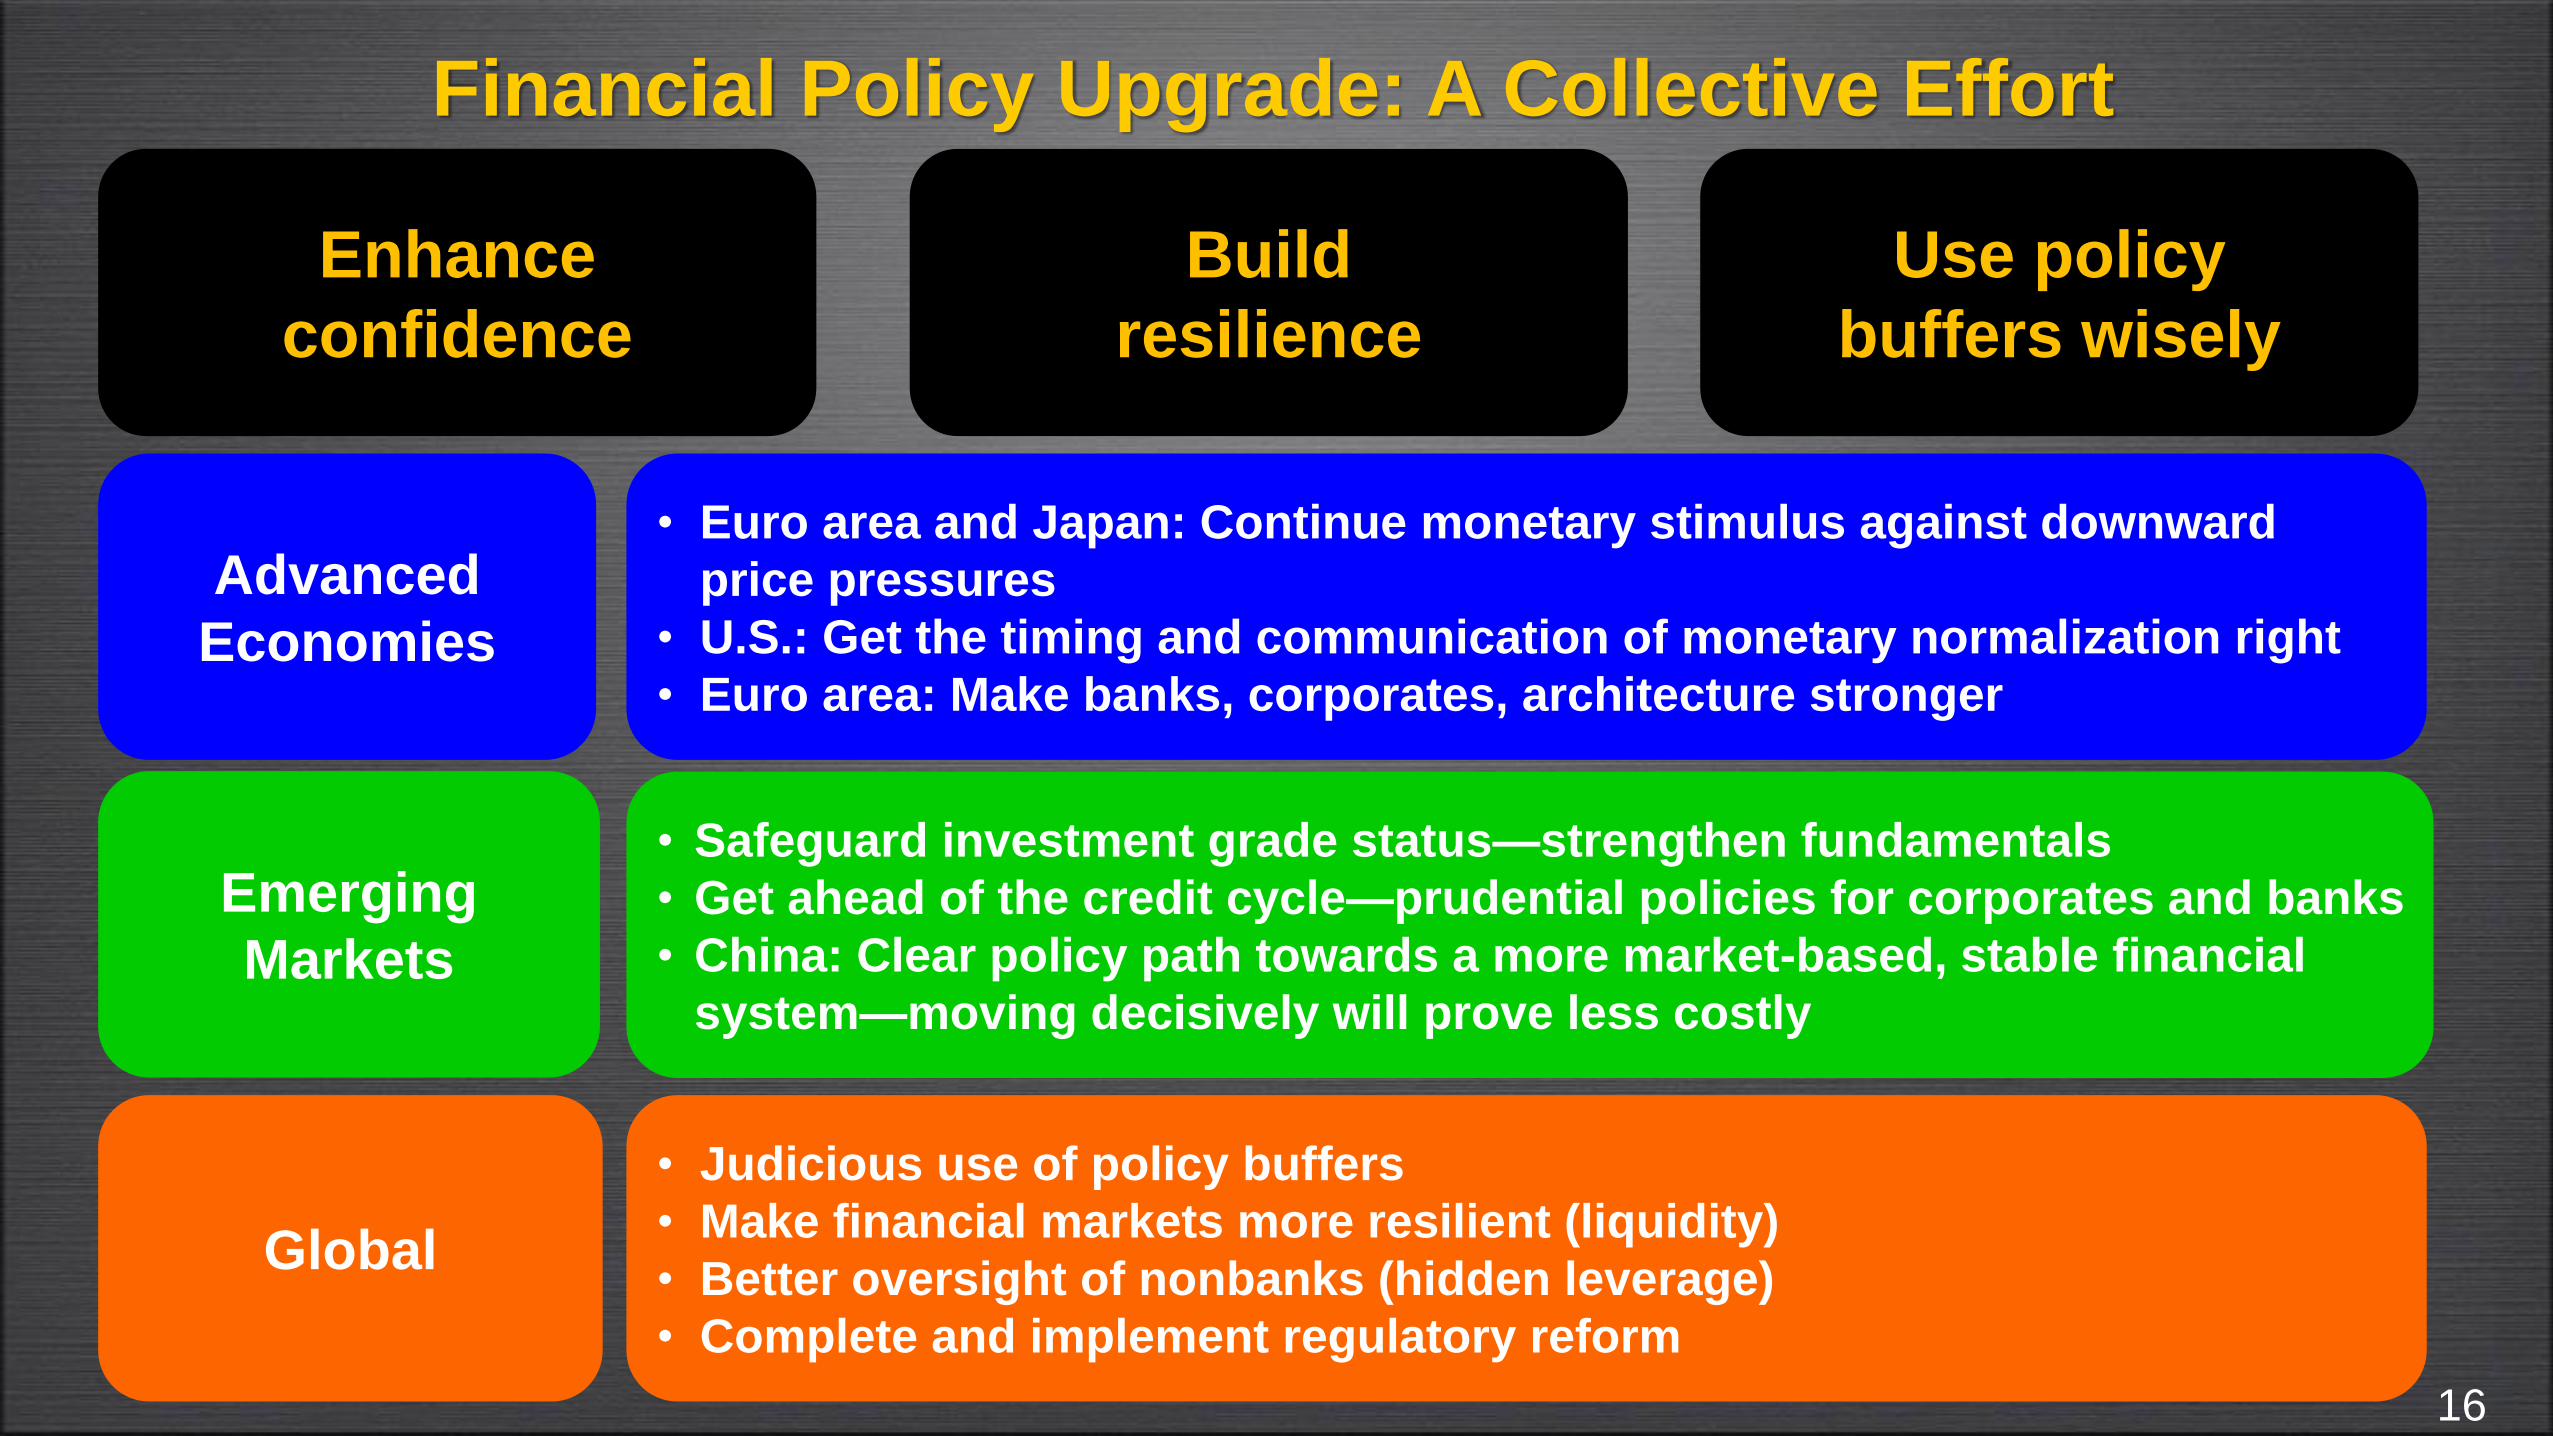
Financial Policy Upgrade: A Collective Effort
Advanced
Economies
• Euro area and Japan: Continue monetary stimulus against downward
price pressures
• U.S.: Get the timing and communication of monetary normalization right
• Euro area: Make banks, corporates, architecture stronger
Emerging
Markets
• Safeguard investment grade status—strengthen fundamentals
• Get ahead of the credit cycle—prudential policies for corporates and banks
• China: Clear policy path towards a more market-based, stable financial
system—moving decisively will prove less costly
Global
• Judicious use of policy buffers
• Make financial markets more resilient (liquidity)
• Better oversight of nonbanks (hidden leverage)
• Complete and implement regulatory reform
16
Enhance
confidence
Build
resilience
Use policy
buffers wisely


