19
© Copyright 2016 RISI, Inc. | Proprietary Information Ben Sirois Associate Economist, Pulp & Recovered Paper San Diego, USA October 2016 Global Fluff Pulp Outlook
© Copyright 2016 RISI, Inc. | Proprietary Information
Ben SiroisAssociate Economist, Pulp & Recovered Paper
San Diego, USAOctober 2016
Global Fluff Pulp Outlook
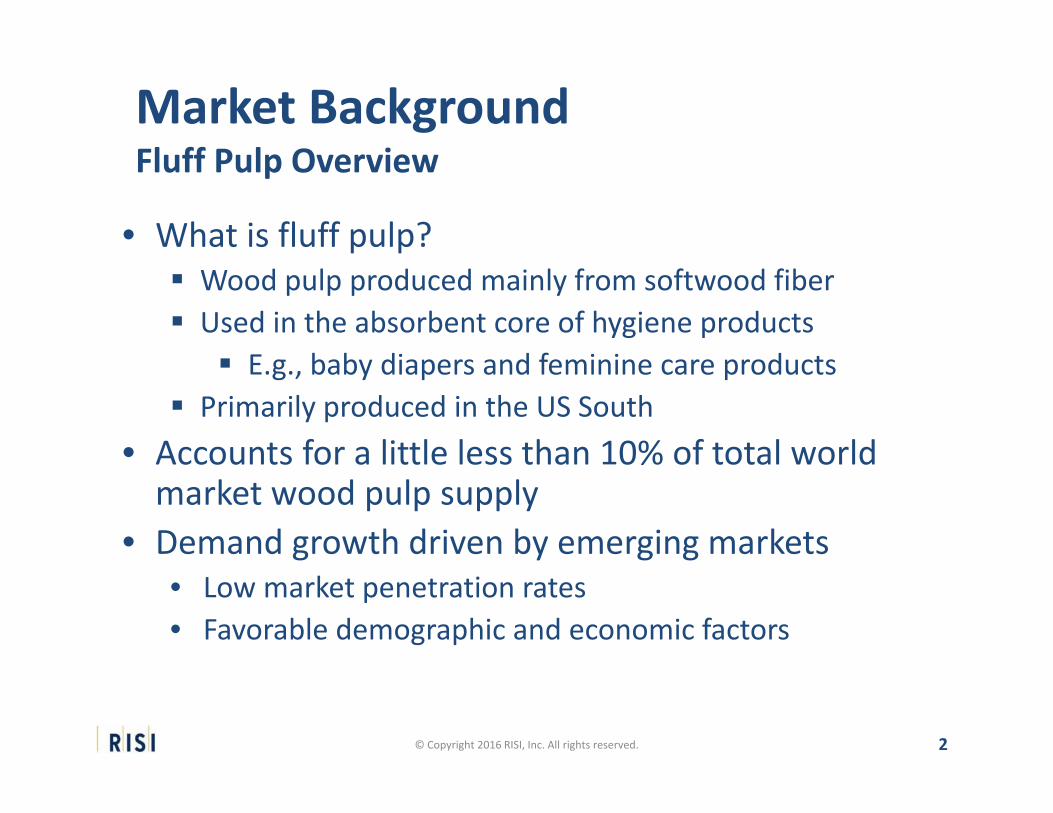
Market BackgroundFluff Pulp Overview
• What is fluff pulp? Wood pulp produced mainly from softwood fiber Used in the absorbent core of hygiene products E.g., baby diapers and feminine care products
Primarily produced in the US South• Accounts for a little less than 10% of total world market wood pulp supply
• Demand growth driven by emerging markets• Low market penetration rates• Favorable demographic and economic factors
2© Copyright 2016 RISI, Inc. All rights reserved.
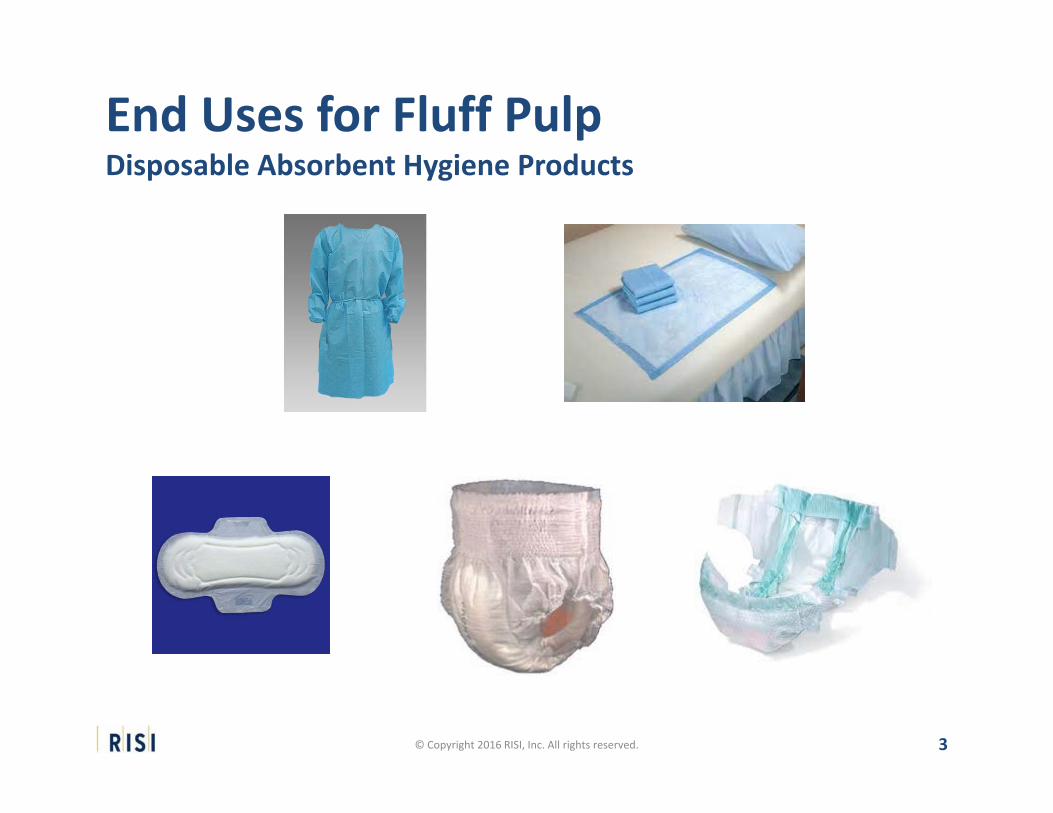
End Uses for Fluff PulpDisposable Absorbent Hygiene Products
3© Copyright 2016 RISI, Inc. All rights reserved.
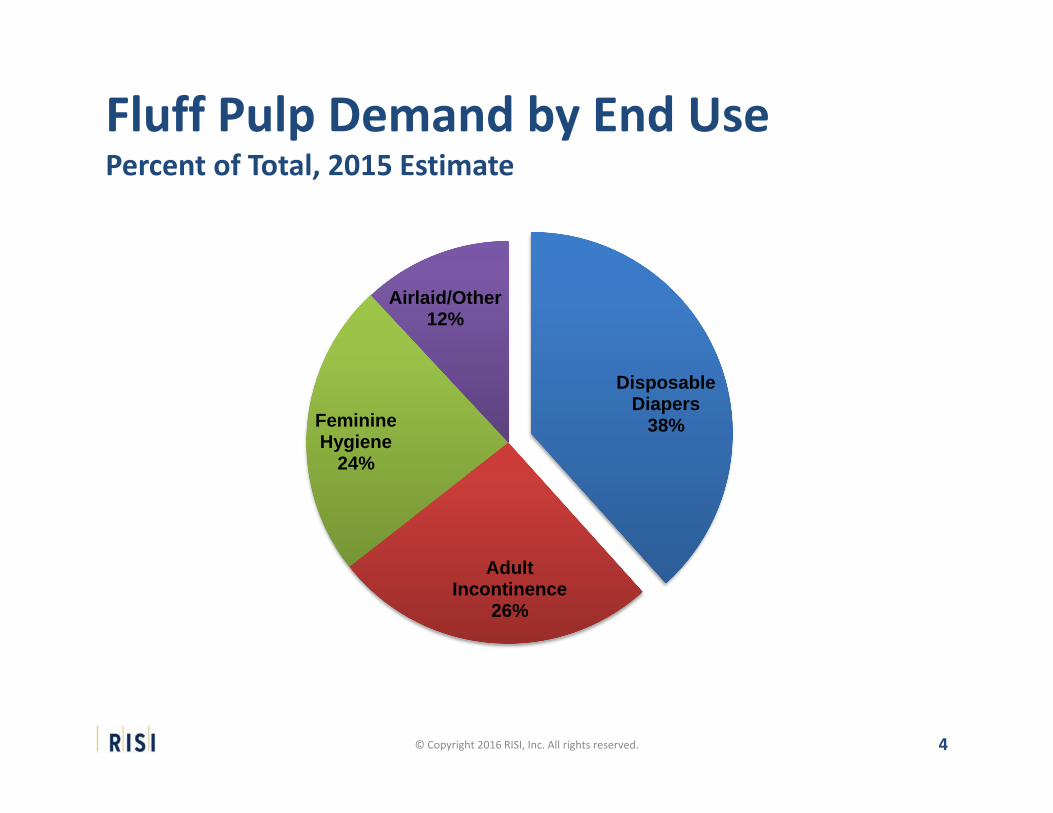
Fluff Pulp Demand by End UsePercent of Total, 2015 Estimate
4© Copyright 2016 RISI, Inc. All rights reserved.
Disposable Diapers
38%
Adult Incontinence
26%
Feminine Hygiene
24%
Airlaid/Other12%
Demand Overview
• World demand growth continues to be moderate 2015 global consumption estimated at 5.8 million tonnes Forecast to grow 3.7% annually in 2016‐2020 Mild slowdown in demand growth in 2016‐2017 due to weak global economic conditions
• Emerging markets will dominate demand growth Disposable absorbent hygiene product use grows with income
93% of total demand growth to come from emerging markets in 2015‐2020
• Mature markets will see little consumption growth
5© Copyright 2016 RISI, Inc. All rights reserved.
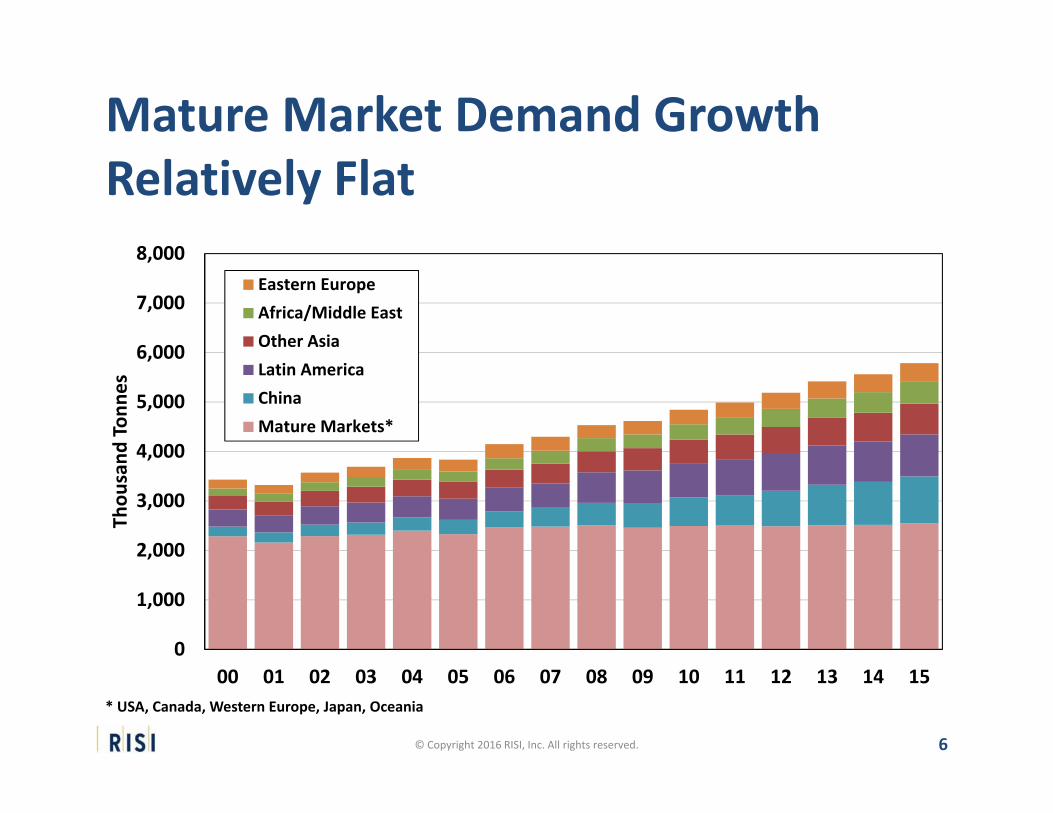
Mature Market Demand Growth Relatively Flat
6© Copyright 2016 RISI, Inc. All rights reserved.
* USA, Canada, Western Europe, Japan, Oceania
0
1,000
2,000
3,000
4,000
5,000
6,000
7,000
8,000
00 01 02 03 04 05 06 07 08 09 10 11 12 13 14 15
Thou
sand
Ton
nes
Eastern EuropeAfrica/Middle EastOther AsiaLatin AmericaChinaMature Markets*
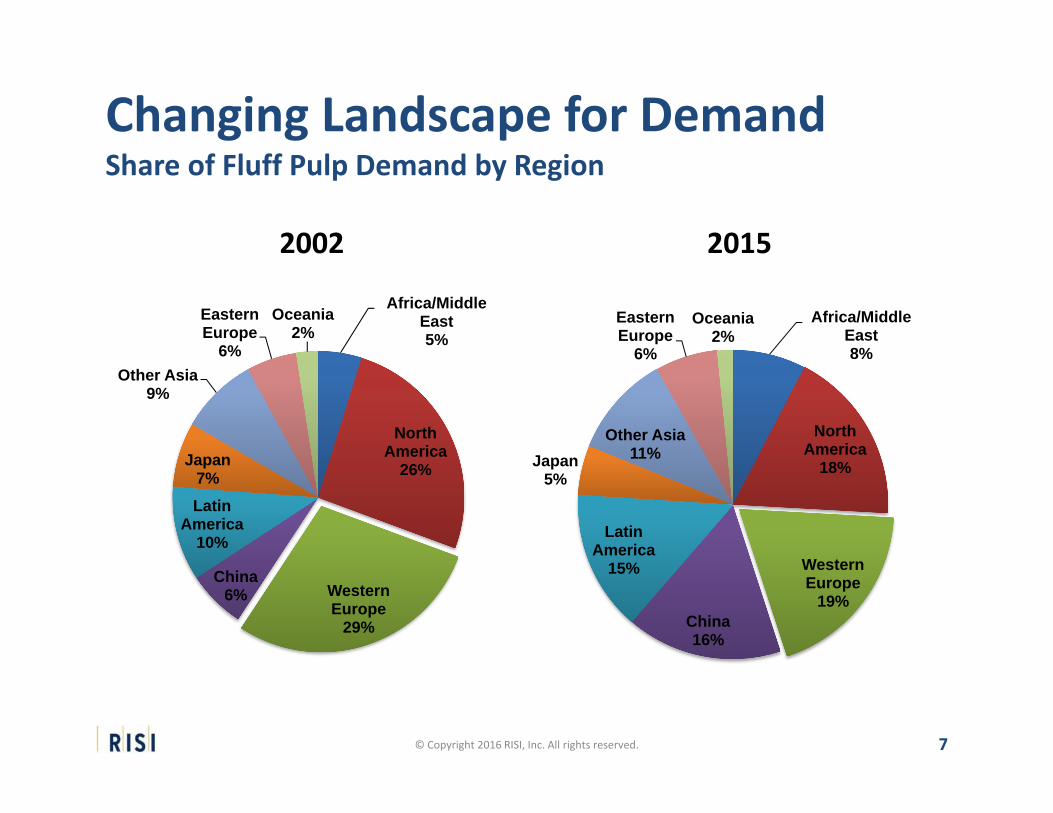
Changing Landscape for DemandShare of Fluff Pulp Demand by Region
7© Copyright 2016 RISI, Inc. All rights reserved.
2002 2015
Africa/Middle East8%
North America
18%
Western Europe
19%China16%
Latin America
15%
Japan5%
Other Asia11%
Eastern Europe
6%
Oceania2%
Africa/Middle East5%
North America
26%
Western Europe
29%
China6%
Latin America
10%
Japan7%
Other Asia9%
Eastern Europe
6%
Oceania2%
Demographics and Income Drive Demand• Potential Absorbent Hygiene Product Users (PAHU) fall into three major categories Children age 0‐2.5 (potential diaper consumer) Women age 15‐49 (potential feminine care consumer) Adults age 65 and older (potential AI product consumer)
• Per capita income drives fluff consumption per PAHU As income levels rise, more can be spent on convenience goods such as disposable absorbent hygiene products
As an economy reaches high levels of income, fluff pulp consumption per user levels off
8© Copyright 2016 RISI, Inc. All rights reserved.
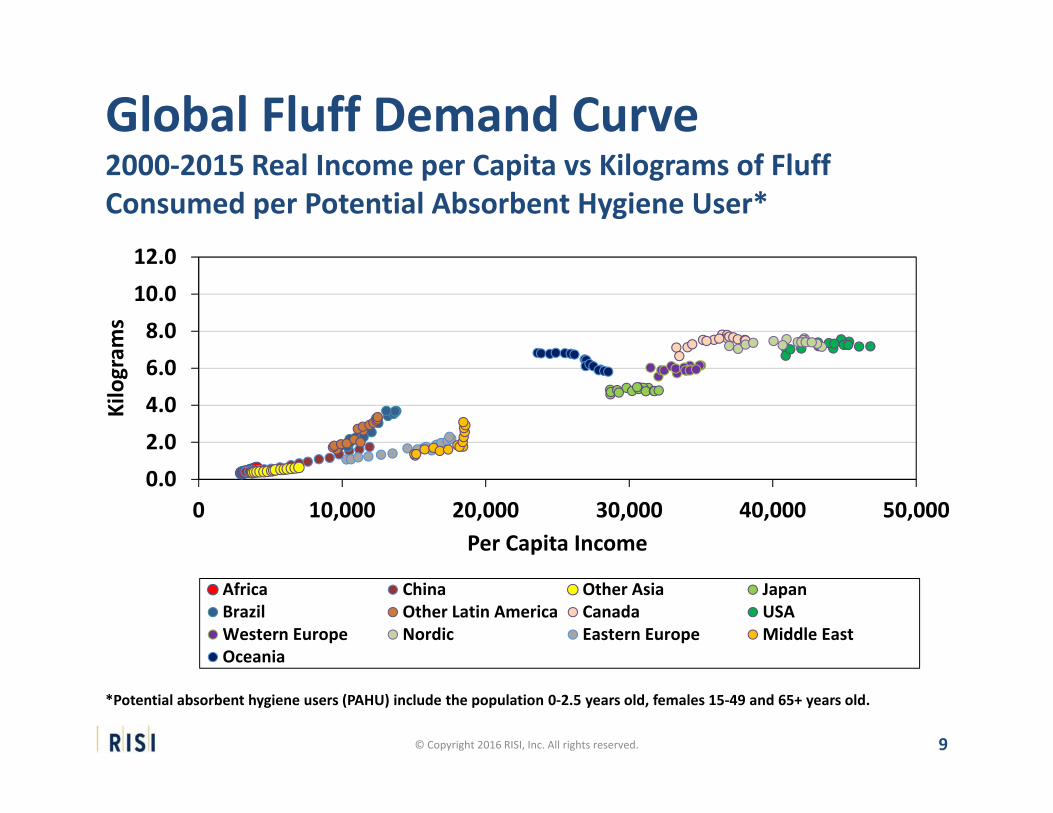
Global Fluff Demand Curve2000‐2015 Real Income per Capita vs Kilograms of Fluff Consumed per Potential Absorbent Hygiene User*
9© Copyright 2016 RISI, Inc. All rights reserved.
*Potential absorbent hygiene users (PAHU) include the population 0‐2.5 years old, females 15‐49 and 65+ years old.
0.02.04.06.08.010.012.0
0 10,000 20,000 30,000 40,000 50,000
Kilogram
s
Per Capita Income
Africa China Other Asia JapanBrazil Other Latin America Canada USAWestern Europe Nordic Eastern Europe Middle EastOceania
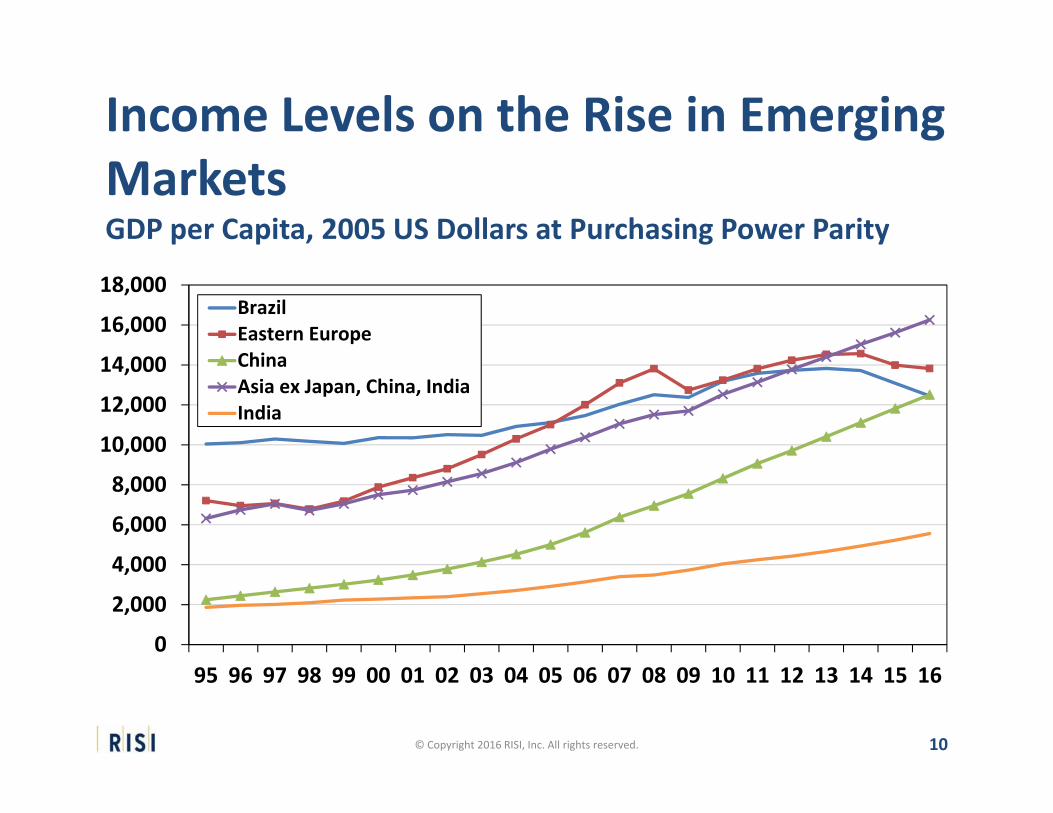
Income Levels on the Rise in Emerging MarketsGDP per Capita, 2005 US Dollars at Purchasing Power Parity
10© Copyright 2016 RISI, Inc. All rights reserved.
0
2,000
4,000
6,000
8,000
10,000
12,000
14,000
16,000
18,000
95 96 97 98 99 00 01 02 03 04 05 06 07 08 09 10 11 12 13 14 15 16
BrazilEastern EuropeChinaAsia ex Japan, China, IndiaIndia
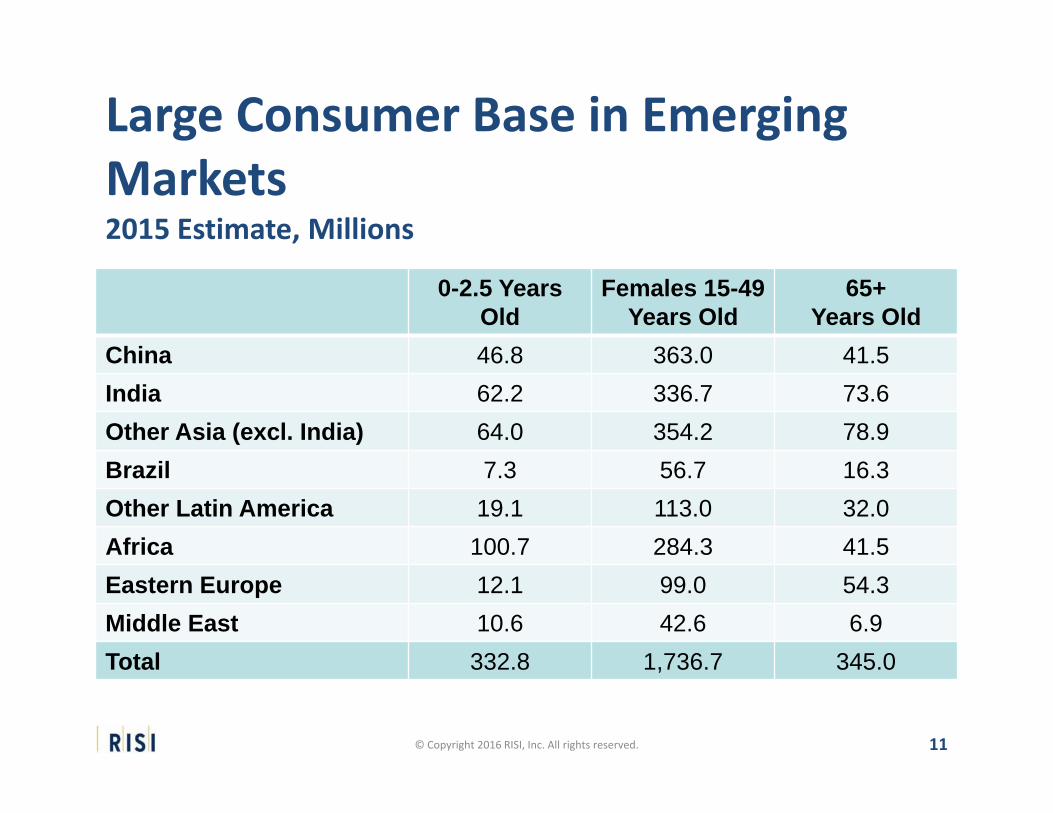
Large Consumer Base in Emerging Markets2015 Estimate, Millions
11© Copyright 2016 RISI, Inc. All rights reserved.
0-2.5 Years Old
Females 15-49 Years Old
65+ Years Old
China 46.8 363.0 41.5India 62.2 336.7 73.6Other Asia (excl. India) 64.0 354.2 78.9Brazil 7.3 56.7 16.3Other Latin America 19.1 113.0 32.0Africa 100.7 284.3 41.5Eastern Europe 12.1 99.0 54.3Middle East 10.6 42.6 6.9Total 332.8 1,736.7 345.0
Supply• Total fluff pulp capacity in 2015 estimated at just under 6.3 million tonnes
• Concentrated industry Top five producers by capacity in 2015 are Georgia‐Pacific (G‐P),
Weyerhaeuser, International Paper (IP), Domtar and Resolute Forest Products
These five producers account for over 80% of the market• Currently large increases in capacity Riegelwood, Ashdown, Ortiguiera and Suzano collectively adding
over 1 million tonnes of capacity in one year• Hardwood fluff may prove to be disruptive BEK production costs are significantly lower than SBSK If product performance proves good, this could put pressure on
traditional producers in the future
12© Copyright 2016 RISI, Inc. All rights reserved.
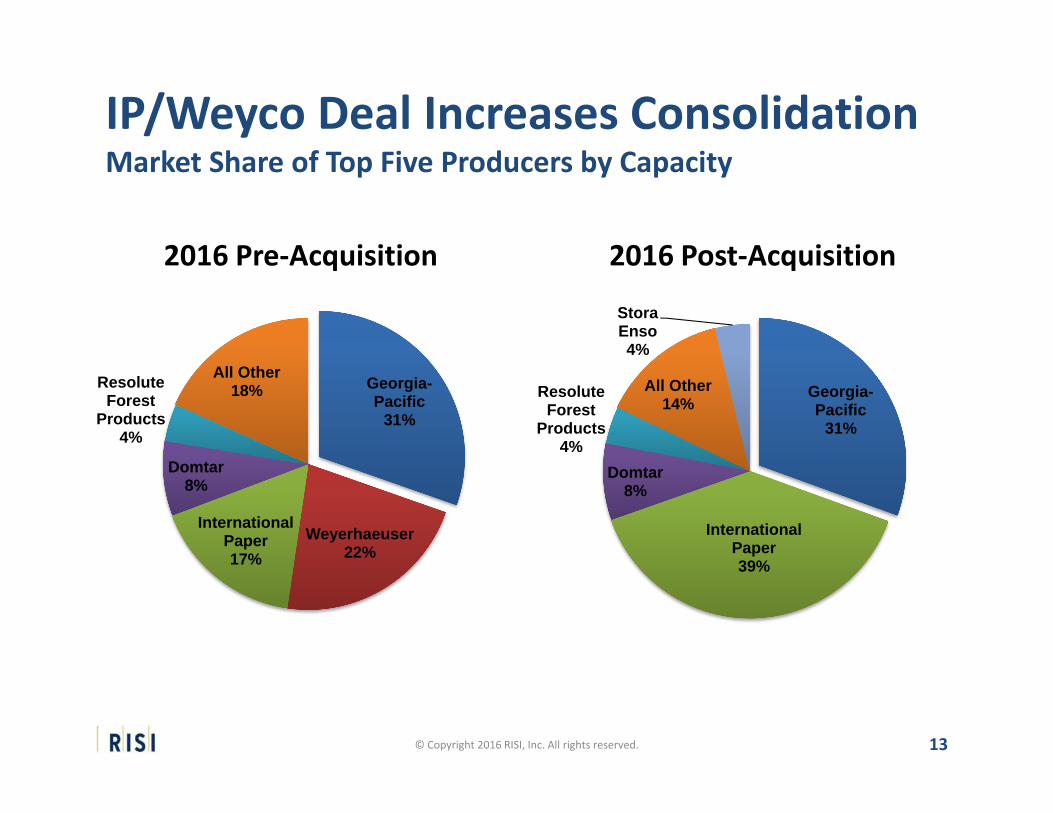
IP/Weyco Deal Increases ConsolidationMarket Share of Top Five Producers by Capacity
13© Copyright 2016 RISI, Inc. All rights reserved.
2016 Pre‐Acquisition 2016 Post‐Acquisition
Georgia-Pacific
31%
Weyerhaeuser22%
International Paper17%
Domtar8%
Resolute Forest
Products4%
All Other18% Georgia-
Pacific31%
International Paper39%
Domtar8%
Resolute Forest
Products4%
All Other14%
Stora Enso4%
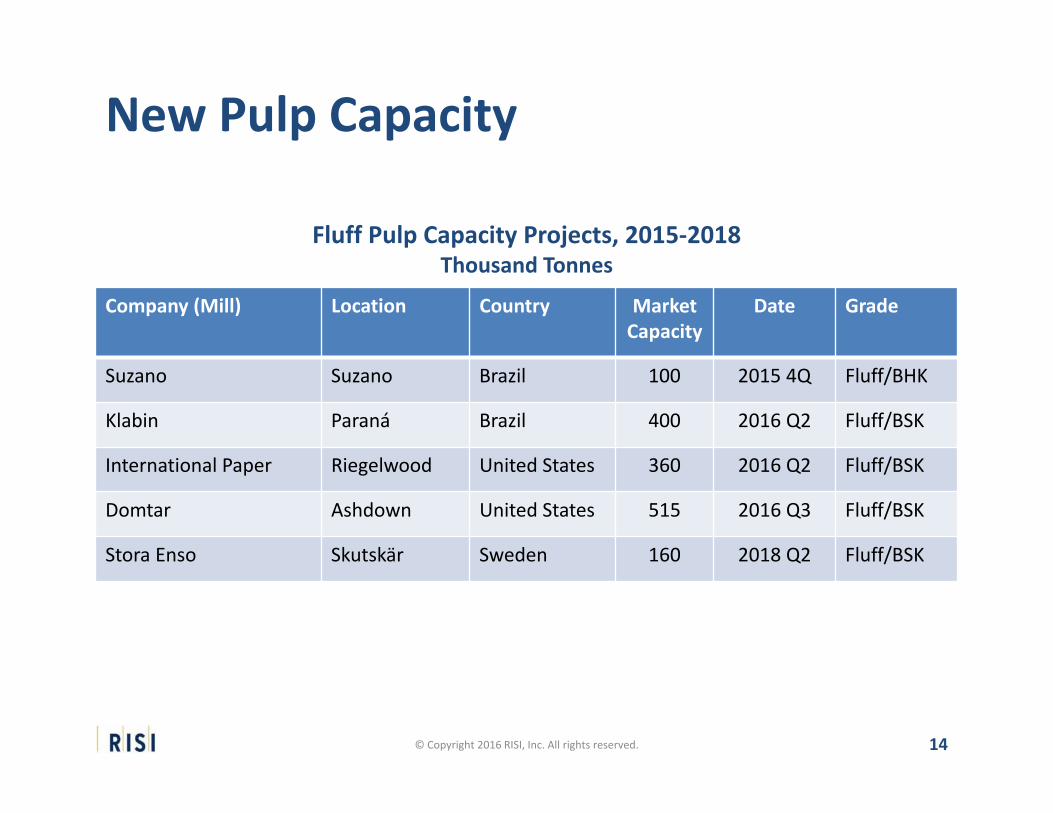
New Pulp Capacity
14© Copyright 2016 RISI, Inc. All rights reserved.
Company (Mill) Location Country Market Capacity
Date Grade
Suzano Suzano Brazil 100 2015 4Q Fluff/BHK
Klabin Paraná Brazil 400 2016 Q2 Fluff/BSK
International Paper Riegelwood United States 360 2016 Q2 Fluff/BSK
Domtar Ashdown United States 515 2016 Q3 Fluff/BSK
Stora Enso Skutskär Sweden 160 2018 Q2 Fluff/BSK
Fluff Pulp Capacity Projects, 2015‐2018Thousand Tonnes
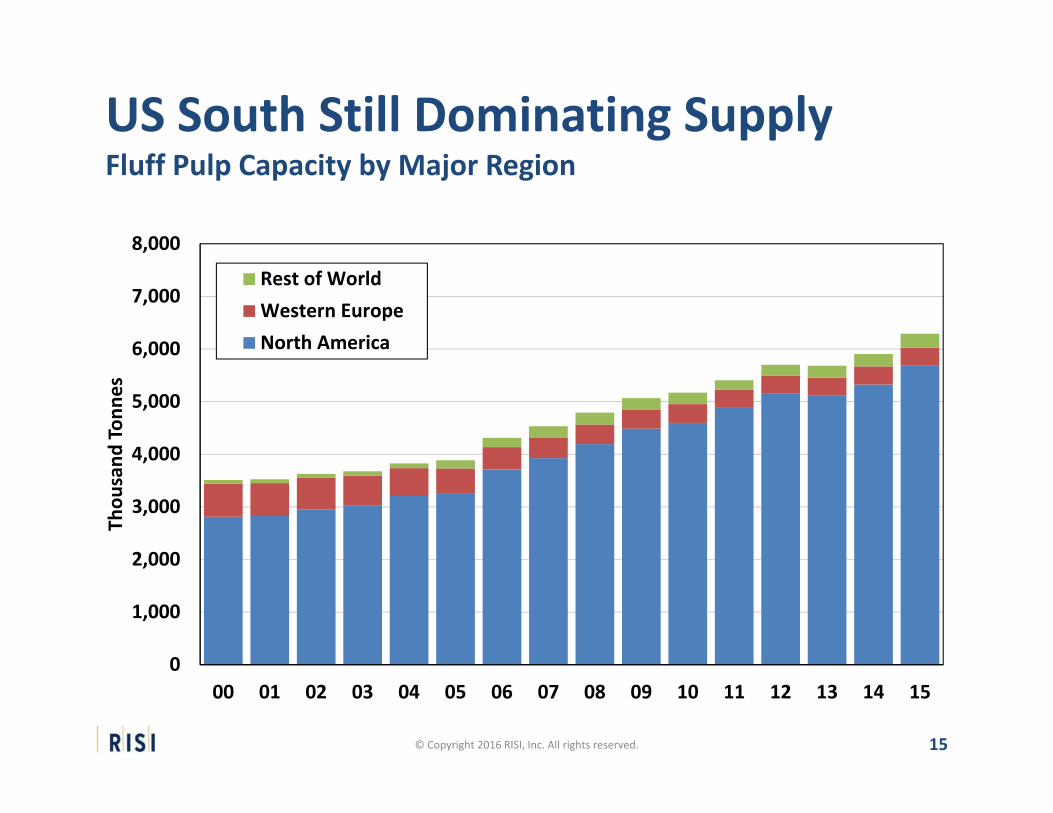
US South Still Dominating SupplyFluff Pulp Capacity by Major Region
15© Copyright 2016 RISI, Inc. All rights reserved.
0
1,000
2,000
3,000
4,000
5,000
6,000
7,000
8,000
00 01 02 03 04 05 06 07 08 09 10 11 12 13 14 15
Thou
sand
Ton
nes
Rest of WorldWestern EuropeNorth America
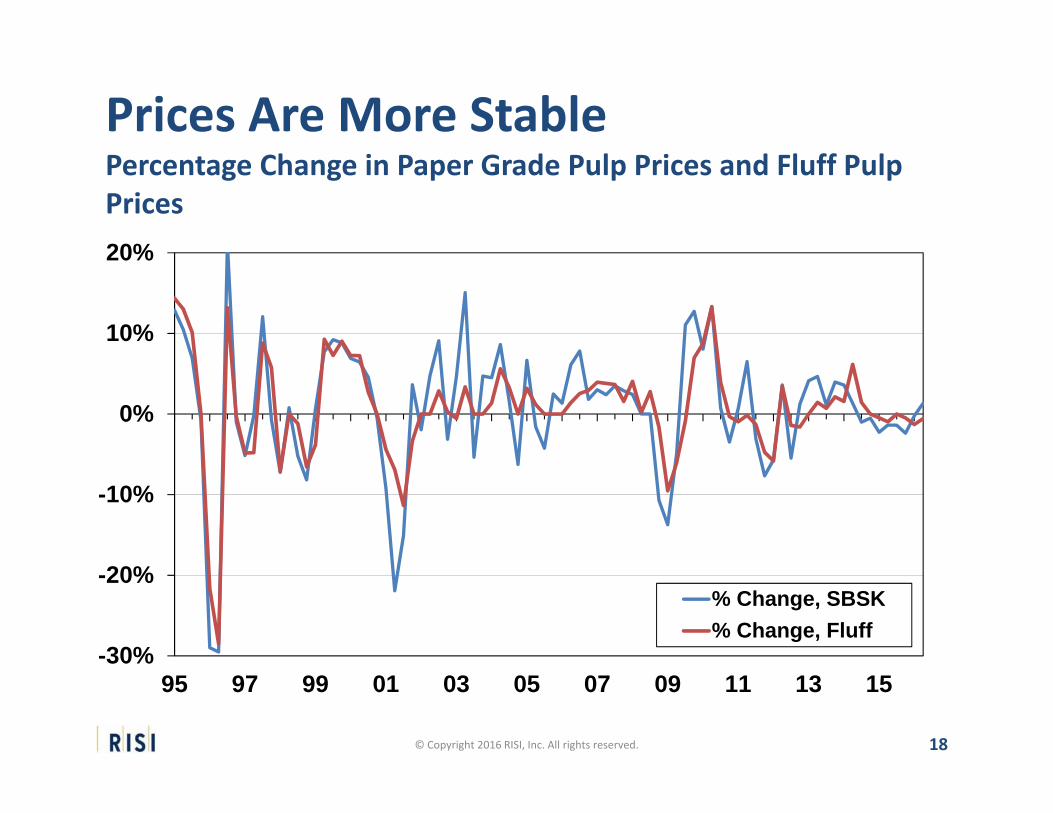
Fluff Pulp Price• Strong relationship between paper grade and fluff Large portion of fluff producers can swing between paper grade and fluff
Swing to fluff pulp as relative profitability of the grade rises in relation to paper grade
• Prices peaked in 2014‐2015 Q1 2015 prices reached $1,050/tonne Have declined to current price of $1,010/tonne as operating rates dropped from 94% to 92%
• New supply putting downward pressure on prices
16© Copyright 2016 RISI, Inc. All rights reserved.
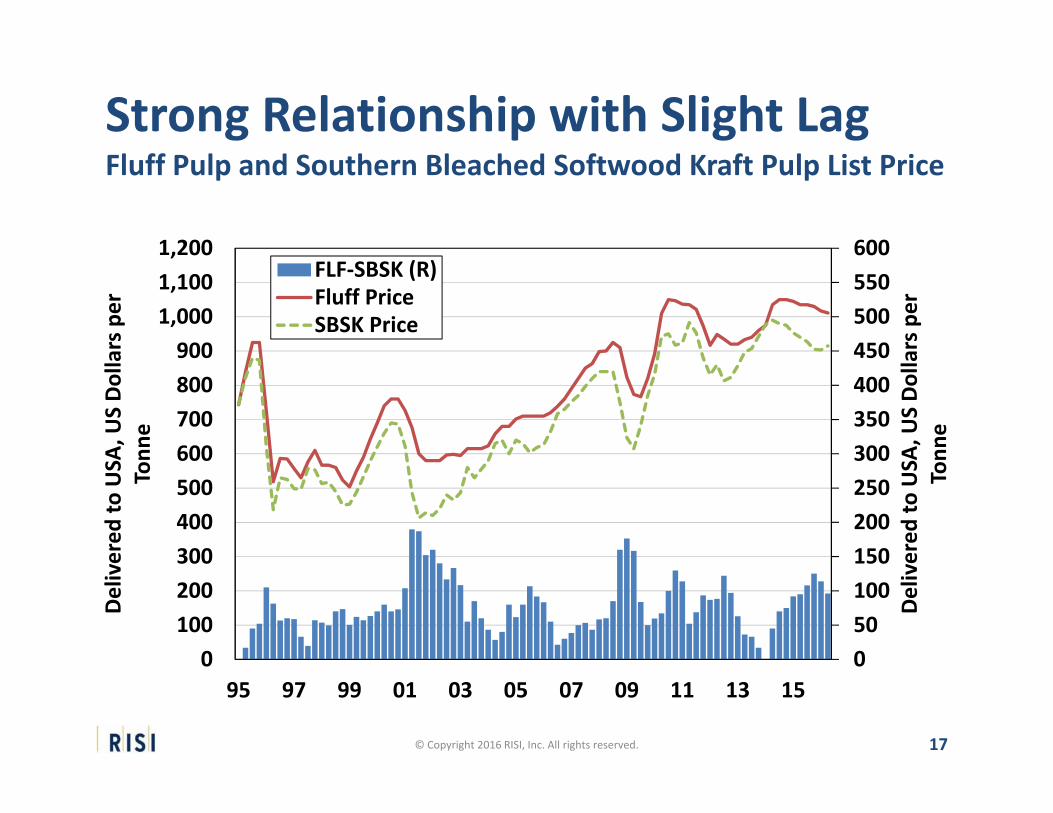
17
Strong Relationship with Slight LagFluff Pulp and Southern Bleached Softwood Kraft Pulp List Price
© Copyright 2016 RISI, Inc. All rights reserved.
050100150200250300350400450500550600
0100200300400500600700800900
1,0001,1001,200
95 97 99 01 03 05 07 09 11 13 15
Delivered
to USA
, US Dollars per
Tonn
e
Delivered
to USA
, US Dollars per
Tonn
e
FLF‐SBSK (R)Fluff PriceSBSK Price
18
Prices Are More StablePercentage Change in Paper Grade Pulp Prices and Fluff Pulp Prices
© Copyright 2016 RISI, Inc. All rights reserved.
-30%
-20%
-10%
0%
10%
20%
95 97 99 01 03 05 07 09 11 13 15
% Change, SBSK% Change, Fluff
© Copyright 2016 RISI, Inc. | Proprietary Information 19
Outlook for the World Fluff Pulp Market: Special Market Analysis Studywww.risi.com/fluffpulp16
Thank you for your attention!For more information:
World Pulp & Recovered Paper Forecastwww.risi.com/WPRP5
World Pulp Monthlywww.risi.com/WPM


