73
Global Generic Trends and More For IGPA 11/20/14 By Doug Long VP Industry Relations IMS Health [email protected]
Global Generic Trends and More
For IGPA 11/20/14
By Doug Long
VP Industry Relations
IMS Health

Agenda
• Major trends and Global Medicines Spend
• Specialty medicines
• Generic medicines and purchasing alliances
• Conclusions

Global spending growth will peak in 2014 at 7%, 4-7% CAGR through 2018
Report by the IMS Institute for Healthcare Informatics The Global Use of Medicines: Outlook through 2018 4
Global spending and growth, 2009-2018
0%
2%
4%
6%
8%
10%
12%
14%
0
200
400
600
800
1,000
1,200
1,400
2009 2010 2011 2012 2013 2014 2015 2016 2017 2018
GRO
WTH
CO
NST U
S$%
SPEN
DIN
G U
S$BN
Sales Growth
Source: IMS Health Market Prognosis, September 2014
2014-18 CAGR, 4-7%
Forecast

The global pharmaceutical market is expected to grow to nearly $1.3 trillion by 2018
Report by the IMS Institute for Healthcare Informatics
Global spending and growth, 2008-2018
2008 2009-2013 2013 2014-2018 2018
$795Bn
$194Bn
$989Bn
$290-320Bn
$1,280-1,310 Bn
Source: IMS Health Market Prognosis, September 2014
5 The Global Use of Medicines: Outlook through 2018

Developed markets recovery (pre rebates/discounts) lead by US, UK and Canada in the next five years
Developed Markets
CAGR 2014-2018
US 5-8%
Japan 1-4%
Germany 2-5%
France (-2)-1%
Italy 2-5%
Canada 3-6%
Spain (-1)–2%
UK* 4-7%
Developed 3-6%
Pharmerging Markets
CAGR 2014-18
Tier 1 (China) 9-12%
Tier 2 9-12%
Brazil 9-12%
Russia 7-10%
India 9-12%
Tier 3 6-9%
Pharmerging 8-11%
At par with region CAGR
Lower than region CAGR
Higher than region CAGR
0%
2%
4%
6%
8%
10%
12%
14%
0
200
400
600
800
1,000
1,200
1,400
2013 2014
(f)
2015
(f)
2016
(f)
2017
(f)
2018
(f)
% G
RO
WTH
(CO
NST U
S$)
SALES U
S$BN
Pharmerging US EU5 Global growth
Contains Audited + Unaudited data. All CAGR calculations are 5 years
Source: IMS Health Market Prognosis, Sep 2014, at ex-manufacturer price levels, not including rebates and discounts. *UK growth is pre-PPRS
Pharmerging sees deceleration across all major countries except Turkey

-5
0
5
10
15
20
0 5 10 15 20 25
China remains the largest and fastest growing pharmerging market, at list price
Major deceleration across almost all pharmerging; only Thailand and Turkey will see real improved growth*
2009-2018: Pharmerging Markets Growth Dynamics
2014-2018 5 Yr CAGR 7.9 – 10.9%
2009-2013 5 Yr CAGR 13.5%
Source: IMS Health Market Prognosis, Sep 2014, at ex-manufacturer price levels, not including rebates and discounts. Contains Audited + Unaudited data. Bubble Size indicates 2013 LC$ Sales. All CAGR calculations are 5 years, *Venezuela excluded from perspective due to volatility
Fore
caste
d G
row
th,
CAG
R (
2014 -
2018)
Historic Growth (2009-2013)
South Africa
Saudi Arabia
Russian Federation
Romania Poland
Pakistan
Nigeria
Mexico
Indonesia
India
Egypt
Colombia
China Brazil
Argentina
Algeria
Vietnam
Venezuela
Ukraine
Turkey
Thailand
Tier 3 Countries
Newly defined ph countries
Tier 1&2 Countries
Venezuela and Argentina adapted for their hyperinflation and currency devaluations

Pharmerging will account for 55% of all the pharmaceutical market’s value growth to 2018
24% 24%
1% 2% 8% 6% 0% 2% 6% 5% 1% 1%
25% 27%
14% 16%
12% 12%
8% 7%
2009-2013 2014-2018
*Rest of Europe excludes Russia, Turkey, Poland, Romania, Ukraine, which are included in Pharmerging
Region Contribution to Global Growth 2018 Region Market Share
United States
32%
Canada
2%
EU5
14% Rest of Europe*
5%
Japan
8%
S. Korea
1%
Pharmerging Tier
1 (China) 14%
Pharmerging Tier
2 8%
Pharmerging Tier
3 9%
Rest of World
6%
United States
Canada
EU5
Rest of Europe*
Japan
S. Korea
Pharmerging Tier 1 (China)
Pharmerging Tier 2
Pharmerging Tier 3
Rest of World
Share
of Regio
nal Contr
ibution
to G
row
th (
%)
Source: IMS Market Prognosis, March 2014, at ex-manufacturer price levels, not including rebates and discounts. Contains Audited+Unaudited data. Growth and 2018 Market share based on LCUS$
55% of all value growth 31% of all
value
And the US still account for a quarter of growth
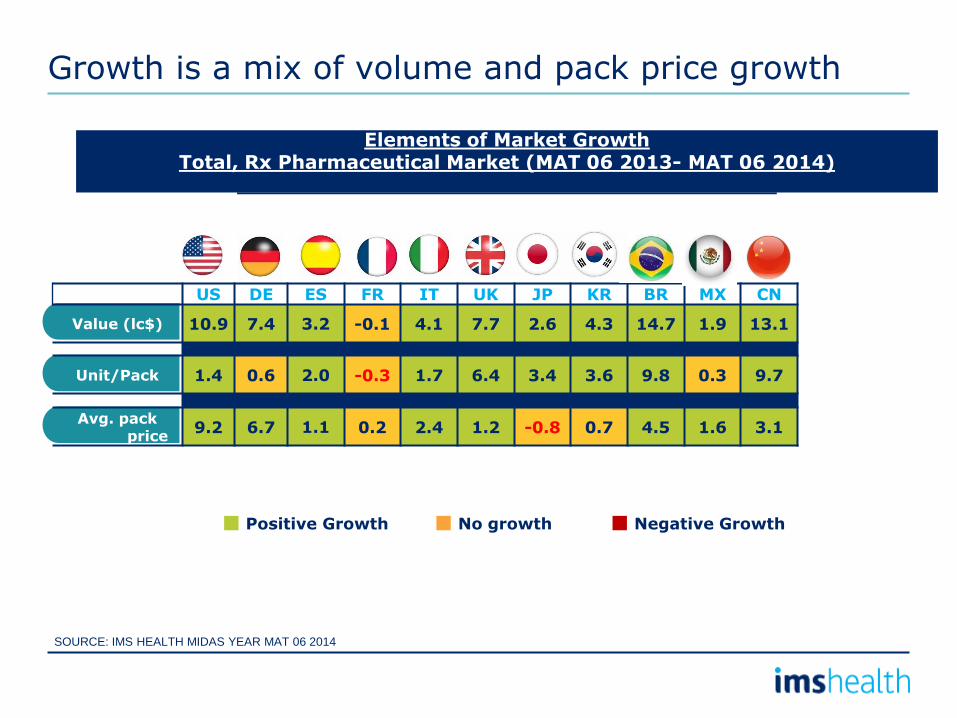
Growth is a mix of volume and pack price growth
Positive Growth No growth Negative Growth
Elements of Market Growth Total, Rx Pharmaceutical Market (MAT 06 2013- MAT 06 2014)
Priced at ex-mnf level before rebates and discounts
US DE ES FR IT UK JP KR BR MX CN
Value (lc$) 10.9 7.4 3.2 -0.1 4.1 7.7 2.6 4.3 14.7 1.9 13.1
Unit/Pack 1.4 0.6 2.0 -0.3 1.7 6.4 3.4 3.6 9.8 0.3 9.7
Avg. pack price
9.2 6.7 1.1 0.2 2.4 1.2 -0.8 0.7 4.5 1.6 3.1
SOURCE: IMS HEALTH MIDAS YEAR MAT 06 2014

Pharmaceutical market trending remains relatively unchanged
• Mature markets show low growth, continuing cost containment 1
• Pharmerging markets exhibiting higher growth but with key market variations due to GDP growth challenges
3
• Still an increasingly generic world 5
• Biologics growth continues apace with payers embracing biosimilars ideology
6
• Europe still under pressure with hospital debt and further austerity measures
2
• Consolidation within the industry continues but strategy and acquisition candidate profiles changing
4

Impact of the crisis: in half OECD-European countries, health spending was lower in 2012 than in 2009
Change in real total Health spending between 2009 and 2012(%)
-30.0%
-25.0%
-20.0%
-15.0%
-10.0%
-5.0%
0.0%
5.0%
10.0%
15.0%
Note: (1) current spending; (2) change between 2009 and 2011 Source: OECD Health data 2014

Increased health spending will be a major pressure on public budgets across all OECD countries
Source: OECD Economic Policy Paper n°06, 2013
0%
2%
4%
6%
8%
10%
12%
Average public spending 2006-2010 Increase of public spending 2010-2030
Increase of public spending 2030-2060 % GDP

Several drivers & constraints are forcing markets to re-examine current HC policies, leading to reforms
Key factors shaping healthcare and payer reforms
Uncertain picture
Reforms
Demographic/ Epidemiological
• Population
• Life-expectancy
• Disease burden
Socio-economic
• Literacy and awareness
• Affordability and willingness to pay
Funding
• Economic environment leading to financial constraints
Infrastructure
• Shortage of healthcare professionals
• Sub-optimal healthcare infrastructure

Demographic Development*
Ageing is associated with increasing health costs
System Impact: Severity, length and increased incidence
87mn
152mn +75%
65+ Years
16% 16% 15% 14% 14% 14%
67% 64% 62% 59% 57% 56%
20% 24% 27% 29% 30%
60
40
100
30
20
10
0
50
90
80
70
%
2060 2050 2040 2030 2020 2010
17%
0-14 Years 15-64 Years 65+ Years
Source: * European Commission (2012); † Hopkins University (2007); ∆ UK Dept. of Health (2010), European Commission; ♯ WHO (2013)
Increase in severity of Degenerative Diseases†
Extended impact of Chronic Diseases∆
Increased incidence
of Cancer♯
7.5
3.2
0
5
10
mn people +136%
2050 2006
19.116.4
0
10
20
years +16%
2030 2009
Life expectancy after T2 diabetes diagnosis
Late-stage Alzheimer’s Disease
3
2
1
0
mn cases +16%
2020
2.7
2010
2.3
New Cancer Incidences

Drivers of healthcare expenditure growth between 1995 and 2009 in OECD countries
But ageing is not the key driver of health spending growth
Healthcare expenditure growth (100%)
Demography (12%)
Age structure
Health by age
Income (42%)
Residual (46%)
Relative prices
Technology
Institutions and policies
Source: OECD Economic Policy Paper n°06, 2013

The target areas for expenditure control are well known among Finance Ministries
0 5 10 15 20
Outpatient care spending
Primary health care services
Spending on prevention programs
Long term care spending
Pharmaceutical costs
Hospital expenditure
Source: OECD Survey on Budget Practices and Procedures, 2013
Number of countries
Self-reported priorities for expenditure control, 22 OECD countries

The crisis has been used to slow growth in desirable areas, but has fallen short on prevention
4.8% 4.8%
5.9%
2.9%
6.9%
2.5%
3.2%
4.6%
6.2%
2.8%
6.4%
3.5%
0.7% 0.9%
5.3%
0.2%
-1.5%
-0.9%
1.0%
1.7% 1.6%
-1.7% -1.7%
1.7%
-3%
-2%
-1%
0%
1%
2%
3%
4%
5%
6%
7%
8%
Inpatient care Outpatient care Long-term care Pharmaceuticals Prevention Administration
2007/08 2008/09 2009/10 2010/11
Source: OECD Health Statistics 2013
Average annual growth rates of spending for selected functions, OECD average, in real terms

Generics are a Solution!
• Generics saved the US $239 billion in 2013
• 14% increase over 2012
• $1.5 Trillion in savings from 2014-2013

IMS Harbingers of Change in Healthcare
• Consumer Technology Companies are rushing to healthcare to transform patient engagement
• Governments are Unshackling Data to aid research and spark medical innovation
• US Clinicians are being encouraged to consider costs in clinical treatment decisions
• China has loosened the price caps of 530 low cost essential drugs
• Medicine spending growth is returning to developed countries
• Trans-Atlantic supply chain
• A wave of innovation in Hepatitis C drug development
• New breakthrough vaccines foreshadows a new era of improved public health
• The growing use of biologics is bringing new treatment options
• US Payment and delivery system changes are shifting the focus to outcomes and performance

Agenda
• Major trends and Global Medicines Spend
• Specialty medicines
• Generic medicines and purchasing alliances
• Conclusions
0%
2%
4%
6%
8%
10%
12%
-
50
100
150
200
250
2008 2009 2010 2011 2012 2013 2014
Gro
wth
, LC
US
$
Sale
s,
US
$ b
illio
ns
Specialty sales Specialty Growth
Total Pharma growth
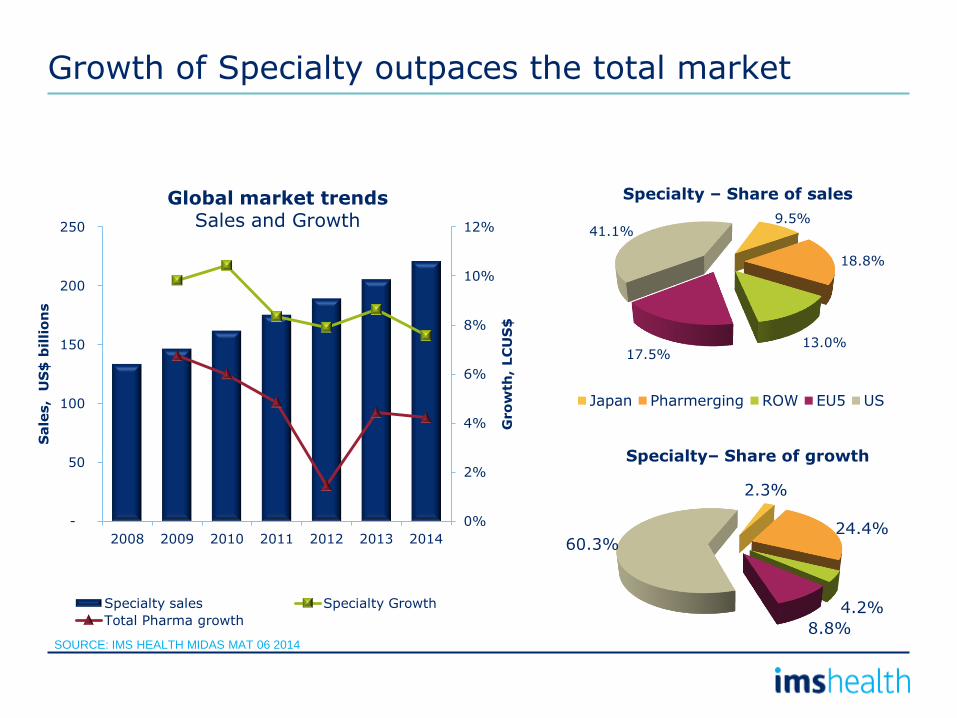
Growth of Specialty outpaces the total market
9.5%
18.8%
13.0% 17.5%
41.1%
Japan Pharmerging ROW EU5 US
2.3%
24.4%
4.2%
8.8%
60.3%
Specialty – Share of sales
Specialty– Share of growth
Global market trends Sales and Growth
SOURCE: IMS HEALTH MIDAS MAT 06 2014

Specialty products are outperforming traditional ones
0%
20%
40%
60%
80%
100%
US GER SPA FRA ITA UK JP KR BR (R) MX (R) CN
Valu
e m
arket
sh
are
Specialty versus traditional medicine market value dynamics (2013 value market share vs. 10 year value growth (2005- MAT 06 2014)
Retail Hospital
Specialty
Retail Hospital
Traditional
SOURCE: IMS HEALTH MIDAS YEAR 2013, Only retail data is available for NL, NL Growth rate = CAGR 2009 -MAT 06 2014, PT growth rate = CAGR 2010-
MAT 06 2014
10 yr value CAGR %
Traditional Specialty
4% 13%
1% 8%
-1% 6%
2% 9%
1% 14%
0% 10%
21% 21%
2% 6%
3% 7%
14% 15%
7% 13%
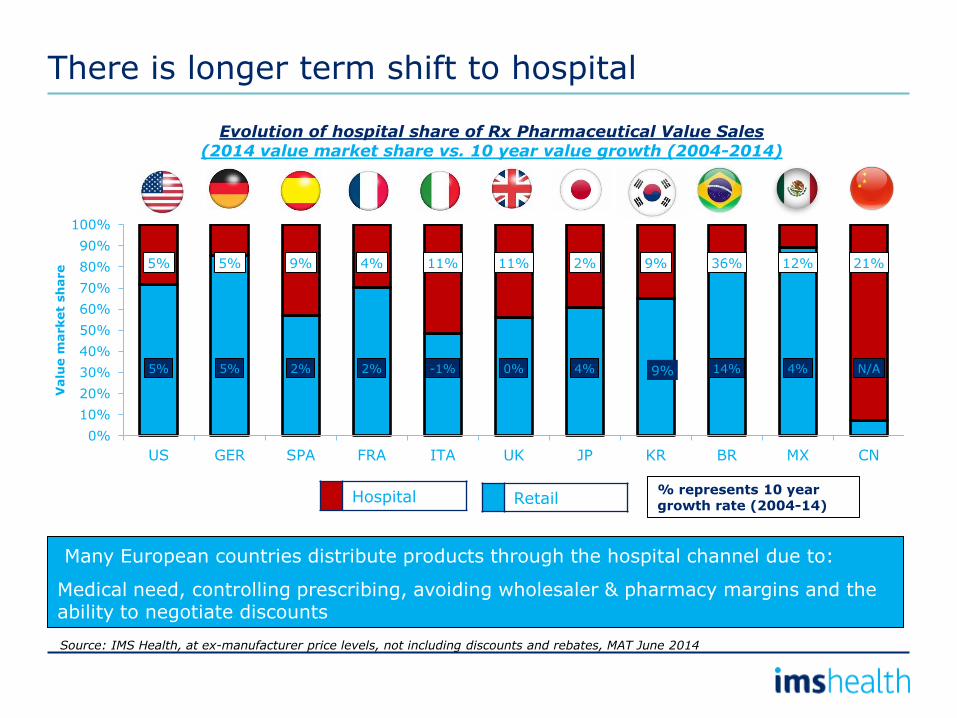
There is longer term shift to hospital
9%
5% 5% 9% 4% 11% 11% 2% 9% 36% 12% 21%
5% 5% 2% 2% -1% 0% 4% 14% 4% N/A
0%
10%
20%
30%
40%
50%
60%
70%
80%
90%
100%
US GER SPA FRA ITA UK JP KR BR MX CN
Valu
e m
arket
sh
are
Evolution of hospital share of Rx Pharmaceutical Value Sales (2014 value market share vs. 10 year value growth (2004-2014)
Many European countries distribute products through the hospital channel due to:
Medical need, controlling prescribing, avoiding wholesaler & pharmacy margins and the ability to negotiate discounts
Hospital Retail % represents 10 year growth rate (2004-14)
Source: IMS Health, at ex-manufacturer price levels, not including discounts and rebates, MAT June 2014

Few prescribers/ centers
Low inventory important
Processing of pre-approval essential and competitive skill
Requires patient training to administer
Support to achieve adherence needed
Cold chain when needed
No need for supplying all pharmacies through all warehouses
IMS Health definition of Specialty Products
• Initiated only by a specialist
• High expense
• Requires reimbursement assistance
• Generally not oral
• Warrants intensive patient counseling
• Require special handling
• Unique distribution
Medicines that treat specific, complex chronic diseases with the min 4 of the 7 following attributes:

Top 10 Specialty Therapeutic Areas globally
0 10 20 30 40 50 60 70 80
OCULAR
ANTINEOVASCULARISATION
BLOOD COAGULATION
IMMUNOSUPPRENETS
ERYTHROPOIETINS
GROWTH FACTORS
VIRAL HEPATITIS
MULTIPLE SCLEROSIS
HIV ANTIVIRALS
AUTOIMMUNE DISEASES
ONCOLOGICS
US$ Billions
Top specialty TAs by value MAT 06 2014
CAGR 2005-14
11%
16%
11%
14%
15%
6%
-4%
6%
8%
29%
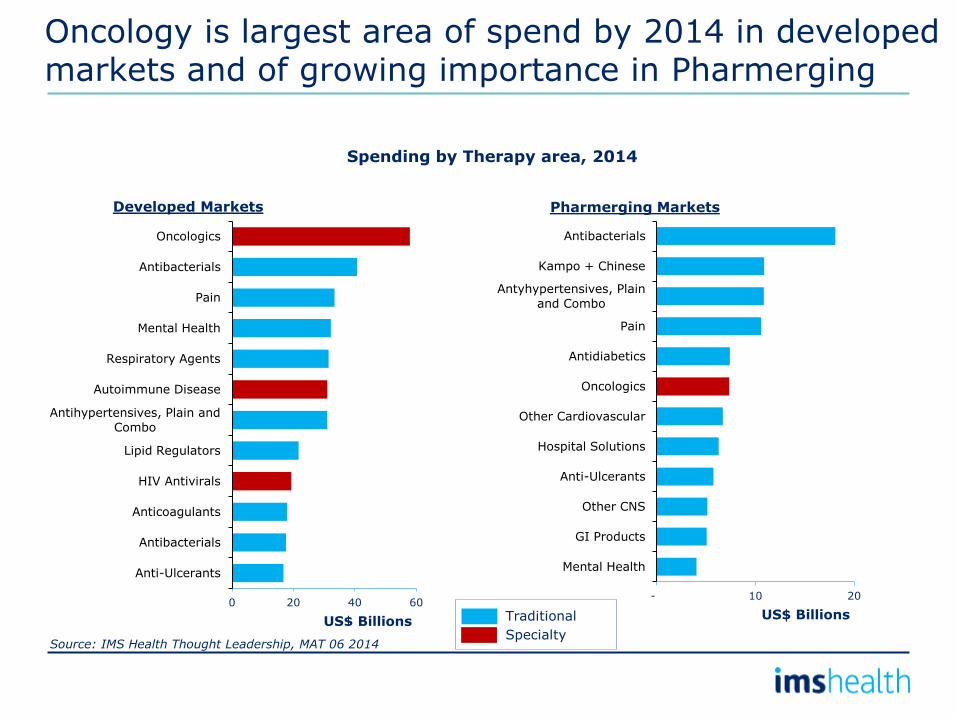
Oncology is largest area of spend by 2014 in developed markets and of growing importance in Pharmerging
0 20 40 60
Anti-Ulcerants
Antibacterials
Anticoagulants
HIV Antivirals
Lipid Regulators
Antihypertensives, Plain and
Combo
Autoimmune Disease
Respiratory Agents
Mental Health
Pain
Antibacterials
Oncologics
US$ Billions
Spending by Therapy area, 2014
Source: IMS Health Thought Leadership, MAT 06 2014
- 10 20
Mental Health
GI Products
Other CNS
Anti-Ulcerants
Hospital Solutions
Other Cardiovascular
Oncologics
Antidiabetics
Pain
Antyhypertensives, Plain
and Combo
Kampo + Chinese
Antibacterials
US$ Billions
Pharmerging Markets
Traditional
Specialty
Developed Markets

2020 for oncology forecast is $120 billion
14%
10%
28%
44%
3%
11%
25%
14%
10% 39%
ROW US
EU5 Pharmerging
Japan
Oncology Global Split
2003: $20bn
2013: $69bn
Source: IMS Health, MIDAS, MAT Dec 2013. Oncology (L1&L2&V3C&Revlimid&Xgeva&Proleukin&Pomalyst),Rx bound
34%
16%
12%
23%
15%
2020: $120-130bn
50% in USA and Japan

Europe and US illustrate growing importance of specialty therapies
For generics, LoEs have shifted the focus from small molecules to biologics
2010 2011 2012 2013 2014*
1 LIPITOR HUMIRA HUMIRA HUMIRA HUMIRA
2 SERETIDE SERETIDE SERETIDE ENBREL MABTHERA
3 HUMIRA LIPITOR ENBREL SERETIDE ENBREL
4 ENBREL ENBREL HERCEPTIN HERCEPTIN HERCEPTIN
5 HERCEPTIN HERCEPTIN LOVENOX REMICADE SERETIDE
6 AVASTIN LOVENOX MABTHERA AVASTIN REMICADE
7 LOVENOX REMICADE REMICADE MABTHERA AVASTIN
8 ZYPREXA MABTHERA AVASTIN LOVENOX LOVENOX
9 MABTHERA AVASTIN SPIRIVA LUCENTIS LYRICA
10 REMICADE SPIRIVA LYRICA LYRICA LUCENTIS
Europe Top 10 products 2010-14
Small molecule
Source: IMS Health, MIDAS, MAT Jun 2014. Europe doesn’t include Turkey and Russia; 2014= Q1 and Q2 2014
US Top 10 products 2010-14
2010 2011 2012 2013 2014*
1 LIPITOR LIPITOR NEXIUM ABILIFY SOVALDI
2 NEXIUM PLAVIX ABILIFY NEXIUM ABILIFY
3 PLAVIX NEXIUM SERETIDE LANTUS LANTUS
4 SEROQUEL SEROQUEL CRESTOR SERETIDE HUMIRA
5 SERETIDE ABILIFY CYMBALTA HUMIRA NEXIUM
6 ABILIFY SERETIDE HUMIRA CRESTOR CRESTOR
7 SINGULAIR SINGULAIR LANTUS CYMBALTA SERETIDE
8 CRESTOR CRESTOR ENBREL ENBREL ENBREL
9 ACTOS CYMBALTA REMICADE REMICADE REMICADE
10 ENBREL ENBREL COPAXONE COPAXONE NEULASTA
Specialty

Top products vary in Developed and Pharmerging markets
Small molecule
Source: IMS Health, MIDAS, MAT Jun 2014
Specialty
Top products 2014
KR JP BR MX CN
1 BARACLUDE PLAVIX HERCEPTIN HERCEPTIN XUE SHUAN
TONG
2 LIPITOR BLOPRESS HUMIRA CELEBREX SHEN JIE
3 HERCEPTIN CRESTOR SILDENAFILA HUMIRA SODIUM
CHLORIDE
4 CRESTOR AVASTIN TORSILAX CIALIS ADEGOLD
5 PREVNAR BENICAR LOVENOX AVASTIN PLAVIX
6 TWYNSTA REMICADE POLIO
VACINE LYRICA BEI TONG
7 EXFORGE SECTOR PNEUMOC
VACINE DOLO
NEUROBION
SOD CHLORIDE
KELU
8 PROGRAF JANUVIA LOSARTAN
HYPM NEXIUM
SHU XUE NING
9 GLIVEC DIOVAN CIALIS SERETIDE LIPITOR
10 CELEBREX ARICEPT LANTUS LANTUS DANSHEN
DUOFENSUAN
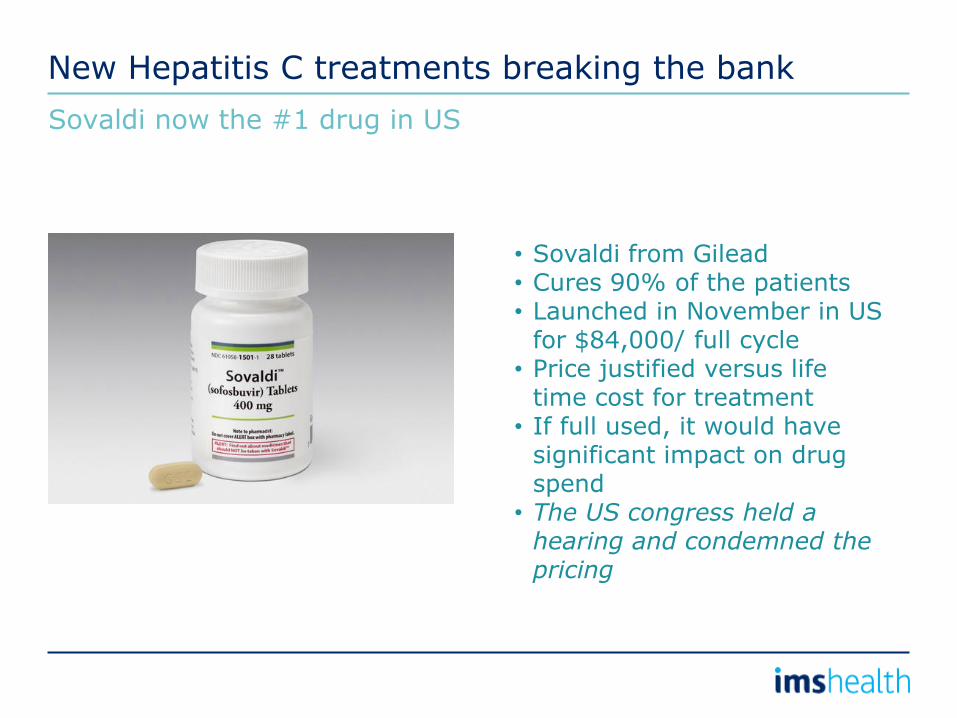
New Hepatitis C treatments breaking the bank
Sovaldi now the #1 drug in US
• Sovaldi from Gilead • Cures 90% of the patients • Launched in November in US
for $84,000/ full cycle • Price justified versus life
time cost for treatment • If full used, it would have
significant impact on drug spend
• The US congress held a hearing and condemned the pricing
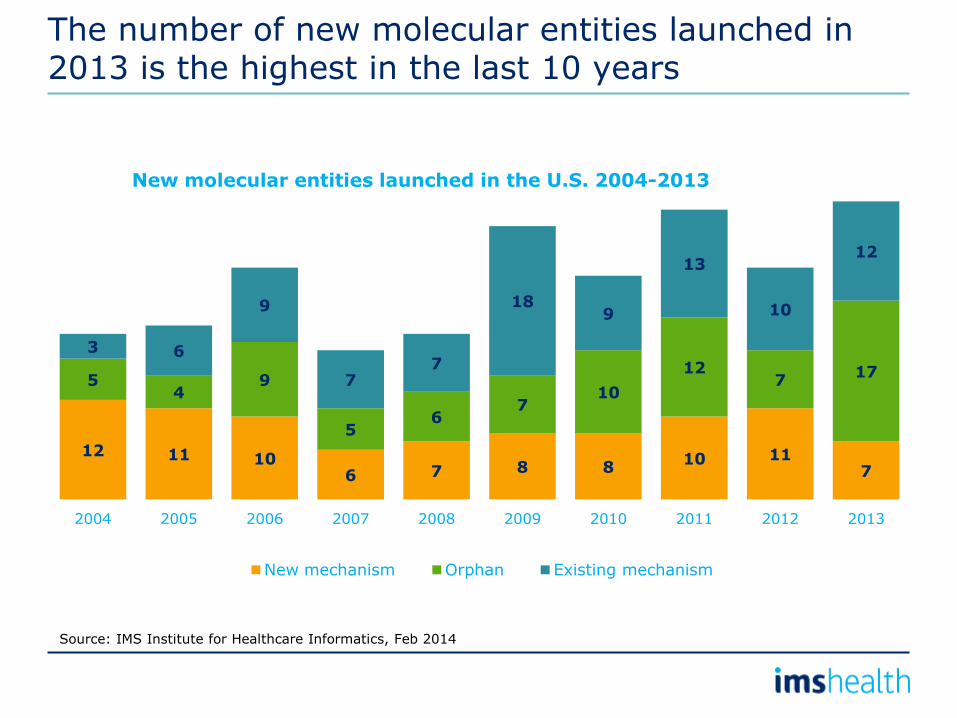
The number of new molecular entities launched in 2013 is the highest in the last 10 years
New molecular entities launched in the U.S. 2004-2013
12 11 10 6 7 8 8
10 11 7
5 4
9
5 6
7 10
12 7
17
3 6
9
7 7
18 9
13
10
12
2004 2005 2006 2007 2008 2009 2010 2011 2012 2013
New mechanism Orphan Existing mechanism
Source: IMS Institute for Healthcare Informatics, Feb 2014

In a specialist world, more innovation is from smaller corporations
Big pharma continues to take the lead on commercialisation
FDA new drugs approval: development focus by origin of patent
Source: FDA Website. IMS Analysis based on best possible disclosed information. Large pharma defined as Top11-25 corps with revenues >$5bn; Medium corps $500mn+; Small corps less than $500mn; Others include university, hospitals and other companies.
100%
90%
80%
70%
60%
50%
40%
30%
20%
10%
0%
2013
70%
30%
2003
71%
29%
Acquired Fully developed in house
Source of innovation by corporation type (patent originator)
100%
90%
80%
70%
60%
50%
40%
30%
20%
10%
0%
2013
13%
17%
57%
3%
10%
2003
21%
14%
39%
14%
11%
Others
Medium corps
Small corps
Top 10
Large pharma

A number of big value biologics are set to lose patent protection in the next few years
All these products will lose patent protection by 2020, except Enbrel (US patent extended until 2028)
Not considered existing biosimilars such as Epoetin Alfa expired in EU, but still patent protected in the US
Source: IMS MIDAS, 06/2014, IMS Patent focus
EU expiry date US expiry date
2018 2016
2015 2028 (extended)
2013/15 2018
2014 2015
Expired 2018
2019 2019
Expired Expired
2015 2016
2014 2019
2017 2014
2015 2015
2016 2016
Global Sales (MAT 06/2014), US$ billion
Total ~ US$ 78
billion
- 5,000 10,000
INSULIN ASPART (Novomix, Novorapid)
RANIBIZUMAB (Lucentis)
PEGFILGRASTIM (Neulasta)
GLATIRAMER ACETATE (Copaxone)
TRASTUZUMAB (Herceptin)
INTERFERON BETA-1A (Avonex, Rebif)
BEVACIZUMAB (Avastin)
RITUXIMAB (Mabthera)
INFLIXIMAB (Remicade)
ETANERCEPT (Enbrel)
INSULIN GLARGINE (Lantus)
ADALIMUMAB (Humira)
US$ Millions
Japan Pharmerging ROW Top 5 Europe US
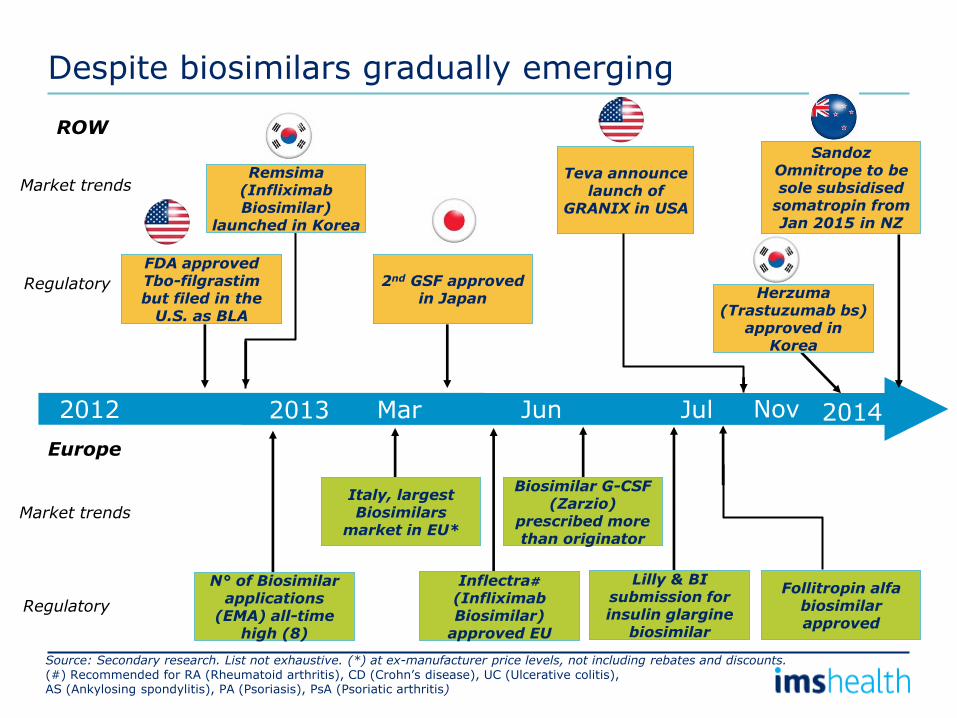
Despite biosimilars gradually emerging
2012
ROW
Europe
2013
Italy, largest Biosimilars
market in EU*
Mar Jun
Biosimilar G-CSF (Zarzio)
prescribed more than originator
N° of Biosimilar applications
(EMA) all-time high (8)
Lilly & BI submission for insulin glargine
biosimilar
Market trends
Regulatory
2nd GSF approved in Japan
Inflectra# (Infliximab Biosimilar)
approved EU
2014
Market trends
Regulatory
Source: Secondary research. List not exhaustive. (*) at ex-manufacturer price levels, not including rebates and discounts. (#) Recommended for RA (Rheumatoid arthritis), CD (Crohn’s disease), UC (Ulcerative colitis), AS (Ankylosing spondylitis), PA (Psoriasis), PsA (Psoriatic arthritis)
Follitropin alfa biosimilar approved
Jul
FDA approved Tbo-filgrastim but filed in the
U.S. as BLA
Remsima (Infliximab Biosimilar)
launched in Korea
Teva announce launch of
GRANIX in USA
Nov
Sandoz Omnitrope to be sole subsidised
somatropin from Jan 2015 in NZ
Herzuma (Trastuzumab bs)
approved in Korea

In Europe, biosimilar uptake exhibits different paces
A few countries have reached or approached the maturity stage
-10%
0%
10%
20%
30%
40%
50%
60%
70%
80%
Mar-07 Dec-07 Jun-08 Dec-08 Jun-09 Dec-09 Jun-10 Dec-10 Jun-11 Dec-11 Jun-12 Dec-12 Jun-13 Dec-13
% U
pta
ke,
SU
Biosimilar uptake across Europe MAT 03/2007 – 12/2013 (Volumes, SU)
AUSTRIA BELGIUM FRANCE GERMANY HUNGARY
ITALY ROMANIA SPAIN SWEDEN UK
Total 10 countries 425M €
MAT 12/2013 Fast uptake at launch, now mature
Consistent uptake
Slow uptake, cultural resistance
Fast growing due to faster growing market trend
Payers incentivized Biosimilars
Source: IMS MIDAS, MAT Sep 2013
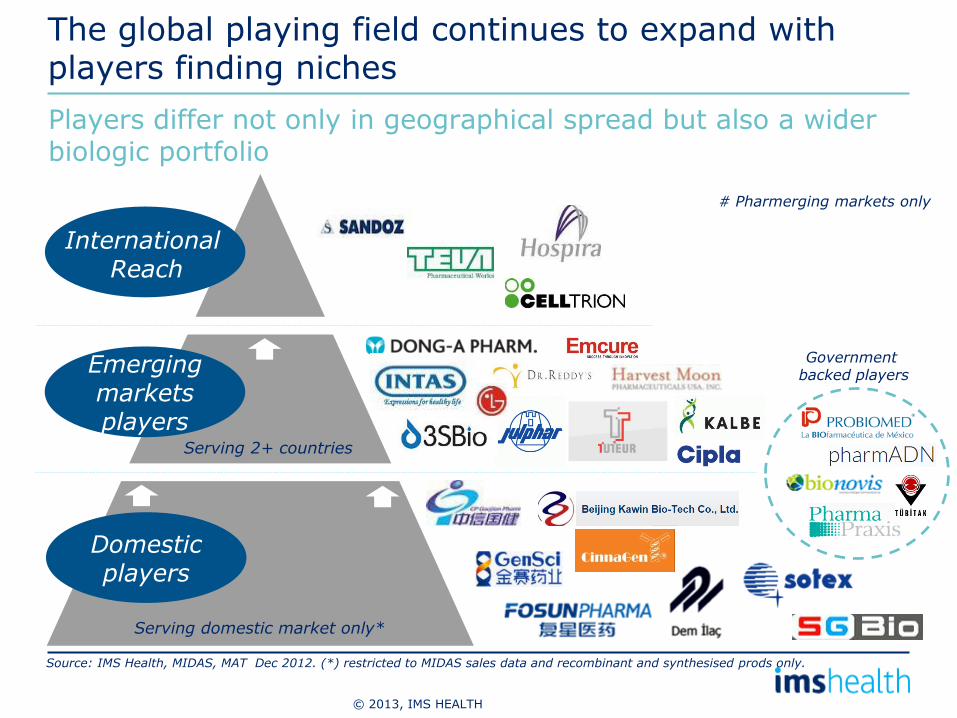
The global playing field continues to expand with players finding niches
Players differ not only in geographical spread but also a wider biologic portfolio
Emerging markets players
Domestic players
Serving domestic market only*
Serving 2+ countries
# Pharmerging markets only
Source: IMS Health, MIDAS, MAT Dec 2012. (*) restricted to MIDAS sales data and recombinant and synthesised prods only.
© 2013, IMS HEALTH
International Reach
Government backed players

Fastest growing corporations are focused on specialty
Top Globally Top Specialty Top Generics
Rank Corp US$bn 2014
CAGR 2005-14
1 ROCHE 29.0 10%
2 AMGEN 18.3 4%
3 NOVARTIS 18.0 13%
4 JOHNSON & JOHNSON
16.8 11%
5 GILEAD SCIENCES
15.7 29%
6 ABBVIE 13.3 16%
7 PFIZER 8.4 6%
8 BRISTOL-MYERS SQB.
7.2 10%
9 TEVA 6.6 16%
10 MERCK & CO 6.5 8%
Rank Corp US$bn 2014
CAGR 2005-14
1
NOVARTIS
48.0 6%
2
PFIZER
42.7 -4%
3
SANOFI 35.9 1%
4
MERCK & CO 35.3 1%
5 ROCHE 35.0 7%
6 ASTRAZENECA 31,4 3%
7 GSK 30.3 -1%
8 JOHNSON & JOHNSON
28.4 3%
9 TEVA 24.1 7%
10 LILLY 21.5 5%
Rank Corp US$bn 2014
CAGR 2005-14
1 TEVA 13.7 6%
2 NOVARTIS 11.2 -4%
3 MYLAN 9.9 1%
4 ACTAVIS 8.2 1%
5 SANOFI 5.0 7%
6 PFIZER 3.3 -1%
7 APOTEX 2.5 3%
8 PAR PHARM
2.2 7%
9 EMS 2.1 5%
10 STADA 2.1 8%

Recent large M&A activity is high though even by historic levels
Buyer Target Announced Close Type Value Stated Intent
Apr ‘14 - Takeover $116B Oncology pipeline, UK move could taxes
Apr ‘14 - Takeover $49B Become top 5 pharma by 2016
Feb ’14 Mid
2014 Acquisition $25B
Become fastest growing specialty pharma company
Apr ‘14 H1 2015 Swap $14.5B Novartis establish global Oncology leadership position
Apr ‘14 H1 2015 Swap $7.1B GSK Increase scale and quality in Flu Vaccines
Apr ‘14 H1 2015 JV $10.0B Add scale, reduce costs
Apr ‘14 Q1 2015 Swap $5.4B Lilly consolidating in Animal Health
Apr ‘14 - Acquisition $4.0B Complimentary platform in growth markets
Apr ‘14 - Divestiture $7.0B Looking to sell mature drugs portfolio
May ‘14 H2 2014 Acquisition $14.2B Consolidate Global Leadership in OTC
Rejected
Agenda
• Major trends and Global Medicines Spend
• Specialty medicines
• Generic medicines and purchasing alliances
• Conclusions
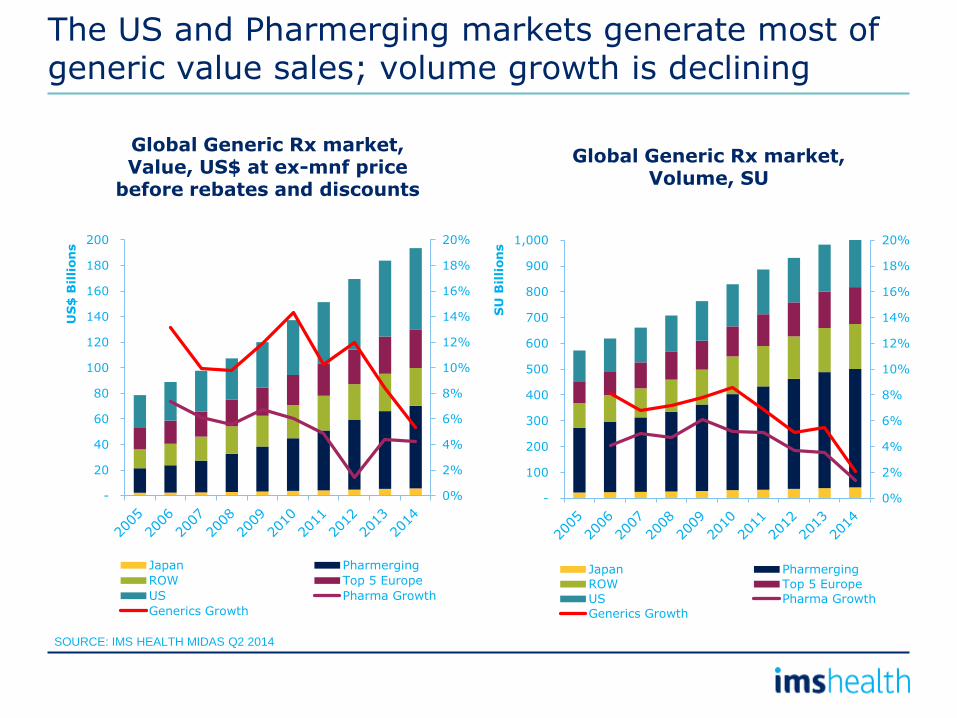
Global Generic Rx market, Value, US$ at ex-mnf price
before rebates and discounts
The US and Pharmerging markets generate most of generic value sales; volume growth is declining
SOURCE: IMS HEALTH MIDAS Q2 2014
0%
2%
4%
6%
8%
10%
12%
14%
16%
18%
20%
-
20
40
60
80
100
120
140
160
180
200
US
$ B
illi
on
s
Japan Pharmerging
ROW Top 5 Europe
US Pharma Growth
Generics Growth
Global Generic Rx market, Volume, SU
0%
2%
4%
6%
8%
10%
12%
14%
16%
18%
20%
-
100
200
300
400
500
600
700
800
900
1,000
SU
Bil
lion
s
Japan Pharmerging
ROW Top 5 Europe
US Pharma Growth
Generics Growth
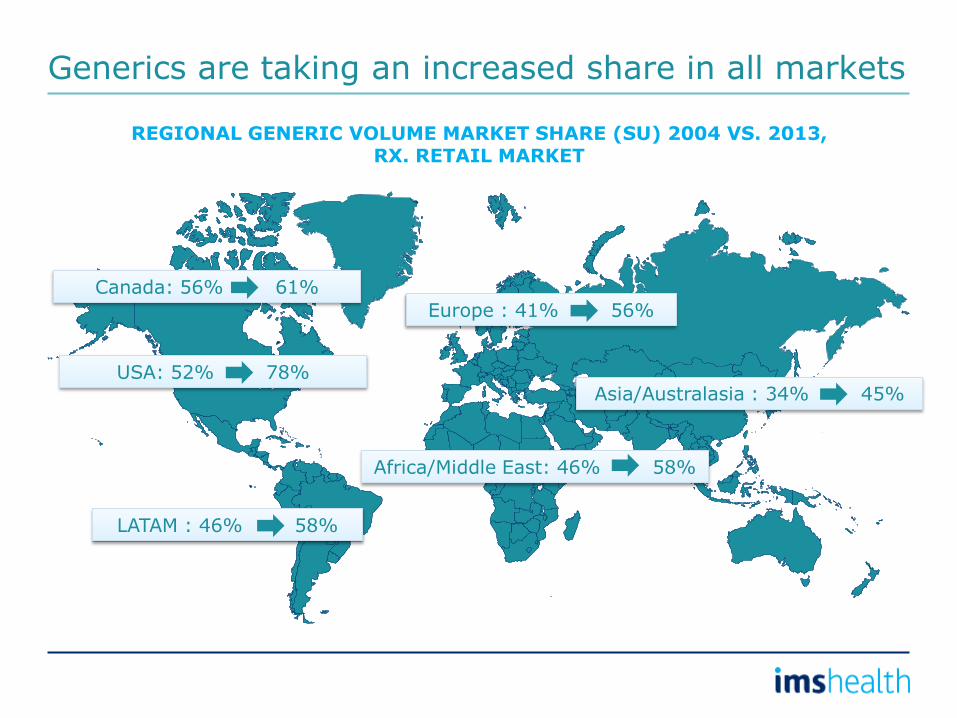
Generics are taking an increased share in all markets
REGIONAL GENERIC VOLUME MARKET SHARE (SU) 2004 VS. 2013, RX. RETAIL MARKET
LATAM : 46% 58%
USA: 52% 78%
Africa/Middle East: 46% 58%
Asia/Australasia : 34% 45%
Europe : 41% 56%
Canada: 56% 61%

Protected sales will decline in the Mature Eight to 2016
Source: IMS Health Market Prognosis, March 2014, Audited data only
350
300
250
200
150
100
50
0
Valu
e S
ale
s,
LC$bn
2018 2017 2016 2015 2014 2013 2012 2011 2010 2009 2008
2008 - 2018 Value Sales of Protected Brands, Mature eight
Forecasted numbers
2014-2018 Protected brands CAGR (-2)-1%
2009-2013 Protected brands
CAGR 0.6%
Mature Eight

Based on constant dollar forecasts, protected brands growth will slow and share decline
Generics to dominate growth
2009: 539 Bn 2013: 588 Bn
5 Yr CAGR
Region 2009 -2013 2014-2018
Top 8 Mature 3% 2 - 5%
Protected (Non-Generic) 1% (-2) – 1%
Generics 11% 9 – 12%
Unprotected (Non-Generic) 5% 4 – 7%
2018: 676 – 696 Bn
12% 12%
15%
60% 55%
17% 12%
16%
12%
18%
46%
24%
Source: IMS Health Market Prognosis, March 2014 (*) at ex-manufacturer price levels, not including rebates and discounts. Audited data only. Market size represented in constant US$. All CAGR calculations are 5 years
Protected (Non-generic) Generics Other Unprotected (Non-generic)
Top 8 Mature
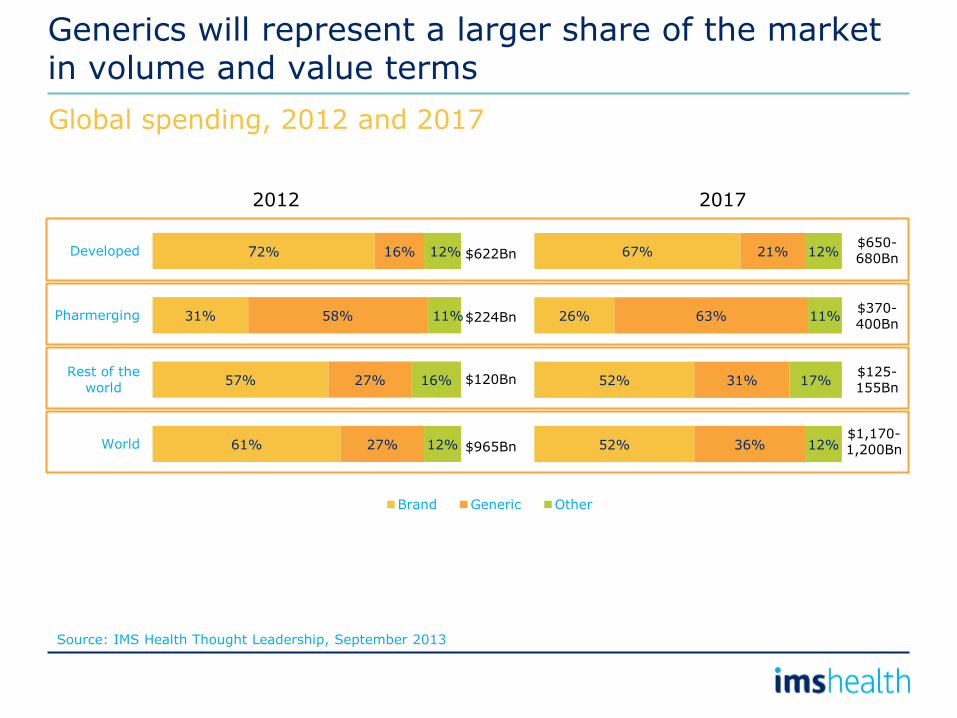
61%
57%
31%
72%
27%
27%
58%
16%
12%
16%
11%
12%
World
Rest of the
world
Pharmerging
Developed
Brand Generic Other
Generics will represent a larger share of the market in volume and value terms
Global spending, 2012 and 2017
2012
52%
52%
26%
67%
36%
31%
63%
21%
12%
17%
11%
12%
2017
$622Bn $650-680Bn
$224Bn $370-400Bn
$120Bn $125-155Bn
$965Bn $1,170-1,200Bn
Source: IMS Health Thought Leadership, September 2013
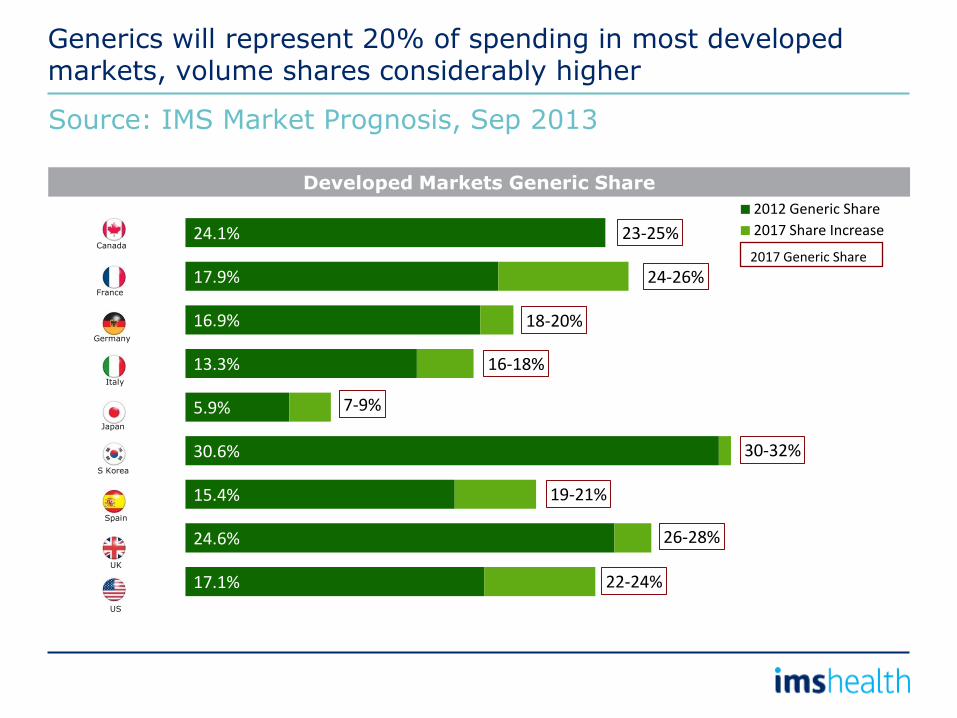
17.1%
24.6%
15.4%
30.6%
5.9%
13.3%
16.9%
17.9%
24.1%
22-24%
26-28%
19-21%
30-32%
7-9%
16-18%
18-20%
24-26%
23-25%
2012 Generic Share
2017 Share Increase
2017 Generic Share
Developed Markets Generic Share
Canada
France
Germany
Italy
Japan
S Korea
Spain
UK
US
Generics will represent 20% of spending in most developed markets, volume shares considerably higher
Source: IMS Market Prognosis, Sep 2013

Price decreases in traditional areas are off-set by volume increases
Evolution of therapy volume, price of treatment and overall treatment cost in 7 therapy areas, Rx retail market from Q1 2004-Q4 2013,
Normalized to population growth
0.0
0.5
1.0
1.5
2.0
2.5
Q3 2
003
Q4 2
003
Q1 2
004
Q2 2
004
Q3 2
004
Q4 2
004
Q1 2
005
Q2 2
005
Q3 2
005
Q4 2
005
Q1 2
006
Q2 2
006
Q3 2
006
Q4 2
006
Q1 2
007
Q2 2
007
Q3 2
007
Q4 2
007
Q1 2
008
Q2 2
008
Q3 2
008
Q4 2
008
Q1 2
009
Q2 2
009
Q3 2
009
Q4 2
009
Q1 2
010
Q2 2
010
Q3 2
010
Q4 2
010
Q1 2
011
Q2 2
011
Q3 2
011
Q4 2
011
Q1 2
012
Q2 2
012
Q3 2
012
Q4 2
012
Q1 2
013
Q2 2
013
Q3 2
013
IN
DE
X
VOLUME WEIGHTED PRICE/TD NUMBER OF TREATMENT DAYS/CAPITA COST OF TREATMENT INDEX
SOURCE: IMS HEALTH MIDAS YEAR MAT 09 2013. SELECTED THERAPY AREAS ANGIOTENSIN II ANTAGNOISTS, ANTI-EPILEPTICS, ANTI-
PSYCHOTICS, ANTI-ULCERANTS, CHOLESTEROL REGULATORS AND ORAL ANTI-DIABETICS. POPULATION STATISTICS: OECD
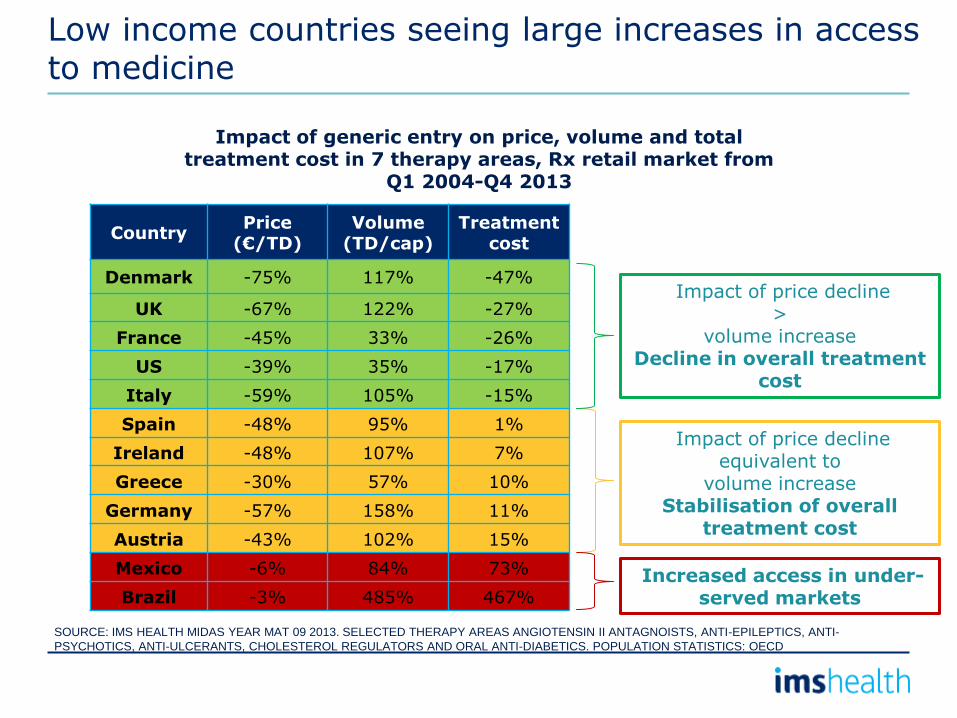
Low income countries seeing large increases in access to medicine
Country Price
(€/TD) Volume
(TD/cap) Treatment
cost
Denmark -75% 117% -47%
UK -67% 122% -27%
France -45% 33% -26%
US -39% 35% -17%
Italy -59% 105% -15%
Spain -48% 95% 1%
Ireland -48% 107% 7%
Greece -30% 57% 10%
Germany -57% 158% 11%
Austria -43% 102% 15%
Mexico -6% 84% 73%
Brazil -3% 485% 467%
Impact of generic entry on price, volume and total treatment cost in 7 therapy areas, Rx retail market from
Q1 2004-Q4 2013
SOURCE: IMS HEALTH MIDAS YEAR MAT 09 2013. SELECTED THERAPY AREAS ANGIOTENSIN II ANTAGNOISTS, ANTI-EPILEPTICS, ANTI-
PSYCHOTICS, ANTI-ULCERANTS, CHOLESTEROL REGULATORS AND ORAL ANTI-DIABETICS. POPULATION STATISTICS: OECD
Impact of price decline >
volume increase Decline in overall treatment
cost
Impact of price decline equivalent to
volume increase Stabilisation of overall
treatment cost
Increased access in under-served markets
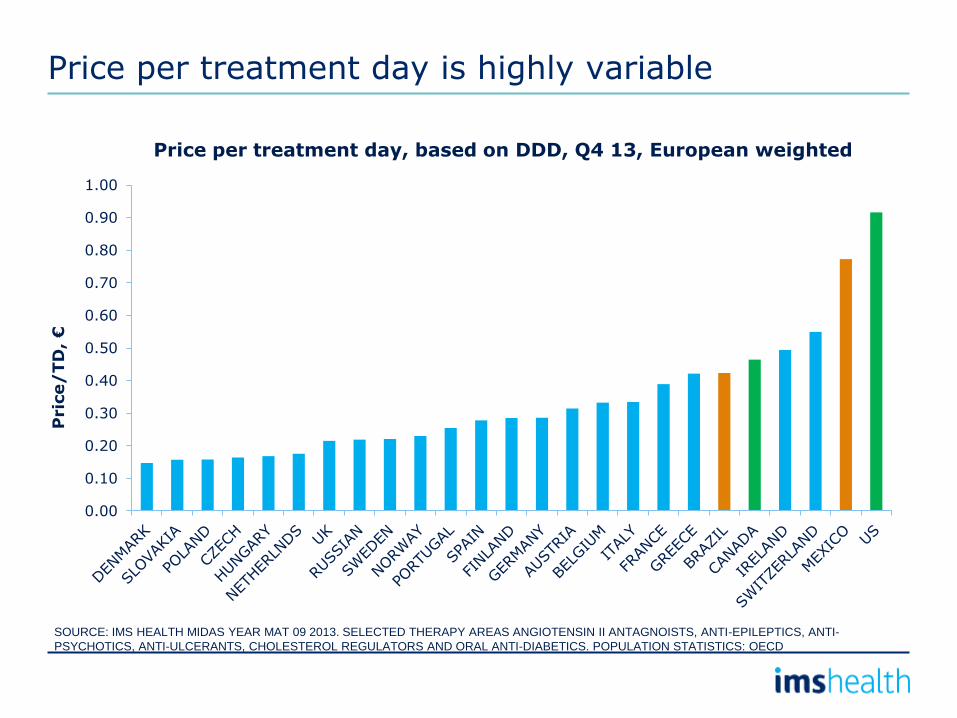
Price per treatment day is highly variable
0.00
0.10
0.20
0.30
0.40
0.50
0.60
0.70
0.80
0.90
1.00
Pric
e/
TD
, €
SOURCE: IMS HEALTH MIDAS YEAR MAT 09 2013. SELECTED THERAPY AREAS ANGIOTENSIN II ANTAGNOISTS, ANTI-EPILEPTICS, ANTI-
PSYCHOTICS, ANTI-ULCERANTS, CHOLESTEROL REGULATORS AND ORAL ANTI-DIABETICS. POPULATION STATISTICS: OECD
Price per treatment day, based on DDD, Q4 13, European weighted
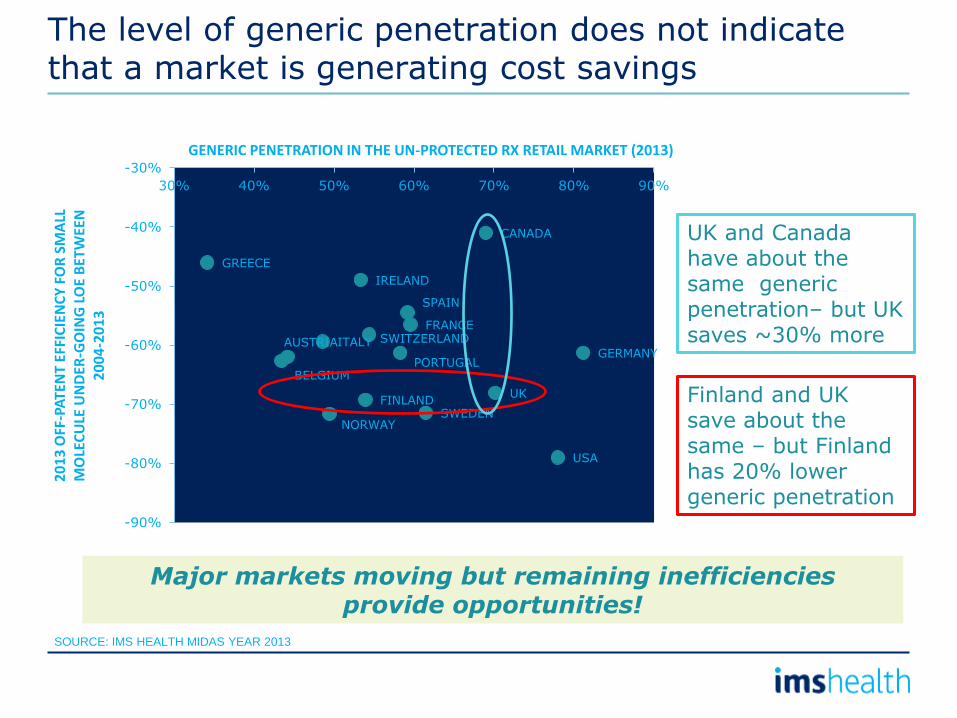
The level of generic penetration does not indicate that a market is generating cost savings
NORWAY SWEDEN
FINLAND UK
BELGIUM
AUSTRIA GERMANY
PORTUGAL
ITALY SWITZERLAND FRANCE
SPAIN
IRELAND
GREECE
USA
CANADA
-90%
-80%
-70%
-60%
-50%
-40%
-30%
30% 40% 50% 60% 70% 80% 90%
20
13
OFF
-PA
TEN
T EF
FIC
IEN
CY
FO
R S
MA
LL
MO
LEC
ULE
UN
DER
-GO
ING
LO
E B
ETW
EEN
2
00
4-2
01
3
GENERIC PENETRATION IN THE UN-PROTECTED RX RETAIL MARKET (2013)
SOURCE: IMS HEALTH MIDAS YEAR 2013
Finland and UK save about the same – but Finland has 20% lower generic penetration
UK and Canada have about the same generic penetration– but UK saves ~30% more
Major markets moving but remaining inefficiencies provide opportunities!

Product mix is a result of payer actions and manufacturer responses in a given market
Volume dynamics (SU) of products in the Statin market
SOURCE: IMS HEALTH MIDAS YEAR 2013
0%
10%
20%
30%
40%
50%
60%
70%
80%
90%
100%
Q4 2000
Q1 2001
Q2 2001
Q3 2001
Q4 2001
Q1 2002
Q2 2002
Q3 2002
Q4 2002
Q1 2003
Q2 2003
Q3 2003
Q4 2003
Q1 2004
Q2 2004
Q3 2004
Q4 2004
Q1 2005
Q2 2005
Q3 2005
Q4 2005
Q1 2006
Q2 2006
Q3 2006
Q4 2006
Q1 2007
Q2 2007
Q3 2007
Q4 2007
Q1 2008
Q2 2008
Q3 2008
Q4 2008
Q1 2009
Q2 2009
Q3 2009
Q4 2009
Q1 2010
Q2 2010
Q3 2010
Q4 2010
Q1 2011
Q2 2011
Q3 2011
Q4 2011
Q1 2012
Q2 2012
Q3 2012
Volum
e m
arket share
Volume dynamics of products in the Irish C10A1 market
LIPITOR(atorvastatin)
CRESTOR(rosuvastatin)
PRAVACHOL(pravastatin)
ZOCOR(simvastatin)
GENERIC PRAVASTATIN
GENERICATORVASTATIN
GENERICSIMVASTATIN
LESCOL (fluvastatin)
LIPOBAY(cerviastatin)
GENERICROSUVASTATIN
0%
10%
20%
30%
40%
50%
60%
70%
80%
90%
100%
Q4 2000
Q1 2001
Q2 2001
Q3 2001
Q4 2001
Q1 2002
Q2 2002
Q3 2002
Q4 2002
Q1 2003
Q2 2003
Q3 2003
Q4 2003
Q1 2004
Q2 2004
Q3 2004
Q4 2004
Q1 2005
Q2 2005
Q3 2005
Q4 2005
Q1 2006
Q2 2006
Q3 2006
Q4 2006
Q1 2007
Q2 2007
Q3 2007
Q4 2007
Q1 2008
Q2 2008
Q3 2008
Q4 2008
Q1 2009
Q2 2009
Q3 2009
Q4 2009
Q1 2010
Q2 2010
Q3 2010
Q4 2010
Q1 2011
Q2 2011
Q3 2011
Q4 2011
Q1 2012
Q2 2012
Q3 2012
Volum
e m
arket share
Volume dynamics of products in the UK C10A1 market
INTRODUCTION OF CATEGORY M
LIPITOR(atorvastatin)
CRESTOR
PRAVACHOL(pravastatin)
ZOCOR(simvastatin)
GENERIC PRAVASTATIN
GENERICATORVASTATIN
GENERICSIMVASTATIN
LESCOL (fluvastatin)
LIPOBAY(cerviastatin)

All markets are potentially addressable – the issue is business model and profitability
• What is current addressable market?
• What changes are required to expand the addressable market?
• Who retains the “margin” – wholesaler or pharmacy?
• What will happen with generic prices and industry over time?
• How will generic manufacturers play with a consolidating supply chain?
Wh
o s
ele
cts
th
e m
an
ufa
ctu
rer?
Patient
Pre
scriber
Pharm
acy
/WH
S
Payer
How are prices set?
Tender Free pricing
Regulated
1
2 3
4
5
1. Tender markets
2. Regulated price & dispensing choice
3. Market driven pricing & dispensing choice
4. Regulated price & prescribing choice
5. Out of Pocket markets

Price levels are linked to the generic model but with significant variations and agendas
0%
50%
100%
150%
200%
250%
Generic Price index 40 molecules Dec 2013
Tender Regulated price & dispensing choice
Market driven pricing & dispensing choice
Out Of Pocket Regulated price & prescribing choice
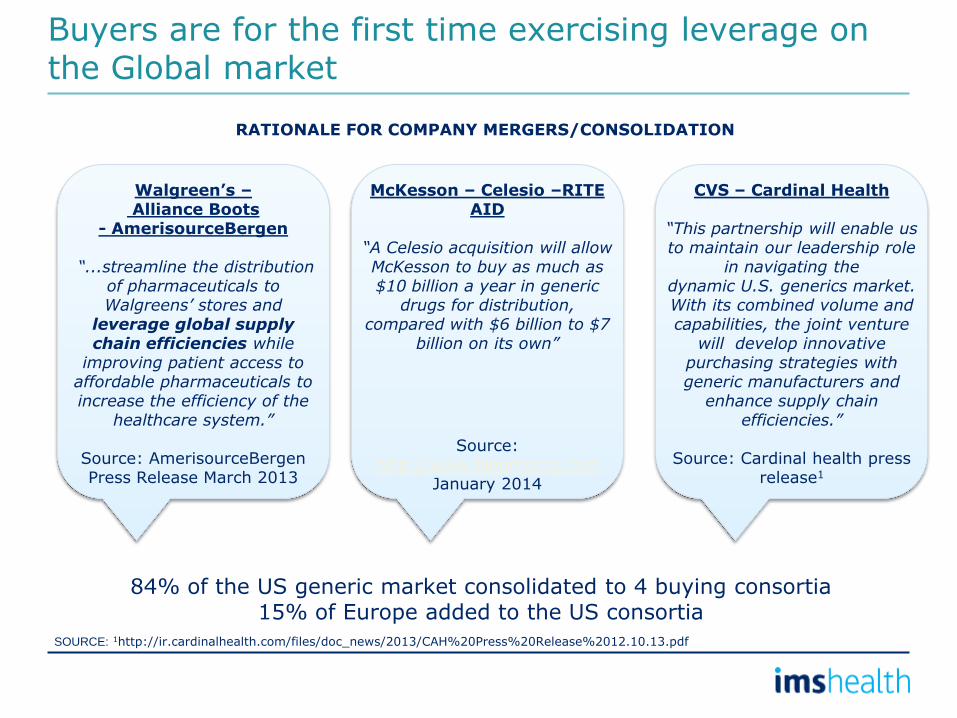
Buyers are for the first time exercising leverage on the Global market
RATIONALE FOR COMPANY MERGERS/CONSOLIDATION
Walgreen’s – Alliance Boots
- AmerisourceBergen
“...streamline the distribution of pharmaceuticals to Walgreens’ stores and
leverage global supply chain efficiencies while
improving patient access to affordable pharmaceuticals to increase the efficiency of the
healthcare system.”
Source: AmerisourceBergen Press Release March 2013
McKesson – Celesio –RITE AID
“A Celesio acquisition will allow McKesson to buy as much as $10 billion a year in generic
drugs for distribution, compared with $6 billion to $7
billion on its own”
Source:
http://www.bloomberg.com January 2014
CVS – Cardinal Health
“This partnership will enable us to maintain our leadership role
in navigating the dynamic U.S. generics market. With its combined volume and capabilities, the joint venture
will develop innovative purchasing strategies with generic manufacturers and
enhance supply chain efficiencies.”
Source: Cardinal health press
release1
84% of the US generic market consolidated to 4 buying consortia 15% of Europe added to the US consortia
SOURCE: 1http://ir.cardinalhealth.com/files/doc_news/2013/CAH%20Press%20Release%2012.10.13.pdf
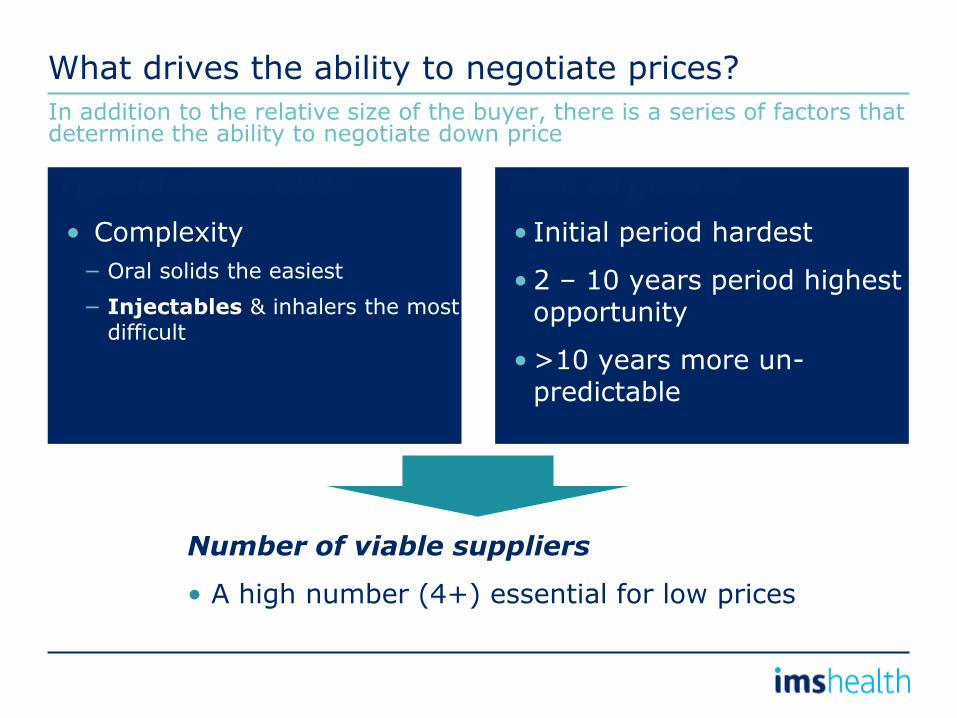
What drives the ability to negotiate prices?
Type of formulation
• Complexity
− Oral solids the easiest
− Injectables & inhalers the most difficult
Time as generic
• Initial period hardest
• 2 – 10 years period highest opportunity
• >10 years more un-predictable
In addition to the relative size of the buyer, there is a series of factors that determine the ability to negotiate down price
Number of viable suppliers
• A high number (4+) essential for low prices
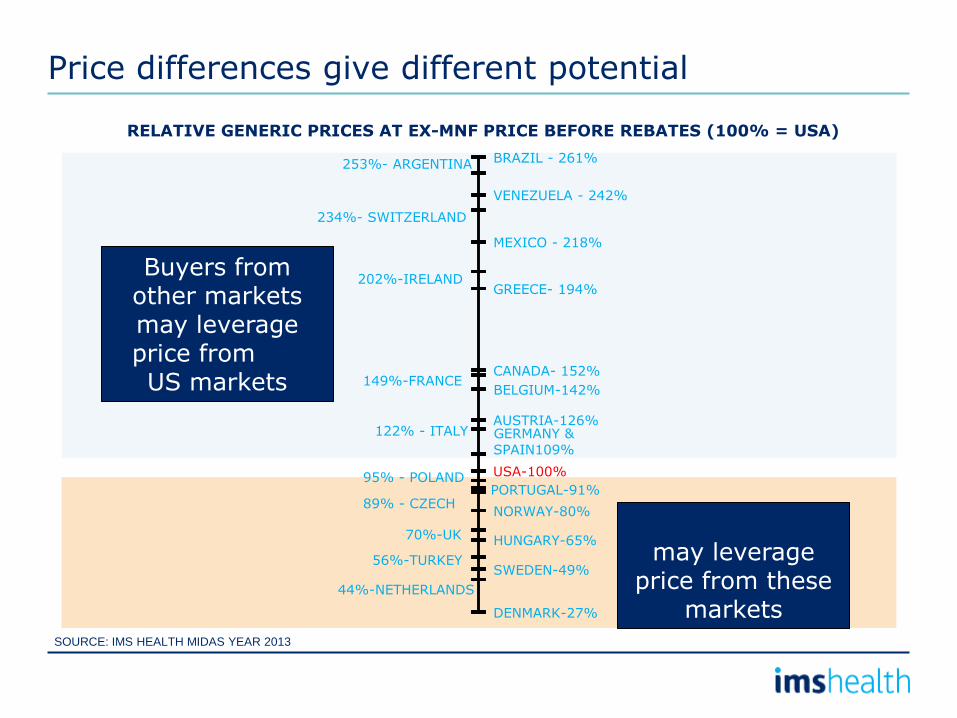
Price differences give different potential
BRAZIL - 261% 253%- ARGENTINA
VENEZUELA - 242%
234%- SWITZERLAND
MEXICO - 218%
202%-IRELAND GREECE- 194%
CANADA- 152% 149%-FRANCE
BELGIUM-142%
AUSTRIA-126% 122% - ITALY GERMANY &
SPAIN109%
USA-100% 95% - POLAND PORTUGAL-91%
89% - CZECH NORWAY-80%
70%-UK HUNGARY-65%
56%-TURKEY SWEDEN-49%
44%-NETHERLANDS
DENMARK-27%
Buyers from other markets may leverage price from the US markets
Buyers in US may leverage
price from these markets
SOURCE: IMS HEALTH MIDAS YEAR 2013
RELATIVE GENERIC PRICES AT EX-MNF PRICE BEFORE REBATES (100% = USA)
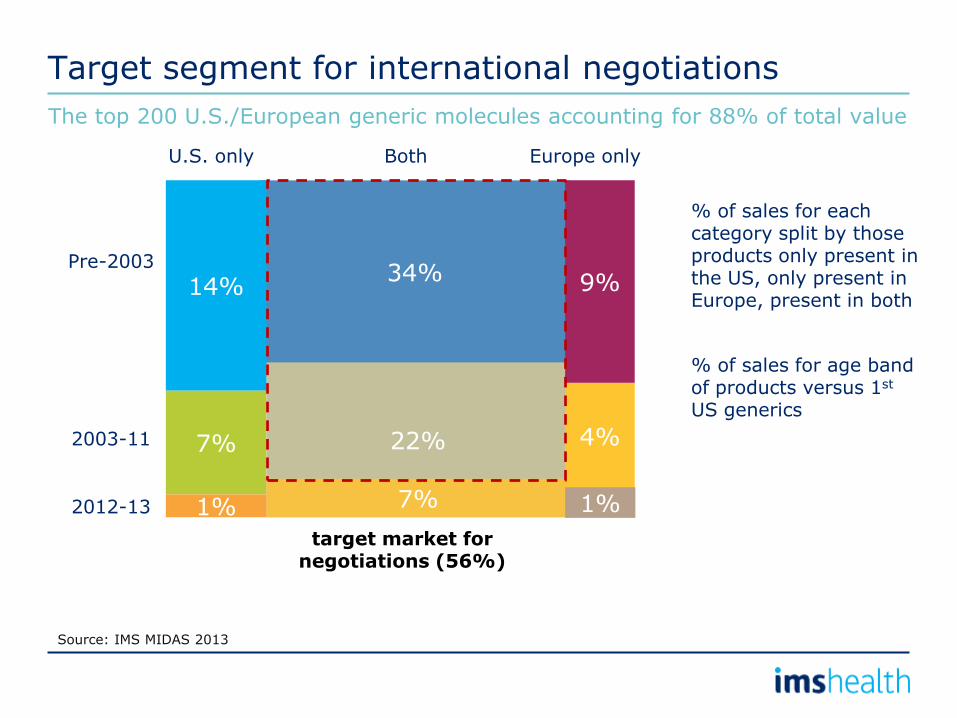
Target segment for international negotiations
The top 200 U.S./European generic molecules accounting for 88% of total value
9%
4%
Source: IMS MIDAS 2013
Highest Potential
Highest Potential
Europe only
target market for negotiations (56%)
U.S. only
Pre-2003
2003-11
2012-13
7%
34%
22%
7%
14% 9%
4%
1% 1%
% of sales for each category split by those products only present in the US, only present in Europe, present in both
% of sales for age band of products versus 1st US generics
Both

Regular release TABLETS target market (60%)
7% 31%
29%
12%
11%
3%
2%
5%
1%
7%
Source: IMS MIDAS 2013
• Regular release tablets is ~ 61% (value) of the top 200 molecules • The competion is fairly broad leading to strong buyer negotiation
position • Leading manufacturers have both a US and European presence
-10% 10% 30% 50%
OTHER
DR REDDYS LAB
LUPIN LABORATORIES
ENDO INTERNATIONAL
SERVIER
SANOFI
STADA
NOVARTIS
MYLAN
ACTAVIS
TEVA
Company value market share of the oral
solid regular release target market
Pre -2003
2003-11
2012-13
US only Europe only Both
1%
Oral solid regular release products will be the easiest
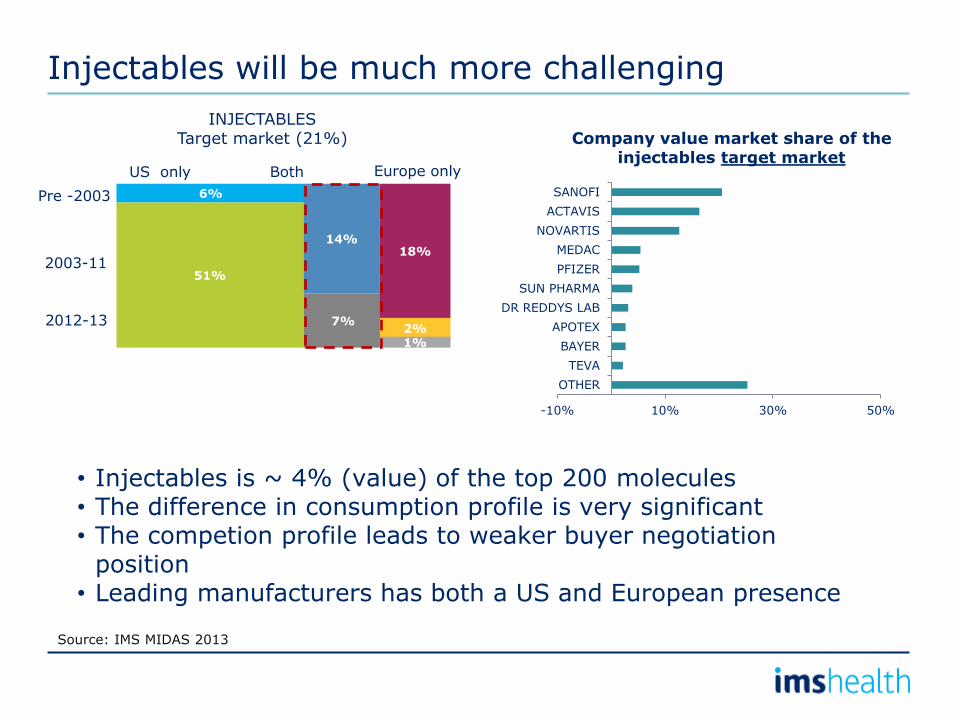
INJECTABLES Target market (21%)
6%
51%
14%
7%
18%
2% 1%
1%
7%
Source: IMS MIDAS 2013
Injectables will be much more challenging
-10% 10% 30% 50%
OTHER
TEVA
BAYER
APOTEX
DR REDDYS LAB
SUN PHARMA
PFIZER
MEDAC
NOVARTIS
ACTAVIS
SANOFI
Company value market share of the
injectables target market
• Injectables is ~ 4% (value) of the top 200 molecules • The difference in consumption profile is very significant • The competion profile leads to weaker buyer negotiation
position • Leading manufacturers has both a US and European presence
US only Europe only Both Pre -2003
2003-11
2012-13

Europe offers a set of access issues when it comes to securing generic volume
TENDER MARKETS BRANDED GENERICS MARKET
Tendering means that a supplier (for that payer group) is either in or out. This makes planning hard. Tender markets can have products with low competion. Tender market almost always also have non-tendered generic segments
• International contracts have limited impact in European branded generic models
European wholesalers all have limitations of overall country reach.
In most European markets, pharmacists are very open to entertain offers from short liners or direct from manufacturers
WHOLESALER REACH COMPETITION

Tender markets have high price pressure and low volume stability
2 weeks
2 years
1 monthh
0.5 - 2 years
Length of contract
- Volume Predictability +
(-) Market exit as prices become un-sustainable
(-) Without fixed fees for service loss of money (-) Inability to predict volumes
(-)Increased handling & logistics costs (-) Time for explaining product switches to patients (-)Decrease remuneration if no fixed fee in place
MANUFACTURER
WHOLESALER
PHARMACY
PHYSICIAN
PATIENT
(-) Compliance problems (-) Time for explaining changes of products to patients
(-) Patients who reject substitution must pay for alternatives (-) Patient uncertainty/compliant (+) Reduce/stabilise premiums
(+) Cost savings PAYER
PRICE EVOLUTION VOLUME PREDICTABILITY
IMPACT ON STAKEHOLDERS
0.0
0.2
0.4
0.6
0.8
1.0
DE DK NL SE Q4 2013
Q1 2008
SOURCE: IMS HEALTH MIDAS YEAR 2013.
GENERIC SIMVASTATIN (leading form-strength)
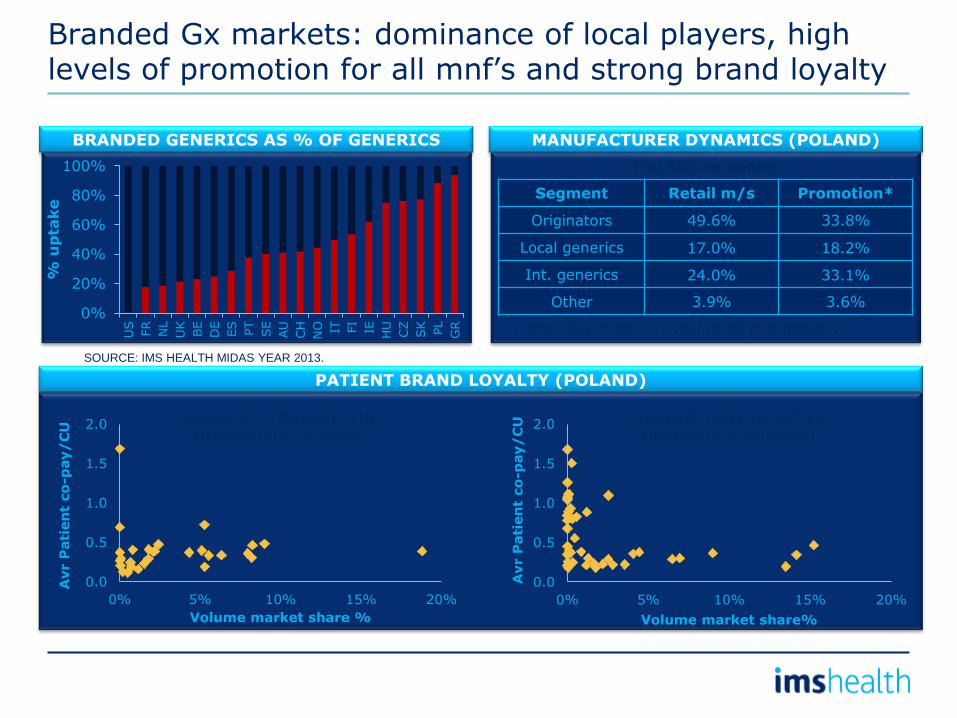
Branded Gx markets: dominance of local players, high levels of promotion for all mnf’s and strong brand loyalty
0%
20%
40%
60%
80%
100%
US
FR
NL
UK
BE
DE
ES
PT
SE
AU
CH
NO
IT
FI
IE
HU
CZ
SK
PL
GR
% u
pta
ke
BRANDED GENERICS AS % OF GENERICS MANUFACTURER DYNAMICS (POLAND)
PATIENT BRAND LOYALTY (POLAND)
0.0
0.5
1.0
1.5
2.0
0% 5% 10% 15% 20%
Avr P
ati
en
t co
-pay/
CU
Volume market share %
0.0
0.5
1.0
1.5
2.0
0% 5% 10% 15% 20%
Avr P
ati
en
t co
-pay/
CU
Volume market share%
GENERIC ATORVASTATIN (leading form-strength)
GENERIC PANTOPRAZOLE (leading form-strength)
Segment Retail m/s Promotion*
Originators 49.6% 33.8%
Local generics 17.0% 18.2%
Int. generics 24.0% 33.1%
Other 3.9% 3.6%
* Promotion to doctors and retail pharmacists
Top 50 companies
SOURCE: IMS HEALTH MIDAS YEAR 2013.
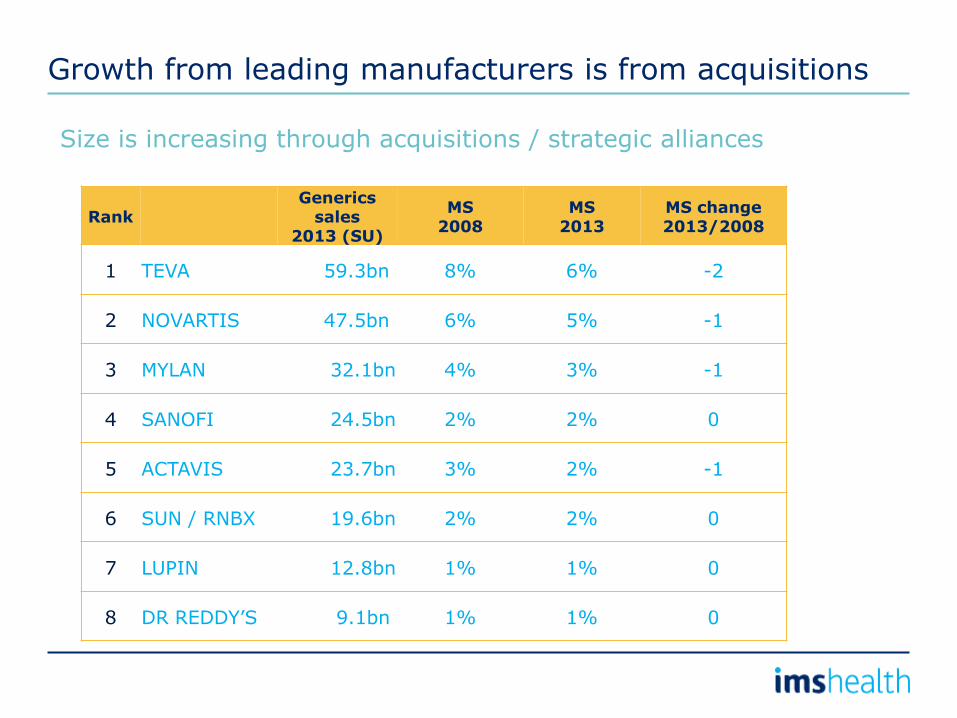
Rank Generics
sales 2013 (SU)
MS 2008
MS 2013
MS change 2013/2008
1 TEVA 59.3bn 8% 6% -2
2 NOVARTIS 47.5bn 6% 5% -1
3 MYLAN 32.1bn 4% 3% -1
4 SANOFI 24.5bn 2% 2% 0
5 ACTAVIS 23.7bn 3% 2% -1
6 SUN / RNBX 19.6bn 2% 2% 0
7 LUPIN 12.8bn 1% 1% 0
8 DR REDDY’S 9.1bn 1% 1% 0
Growth from leading manufacturers is from acquisitions
Size is increasing through acquisitions / strategic alliances

Top Global and Indian generic corporations are heavily dependent on the US market
0%
10%
20%
30%
40%
50%
60%
70%
80%
90%
100%
TEVA NOVARTIS MYLAN ACTAVIS SANOFI DRL LUPIN SUN / RNBX
Sh
are
Vo
lum
e
Sale
s (
SU
)
US Canada Top 5 Europe ROW Pharmerging Japan
Selected top Gx companies – Volume sales breakdown 2013
Top 5
Source: IMS Health, MIDAS, MAT Dec 2013. Market Segmentation + LIC countries. (market seg. not coded and protection not covered excluded)
India
Sanofi is an exception with strong presence in EMs gained through acquisitions
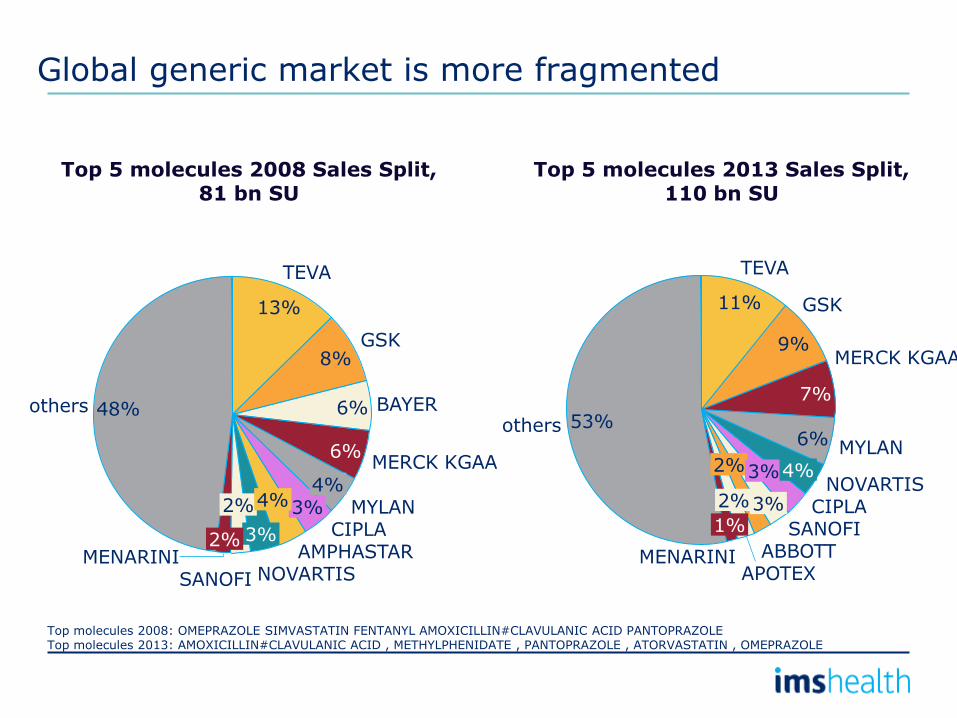
Global generic market is more fragmented
3%
SANOFI
2%
ABBOTT
others
MENARINI
1%
APOTEX
2% CIPLA
3% NOVARTIS
4%
MYLAN 6%
MERCK KGAA
7%
GSK
9%
TEVA
11%
53%
Top 5 molecules 2013 Sales Split, 110 bn SU
MENARINI
TEVA
13%
6%
8%
BAYER 6%
GSK
48% others
SANOFI
4% MERCK KGAA
2%
3%
NOVARTIS
CIPLA AMPHASTAR
2%
MYLAN 3% 4%
Top 5 molecules 2008 Sales Split, 81 bn SU
Top molecules 2008: OMEPRAZOLE SIMVASTATIN FENTANYL AMOXICILLIN#CLAVULANIC ACID PANTOPRAZOLE Top molecules 2013: AMOXICILLIN#CLAVULANIC ACID , METHYLPHENIDATE , PANTOPRAZOLE , ATORVASTATIN , OMEPRAZOLE

The top 5 manufacturers
1. Heavily dependent on the US market
2. Represent < than 35% MS of Top 5 molecules by value sales, facing strong competition from a large number of smaller players
3. Several MNFs (Sanofi, Teva, Novartis) are increasingly focus on “specialty”
4. Top Global and Indian MNF’s are often the “first to market” in the US (e.g. Lipitor/RNBX, Losartan/Teva)
5. Portfolio varies with each of them focusing on different molecules
6. Are losing MS to smaller players. Growth is generated through acquisitions /strategic alliances
Reasons for Generic Price Inflation
Regulatory/Quality – with the increased scrutiny from the FDA, manufacturers need to invest more into their quality systems and when a quality / supply issue arises due to 483s, it creates the opportunity to increase prices to recoup part of their investment
Customer consolidation – with the increased purchasing power of the customers, manufacturers need to make up value on products where they can
Fewer new product launches – generic manufacturers make money by launching new products, reducing CGS, M&A activity and raising prices; with fewer launches, it puts more pressure on the “in-line” product portfolio which again is a driver to increase prices
67 Walgreens
November 18, 2014

Therapy lifecycle model over time
• Generics dominate in most areas of high volume chronic use
Note: Size of bubbles = 2012 European Medicines spend
Source: A.T.Kearney analysis, IMS ATC analysis (2013)
‘Delivering Innovation’
‘Addressing Unmet Needs’
‘Generic medicines dominate’
Rew
ard
ing
In
no
vati
on
S
ocie
ty
ben
efi
t
Hormonal Contraception
Respiratory
Pain
Hypertension
Oncology
Autoimmune
Direct Thrombin Inhibitors
Bacterials
Antifungals
Gene Therapy
Lipid Regulators
Nervous System
Diabetes
Time
Stem Cells

Antihypertensives and pain therapies are the largest value GX therapy areas while antibacterials and lipid regulators the most penetrated
Source: IMS Health, MIDAS, Market Segmentation, MAT Jun 2013, Rx only. It doesn’t include Denmark
5,000
9,000
10,000
2,000
0
1,000
3,000
4,000
6,000
7,000
8,000
3,058
37%
63%
Hepari
ns
2,761
96%
4%
5,014
Menta
l H
ealth
Antibacte
rials
Oncolo
gic
s
5,848
63%
80%
Nnerv
ous S
yste
m D
is
50%
20%
49% 50%
Antihypert
ensiv
es
48%
57%
Pain
37%
43%
5,445
Valu
e $U
S (
thousands M
illions)
51% Anti-u
lcera
nts
9,558
52%
4,898
3,890
39%
Respir
ato
ry
61%
3,215
63%
37%
Lip
id R
eg
7,955
Generics Non Generics
EU- Generic penetration rate by therapy area (overall leading 10 Therapy Area)
Unprotected MK value segmentation
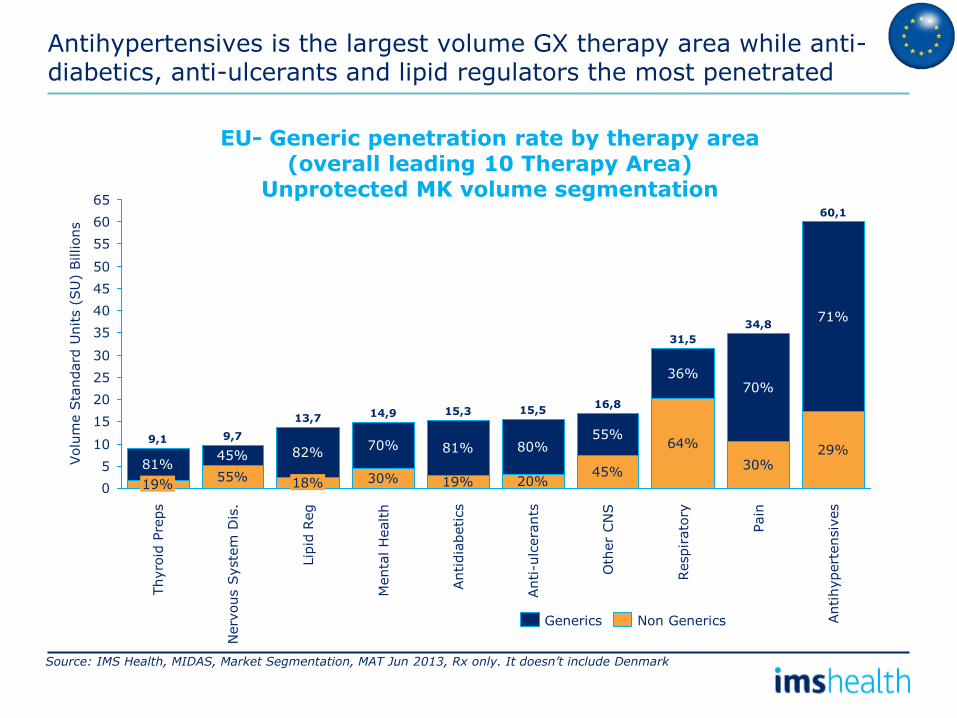
Antihypertensives is the largest volume GX therapy area while anti-diabetics, anti-ulcerants and lipid regulators the most penetrated
Source: IMS Health, MIDAS, Market Segmentation, MAT Jun 2013, Rx only. It doesn’t include Denmark
65
10
5
0
30
45
40
35
25
20
15
50
55
60
64%
36%
Oth
er
CN
S
16,8
45%
55%
Anti-u
lcera
nts
15,5
20%
80% Antidia
betics
15,3
19%
29%
Menta
l H
ealth
14,9
30%
70%
Lip
id R
eg
13,7
18%
82%
Nerv
ous S
yste
m D
is.
9,7
55%
45% Volu
me S
tandard
Units (
SU
) Billions
9,1
19%
81%
Antihypert
ensiv
es
60,1
71%
81%
Pain
34,8
30%
70%
Respir
ato
ry
31,5
Thyro
id P
reps
Generics Non Generics
EU- Generic penetration rate by therapy area (overall leading 10 Therapy Area)
Unprotected MK volume segmentation
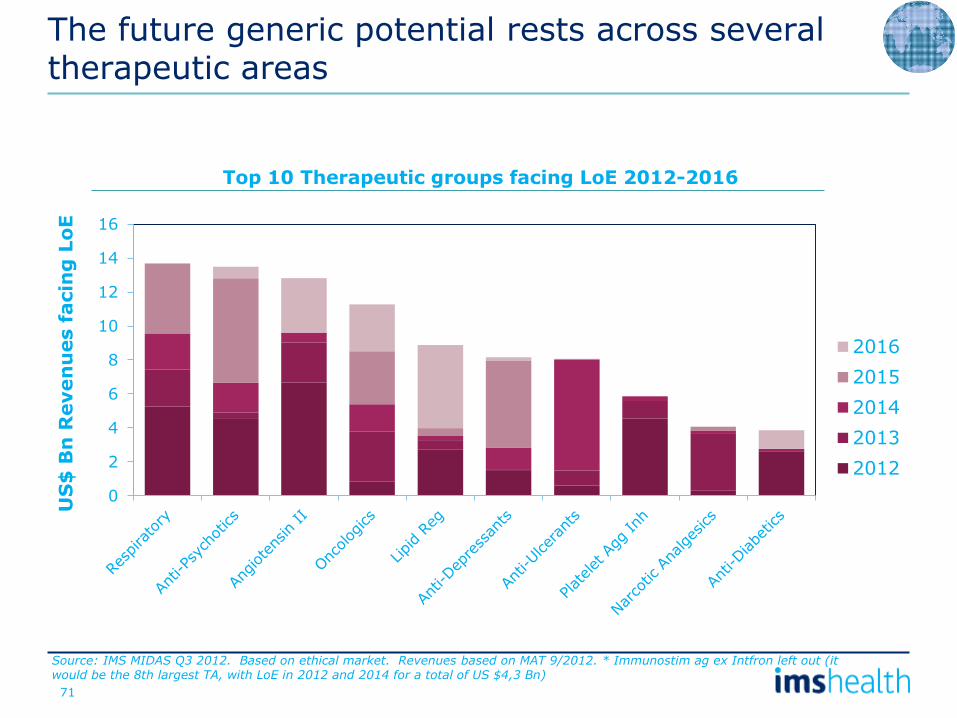
The future generic potential rests across several therapeutic areas
Source: IMS MIDAS Q3 2012. Based on ethical market. Revenues based on MAT 9/2012. * Immunostim ag ex Intfron left out (it would be the 8th largest TA, with LoE in 2012 and 2014 for a total of US $4,3 Bn)
0
2
4
6
8
10
12
14
16
US
$ B
n R
even
ues f
acin
g L
oE
2016
2015
2014
2013
2012
Top 10 Therapeutic groups facing LoE 2012-2016
71

Generics outlook
Volume
• Growth will outpace market
− Increasing number of patients
− “Catch-up” in many European markets
− More limited LOE impact
− Impact of policy shift
Prices
• Regulated prices will go down in most markets
• Tendering will increase but only to a limited extent
− Tender prices bottoming out and tend to slightly increase after a period
• “market prices” – best available price – might have bottomed out for “large” molecules. Tail still to fall
Evolution of therapy volume, price of treatment and overall treatment cost in 7 therapy areas, Rx retail market from Q1
2004-Q4 2013, Normalized to population growth
0.0
0.5
1.0
1.5
2.0
2.5
Q3 2
003
Q1 2
004
Q3 2
004
Q1 2
005
Q3 2
005
Q1 2
006
Q3 2
006
Q1 2
007
Q3 2
007
Q1 2
008
Q3 2
008
Q1 2
009
Q3 2
009
Q1 2
010
Q3 2
010
Q1 2
011
Q3 2
011
Q1 2
012
Q3 2
012
Q1 2
013
Q3 2
013
IN
DE
X
VOLUME WEIGHTED PRICE/TD
NUMBER OF TREATMENT DAYS/CAPITA COST OF TREATMENT
INDEX

Agenda
• Major trends and Global Medicines Spend
• Specialty medicines
• Generic medicines and purchasing alliances
• Conclusions
Conclusions
• Dollar growth is improving in the developed markets and softening a bit in Pharmerging markets
• As the small molecule opportunity drought hits and the specialty drug wave accelerates, payers will be desperate to get cost savings somewhere…
− Generics
− Biosimilars
• Generic share will continue to grow but there will be more regulatory oversight
• Generics are a solution
IMS Health
Thank You!


![IGPA Discourse Analysis Workshop 7 August Final …...Microsoft Word - IGPA_Discourse Analysis Workshop_7 August_Final Program[1].docx Created Date 20150806072227Z ...](https://static.documents.pub/doc/80x56/5c40b95693f3c338cd7862bd/igpa-discourse-analysis-workshop-7-august-final-microsoft-word-igpadiscourse.jpg)


