Page 1
Atmos. Meas. Tech., 7, 3917–3926, 2014
www.atmos-meas-tech.net/7/3917/2014/
doi:10.5194/amt-7-3917-2014
© Author(s) 2014. CC Attribution 3.0 License.
Global Hawk dropsonde observations of the Arctic atmosphere
obtained during the Winter Storms and Pacific Atmospheric Rivers
(WISPAR) field campaign
J. M. Intrieri1, G. de Boer1,2, M. D. Shupe1,2, J. R. Spackman1,3, J. Wang4,6, P. J. Neiman1, G. A. Wick1, T. F. Hock4,
and R. E. Hood5
1NOAA, Earth System Research Laboratory, 325 Broadway, Boulder, CO 80305, USA2Cooperative Institute for Research in the Environmental Sciences, University of Colorado at Boulder, Box 216 UCB,
Boulder, CO 80309, USA3Science and Technology Corporation, Boulder, CO 80305, USA4National Center for Atmospheric Research, 1850 Table Mesa Dr., Boulder, CO 80305, USA5NOAA, Unmanned Aircraft Systems Program, 1200 East West Highway, Silver Spring, MD 20910, USA6University at Albany, SUNY, Department of Atmospheric & Environmental Sciences, Albany, NY 12222, USA
Correspondence to: J. M. Intrieri ([email protected] )
Received: 20 February 2014 – Published in Atmos. Meas. Tech. Discuss.: 23 April 2014
Revised: 15 September 2014 – Accepted: 20 October 2014 – Published: 25 November 2014
Abstract. In February and March of 2011, the Global Hawk
unmanned aircraft system (UAS) was deployed over the Pa-
cific Ocean and the Arctic during the Winter Storms and
Pacific Atmospheric Rivers (WISPAR) field campaign. The
WISPAR science missions were designed to (1) improve our
understanding of Pacific weather systems and the polar atmo-
sphere; (2) evaluate operational use of unmanned aircraft for
investigating these atmospheric events; and (3) demonstrate
operational and research applications of a UAS dropsonde
system at high latitudes. Dropsondes deployed from the
Global Hawk successfully obtained high-resolution profiles
of temperature, pressure, humidity, and wind information
between the stratosphere and surface. The 35 m wingspan
Global Hawk, which can soar for ∼ 31 h at altitudes up to
∼ 20 km, was remotely operated from NASA’s Dryden Flight
Research Center at Edwards Air Force Base (AFB) in Cali-
fornia.
During the 25 h polar flight on 9–10 March 2011, the
Global Hawk released 35 sondes between the North Slope
of Alaska and 85◦ N latitude, marking the first UAS Arctic
dropsonde mission of its kind. The polar flight transected
an unusually cold polar vortex, notable for an associated
record-level Arctic ozone loss, and documented polar bound-
ary layer variations over a sizable ocean–ice lead feature.
Comparison of dropsonde observations with atmospheric re-
analyses reveal that, for this day, large-scale structures such
as the polar vortex and air masses are captured by the re-
analyses, while smaller-scale features, including low-level
jets and inversion depths, are mischaracterized. The success-
ful Arctic dropsonde deployment demonstrates the capability
of the Global Hawk to conduct operations in harsh, remote
regions. The limited comparison with other measurements
and reanalyses highlights the potential value of Arctic atmo-
spheric dropsonde observations where routine in situ mea-
surements are practically nonexistent.
1 Introduction
Recently observed changes in the Arctic environment, most
notably the diminishing summer sea ice and the expansion
of open-water regions (Stroeve et al., 2012), are facilitat-
ing increased access to high-latitude ocean areas. This in-
creased activity elevates the need for observations and infor-
mation to support ecosystem, environmental, social, and eco-
nomic decision-making. The most recent projections show
that the Arctic Ocean could be nearly ice-free in sum-
mer near mid-century (Wang and Overland, 2012), affecting
Published by Copernicus Publications on behalf of the European Geosciences Union.
Page 2
3918 J. M. Intrieri et al.: Global Hawk dropsonde observations
marinetransportation, regional weather, fisheries and ecosys-
tem structures, energy and natural resource management, and
coastal communities. In addition to sea ice loss being a major
driver of significant Arctic system-wide changes, there ex-
ists the potential for impacts on midlatitude weather systems
and long-term climate (e.g., Cohen et al., 2014). Understand-
ing the changing Arctic system and its impacts on weather
and climate requires routine observation of the Arctic atmo-
sphere, ocean, and sea ice; process-level understanding and
improved coupled atmosphere–ice–ocean forecast models;
and the development of services and information products
needed by stakeholders and decision-makers.
The Arctic environment is remote, expansive, challeng-
ing to operate in, lacking in atmospheric observations, and
changing regionally at a rapid pace. For these reasons, the use
of unmanned aircraft systems (UASs) can be of great benefit
toward improving our understanding of Arctic weather and
climate. In particular, the range, altitude, and endurance ca-
pabilities of larger UASs can fill a critical gap in the Arctic
regions where profiles of the atmospheric state are extremely
limited. Ultimately, routine UAS observations can result in
improvements in understanding and predicting key interac-
tions between the ocean, atmosphere, and sea ice systems by
(1) providing evaluation data sets for atmospheric reanalysis
products; (2) validating model simulation results and satel-
lite data products; and (3) obtaining measurements that can
be assimilated into numerical weather prediction models to
improve polar weather, marine, and sea ice forecasts.
In this paper, we present measurements obtained in the
Arctic during the Winter Storms and Pacific Atmospheric
Rivers (WISPAR) field campaign. In February and March of
2011, the Global Hawk (GH) UAS was deployed over the
Pacific Ocean and the Arctic in science missions that were
designed to (1) improve our scientific understanding of Pa-
cific weather systems and the polar atmosphere; (2) evalu-
ate the operational use of unmanned aircraft for investigat-
ing atmospheric events over remote data-sparse regions; and
(3) demonstrate and test the newly developed Global Hawk
dropsonde system. The Global Hawk is classified as a high-
altitude, long-endurance (HALE) UAS platform which dis-
tinguishes it from other UASs that are smaller, fly at lower
altitudes, carry less weight in payload, and have vastly lim-
ited ranges in comparison. Here, we present details of the
WISPAR Arctic mission (one of three Global Hawk flights
obtained during WISPAR), which was the first successful
high-altitude and high-latitude UAS mission with dropsonde
capability. This high-Arctic flight allows us to provide ex-
amples of the benefits of UAS dropsonde measurements for
evaluating concurrent ground-based observations, comparing
results of reanalyses data sets, and understanding the Arctic
atmospheric features from the polar vortex to boundary layer
structures.
2 The Global Hawk UAS and dropsonde
measurement system
The National Oceanic and Atmospheric Administration
(NOAA) is utilizing a variety of UAS, ranging from small
hand-launched systems to the high-altitude, long-endurance
Global Hawk, to support NOAA research and future oper-
ational data collection (MacDonald, 2005). In the winter of
2011, the Global Hawk was deployed as part of WISPAR.
WISPAR was conducted through a collaborative tri-agency
effort involving NOAA, NASA, and the National Center for
Atmospheric Research (NCAR). The main objective of the
NOAA-led WISPAR campaign was to demonstrate the oper-
ational and research applications of a UAS in remote regions
and to test a newly developed dropsonde system. The WIS-
PAR science missions targeted three areas of interest using
the Global Hawk: atmospheric rivers (Ralph and Dettinger,
2011; Neiman et al., 2014), Pacific winter storms, and the
Arctic atmosphere.
The Global Hawk represents a tremendous asset in the col-
lection of atmospheric data. With an ability to cruise at al-
titudes up to ∼ 20 km, operate for over 31 h at a time, and
cover distances over ∼ 18 500 km (10 000 nautical miles), the
Global Hawk can cover extensive ground in a single flight
(Naftel, 2009). For WISPAR, the 35 m wingspan Global
Hawk was remotely operated from its base at NASA Dryden
Flight Research Center (DFRC) on the Edwards Air Force
Base in southern California. The Global Hawk Operations
Center (GHOC) at DFRC consists of three areas, includ-
ing a flight operations room, payload operations room, and
a support equipment room. For typical flights the flight op-
erations room is manned by a pilot, flight support engineer,
mission director, GHOC operator, and a range safety opera-
tor. Communications between DFRC and the Global Hawk
are carried out using a primary and redundant Iridium satel-
lite link. Standard in situ observations acquired by the GH
include air speed velocity, pressure, and temperature, as well
as platform system parameters, including skin temperature
and fuel temperature, and a high-definition (HD) camera for
forward-looking imagery to provide situational awareness
for the plane and scientific goals. The Global Hawk flight
track for the Arctic mission was confined to a wedge de-
fined by US borders and with a turnaround limit of 85◦ N.
The flight plan was filed with GH mission operations 1 week
in advance, with a 24 h window allowed for any modifica-
tions. During WISPAR, no dropsondes were deployed over
land areas.
The WISPAR flights provided a unique testing opportunity
for an innovative dropsonde system designed specifically for
use with the Global Hawk through a collaborative effort be-
tween the NCAR Earth Observing Laboratory (EOL) and
the NOAA Unmanned Aircraft Systems Program. This drop-
sonde system allows the Global Hawk to dispense up to 88
dropsondes per flight. The Global Hawk sondes, referred to
as “mini-dropsondes”, are smaller and half the weight of the
Atmos. Meas. Tech., 7, 3917–3926, 2014 www.atmos-meas-tech.net/7/3917/2014/
Page 3
J. M. Intrieri et al.: Global Hawk dropsonde observations 3919
Figure 1. (Clockwise from top left) Global Hawk; close-up of
Global Hawk with dropsonde eject tube, circled in yellow (photo
courtesy of NASA); close-up of dropsonde launch tube (photo cour-
tesy of NASA); dropsonde dispenser and launch assembly; drop-
sonde with parachute.
standard dropsondes (Vaisala RD9) deployed from manned
aircraft (Hock and Franklin, 1999) but use the same sen-
sor module for temperature, pressure, and humidity and the
same type of GPS receiver for winds. The mini-dropsonde
provides measurements of pressure, temperature, and relative
humidity (RH) profiles at 2 Hz (vertical resolution ∼ 30–5 m)
and wind speed and direction at 4 Hz resolution (∼ 15–3 m)
from the launch altitude to the surface. The sondes have a fall
rate of between ∼ 30 m s−1 at 15 km and ∼ 10 m s−1 in the
boundary layer as it approaches the surface. The total weight
of the sonde is 0.17 kg, and the sensors, circuit board, and
battery are housed in a cardboard tube that is 4.5 cm in diam-
eter and 30.5 cm long. The dropsondes are deployed with a
square-cone parachute, also smaller in size than its manned
counterpart and designed to provide a stable descent, from an
automated launching system in the aft of the aircraft (Fig. 1).
The sondes continuously measure the atmosphere from the
release altitude to the surface. In situ data collected from the
sonde sensors are transmitted back in real time to an onboard
aircraft data system via radio link and then transmitted to
the ground-control station via satellite communications link.
The data system installed on the aircraft (closely resembling
that employed on manned aircraft; Hock and Franklin, 1999)
can process up to eight sondes simultaneously, allowing for
closely spaced dropsonde deployment. Individual sondes can
be deployed with a time separation of 1 min or less, while
for continuous operations from an altitude of 20 km where
the fall time is ∼ 18 min the sondes can be released ev-
ery 2.5 min, corresponding to a spacing of ∼ 25 km, given a
cruising speed of 170 m s−1. This spacing could be reduced
by cruising at a lower altitude. The dropsonde system al-
lows for on-demand release of the sondes, triggered remotely
by the ground-based team. All dropsonde measurements are
quality-controlled using established post-processing meth-
ods (Wang et al., 2010).
The mini-dropsonde uses the same pres-
sure–temperature–humidity sensor module as is used in
the Vaisala RS92 radiosonde (Vaisala, 2012), and the accu-
racy of this module is high and well documented (e.g., Nash
et al., 2011). The dropsonde temperature measurement has
an accuracy of 0.3 and 0.6 ◦C from the surface to 100 hPa
and from 100 to 10 hPa, respectively (Nash et al., 2011), and
it is subject to a calibration bias of ∼ 0.15 ◦C (Wang et al.,
2013). Comprehensive and independent field and laboratory
testing to assess the mini-dropsonde measurement perfor-
mance continue to be conducted by NCAR. Comparisons in
the field with an infrared (IR) interferometer have suggested
that the mini-dropsonde hygrometer may have a dry bias
in very dry conditions at high launch altitudes (G. Wick,
personal communication, 2014). The hygrometer used
on mini-dropsondes, not optimized for low-water-vapor
environments, do not measure RHs below 1 %.
3 Arctic dropsonde flight
The Arctic WISPAR flight was successfully carried out on
9–10 March 2011. In addition to demonstrating the drop-
sonde system in the harsh polar environment, the 25 h flight
twice transected an atmospheric river event west of Cali-
fornia, as well as a winter storm system off the Canadian
coast (Fig. 2). The Global Hawk WISPAR science team was
responsible for flight planning, identifying scientific objec-
tives, and determining dropsonde locations prior to the flight.
During the flight, the science team was able to participate re-
motely to provide input on decisions regarding flight changes
while virtually monitoring onboard sensors and real-time in-
formation from the dropsondes.
In total, 70 dropsondes were deployed, including 35 de-
ployments over the Arctic Ocean north of Alaska’s northern
coast. For this specific flight, the Global Hawk completed a
6 h overnight tour of the western Arctic in a triangular flight
pattern between the North Slope of Alaska and 85◦ N latitude
(Fig. 3). Of the 35 sondes dropped over the Arctic Ocean, 27
are used in the current analysis. The remaining eight sound-
ings returned no data due to initialization and communication
problems associated with the extreme cold temperatures en-
countered during the flight. This communications issue has
since been corrected and does not affect current sondes.
4 Demonstration of capabilities
During the Global Hawk Arctic mission, dropsonde data
sampled a variety of interesting atmospheric phenomena. In
this paper, we use this case study to provide examples of how
routine Global Hawk operations may be used to further shed
light on the infrequently sampled Arctic atmosphere. Here,
we cover three distinct topics using the observations from the
www.atmos-meas-tech.net/7/3917/2014/ Atmos. Meas. Tech., 7, 3917–3926, 2014
Page 4
3920 J. M. Intrieri et al.: Global Hawk dropsonde observations
Figure 2. Global Hawk flight track overlaid on the GOES-11
(Geostationary Operational Environment Satellite) IR image for
9 March 2011. The atmospheric river (AR) feature is indicated by
the red arrow.
9–10 March 2011 case study: the upper-troposphere–lower-
stratosphere polar vortex structure; surface and boundary
layer atmospheric features; and comparisons between drop-
sonde measurements and atmospheric reanalyses throughout
the depth of the Arctic atmosphere.
4.1 Sampling of the polar vortex
The Arctic mission was noteworthy in part because of the
especially cold stratospheric temperatures resulting from an
anomalously deep and atypically long-lived polar vortex
that persisted from December 2010 through to the end of
March 2011. Extremely low stratospheric temperatures in the
2010–2011 winter were partially responsible for the record
Arctic ozone loss observed that winter (Manney et al., 2011).
Vertically resolved observations of the polar vortex are not
often available due to the limited coverage of upper-air ob-
servations over the Arctic Ocean. The Global Hawk transect
was able to characterize the structure of the lower portion of
this unprecedented polar vortex.
Transecting the vortex provided challenges to the Global
Hawk due to design-limit thresholds for fuel and airframe
minimum temperatures. On the northbound leg, ambient
temperatures decreased to −76 ◦C (within 2 ◦C of the criti-
cal skin temperature for the Global Hawk) at the polar vor-
tex edge (77◦ N). Real-time mission information from the
dropsondes, onboard sensors, and polar vortex temperature
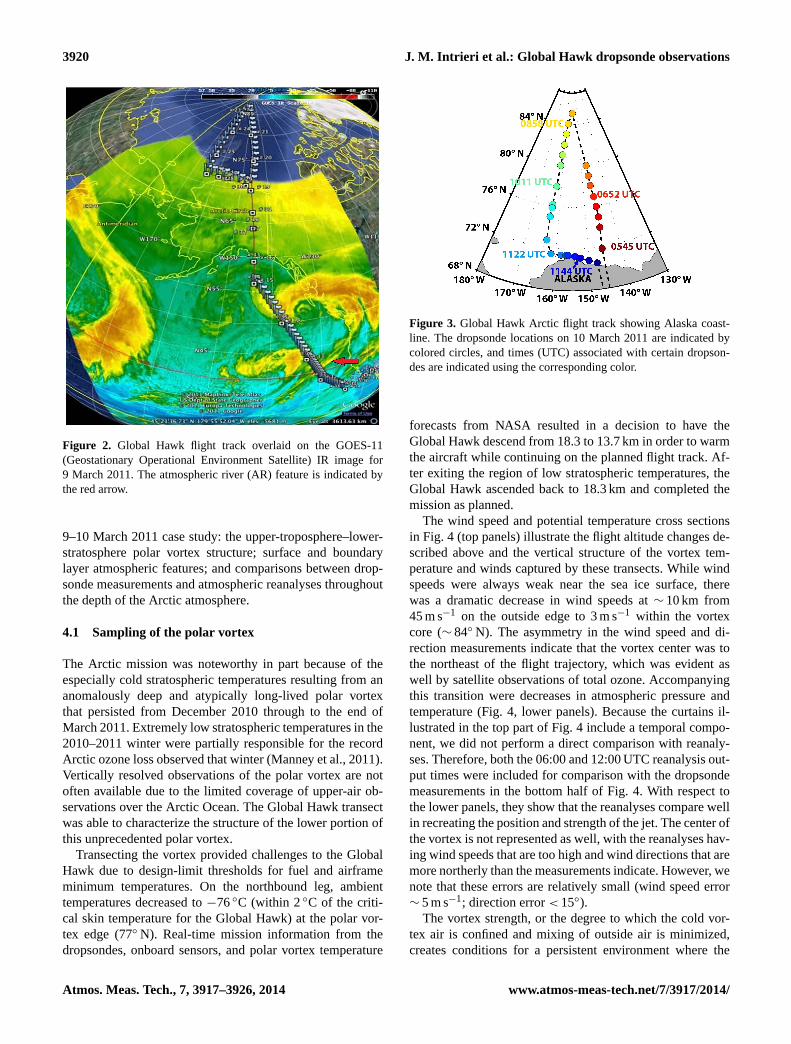
Figure 3. Global Hawk Arctic flight track showing Alaska coast-
line. The dropsonde locations on 10 March 2011 are indicated by
colored circles, and times (UTC) associated with certain dropson-
des are indicated using the corresponding color.
forecasts from NASA resulted in a decision to have the
Global Hawk descend from 18.3 to 13.7 km in order to warm
the aircraft while continuing on the planned flight track. Af-
ter exiting the region of low stratospheric temperatures, the
Global Hawk ascended back to 18.3 km and completed the
mission as planned.
The wind speed and potential temperature cross sections
in Fig. 4 (top panels) illustrate the flight altitude changes de-
scribed above and the vertical structure of the vortex tem-
perature and winds captured by these transects. While wind
speeds were always weak near the sea ice surface, there
was a dramatic decrease in wind speeds at ∼ 10 km from
45 m s−1 on the outside edge to 3 m s−1 within the vortex
core (∼ 84◦ N). The asymmetry in the wind speed and di-
rection measurements indicate that the vortex center was to
the northeast of the flight trajectory, which was evident as
well by satellite observations of total ozone. Accompanying
this transition were decreases in atmospheric pressure and
temperature (Fig. 4, lower panels). Because the curtains il-
lustrated in the top part of Fig. 4 include a temporal compo-
nent, we did not perform a direct comparison with reanaly-
ses. Therefore, both the 06:00 and 12:00 UTC reanalysis out-
put times were included for comparison with the dropsonde
measurements in the bottom half of Fig. 4. With respect to
the lower panels, they show that the reanalyses compare well
in recreating the position and strength of the jet. The center of
the vortex is not represented as well, with the reanalyses hav-
ing wind speeds that are too high and wind directions that are
more northerly than the measurements indicate. However, we
note that these errors are relatively small (wind speed error
∼ 5 m s−1; direction error < 15◦).
The vortex strength, or the degree to which the cold vor-
tex air is confined and mixing of outside air is minimized,
creates conditions for a persistent environment where the
Atmos. Meas. Tech., 7, 3917–3926, 2014 www.atmos-meas-tech.net/7/3917/2014/
Page 5
J. M. Intrieri et al.: Global Hawk dropsonde observations 3921
Figure 4. Top panels: potential temperature (K) and wind speed
(m s−1) cross sections on 10 March 2011. Colored dots represent
dropsonde locations as depicted in Fig. 3. Lower panels, from top
to bottom: wind speed (m s−1), wind direction (deg), temperature
(K), and pressure (mb) at 11 km m a.s.l. (dashed line in top cross
section) as measured by the dropsondes (black solid lines) and de-
picted in the ERA-I (orange) and R-2 (purple) reanalyses at 06:00
and 12:00 UTC (shading indicates range between times). Reanaly-
sis data are interpolated to the 11 km height. The vertical black line
in all panels corresponds to the northernmost dropsonde in Fig. 3.
chemical reactions that activate chlorine and destroy ozone
exist (Manney et al., 2011). Dropsondes have also been used
to capture details of the polar vortex in Antarctica from the
Concordiasi experiment in 2010 (Wang et al., 2013). The
Global Hawk dropsonde measurements illustrate that high
altitude flight tracks, designed to characterize the position
and gradients of the lower vortex, can provide information
on vortex strength and persistence.
4.2 Sampling of Arctic surface and boundary layer
UAS and dropsonde technology can provide much needed
information for understanding Arctic sea ice, ocean, and at-
mospheric systems; processes governing energy exchange
among them; and processes impacting the location and
movement of sea ice. To first order, sea ice movement is de-
termined by near-surface winds and wind stress. These pa-
rameters are largely controlled by synoptic and mesoscale
features, such as fronts and low-level jets, which can be mod-
ulated by the boundary layer thermal structure. However,
techniques for estimating these parameters from large-scale
model representations of the boundary layer have shown
low correlations with actual ice motion (e.g., Thorndike and
Colony, 1982) and poor comparisons to observed boundary
layer structure and surface fluxes (e.g., Tjernström et al.,
2005). The structure of these features and processes modu-
lating them are particularly poorly understood and modeled
Figure 5. Upper panel: Global Hawk flight track on 10 March 2011
along Alaska’s north coast (see Figs. 2 and 3 for larger-scale con-
text), with dropsonde locations and times (UTC) overlaid onto a
MODIS satellite image (overpass time, 10:30 UTC). Bands used
for the image are band 3 (459–479 nm), band 6 (1628–1652 nm),
and band 7 (2105–2155 nm); resolution is 500 m. Lower panels,
from top to bottom: dropsonde cross sections of (a) temperature
(K), (b) specific humidity (g kg−1), (c) wind speed (m s−1), and
(d) wind direction (deg). Dropsonde locations are marked with blue
dots, as in the top panel, and match the colors used in Fig. 3.
over sea ice and in the marginal ice zone where spatially
and temporally complex boundary layer structures occur.
Dropsonde data can provide the vertically resolved boundary
layer information needed to improve this understanding, ul-
timately resulting in improved atmospheric and sea ice fore-
casts.
An example of the detail offered by dropsondes is shown
in Fig. 5, which documents a longitudinal transect just north
of the Alaskan coastline. This transect passed over a sizable
lead to the west of Barrow, as observed by the Moderate Res-
olution Imaging Spectroradiometer (MODIS). The “red” im-
age is a composite of bands 3, 6, and 7 (479; 1652; 2155 nm)
that best reveals snow and ice, which are reflective in the
www.atmos-meas-tech.net/7/3917/2014/ Atmos. Meas. Tech., 7, 3917–3926, 2014
Page 6
3922 J. M. Intrieri et al.: Global Hawk dropsonde observations
Figure 6. Plot of the Barrow Weather Forecast Office radiosonde launched (blue line) at 11:08 UTC on 10 March 2011, the Global Hawk
dropsondes (green lines) at 11:36 and 11:38 UTC 10 March 2011, and ERA-I (orange) and R-2 (purple) reanalysis profiles (12:00 UTC
10 March 2011) interpolated in space to the averaged dropsonde location for the entire profile depth (top) and lower atmosphere (bottom).
Included are (from left to right) temperature (K), specific humidity (g kg−1), relative humidity (%), wind speed (m s−1), and wind direction
(deg).
visible part of the spectrum (band 3) and highly absorbent in
the shortwave IR (bands 6 and 7) – the water exposed in the
lead feature appears dark since it absorbs in the red.
During this time, westerly flow associated with the larger-
scale polar vortex impinged on Barrow. Below 1 km, a low-
level jet, reaching speeds of 16 m s−1, contributed to a partic-
ularly warm and moist boundary layer. Also, directly above
the lead at 156◦ W (11:38 UTC 10 March 2011), a plume of
moisture was observed, extending 400 m or more into the at-
mosphere. To the east of Barrow this westerly flow rode over
a shallow, colder, and drier continental air mass moving in
from the south-southwest, leading to substantially cooler sur-
face temperatures and enhanced near-surface stability. The
high resolution and spatial density of these dropsonde ob-
servations reveals several small-scale and subtle features in
the temperature, wind, and humidity fields, highlighting the
potentially important role this type of data could play in im-
proving weather and ice forecasting and process study mod-
els.
Near the Barrow area, data from the 11:36 and 11:38 UTC
Global Hawk dropsondes are compared with a contempo-
raneous upward radio sounding from the Barrow Weather
Forecast Office launched at 11:08 UTC (Fig. 6). This upward
sonde was at ∼ 8 km altitude at 11:38 UTC. There is very
good correspondence among the sondes in the basic structure
of the temperature profile, including features such as the in-
version below ∼ 200 m. There are small differences in mag-
nitude at low levels and near the tropopause (∼ 11–11.5 km)
most likely due to spatial differences between the radiosonde
and dropsonde profiles.
The specific and relative humidity profiles, however, do
not compare as well, which is partially due to their large
variability both spatially and temporally. We speculate that
the Barrow sounding is too humid in the upper troposphere
and stratosphere (40 % RH) and values compare poorly at
low humidities. This bias is potentially a result of poor per-
formance of the carbon hygristor used in the VIZ-B2 ra-
diosonde launched at Barrow (Wang et al., 2003). We note
that on about 30 August 2012 the Barrow site switched from
the VIZ-B2 radiosonde to Vaisala RS92, which is expected
to perform much better in cold and dry conditions and has
the same sensors as the dropsonde. In lower, moister layers,
the dropsondes and radiosonde compare reasonably well in
height and magnitude although some differences exist, which
we postulate may be due to spatial inhomogeneity near the
surface. As with the temperatures described above, the over-
all vertical structure of the wind speed and direction compare
well between the mini-dropsondes and the Barrow sounding
above the boundary layer. However, substantial differences in
the wind observations are evident below around 2 km, where
even modest spatial differences of the profiles can be affected
by coastal influences, low-level jets, and leads.
4.3 Evaluation of reanalyses
Atmospheric reanalysis data sets are commonly used to bet-
ter understand atmospheric phenomena, provide forcing in-
formation for model experiments, and validate model re-
sults. Their utility has been hampered in the Arctic due to
our inability to guide and subsequently validate these prod-
ucts. This inability to evaluate reanalyses is due in part to
limited independent data set availability. Here, we demon-
strate a potentially important role for Global Hawk obser-
vations by comparing dropsonde measurements to reanal-
yses produced by the European Centre for Medium-Range
Weather Forecasting (ECMWF) and National Centers for En-
vironmental Prediction (NCEP). Included in this evaluation
are the ERA-Interim (European Reanalysis, hereafter ERA-
I) and NCEP-Department of Energy (DOE) (hereafter R-2)
reanalyses. ERA-I (Dee et al., 2011) provides global analy-
ses of atmospheric and surface state variables every 6 h from
Atmos. Meas. Tech., 7, 3917–3926, 2014 www.atmos-meas-tech.net/7/3917/2014/
Page 7
J. M. Intrieri et al.: Global Hawk dropsonde observations 3923
Figure 7. Comparison plots of ERA-Interim and R-2 reanalyses fields with dropsonde data for (clockwise from top left) temperature (K),
specific humidity (g kg−1), wind direction (deg), and wind speed (m s−1). Included are scatterplots comparing the dropsonde and reanalyses
directly, as well as profiles of error distributions. The difference distributions represent the difference between the reanalysis estimate at the
time closest to dropsonde deployment and the dropsonde measurement interpolated to the reanalysis heights (reanalysis minus dropsonde).
The difference profiles include the mean (circle), 25th/75th percentiles (bars), and 10th/90th percentiles (whiskers) at each level. Color coding
corresponds to altitude in kilometers (see color scale on the right).
1989 to present. ERA-I extends the capabilities of older prod-
ucts (ERA-15 and ERA-40) by utilizing an increased num-
ber of vertical levels (27) and higher horizontal resolution
(T255, ∼ 0.7◦ horizontal resolution, 11 grid points in the
lowest 3 km) and implementing advanced data assimilation
techniques (4D-Variational) and model parameterizations. R-
2 (Kanamitsu et al., 2002) utilizes the same spatial (T62,
28 levels, ∼ 1.9◦ horizontal resolution, and 4 grid points in
the lowest 3 km) and temporal (6 hourly) resolution as its
predecessor (NCEP/NCAR, or R-1) and uses a 3-D varia-
tional assimilation technique. R-2 features advances in the
handling of snow cover, humidity diffusion, relative humidity
and oceanic albedo, amongst other things, when compared to
R-1.
Despite having only one day of Global Hawk dropsonde
profiles, some interesting features are noted through com-
parison of these data with reanalysis products. To facilitate
the comparison, 06:00 and 12:00 UTC analyses from ERA-I
and R-2 were interpolated linearly in space to the locations
of dropsonde deployment. Dropsonde profiles were addition-
ally interpolated linearly in space to heights matching those
available in the reanalyses. Linear interpolation was deemed
to be appropriate due to the limited variability in the eval-
uated variables between adjacent reanalysis grid boxes and
the high resolution available from the dropsonde measure-
ments. Comparisons were subsequently carried out between
the dropsonde measurements and the interpolated reanaly-
sis profiles using the analysis time closest to the dropsonde
launch time (as shown in Figs. 4, 6, and 7). Additionally in
Fig. 7, profiles of distributions of differences between the
reanalysis estimates and dropsonde measurements (reanaly-
sis minus dropsonde) for each quantity are illustrated. The
difference profiles include the mean (circle), 25th/75th per-
centiles (bars), and 10th/90th percentiles (whiskers) at each
level, with color coding representing the altitude in kilome-
ters. For this particular day, ERA-I has a warm bias at the
lowest atmospheric levels (surface to 500 m) relative to drop-
sondes, while R-2 demonstrates a cold bias (Fig. 6, bottom
row). Both reanalyses were too moist in the lower atmo-
sphere, with significant scatter, and both had winds that were
slightly too weak, particularly in the middle of the profile
(6–10 km).
www.atmos-meas-tech.net/7/3917/2014/ Atmos. Meas. Tech., 7, 3917–3926, 2014
Page 8
3924 J. M. Intrieri et al.: Global Hawk dropsonde observations
While the spatial resolution of the reanalysis products is
much coarser than that of the dropsondes, the biases observed
do not necessarily appear to be linked directly to this discrep-
ancy. ERA-Interim appears to have sufficient vertical resolu-
tion to resolve some of the major features observed in the
radiosonde and dropsonde profiles, yet it fails to do so. The
low resolution of the R-2 product could be to blame for some
of the biases detected for the lower atmosphere, given that
the limited number of data points available vertically for the
lowest 1.5 km do not allow that model to resolve some of the
major features observed.
One striking feature that is readily apparent in the reanal-
ysis evaluation is that differences are relatively smaller at
higher altitudes, suggesting that the large-scale structure is
well represented. For example, ERA-I captures the upper-
level, large-scale structure associated with the polar vortex
(the range between 06:00 and 12:00 UTC output is shaded in
the lower panels of Fig. 4). In more general terms (Fig. 7),
upper-level wind speed and direction observations are well
represented by the reanalyses, with mean errors generally
less than 3–4 m s−1 and 5◦, respectively. R-2 shows slightly
larger error variability than ERA-I, particularly between 8
and 10 km above the surface. Upper-level temperature errors
are typically less than 1 K, with R-2 again showing slightly
larger errors in the 8–10 km range. For specific humidity,
what appear to be small errors at higher elevations are actu-
ally quite large on a percentage basis, which becomes more
obvious when plotted as relative humidity (not shown in
Fig. 7). An example comparison of individual dropsondes
over Barrow (Fig. 6) shows this dramatic difference in rel-
ative humidity above about 4 km, with reanalysis errors on
the order of 20–40 % and the largest errors occurring around
10 km, which may be due, in part, to the moist bias in the
Barrow radiosonde data that are assimilated by the reanaly-
ses.
Relative to upper levels, somewhat larger reanalysis de-
ficiencies are revealed at lower levels. These are related to
inaccuracies in representing the Arctic inversion, the near-
surface boundary layer environment, and the actual surface
state. Both biases are on the order of 2–4 K. A look at indi-
vidual profiles, such as those in Fig. 6, suggests that these
low-altitude errors are the result of the misrepresentation of
low-level jets and the near-surface environment in the reanal-
yses – specifically, the near-surface stability with R-1 be-
ing too stable and the near-surface (surface to 1 km) stability
with ERA-I not being stable enough. Wind direction errors
show elevated variability near the surface, while both reanal-
yses are biased towards weaker, more southerly, winds below
1 km compared to the dropsondes. These wind biases could
impact momentum transfer to the sea ice below.
Specific humidity is by far the least well represented vari-
able of those reviewed. The largest absolute specific humid-
ity errors are found in the lower troposphere, and both re-
analysis products demonstrate moist biases relative to obser-
vations (Fig. 7), primarily due to overestimates in clear air. In
spite of this bias, the reanalyses still miss important features,
such as the low-level moist layers observed over the lead near
Barrow (Fig. 6). (Note on the handling of sea ice in reanaly-
ses: for this date, ERA-Interim obtains sea ice concentration
from the Operational Sea Surface Temperature and Sea Ice
Analysis (OSTIA; Donlon et al., 2012), which uses satellite
measurements to produce a sea surface temperature (SST)
and sea ice concentration product at 1/20◦ resolution. R-2,
on the other hand, utilizes AMIP-II (Atmospheric Model In-
tercomparison Project) sea ice boundary conditions (Hurrell
et al., 2008). This product is based on the monthly mean
Hadley Centre Sea Ice and Sea Surface Temperature data
set (HadISST) and the NOAA weekly optimum interpolation
SST analysis. This product only provides monthly mean sea
ice concentration data on a 1◦ grid.)
Several factors may contribute to such disagreements in
humidity. First, as a result of large spatial and temporal vari-
ability, the spatial (point vs. grid box) and temporal sepa-
rations of dropsonde and reanalysis profiles may contribute
to the detected discrepancies. Regardless, there are several
important potential repercussions of humidity errors, includ-
ing incorrect placement and production of clouds. Routine
dropsonde information incorporated into reanalyses data sets
would likely improve spurious or technically insufficient
measurements from fields such as the RH.
5 Discussion and summary
The WISPAR 2011 Arctic flight was a landmark demonstra-
tion mission using the Global Hawk UAS. It constitutes the
first successful deployment of a large number of dropson-
des from a UAS at high latitudes. Additionally, the flight
transect through an unusually cold polar vortex, notable for
record Arctic ozone loss, demonstrates the range of atmo-
spheric conditions under which the Global Hawk can oper-
ate. This paper offered select highlights and examples of the
dropsonde data illustrating the utility of these measurements
in capturing interesting and unique Arctic atmospheric char-
acteristics such as the polar vortex, surface inversions, and
low-level jets. Comparison of the detailed dropsonde mea-
surements with reanalyses showed good correspondence be-
tween the two on temperature, wind speed, and direction but
poor reanalyses performance in capturing the humidity. Ad-
ditionally, some smaller-scale and near-surface features were
poorly represented across all variables.
One of the most prospective capabilities that Arctic UASs
and dropsondes have to offer is providing observations for
quasi-real-time data assimilation into operational weather
forecast models. There are numerous examples of how extra
dropsonde observations improve the accuracy of forecasts for
winter storms, hurricanes, etc. (e.g., Szunyugh et al., 2000;
Cardinali, 2000). However, because of the dearth of high-
latitude soundings, dropsondes could assist in the improve-
ment of operational weather, marine, and sea ice forecasts on
Atmos. Meas. Tech., 7, 3917–3926, 2014 www.atmos-meas-tech.net/7/3917/2014/
Page 9
J. M. Intrieri et al.: Global Hawk dropsonde observations 3925
1- to 15-day timescales. Larger evaluation data sets will be
needed to assess the total impact of these measurements on
forecast parameters in and downstream of the Arctic.
Additionally, UAS dropsonde technology can have impor-
tant applications in further clarifying Arctic atmospheric pro-
cesses and their effects on sea ice and the ocean surface layer.
In this regard, dropsondes capture small-scale information on
properties, such as stable Arctic boundary layers, low-level
jets, and moisture layers that are not available from reanaly-
ses or satellite observations. We recommend making use of
Arctic UAS missions to survey and document sea ice and
atmospheric parameters in all seasons to support improved
understanding of seasonally varying processes and for input
into seasonal sea ice extent forecasts. Finally, future UAS
flights would offer an excellent source of support for drift-
ing ice stations and field campaigns aimed at understand-
ing the processes governing the complex interplay between
ice, ocean, and atmosphere in a changing Arctic region. Cur-
rently, planning is underway for an international Arctic drift-
ing station that includes deployment of in situ and remote
sensors for a full annual cycle (Multidisciplinary drifting Ob-
servatory for the Study of Arctic Climate (MOSAiC)). Such
as effort would benefit greatly from concurrent UAS drop-
sonde capabilities.
Despite the potential for such measurements, there are
also challenges to overcome. Primary obstacles in the rou-
tine deployment of a UAS like the Global Hawk include
limits with respect to the airspace where UASs can be de-
ployed, identifying the optimal locations where targeted ob-
servations should be obtained, and the cost associated with
UAS missions. In order to justify future deployments, addi-
tional documentation of the benefits is necessary. One po-
tential avenue for doing so is through the use of data-denial
experiments, where data from the Global Hawk dropsonde
system could be assimilated into an ensemble of forecasts
and subsequently withheld from a different ensemble in or-
der to evaluate the improvement of forecast skill when using
these measurements. Data-denial experiments are best done
with extended data sets with good spatial coverage, which,
in and of itself, can be challenging for UAS deployments at
high latitudes, due to potential airspace limitations across in-
ternational borders.
Ultimately, information gained from more frequent Arc-
tic Global Hawk deployments could be of great value to the
atmospheric and sea ice research communities, and the re-
sults shown here begin to illustrate that potential. In con-
junction with additional observational efforts, these mea-
surements could help us to improve our understanding of a
rapidly changing Arctic environment and result in improved
skill for models across many scales.
Acknowledgements. The authors wish to thank the NASA
and NOAA Global Hawk support team, particularly Phil Hall,
Dave Fratello, and Chris Naftel; NCAR dropsonde engineering and
data team; and Son Nghiem (NASA JPL) for the MODIS satellite
imagery. Additionally, we would like to thank Stuart Hinson,
William Blackmore, and Scot Loehrer for their help with the
Barrow, Alaska radiosonde data. G. de Boer acknowledges support
from the National Science Foundation (NSF ARC1203902)
and US Department of Energy (DE-SC0008794). M. D. Shupe
acknowledges the US Department of Energy (DE-SC0007005).
Edited by: A. Stoffelen
References
Cardinali, C.: An assessment of using dropsonde data in numerical
weather prediction, Proc. Second CGC/WMO Workshop on the
Impact of Various Observation Systems on Numerical Weather
Prediction, Toulouse, France, World Meteorological Organiza-
tion, World Weather Watch Tech. Rep. 19, 131–141, 2000.
Cohen, J., Screen, J. A., Furtado, J. C., Barlow, M., Whittle-
son, D., Coumou, D., Francis, J., Dethloff, K., Entekhabi,
D., Overland, J., and Jones, J.: Recent Arctic amplification
and extreme mid-latitude weather, Nat. Geosci., 7, 627–637,
doi:10.1038/ngeo2234, 2014.
Dee, D. P., Uppala, S. M., Simmons, A. J., Berrisford, P., Poli,
P., Kobayashi, S., Andrae, U., Balmaseda, M. A., Balsamo, G.,
Bauer, P., Bechtold, P., Beljaars, A. C. M., van de Berg, L., Bid-
lot, J., Bormann, N., Delsol, C., Dragani, R., Fuentes, M., Geer,
A. J., Haimberger, L., Healy, S. B., Hersbach, H., Hólm, E. V.,
Isaksen, L., Kållberg, P., Köhler, M., Matricardi, M., McNally,
A. P., Monge-Sanz, B. M., Morcrette, J.-J., Park, B.-K., Peubey,
C., de Rosnay, P., Tavolato, C., Thépaut, J.-N., and Vitart, F.: The
ERA-Interim reanalysis: configuration and performance of the
data assimilation system, Q. J. Roy. Meteor. Soc., 137, 553–597,
doi:10.1002/qj.776, 2011.
Donlon, C. J., Martin, M., Stark, J., Roberts-Jones, J., Fiedler, E.,
and Wimmer, W.: The Operational Sea Surface Temperature and
Sea Ice Analysis (OSTIA) system, Remote Sens. Environ., 116,
140–158, 2012.
Hock, T. F. and Franklin, J. L.: The NCAR GPS dropwindsonde, B.
Am. Meteorol. Soc., 80, 407–420, 1999.
Hurrell, J. W., Hack, J. J., Shea, D., Caron, J., and Rosinski, J.:
A new sea surface temperature and sea ice boundary dataset for
the Community Atmosphere Model, J. Climate, 21, 5145–5153,
2008.
Kanamitsu, M., Ebisuzaki, W., Woollen, J., Hnilo, J., Fiorino, M.,
and Potter, G.: NCEP-DOE AMIP- II Reanalysis (R-2), B. Am.
Meteorol. Soc., 83, 1631–1643, 2002.
MacDonald, A. E.: A global profiling system for improved weather
and climate prediction, B. Am. Meteorol. Soc., 86, 1747–1764,
doi:10.1175/BAMS-86-12-1747, 2005.
Manney, G. L., Santee, M. L., Rex, M., Liveseu, N. J., Pitts, M. C.,
Veefkind, P., Nash, E. R., Wohltmann, I., Lehmann, R., Froide-
vaux, L., Poole, L. R., Schoeberl, M. R., Haffner, D. P., Davies,
J., Dorokhov, V., Gernandt, Johnson, B., Kivi, R., Kyro, E.,
Larsen, N., Levelt, P. F., Makshtas, A., McElroy, C. T., Nakajima,
H., Parrondo, M. C., Tarasick, D. W., von der Gathen, P., Walker,
www.atmos-meas-tech.net/7/3917/2014/ Atmos. Meas. Tech., 7, 3917–3926, 2014
Page 10
3926 J. M. Intrieri et al.: Global Hawk dropsonde observations
K. A., and Zinoviev, N. S.: Unprecedented Arctic Ozone loss in
2011, Nature, 478, 469–475, doi:10.1038/nature10556, 2011.
Naftel, J. C.: NASA Global Hawk: A new tool for Earth science
research, NASA Tech. Rep. NASA/TM-2009-214647, 2009.
Nash, J., Oakley, T., Vömel, H., and Li, W.: WMO Intercom-
parisons of high quality radiosonde system, Yangjiang, China,
12 July–3 August 2010, WMO/TD-No. 1580, available at:
http://www.wmo.int/pages/prog/www/IMOP/publications/
IOM-107_Yangjiang.pdf (last access: 21 November 2014),
2011.
Neiman, P. J., Wick, G. A., Moore, B. J., Ralph, F. M., Spackman,
J. R., and Ward, B.: An airborne study of an atmospheric river
over the subtropical Pacific during WISPAR: Dropsonde budget-
box diagnostics, and precipitation impacts in Hawaii and Cali-
fornia, Mon. Weather Rev., 142, 3199–3223, 2014.
Ralph, F. M. and Dettinger, M. D.: Storms, floods and the science
of atmospheric rivers, EOS T. Am. Geophys. Un., 92, 265–266,
doi:10.1029/2011EO320001, 2011.
Stroeve, J. C., Serreze, M. C., Holland, M. M., Kay, J. E., Maslanik,
J., and Barrett, A. P.: The Arctic’s rapidly shrinking sea ice
cover: A research synthesis, Climatic Change, 110, 1005–1027,
doi:10.1007/s10584-011-0101-1, 2012.
Szunyogh, I., Toth, Z., Morss, R. E., Majumdar, S. J., Etherton, B.
J., and Bishop, C. H.: The effect of targeted dropsonde obser-
vations during the 1999 winter storm reconnaissance program,
Mon. Weather Rev., 128, 3520–3537, 2000.
Thorndike, A. S. and Colony, R.: Sea ice motion in response
to geostrophic winds, J. Geophys. Res., 87, 5845–5852,
doi:10.1029/JC087iC08p05845, 1982.
Tjernström, M., Zagar, M., Svensson, G., Cassano, J. J., Pfeifer,
S., Rinke, A., Wyser, K., Dethloff, K., Jones, C., Semmler,
T., and Shaw, M.: Modeling the Arctic boundary layer: An
evaluation of six ARCMIP regional-scale models using data
from the SHEBA project, Bound. Lay.-Meteorol., 117, 337–381,
doi:10.1007/s10546-004-7954-z, 2005.
Vaisala: Vaisala Radiosonde RS91 data sheet, available at: http://
www.vaisala.com/VaisalaDocuments/BrochuresandDatasheets/
RS92SGP-Datasheet-B210358EN-F-LOW.pdf (last access:
21 November 2014), 2012.
Wang, J., Carlson, D. J., Parsons, D. B., Hock, T. F., Laurit-
sen, D., Cole, H. L., Beierle, K., and Chamberlain, E.: Per-
formance of operational radiosonde humidity sensors in di-
rect comparison with a chilled mirror dew-point hygrometer
and its climate implication, Geophys. Res. Lett., 30, 1860,
doi:10.1029/2003GL016985, 2003.
Wang, J., Zhang, L., Lin, P.-H., Bradford, M., Cole, H., Fox,
J., Hock, T., Lauritsen, D., Loehrer, S., Martin, C., van Adel,
J., Weng, C.-H., and Young, K.: Water vapor variability and
comparisons in subtropical Pacific from T-PARC Driftsonde,
COSMIC and reanalyses, J. Geophys. Res., 115, D21108,
doi:10.1029/2010JD014494, 2010.
Wang, J., Hock, T., Cohn, S. A., Martin, C., Potts, N., Reale, T.,
Sun, B., and Tilley, F.: Unprecedented upper-air dropsonde ob-
servations over Antarctica from the 2010 Concordiasi Experi-
ment: Validation of satellite-retrieved temperature profiles, Geo-
phys. Res. Lett., 40, 1231–1236, doi:10.1002/grl.50246, 2013.
Wang, M. and Overland, J. E.: A sea ice free summer Arctic within
30 years-an update from CMIP5 models, Geophys. Res. Lett.,
39, L18501, doi:10.1029/2012GL052868, 2012.
Atmos. Meas. Tech., 7, 3917–3926, 2014 www.atmos-meas-tech.net/7/3917/2014/