R e l i e f R e s ili e n c e S e c u rity I n f o r m a tio n R is k re d u c tio n D evelo p m e nt Food insecurity Poverty D o m estic H u m a nitaria n assista n c e C o n fl ict re s o urc es a s sista n c e GLOBAL HUMANITARIAN ASSISTANCE REPORT 2014
Transcript
Relief
Resili
ence
Security
Information
Risk reduction
Development
Food insecurity
Remi
ttanc
es
Poverty
Domestic Humanitarian
assistance
Natural
disast
ers
Conflict
resourcesassistance
GLOBAL HUMANITARIAN
ASSISTANCEREPORT 2014
GLOBAL HUMANITARIAN ASSISTANCE REpORT 2014
The Global Humanitarian Assistance (GHA) team would like to thank the many people who have been involved in helping us put the GHA Report 2014 together: our colleagues at Development Initiatives, UK and Kenya; Diane Broadley of Broadley Design; Daniele Malerba, Consultant Analyst; Lisa Walmsley, Consultant Editor; and the many experts in the humanitarian community who provided information and advice.
We would like to thank the programme’s funders for their continued support: the Department for Foreign Affairs, Trade and Development, Canada; the Human Rights, Good Governance and Humanitarian Aid Department of the Ministry of Foreign Affairs, the Netherlands; the Swedish International Development Cooperation Agency (Sida); and the Department for International Development (DFID), the United Kingdom.
The GHA report 2014 was written by Sophia Swithern with data analysis and extensive research by the GHA team: Charlotte Latimer, Deepak Sardiwal, Kerry Smith, Dan Sparks and Chloe Stirk. Additional research and analytical contributions were provided by Development Initiatives colleagues in Kenya – Kenneth Okwaroh and Karen Rono – and in the UK – Jordan Beecher, Sarah Dalrymple, Guto Ifan, Duncan Knox, Cat Langdon, Anna Osborne, Tim Strawson and Dan Walton. Jenny Claydon managed editorial production and Daniel Coppard provided editorial guidance. Lydia Poole, consultant, wrote the risk financing section in Chapter 8.
Acknowledgements
Thank you
Contents
Foreword 1Executive summary 3Chapter 1: Who was affected? 9 Humanitarian needs, 2013 10
Chapter 2: How much was given and was it enough? 13 What is humanitarian assistance? 14 International humanitarian response 15 Unmet needs 16 In focus: Requirements per targeted beneficiary in UN-coordinated appeals 19 Red Cross and Red Crescent Movement appeals 22
Chapter 3: Where does it come from? 25 Government donors 26 In focus: Japan 32 Donors outside the OECD DAC group 34 In focus: Gulf states 35 Private donors 36 In focus: NGO fundraising coalitions and Typhoon Haiyan 40 Domestic governments 41 India 42 Philippines 43 Kenya 44
Chapter 4: Where does it go? 45 Top recipients 46 In focus: 2013 ‘Level 3’ emergencies 51 Forgotten crises 52 In focus: Forgotten crisis – Myanmar 54
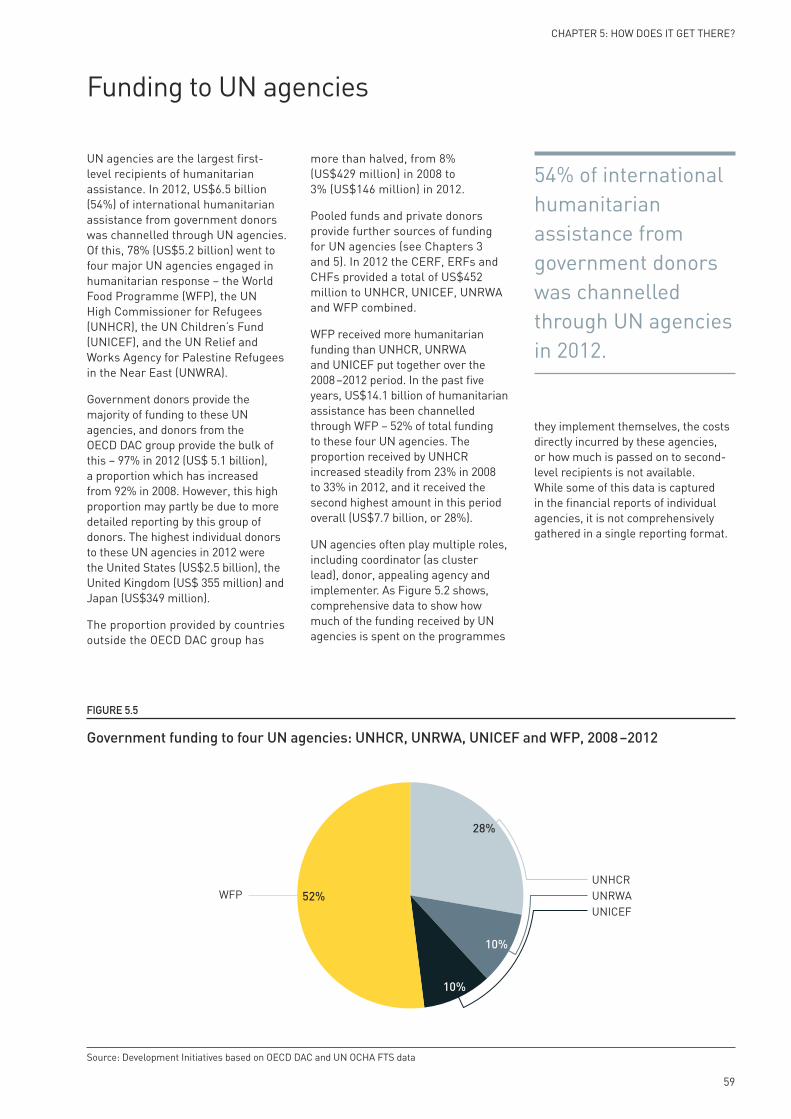
Chapter 5: How does it get there? 55 Channels of delivery 56 Funding to UN agencies 59 Pooled funds 60 Funding channelled through national NGOs 64 In focus: NGO-led pooled funds 66 Military channels 67
Chapter 6: What is it spent on? 69 Types of expenditure 70 Funding by sector in UN-coordinated appeals 74 Cash transfers 75 Disaster prevention, preparedness and risk reduction 77 Gender 79
Chapter 7: How quickly and for how long? 81 Speed and timing of response 82 Long and medium-term humanitarian assistance 85 In focus: Multi-year approaches and the Somalia appeal 86 Financing for resilience 87 Poverty and long-term humanitarian assistance 89
Chapter 8: What other resources are important? 91 Resources available to countries in crisis 93 Remittances 98 Official development assistance 99 Development expenditure on conflict, peace and security 101 Peacekeeping 102 In focus: Public and private support in risk financing 104 Climate financing and disaster risk reduction 106
Chapter 9: Better information for better response 109 Better information about risks and needs 110 Better information about financing flows 112
Chapter 10: Data & guides 115 Methodology and definitions 117 GHA’s unique calculations 121 Data sources 123 Acronyms and abbreviations 125 Reference tables 127 Notes 135
What we do 140
Foreword
Welcome to the Global Humanitarian Assistance Report 2014.
I expect that many of you reading this will be involved in making difficult daily decisions about how to stretch resources – between conflicts, natural disasters and complex emergencies; between high profile and forgotten emergencies; and between the imperatives to act early and stay late. All of these competing demands have to be prioritised in a context where, despite record levels of humanitarian assistance, funds are still not meeting needs.
So where does the Global Humanitarian Assistance (GHA) programme fit into this picture? We believe that better information is essential to inform decisions and get better outcomes for people affected by crisis. Knowing who is spending what, where, and how, can underpin better complementarity and division of labour, so that humanitarian funds can be used most effectively. So, since 2000, we have pulled together all the most recently available data and presented it clearly, accurately and objectively so that, whether you come from the UN, the International Red Cross and Red Crescent Movement, a government department, an NGO or an affected community, you can access a shared and independent evidence base.
In the following pages you will find answers to the basic questions: How many people are affected by crisis? How much humanitarian assistance is there and is it enough? Where is it spent, who provides it and what channels do they spend it through? But you will also find some new analysis on areas that we think are critical.
The first is more detail on the resources, humanitarian and beyond, that touch the lives of crisis-affected people – from development assistance, to government revenues, remittances and peacekeeping. These other flows need to play their part in addressing the multi-dimensional risks and vulnerabilities that can push people into crisis and keep them there.
The second area we highlight in this year’s report is the need for better data, both on resources and also on the impacts of crises on different groups of people. The call for a data revolution has highlighted the poor quality of data available for most fragile and conflict-affected countries, but also the need to disaggregate the information that is available.
For many years, GHA's data has drawn attention to the paradox that humanitarian assistance, often predicated on emergency response, is in practice overwhelmingly long-term. The third new theme in this year’s report is timeliness and duration of funding – examining the data on both speed of response to new or escalating crises as well funding to protracted crises.
In 2015, the world will agree on a set of sustainable development goals. The first goal is the eradication of extreme poverty. The evidence is clear: chronic and extreme poverty is inextricably linked with vulnerability to crisis. We hope that the data and analysis in the Global Humanitarian Assistance Report 2014 will inform serious deliberation on how to break this cycle. In light of this, we will be holding a series of discussions on the future of humanitarian assistance, which we invite you to join – in person or online.
On our website you can find all of the data behind this report, as well as country profiles, crisis briefings and analysis on specific themes. You can also contact our helpdesk with any humanitarian funding data queries. We are always pleased to hear from you, so do share with us your ideas for how we can get better data or make it more useful.
With thanks for your interest,
Judith Randel Executive Director, Development Initiatives
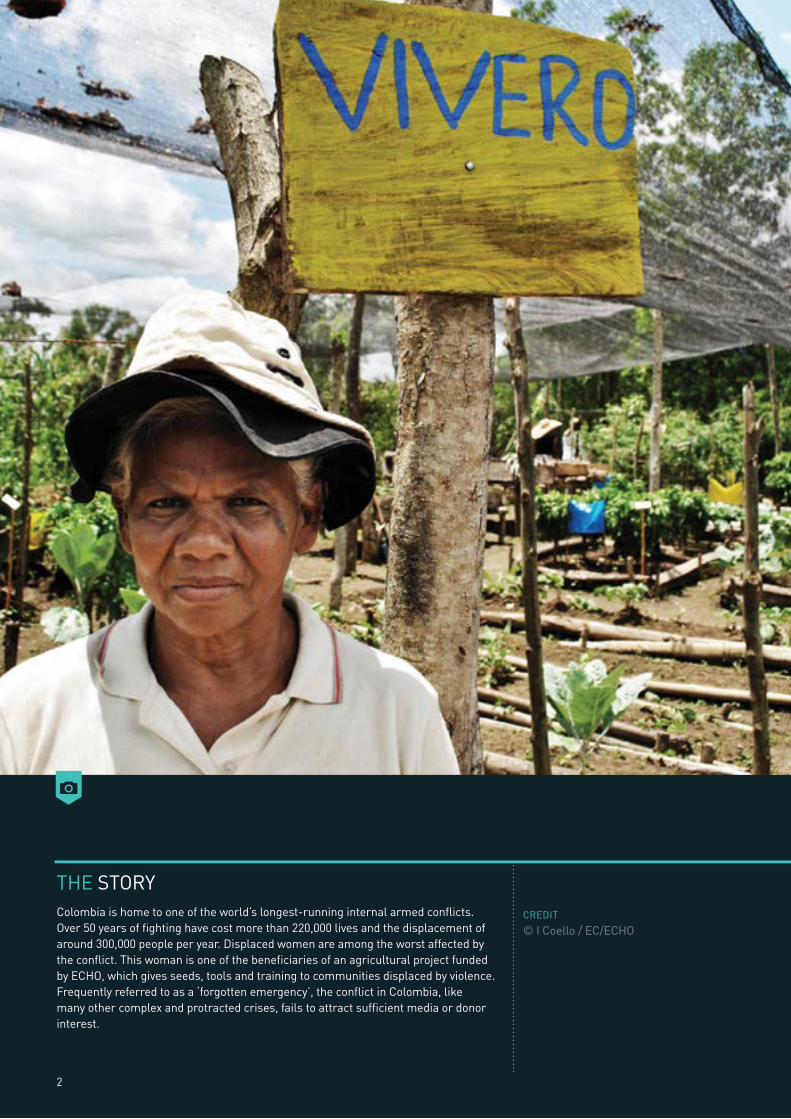
Colombia is home to one of the world’s longest-running internal armed conflicts. Over 50 years of fighting have cost more than 220,000 lives and the displacement of around 300,000 people per year. Displaced women are among the worst affected by the conflict. This woman is one of the beneficiaries of an agricultural project funded by ECHO, which gives seeds, tools and training to communities displaced by violence. Frequently referred to as a ‘forgotten emergency’, the conflict in Colombia, like many other complex and protracted crises, fails to attract sufficient media or donor interest.
THE STORY
2
EXECUTIVE SUMMARY
3
Where does the money come from?
HU
MAN
ITAR
IAN
ASS
ISTA
NCE
IN N
UM
BER
S
Where does it go?
How does it get there?
How quickly and for how long?
What other resources are important?
How much was given...
Who was affected?
US$5.6 bnUS$4.1bn in 2012
Largest increase 2013 Largest decrease 2013
United States
US$723mAustralia
US$-98m
US$16.4 bnUS$13.2bn in 2012
Funding and unmet needs, UN appeals, 2012−2013
top 3 countries
Revised requirements
US$13.2 bn2013
US$10.5bn in 2012
Funding
US$8.5 bn2013
US$6.3bn in 2012
Unmet needs
US$4.6 bn2013
US$4.2bn in 2012
Private voluntary contributions
Government contributions
US$14.1 bnUS$11.8bn in 2012
US$2.3 bnUS$1.5bn in 2012
OECD DAC donors
Other government donors
Top 5 recipients, 2012Top 5 donors, 2013
Humanitarian funding channels, 2012
Multilateral organisations
US$7.4bn
Humanitarian assistance to NGOs, by type, 2012
OECD DAC donor humanitarian spending to long, medium and short term recipients, 2012
Percentage of population affected:
2013
66%SouthSudan
63%Syria
62%Yemen
changesince 2012
changesince 2012
28% 7%
International humanitarian response
US$22 billion2013
US$17.3 bn in 2012
20132013
2013
2013
US$ ?
Domestic governments
changesince 2012
23%
8 years or more3−7 years inclusive
under 3 years
66% 22%12%
Long-term Medium-term
Short-term
Public sectorUS$0.8bn
NGOs US$2.3bn
International Red Cross and Red
Crescent Movement US$1.2bn
61%
9%
19%
7%
International NGO US$1.9bn89%
Local NGO US$15m
National NGO US$US36m
0.7%
1.6%
Largest increase 2012 Largest decrease 2012
Syria
US$1.4mPakistan
US$-891m
United States US$4.7bn
United KingdomUS$1.8bn
Turkey US$1.6bn
Japan US$1.1bn
Germany US$949m
Syria US$1.5bn
South SudanUS$865m
West Bank & Gaza Strip US$654m
Somalia US$627m
Pakistan US$529m
US$419.8bn Domestic
government expenditure
US$6.4bn Peacekeeping
US$28.6bn Development assistance
US$ 43.9bn Remittances
US$5.5bn International humanitarian assistance
...and was it enough?
PAGE45
PAGE55
PAGE91
PAGE81
PAGE9
PAGE13
PAGE25
Funding flows to top humanitarian recipients, 2012
Top forgotten
crisis Myanmar
4
Where does the money come from?
HU
MAN
ITAR
IAN
ASS
ISTA
NCE
IN N
UM
BER
S
Where does it go?
How does it get there?
How quickly and for how long?
What other resources are important?
How much was given...
Who was affected?
US$5.6 bnUS$4.1bn in 2012
Largest increase 2013 Largest decrease 2013
United States
US$723mAustralia
US$-98m
US$16.4 bnUS$13.2bn in 2012
Funding and unmet needs, UN appeals, 2012−2013
top 3 countries
Revised requirements
US$13.2 bn2013
US$10.5bn in 2012
Funding
US$8.5 bn2013
US$6.3bn in 2012
Unmet needs
US$4.6 bn2013
US$4.2bn in 2012
Private voluntary contributions
Government contributions
US$14.1 bnUS$11.8bn in 2012
US$2.3 bnUS$1.5bn in 2012
OECD DAC donors
Other government donors
Top 5 recipients, 2012Top 5 donors, 2013
Humanitarian funding channels, 2012
Multilateral organisations
US$7.4bn
Humanitarian assistance to NGOs, by type, 2012
OECD DAC donor humanitarian spending to long, medium and short term recipients, 2012
Percentage of population affected:
2013
66%SouthSudan
63%Syria
62%Yemen
changesince 2012
changesince 2012
28% 7%
International humanitarian response
US$22 billion2013
US$17.3 bn in 2012
20132013
2013
2013
US$ ?
Domestic governments
changesince 2012
23%
8 years or more3−7 years inclusive
under 3 years
66% 22%12%
Long-term Medium-term
Short-term
Public sectorUS$0.8bn
NGOs US$2.3bn
International Red Cross and Red
Crescent Movement US$1.2bn
61%
9%
19%
7%
International NGO US$1.9bn89%
Local NGO US$15m
National NGO US$US36m
0.7%
1.6%
Largest increase 2012 Largest decrease 2012
Syria
US$1.4mPakistan
US$-891m
United States US$4.7bn
United KingdomUS$1.8bn
Turkey US$1.6bn
Japan US$1.1bn
Germany US$949m
Syria US$1.5bn
South SudanUS$865m
West Bank & Gaza Strip US$654m
Somalia US$627m
Pakistan US$529m
US$419.8bn Domestic
government expenditure
US$6.4bn Peacekeeping
US$28.6bn Development assistance
US$ 43.9bn Remittances
US$5.5bn International humanitarian assistance
...and was it enough?
PAGE45
PAGE55
PAGE91
PAGE81
PAGE9
PAGE13
PAGE25
Funding flows to top humanitarian recipients, 2012
Top forgotten
crisis Myanmar
5
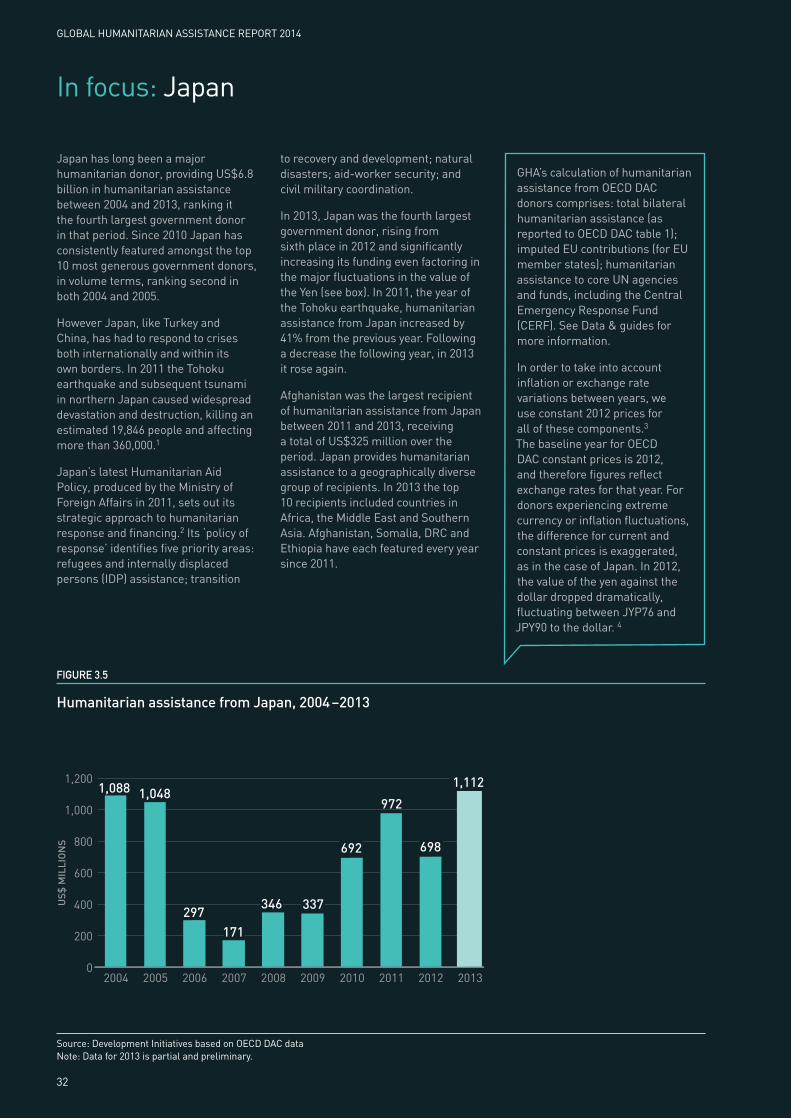
The scale of humanitarian crises and needs in 2013 was extraordinary, as was the level of international humanitarian response, which rose to a record US$22 billion. This is a stark change from 2012, which saw no major new disasters and a slight decline in funding.
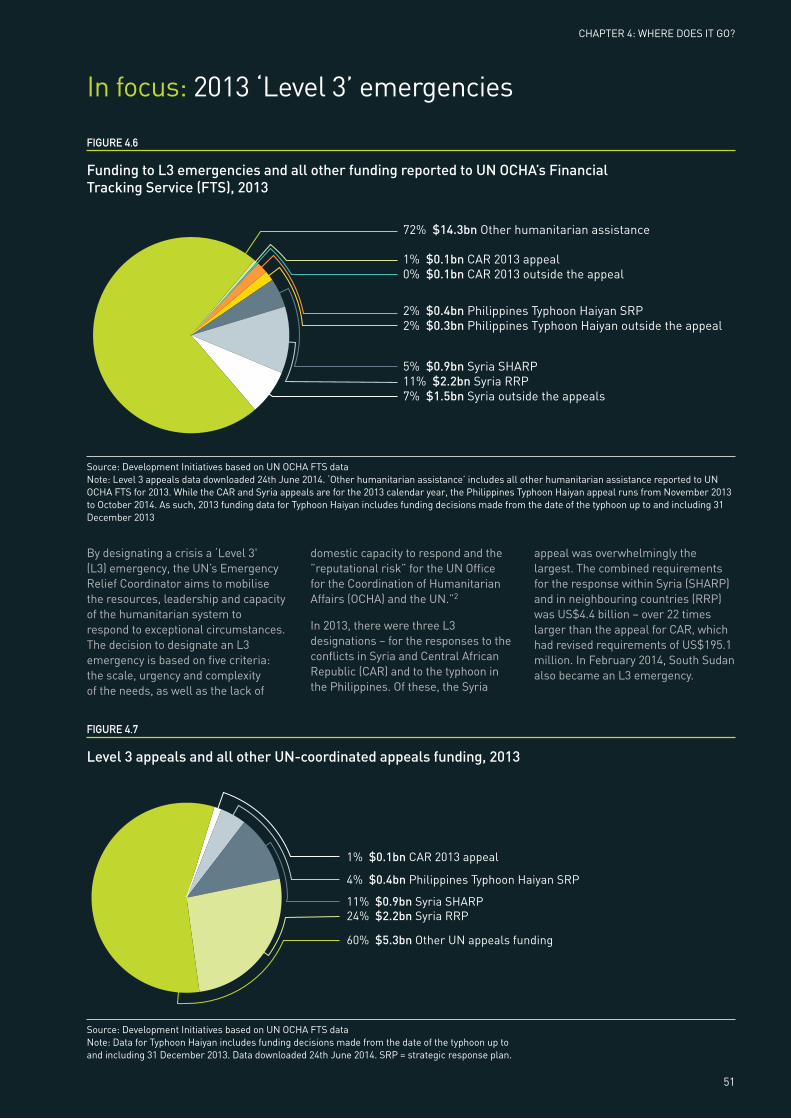
Millions of people were affected by three very different major crises – in Central African Republic (CAR), the Philippines and Syria – each designated as the highest level of emergency (Level 3) by the UN. Individually and combined, these placed unique demands on humanitarian responders and donors. Elsewhere, both on and off the international radar, many more people were caught in lower profile crises including in the Sahel, South Sudan and Yemen. Globally, the number of internally displaced people reached an unprecedented 33.3 million, while the number of refugees increased to 16.7 million.
Both public and private sources of funding increased in 2013, in contrast to the two previous years when both declined. Government donors accounted for three-quarters of the international response, contributing US$16.4 billion. This amounted to a 24% rise from 2012 levels, with nine of the ten largest government donors increasing their funding.
The role of governments outside the Organisation for Economic Cooperation and Development (OECD)’s Development Assistance Committee (DAC) has continued to rise, with this group contributing US$2.3 billion in humanitarian assistance in 2013. This was 58% more than in 2012 and represented 14% of the total from all government donors – double the proportion represented by these donors in 2011.
Funding from private sources, including individuals, trusts, foundations and corporations, also rose steeply – a 35% increase from 2012 levels to reach an estimated US$5.6 billion in 2013. Over the past five years, assistance from these sources has accounted for more than one-quarter (26%) of the total international humanitarian response.
As a barometer of global humanitarian need, UN-coordinated appeals targeted 78 million people for assistance in 2013 and called for US$13.2 billion in funding. Needs are continuing to rise: at the end of July 2014, UN-coordinated appeal requests totalled a record US$16.9 billion – the highest level of requests ever. US$6.0 billion of this was requested for the Syria crisis response alone. Overall, the 2013 appeals were 65% funded. This was the highest proportion since 2009 yet it still left over one-third of identified needs unmet.
Almost one-quarter of international humanitarian assistance (24%) went to just five countries in 2012 (the latest year for which comprehensive recipient data is available). Even before the 2013 escalation in the crisis, Syria received by far the largest volumes of humanitarian assistance: in 2012 it received US$1.5 billion – almost double the US$865 million for South Sudan, the next largest recipient.
Funding priorities, political factors and public profile create an uneven global distribution of assistance, which could be addressed by a better division of labour. Afghanistan, Somalia, Sudan, Ethiopia and the West Bank & Gaza Strip have consistently appeared in the top 10 recipients list over the past five years. Conversely, many crises, including Nepal, Myanmar and Algeria, have tended to remain deprioritised. In 2013 Mauritania’s appeal was 83% funded, compared with Djibouti’s, which was 36% funded.
Funding through pooled funds was on the rise in 2013, accounting for 4.7% of the international humanitarian response – over US$1 billion. Despite the widely recognised importance of national and local NGOs in humanitarian preparedness and response, they only directly accessed US$49 million of international humanitarian assistance in 2013, a decrease of US$2 million from 2012.
However, it remains impossible to trace transactions all the way through the system to know how much these NGOs - or any other implementing partners – actually received indirectly via international agencies. If all actors reported their financial flows in a standardised format, such as to the International Aid
Individually and combined, the crises in CAR, the Philippines and Syria placed unique demands on the humanitarian response. Elsewhere both on and off the international radar, many more people were caught in lower profile crises.
Executive summary
GLOBAL HUMANITARIAN ASSISTANCE REPORT 2014
6
Transparency Initiative (IATI) standard, project-level data could be geocoded and resources could be traced all the way from the donor to the recipient.
Timely response is critical for effective humanitarian action but, even for acute crises triggered by sudden natural disasters, the time it takes for donors to respond at scale can vary enormously. The response to the UN-coordinated Typhoon Haiyan appeal during the first month, for example, was half that of the Indian Ocean earthquake-tsunami appeal in 2005 in terms of needs met. And conflict-related and complex crises see an even slower response: the South Sudan, Syria, CAR and Yemen appeals remained more than 50% unfunded six months after they were launched.
While quick or early response is crucial, humanitarian assistance tends not to be limited to a short emergency phase. Protracted crises continued to capture the bulk of official humanitarian assistance – 66% in 2012 – highlighting the need for both multi-year funding and better links with development spending and other resources.
In most countries, the domestic response to crises goes unreported to international systems. As a result, there is no reliable global figure for this critical and primary response. However, national budgets show that between 2009 and 2012, India’s domestic government resources for disaster relief and risk reduction amounted to US$7 billion, compared to the US$137 million it received in international humanitarian assistance. The government of the Philippines has similarly and consistently eclipsed international contributions and, in response to Typhoon Haiyan, also demonstrated the primary coordinating role a domestic government can play in disaster relief.
With domestic government expenditure across developing countries now exceeding US$6 trillion a year, these resources can support people’s long-term resilience to shocks. But for many countries, particularly those facing entrenched crises, per capita spending by the national government remains low with little prospect of growth. There were an estimated 179.5 million people living in extreme poverty in countries classified as receiving long-term humanitarian assistance in 2012. Almost 40% of long-term humanitarian assistance went to countries with government expenditure of less than US$500 per person per year – one quarter of the developing country average.
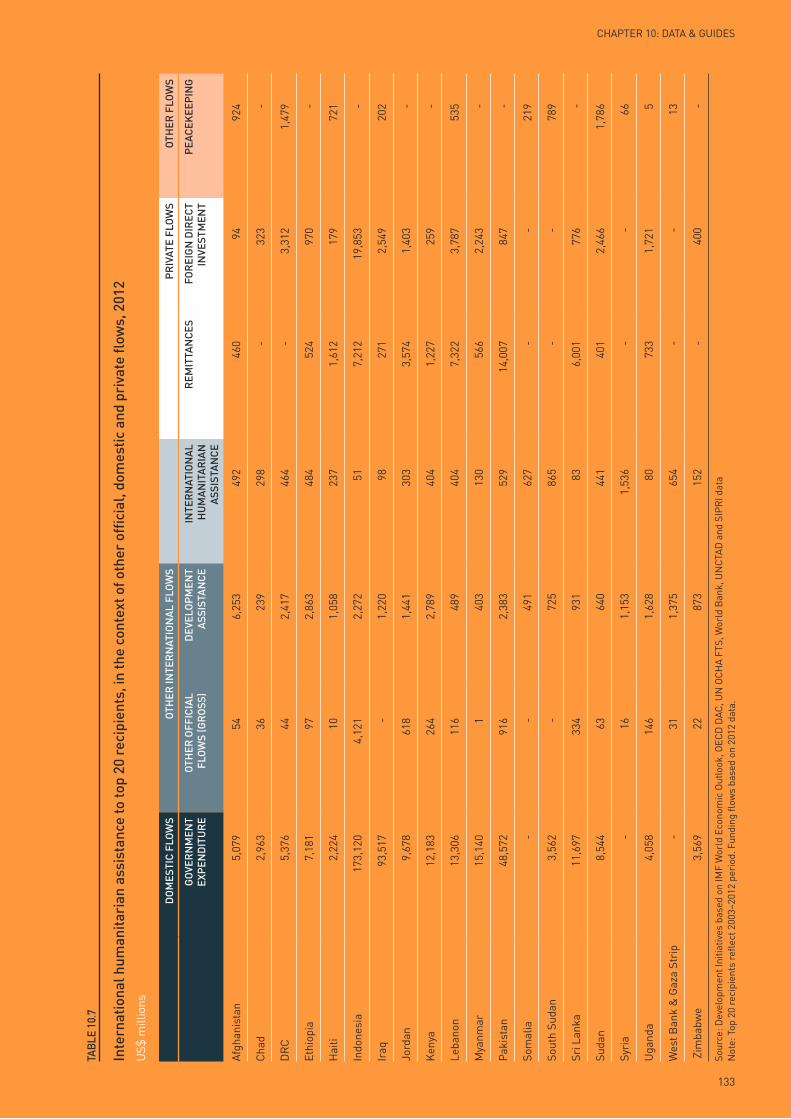
Where governments lack the capacity or the will to address the risks and needs faced by the most vulnerable people, international resources continue to play an important role. As part of this, humanitarian assistance retains a critical and unique function to provide a principled response to crisis-affected populations. It represented around 1% of the combined domestic and international resources of its top 20 recipients in 2012, but a much higher proportion in certain countries.
However, those worst affected by humanitarian crises are also the most vulnerable: people facing poverty, insecurity and marginalisation. This means it is vital that all resources – public, private, domestic and international – are used coherently. Official development assistance (ODA) represents double the proportion of international resources available in the top humanitarian recipients than in other developing countries. Peacekeeping is seven times the proportion. The mix and importance of international resources varies enormously between countries. Remittances constitute 21% of international resources for the largest humanitarian recipients – but in Pakistan, they account for 66%.
Better data is needed to understand the overall resource mix as well as people’s multi-dimensional needs. There has been innovation and progress in these areas over recent years, with many new needs assessment and aid transparency initiatives. Challenges remain in continuing to adapt and implement these – to inform resourcing and improve the lives of crisis-affected people, in the short and the long-term.
Protracted crises continued to capture the bulk of humanitarian assistance. Almost 40% of this long-term spending went to countries with government expenditure of less than US$500 per person per year – one quarter of the developing country average.
Called “the worst crisis people have never heard of” by US Ambassador Samantha Power, the severity of the situation in CAR led the UN to declare it a top priority (or ‘Level 3’) emergency. By mid-February 2014, the humanitarian community was facing the challenge of responding to four such Level 3 emergencies – CAR, Syria, Philippines and South Sudan – as well as other ongoing crises affecting millions of people elsewhere.
THE STORY
8
WHO WAS AFFECTED?
1CHApTER
Following a year of ‘recurring disasters’1 in 2012, 2013 saw a dramatic rise in the number of major humanitarian crises, which affected many tens of millions of people and stretched the international response. The crises in the Central African Republic (CAR), the Philippines and Syria were all classified as ‘Level 3’ (L3) emergencies by the UN – a category reserved for the most severe, large-scale and complex crises. At the same time, crises elsewhere, such as in South Sudan, Sudan and Yemen affected growing numbers of people and called for a significant international humanitarian response.
The exact numbers of people affected remains unknown but an estimated 10.7 million people were newly displaced by conflict or persecution in 2013, compared to 7.6 million people newly displaced in 2012. Globally, the number of internally displaced people (IDPs) rose from 28.8 million in 2012 to an unprecedented 33.3 million in 2013 –and the number of refugees from 15.4 million to 16.7 million. At 51.2 million, the total number of people living in forced displacement in 2013 was at the highest level since the second world war.2
Around 96 million people were affected by disasters such as floods, earthquakes and storms in 2013, compared with 111 million in 2012. While 2013 figures are preliminary estimates, the fall is likely to be explained by the high number of people affected by disasters in China alone in 2012 (45 million).
Not all those affected by disaster in 2013 were in need of international humanitarian assistance. For example, domestic resources responded to the 27 million people in China and 17 million people in India affected by natural disasters. However, as Chapters 7 and 8 show, many countries repeatedly affected by crisis have low domestic capacity to respond.
9
Figure 1.1
Humanitarian needs, 2013Top 10 countries by number of people affected and % of population affected
GLOBAL HUMANITARIAN ASSISTANCE REPORT 2014
10
Source: Development Initiatives based on UN OCHA FTS, UN-coordinated appeals, UNHCR, Centre for Research on the Epidemiology of Disasters (CRED) and World Bank 2012 population data
It is impossible to know exactly how many people are directly or indirectly affected by crises. There are many reasons for this: emergency situations and limited access may mean that broad estimates take the place of precise figures; people who are indirectly or long-term affected may not be counted; unregistered refugees or internally displaced people outside camps might be invisible in statistics; and population data in many fragile states simply does not exist. As Chapter 9 explains, assessment methods must, and do, continue to evolve to give a picture not only of the numbers affected but also the specific nature and severity of different people’s needs and vulnerabilities.
In the absence of exact numbers of crisis-affected people, a number of indicators give some measure of who was affected and where. These include data from the United Nations High Commissioner for Refugees (UNHCR), and data from the Centre for Research on the Epidemiology of Disasters (CRED) on the numbers affected by natural disasters. The numbers targeted by UN appeals also serve as a partial indicator of the scale and location of crises.
On the basis of this data, China and the Philippines had the largest number of people affected by emergencies in 2013. However, South Sudan and Syria had the highest proportion of their populations affected by the ongoing crises there - 66% and 63% respectively. Yemen, CAR and the West Bank & Gaza Strip all saw well over half of their populations affected.
While not all crises generate international appeals, in 2013, UN-coordinated appeals targeted 78 million people for assistance, compared to 95 million in 2012. There may be a number of reasons for this decrease. The 2013 total does not include the two appeals launched following the Bohol earthquake and Typhoon Haiyan in the Philippines towards the end of 2013, which are classified by the UN Office for the Coordination of Humanitarian Affairs’ (OCHA) Financial Tracking Service (FTS) as 2014 appeals. Overall, there were fewer UN-coordinated appeals in 2013 than in 2012 – down to 23 from 26. In 2012, two appeals alone (for the Pakistan Floods Early Recovery and for the Democratic People’s Republic of Korea (DPRK)) targeted over 25 million people – neither of these appeals were repeated in 2013.
As crises developed or emerged over the year, the number of affected people, as counted in UN-coordinated appeals, fluctuated. In South Sudan, UN planning figures from late 2012 estimated 4.6 million affected people. By the end of 2013 this number had escalated to 7.1 million. Numbers in Syria, Yemen, occupied Palestinian territory (oPt) and Niger also climbed during the year. In CAR at the end of 2012, UN planning estimates indicated that the whole population was affected by the conflict. This estimate had fallen to 59% of the population by the end of 2013.
CHAPTER 1: WHO WAS AFFECTED?
11
Source: Development Initiatives based on UN OCHA FTS, UN-coordinated appeals, UNHCR, Centre for Research on the Epidemiology of Disasters (CRED) and World Bank 2012 population data
Notes: Data on the number of people affected in each country is taken from UN-coordinated appeals, or from EM-DAT CRED data where no appeal was launched, as well as UNHCR data on numbers of refugees. Within UN appeals the figures used are those in need of assistance, not those targeted to receive assistance. The numbers include those affected within a country as well as those displaced to neighbouring countries.
In 2014 large numbers of people continued to flee the conflict in Syria – adding to the 2.9 million refugees in camps and host communities in neighbouring Egypt, Iraq, Jordan, Lebanon and Turkey. This new camp in Jordan will be home to some of them.
The scale of the needs of both the refugees and the people remaining inside Syria prompted the largest ever appeals for humanitarian assistance – 36% of UN-coordinated global funding requirements as of July 2014. The sizeable international response to the Syrian crisis drove up the total international humanitarian response to an unprecedented amount in 2013.
THE STORY
12
The international community responded to the dramatic scale of need in 2013 with a record US$22 billion in funding. This was a significant increase from the two previous years – and over US$2.5 billion more than the previous peak of US$19.4 billion in 2010, the year of the Haiti earthquake and the Pakistan floods. It also represented a sharp turnaround from the declines seen in 2011 and 2012.The international response to the crisis in Syria accounts for a large part of the 2013 rise. In 2013, 37% (US$3.1 billion) of funding for UN-coordinated appeals went to the Syria crisis.
Yet even at these record levels of funding, under two-thirds (65%) of the needs outlined in the UN-coordinated appeals were met in 2013. There was an increase in the overall level of funding to the appeals compared with recent years, but the shortfall remains significant.
By the end of July 2014, UN-coordinated appeal requirements had increased by 31% on the previous year to US$16.9 billion – only 37% of which had been met. This low level and slow start has implications for both delivery and planning. Both requirements and funding are expected to rise by the end of 2014.
HOW MUCH WAS GIVEN
2CHApTER
and was it enough?
13
WHAT IS HUMANITARIAN ASSISTANCE?
Humanitarian action is designed to save lives, alleviate suffering and maintain and protect human dignity during and in the aftermath of emergencies. This definition is set out in the Good Humanitarian Donorship (GHD) Principles and Good Practice guidelines.1 In this report, humanitarian assistance, when used in the context of data, refers to the financial resources for this action.
As well as the fact that it is focused on emergencies, humanitarian assistance is different from other forms of foreign and development assistance because it is intended to be governed by the key humanitarian principles of:
• humanity – saving human lives and alleviating suffering wherever it is found
• impartiality – acting solely on the basis of need, without discrimination between or within affected populations
• neutrality – acting without favouring any side in an armed conflict or other dispute
• independence – ensuring autonomy of humanitarian objectives from political, economic, military or other objectives.
These principles are set out in the fundamental principles of the Red Cross and Red Crescent Movement, reaffirmed in UN General Assembly resolutions and enshrined in numerous humanitarian standards and guidelines such as the Sphere Humanitarian Charter.
There is no universal obligation or system for reporting expenditure on humanitarian assistance (see Chapter 9), so what is counted in humanitarian assistance reporting can vary by donor. However, the Organisation for Economic Co-operation and Development (OECD) Development Assistance Committee (DAC) does set out clear definitions of humanitarian assistance for those donors (both member and non-member) that report to its databases.
In this report, we use the term ‘international humanitarian response’ to describe the combined humanitarian assistance of:
• international governments
• individuals, trusts and foundations, and private companies and corporations.
Figures for international humanitarian response are our own calculations based on the latest available data from several sources. For a fuller explanation of our methodology and definitions, please see the ‘Data & guides’ section at the end of this report.
GLOBAL HUMANITARIAN ASSISTANCE REPORT 2014
14
0
5
10
15
20
25
2008 2009 2010 2011 2012 2013
US$
BIL
LIO
NS
13.1
5.1
18.2
12.6
3.8
16.4
13.9
5.6
19.4
13.7
18.6
13.2
4.1
17.3
16.4
5.6
22.0
4.9
Total Governments and EU institutionsPrivate
International donors responded to the dramatic scale of need in 2013 with a record US$22 billion in funding. This was a rise of 27% from the US$17.3 billion given the previous year and of 13% from the previous record of US$19.4 billion in 2010 – the year of the Haiti earthquake and the Pakistan floods.
The sharp rise was a turnaround from the lower levels of funding witnessed in 2011 and 2012. The international humanitarian response contracted by 4% between 2010 and 2011 and by a further 7% between 2011 and 2012.
This international humanitarian response includes funding reported from government donors and EU institutions, and from a diverse mix
of non-governmental (or private) sources – including individuals, trusts and foundations, and companies and corporations. As shown in Figure 2.1, and as detailed in Chapter 3, both government and private donors increased their funding in 2013.
A large part of the increase in 2013 was directed to the Syria crisis. A combined total of US$4.7 billion in funding was recorded in the UN Office for the Coordination of Humanitarian Affairs (OCHA) Financial Tracking Service (FTS) for responses both within Syria and in neighbouring refugee-hosting countries.
Figure: 2.1
International humanitarian response, 2008 –2013
The international community responded to the dramatic scale of needs in 2013 with a record US$22 billion of funding.
CHAPTER 2: HOW MUCH WAS GIvEN AND WAS IT ENOUGH?
International humanitarian response
15
Source: Development Initiatives based on OECD DAC, UN OCHA FTS data and GHA's unique dataset for private voluntary contributions Notes: Figures for 2013 are preliminary estimates (see Data & guides for further details).
2.2 4.0 3.9 4.0 5.7 7.1 8.0 5.8 6.3 8.5
1.3
2.0 2.0 1.6
2.3
2.8 4.9
3.6 4.2
4.6
3.5
6.0 5.9 5.5
8.1
10.0
12.9
9.5 10.5
13.2
2004 2005 2006 2007 2008 2009 2010 2011 2012 2013
Unmet needsFundingRevised requirements 0
2
4
6
8
10
12
14
US$
BIL
LIO
NS
Unmet needs
In 2013, US$8.5 billion in humanitarian funding was channelled through UN-coordinated appeals. However, most donors channel some of their assistance outside of these appeals, so the total international humanitarian response includes funding to many programmes, recipients and crises that were not covered by the 23 UN-coordinated appeals in 2013. For example, the requirements of the International Red Cross and Red Crescent Movement are not covered by these appeals (see pages 22 and 23), nor were certain crises, such as the two cyclones in Madagascar in 2013.
Despite the limitations of using UN-coordinated appeals as a measure of funding according to need, they do provide an interesting, if partial, barometer. The US$8.5 billion, provided in response to the US$13.2 billion requested in 2013, was a record sum. As a result, the appeals were 65% funded at the end of the year (compared with 60% in 2012). Yet despite this rise, the share of needs met fell short of the 2004 –2013 average (66%) and also left over one-third of appeal requirements unmet.
Figure: 2.2
Funding and unmet needs, UN-coordinated appeals, 2004–2013
GLOBAL HUMANITARIAN ASSISTANCE REPORT 2014
16
Source: Development Initiatives based on UN OCHA FTS data Notes: 2012 data includes the Syria RRP 2012 monitored by UNHCR. UN-coordinated appeals include SRPs and those inside and outside the previously named consolidated appeal process (CAP).
Source: Development Initiatives based on UN OCHA FTS data
The UN-coordinated appeals for Syria in 2013 were on a scale never seen before – and drove up total funding requirements. Together, the combined requirements of the Syria Humanitarian Assistance Response Plan (SHARP) and the Syria Regional Refugee Response Plan (RRP) amounted to US$4.4 billion. These requirements had already been outstripped by July 2014 totalling over US$6 billion; US$2.3 billion for humanitarian assistance within Syria and US$3.7 billion for support to refugees and host communities in neighbouring countries.
As the GHD principles state, funding humanitarian action in new crises should not adversely affect meeting needs in ongoing crises. It is hard to quantify the impact the Syria crisis has had on other crises in terms of funding and delivery of humanitarian response. However, at an aggregate, rather than individual country level, it appears not to have led to a reduction in funding to other UN-coordinated appeals. Excluding the appeals for Syria in 2013, the total sum requested was lower than the previous year – falling from US$9.7 billion in 2012 to US$8.8 billion in
2013. The total proportion of needs met in the appeals, excluding Syria, actually increased slightly from 60% in 2012 to 62% in 2013.
There was, however, significant variation between appeals, as Chapter 4 elaborates. Out of the 23 appeals in 2013, 14 were below this overall 62% level of funding and three had less than half their needs met. Djibouti received the lowest level funding (36%), despite having the third smallest appeal. By way of contrast, Mauritania had the highest proportion (83%) of its requirements met.
30
51
70
107
108
109
139
147
152
195
355
401
474
477
510
663
706
893
985
1,07
2
1,15
3
1,41
0
2,98
2
40%
52%
36%
83%
54%
81%
55% 52%
47% 53%
81%
65%
74%
56%
58%
56%
55% 71%
56%
75%
51% 67%
73%
0%
10%
20%
30%
40%
50%
60%
70%
80%
90%
0
500
1,000
1,500
2,000
2,500
3,000
3,500
Cub
a
Mya
nmar
− K
achi
n
Djib
outi
Mau
rita
nia
Phi
lippi
nes
Min
dana
o
Mya
nmar
− R
akhi
ne
Bur
kina
Fas
o
Zim
babw
e
Hai
ti
CA
R
Nig
er
oPt
Afg
hani
stan
Mal
i
Cha
d
Ken
ya
Yem
en
DR
C
Suda
n
Rep
ublic
of S
outh
Sud
an
Som
alia
Syri
a SH
AR
P
Syri
a R
RP
Revised requirements % needs met
US$
MIL
LIO
NS
CHAPTER 2: HOW MUCH WAS GIvEN?CHAPTER 2: HOW MUCH WAS GIvEN?
Figure 2.3
Revised requirements and proportion of needs met, UN-coordinated appeals, 2013
17
Source: Development Initiatives based on UN OCHA FTS data Notes: Data downloaded 28 July 2014, and subject to change. South Sudan Regional is a Regional Refugee Response Plan covering interventions in Ethiopia, Kenya, Sudan and Uganda.
Figure 2.4
Revised requirements and proportion of needs met, UN-coordinated appeals, 2014
The UN-coordinated appeals process changed in 2014 with the aim of achieving a more accurate picture of needs than the previous consolidated appeal process (CAP) allowed. The CAP had a number of recognised limitations, including assessments of needs skewed by what agencies intended to deliver or could hope to receive. So the UN appeal process for each crisis or country is now split into a number of parts to reflect the different stages of the humanitarian programme cycle – including a humanitarian needs overview and a strategic response plan (SRP), which details the funding required.
By the end of July 2014, 29 SRPs had been published with total requirements of US$16.9 billion. This is not a definitive figure for 2014 –requirements may continue to rise as crises escalate or as new SRPs are added.
Of this US$16.9 billion, a total of US$6.2 billion had been funded by July meaning that seven months into the year, 37% of requirements had been met, with significant implications for planning and delivery of a timely and effective humanitarian response (see Chapter 7).
The two UN appeals for the Syria crisis account for 36% (US$6.5 billion) of the 2014 requirements, and 32% of the total met. Gambia, Nigeria Senegal and Cameroon, which have not had appeals since 2000, all have SRPs in 2014. The levels of funding were low, at 11%, 14%, 20% and 22% respectively.
US$
MIL
LIO
NS
13
14
26
34
50
74
75
108
109
117
119
168
192
312
391
394
406
565
568
586
592
623
781
832
933
988
1,80
2
2,27
6
3,74
1
45%
15% 11%
47% 41%
23%
14%
45%
19%
22%
20%
34%
43%
15%
42% 43%
48%
39% 34%
27%
40%
26%
59%
31% 29%
46% 50%
27%
37%
0%
10%
20%
30%
40%
50%
60%
70%
0
500
1,000
1,500
2,000
2,500
3,000
3,500
4,000
Phi
lippi
nes-
Zam
boan
ga c
risi
s
Rep
ublic
of C
ongo
Gam
bia
Phi
lippi
nes
- B
ohol
Ear
thqu
ake
Sahe
l Reg
iona
l
Djib
outi
Nig
eria
Mau
rita
nia
Bur
kina
Fas
o
Cam
eroo
n
Sene
gal
Hai
ti
Mya
nmar
Iraq
Nig
er oPt
Afg
hani
stan
CA
R
Mal
i
Sout
h Su
dan
Reg
iona
l
Yem
en
Cha
d
Phi
lippi
nes
- Ty
phoo
n H
aiya
n
DR
C
Som
alia
Suda
n
Rep
ublic
of S
outh
Sud
an
Syri
a SH
AR
P
Syri
a R
RP
Revised requirements % needs met
GLOBAL HUMANITARIAN ASSISTANCE REPORT 2014
18
In focus: Requirements per targeted beneficiary of UN-coordinated appeals
CHAPTER 2: HOW MUCH WAS GIvEN?
19
Figure 2.5
Average requirements per targeted beneficiary of UN-coordinated appeals, 2012-2014
Source: Development Initiatives based on data from UN OCHA FTS, UN-coordinated appeals, UN OCHA Overview of Global Humanitarian Action at Mid-Year 2013 and UN OCHA Overview of Global Humanitarian Action, 2014 Note: Data downloaded 28 July 2014, 2014 figure subject to change.
2012 2013 2014
US$110
US$168
US$204
UN-coordinated appeals use the term ‘targeted beneficiaries’ to refer to the number of people that its programmes aim to reach with humanitarian assistance. As of July 2014, there were 83 million such targeted beneficiaries. This compares with 78 million in 2013 and 95 million in 2012.
By end July 2014, SRP requirements per targeted beneficiary stood at US$204. This is the second consecutive annual increase, up from US$168 per targeted beneficiary in 2013 and US$110 per targeted beneficiary in 2012.
The aggregated figures mask significant variations between countries. For example, as of July 2014 the South Sudan RRP (covering Ethiopia, Kenya, Sudan and Uganda) requested the highest amount per beneficiary (US$920). This is followed by the Syria RRP (US$576, up from US$559 in 2013) and the Somalia appeal (US$467, up from $303 in 2013). At the other end of the scale, just under half of the 2014 appeals have levels below US$200 per targeted beneficiary, the lowest being Nigeria and Cameroon (US$9 and US$19 respectively).
The costs of providing humanitarian assistance are bound to differ according to the type of needs, location and context. For example, transporting a water borehole drilling rig to a remote, conflict-affected area will cost more than food distribution in an accessible, organised camp setting. Costs associated with the food component of appeals alone can vary widely depending on factors such as:
• specific nutritional needs – for example, a food distribution with a heavy nutrition component costs more than a straightforward school feeding programme
• variation in food prices between regions and countries – for example, purchasing food locally for the Syria response may cost more per person than purchasing comparable food items in Afghanistan
• transport and access – for example, costs will rise where air transport is required
• project duration – for example, some crises require short-term emergency feeding programmes while others may require ongoing food security operations.
There are many methodological challenges in arriving at an overall appeal budget based on costing the needs per beneficiary. However, as explained in Chapter 9, a number of SRPs – including those for Afghanistan and Democratic Republic of Congo (DRC) – have changed their costing models to try to do just this, and so move away from the project-based costing model of the former UN CAP appeals.
By July 2014, requirements per targeted beneficiary stood at US$204, up from US$168 in 2013.
Phi
lippi
nes
- Ty
phoo
n H
aiya
n
Djib
outi
Mya
nmar
Som
alia
Rep
ublic
of S
outh
Sud
an
Iraq
Sout
h Su
dan
Reg
iona
l
Syri
a (S
HA
RP
)
Hai
ti
Suda
n
oPt
Djib
outi
Som
alia
R
epub
lic o
f Sou
th S
udan
Ken
ya
Mya
nmar
– K
achi
n
Syri
a (R
RP
)
Mya
nmar
- R
akhi
ne
Mau
rita
nia
260
296
312
383
425
467
576
450
920
223
229
233
267
303
357
390
427
559
611
149
233
263
279
302
308
360
385
489
687
DR
C
Suda
n
oPt
Sri L
anka
Rep
ublic
of S
outh
Sud
an
Libe
ria
Dijb
outi
Som
alia
Ken
ya
Syri
a R
RP
2012
2013
2014 Cha
d25
1
Yem
en78
31
M
ali
Nig
eria
9
Cam
eroo
n19
12
K
orea
DP
R
Bur
kina
Fas
o43
A
fgha
nist
an81
61
DR
C53
Le
soth
oSe
nega
l11
3
86
Zim
babw
e65
C
AR
N
iger
113
122
CA
R97
Ye
men
P
hilip
pine
s-Za
mbo
anga
198
Mau
rita
nia
204
169
Hai
ti 10
4 C
had
oPt
207
197
N
iger
109
Mau
rita
nia
CA
R22
620
7 Sy
ria
(SH
AR
P)
120
Hai
ti
Syri
a (R
RP
)24
5 21
6 P
hilip
pine
s M
inda
nao
139
Syri
a (S
HA
RP
)
92
Yem
en
77
Nig
erG
ambi
a14
2
Mal
i15
2 96
B
urki
no F
aso
83
Afg
hani
stan
111
Mal
i85
P
hilip
pine
s Su
dan
167
DR
C17
3 12
1 C
had
91
Cot
e d'
Ivoi
re
10
Cub
a 47
P
akis
tan
Bur
kina
Fas
o84
Phi
lippi
nes
− B
ohol
Ear
thqu
ake
92
54
Afg
hani
stan
52
Zim
babw
e
Phi
lippi
nes
- Ty
phoo
n H
aiya
n
Djib
outi
Mya
nmar
Som
alia
Rep
ublic
of S
outh
Sud
an
Iraq
Sout
h Su
dan
Reg
iona
l
Syri
a (S
HA
RP
)
Hai
ti
Suda
n
oPt
Djib
outi
Som
alia
R
epub
lic o
f Sou
th S
udan
Ken
ya
Mya
nmar
– K
achi
n
Syri
a (R
RP
)
Mya
nmar
- R
akhi
ne
Mau
rita
nia
260
296
312
383
425
467
576
450
920
223
229
233
267
303
357
390
427
559
611
149
233
263
279
302
308
360
385
489
687
DR
C
Suda
n
oPt
Sri L
anka
Rep
ublic
of S
outh
Sud
an
Libe
ria
Dijb
outi
Som
alia
Ken
ya
Syri
a R
RP
2012
2013
2014 Cha
d25
1
Yem
en78
31
M
ali
Nig
eria
9
Cam
eroo
n19
12
K
orea
DP
R
Bur
kina
Fas
o43
A
fgha
nist
an81
61
DR
C53
Le
soth
oSe
nega
l11
3
86
Zim
babw
e65
C
AR
N
iger
113
122
CA
R97
Ye
men
P
hilip
pine
s-Za
mbo
anga
198
Mau
rita
nia
204
169
Hai
ti 10
4 C
had
oPt
207
197
N
iger
109
Mau
rita
nia
CA
R22
620
7 Sy
ria
(SH
AR
P)
120
Hai
ti
Syri
a (R
RP
)24
5 21
6 P
hilip
pine
s M
inda
nao
139
Syri
a (S
HA
RP
)
92
Yem
en
77
Nig
erG
ambi
a14
2
Mal
i15
2 96
B
urki
no F
aso
83
Afg
hani
stan
111
Mal
i85
P
hilip
pine
s Su
dan
167
DR
C17
3 12
1 C
had
91
Cot
e d'
Ivoi
re
10
Cub
a 47
P
akis
tan
Bur
kina
Fas
o84
Phi
lippi
nes
− B
ohol
Ear
thqu
ake
92
54
Afg
hani
stan
52
Zim
babw
e
GLOBAL HUMANITARIAN ASSISTANCE REPORT 2014
20
Figu
re 2
.6
Req
uire
men
ts p
er ta
rget
ed b
enefi
ciar
y in
UN
-coo
rdin
ated
app
eals
: 201
2, 2
013
and
2014
U
S$
Phi
lippi
nes
- Ty
phoo
n H
aiya
n
Djib
outi
Mya
nmar
Som
alia
Rep
ublic
of S
outh
Sud
an
Iraq
Sout
h Su
dan
Reg
iona
l
Syri
a (S
HA
RP
)
Hai
ti
Suda
n
oPt
Djib
outi
Som
alia
R
epub
lic o
f Sou
th S
udan
Ken
ya
Mya
nmar
– K
achi
n
Syri
a (R
RP
)
Mya
nmar
- R
akhi
ne
Mau
rita
nia
260
296
312
383
425
467
576
450
920
223
229
233
267
303
357
390
427
559
611
149
233
263
279
302
308
360
385
489
687
DR
C
Suda
n
oPt
Sri L
anka
Rep
ublic
of S
outh
Sud
an
Libe
ria
Dijb
outi
Som
alia
Ken
ya
Syri
a R
RP
2012
2013
2014 Cha
d25
1
Yem
en78
31
M
ali
Nig
eria
9
Cam
eroo
n19
12
K
orea
DP
R
Bur
kina
Fas
o43
A
fgha
nist
an81
61
DR
C53
Le
soth
oSe
nega
l11
3
86
Zim
babw
e65
C
AR
N
iger
113
122
CA
R97
Ye
men
P
hilip
pine
s-Za
mbo
anga
198
Mau
rita
nia
204
169
Hai
ti 10
4 C
had
oPt
207
197
N
iger
109
Mau
rita
nia
CA
R22
620
7 Sy
ria
(SH
AR
P)
120
Hai
ti
Syri
a (R
RP
)24
5 21
6 P
hilip
pine
s M
inda
nao
139
Syri
a (S
HA
RP
)
92
Yem
en
77
Nig
erG
ambi
a14
2
Mal
i15
2 96
B
urki
no F
aso
83
Afg
hani
stan
111
Mal
i85
P
hilip
pine
s Su
dan
167
DR
C17
3 12
1 C
had
91
Cot
e d'
Ivoi
re
10
Cub
a 47
P
akis
tan
Bur
kina
Fas
o84
Phi
lippi
nes
− B
ohol
Ear
thqu
ake
92
54
Afg
hani
stan
52
Zim
babw
e
Phi
lippi
nes
- Ty
phoo
n H
aiya
n
Djib
outi
Mya
nmar
Som
alia
Rep
ublic
of S
outh
Sud
an
Iraq
Sout
h Su
dan
Reg
iona
l
Syri
a (S
HA
RP
)
Hai
ti
Suda
n
oPt
Djib
outi
Som
alia
R
epub
lic o
f Sou
th S
udan
Ken
ya
Mya
nmar
– K
achi
n
Syri
a (R
RP
)
Mya
nmar
- R
akhi
ne
Mau
rita
nia
260
296
312
383
425
467
576
450
920
223
229
233
267
303
357
390
427
559
611
149
233
263
279
302
308
360
385
489
687
DR
C
Suda
n
oPt
Sri L
anka
Rep
ublic
of S
outh
Sud
an
Libe
ria
Dijb
outi
Som
alia
Ken
ya
Syri
a R
RP
2012
2013
2014 Cha
d25
1
Yem
en78
31
M
ali
Nig
eria
9
Cam
eroo
n19
12
K
orea
DP
R
Bur
kina
Fas
o43
A
fgha
nist
an81
61
DR
C53
Le
soth
oSe
nega
l11
3
86
Zim
babw
e65
C
AR
N
iger
113
122
CA
R97
Ye
men
P
hilip
pine
s-Za
mbo
anga
198
Mau
rita
nia
204
169
Hai
ti 10
4 C
had
oPt
207
197
N
iger
109
Mau
rita
nia
CA
R22
620
7 Sy
ria
(SH
AR
P)
120
Hai
ti
Syri
a (R
RP
)24
5 21
6 P
hilip
pine
s M
inda
nao
139
Syri
a (S
HA
RP
)
92
Yem
en
77
Nig
erG
ambi
a14
2
Mal
i15
2 96
B
urki
no F
aso
83
Afg
hani
stan
111
Mal
i85
P
hilip
pine
s Su
dan
167
DR
C17
3 12
1 C
had
91
Cot
e d'
Ivoi
re
10
Cub
a 47
P
akis
tan
Bur
kina
Fas
o84
Phi
lippi
nes
− B
ohol
Ear
thqu
ake
92
54
Afg
hani
stan
52
Zim
babw
e
CHAPTER 2: HOW MUCH WAS GIvEN?
21
Sour
ce: D
evel
opm
ent I
nitia
tives
bas
ed o
n da
ta fr
om U
N O
CH
A FT
S, U
N-c
oord
inat
ed a
ppea
ls, U
N O
CH
A O
verv
iew
of G
loba
l Hum
anita
rian
Act
ion
at M
id-Y
ear
2013
and
UN
OC
HA
Ove
rvie
w o
f Glo
bal H
uman
itari
an A
ctio
n, 2
014
Not
es: 2
012
data
dow
nloa
ded
2 Ju
ne 2
014,
sub
ject
to c
hang
e. D
oes
not i
nclu
de th
e U
N-c
oord
inat
ed a
ppea
l for
the
Rep
ublic
of C
ongo
for
whi
ch th
e am
ount
req
uest
ed a
nd th
e ta
rget
pop
ulat
ion
figur
es w
ere
bein
g am
ende
d at
the
time
of a
naly
sis;
nor
the
regi
onal
Sah
el a
ppea
l, w
hich
com
bine
s ni
ne c
ount
ry-s
peci
fic a
ppea
ls (a
lrea
dy in
clud
ed s
epar
atel
y in
the
anal
ysis
) with
an
addi
tiona
l reg
iona
l com
pone
nt. 2
013
data
dow
nloa
ded
14 M
ay 2
014.
Incl
udes
CAP
and
no
n-C
AP a
ppea
ls (C
uba,
Zim
babw
e, M
yanm
ar K
achi
n, M
yanm
ar R
akhi
ne, S
yria
RR
P).
2014
dat
a do
wnl
oade
d 28
Jul
y 20
14, a
nd s
ubje
ct to
cha
nge.
Red Cross and Red Crescent Movement appeals
GLOBAL HUMANITARIAN ASSISTANCE REPORT 2014
22
The International Federation of Red Cross and Red Crescent Societies (IFRC) and the International Committee of the Red Cross (ICRC) have their own appeal processes, which are separate from the UN appeals system. The primary focus of the IFRC is to respond to natural disasters, while the ICRC focuses on conflict and protracted crises. While the IFRC issues crisis-specific appeals, the ICRC produces an annual emergency appeal, which is broken down by needs per country, followed by specific appeals in the event of increased needs. At US$1.2 billion, the ICRC 2014 emergency appeal has the highest initial budget to date.2
Budget extensions added throughout the year (i.e. in addition to the initial budget) can be substantial. For example, initial budget requirements for the ICRC emergency appeal in 2013 were set at just under
US$1.1 billion but eight budget extensions were launched in response to major escalations in needs that year. The largest of these was for US$67 million in response to the Syria crisis.3
ICRC emergency appeals are consistently well-funded compared to most UN appeals with over 80% of funding requirements met each year since 2009. And in 2013, responding to the increase in need, its appeal received US$1.1 billion – a record level of funding, which actually exceeded the initial pre-extension budget.
Unmet needsFundingInitial requirements 0
200
400
600
800
1,000
1,200
1,400
US$
MIL
LIO
NS
2009
858
178
1,036
2010
863
141
1,004
2011
1,125
55 1,180
2012
915
119
1,034
2013
1,146
1,067
2014
1,192
Figure 2.7
Funding to ICRC emergency appeals against requirements, 2009–2014
Source: Development Initiatives based on ICRC annual reports Note: No income data currently available for 2014.
CHAPTER 2: HOW MUCH WAS GIvEN?
23
US$
MIL
LIO
NS
50
472
90 117 65 9
58
139
100 59
533
148
256
165
0
100
200
300
400
500
600
2009 2010 2011 2012 2013
Unmet needsFundingRequirements
60
Figure 2.8
Funding to IFRC emergency appeals against requirements, 2009–2013
Source: Development Initiatives based on IFRC annual reports Notes: Figures in this graph may differ from previous years reports. Each year GHA reviews all the latest emergency appeal documents, figures and dates are often subject to change.
IFRC’s natural disaster focus creates volatile funding requirements, with peaks when there is a major disaster. The IFRC’s total requirement for appeals launched in 2013 stands at US$165 million, of which 39% had been funded by April 2014. This represents a reduction in both volume and proportion of needs met from 2012's US$256 million appeal, which was 46% funded.
While many high profile crises have both IFRC and UN-coordinated appeals, IFRC does also launch appeals for which there are no other international appeals. In 2013, these included:4
• US$1.6 million to reach 40,000 people affected by Cyclone Mahasen in Bangladesh – 71% funded
• US$3.3 million to reach over 52,000 people affected by floods in several regions across Kenya – 37% funded
• US$1.3 million to reach 11,000 households affected by drought in north- western Namibia – 80% funded
• US$2.2 million to reach 23,100 people affected by a tropical cyclone that hit Puntland, Somalia – 31% funded from latest update.5
As explained in Chapter 3, the IFRC has consistently relied on private sources for the majority of its funding (65% –96% between 2008 and 2012). This is in stark contrast to the ICRC, which derives the majority from government donors.
CREDITPeople affected by humanitarian crises receive assistance from a diverse mix of government and private donors, both international and domestic. This mix varies enormously depending on the political, economic and social context. The international humanitarian response reached an unprecedented US$22 billion in 2013 – it is estimated that government donors contributed US$16.4 billion of this and private donors contributed US$5.6 billion.
In Ethiopia’s Dollo Ado camp, currently home to 200,000 Somali refugees, the IKEA foundation is funding provision of lighting and cooking technology. Private donors give around a quarter of the international humanitarian response.
Both governments and private funders rose to the challenge of the major needs in 2013. Donor governments and European Union (EU) institutions continued to provide the vast proportion of the total reported international humanitarian response. While figures are preliminary, this amounted to US$16.4 billion in 2013, some 75% of the total. Responding to increased needs, there was a turnaround in government funding after the small declines witnessed between 2010 and 2012.
Within this group, the role of governments outside of the Organisation for Economic Cooperation and Development (OECD)'s Development Assistance Committee (DAC) continued to increase substantially, with their share of the government total more than doubling between 2011 and 2013 – from 6% to 14%.
Funding from private donors such as individuals, trusts and foundations, and companies and corporations also appears to have risen steeply in 2013, increasing by an estimated 35% to US$5.6 billion, the same amount as in 2010, the year of the Pakistan floods and the Haiti earthquake. It represented 26% of the international humanitarian response over a five-year period (2008–2012).
The unprecedented US$22 billion in international humanitarian response in 2013 is just one component, albeit a significant one, of the resources that reached crisis-affected people. National and local government structures in crisis-affected countries can play a critical role in humanitarian preparedness and response. While gaps in data mean that it is not possible to put a global figure on the total value of this domestic humanitarian response, national assessments show that volumes can be substantial. For example, our research suggests that the Philippine government contributed US$710 million of national resources towards domestic disaster response and recovery, and disaster risk reduction (DRR) efforts in 2012, more than five times as much as the Philippines received in international humanitarian assistance (US$139 million).
25
Figure: 3.1
Humanitarian assistance from government donors, 2004 –2013
9.0 11.5 10.6 9.6 12.1 11.9 13.0 12.9 11.8 14.1
0.3
1.0 0.5
0.4
1.0 0.7 0.9 0.8 1.5
2.3 2.3
9.4
12.5 11.1
10.0
13.1 12.6 13.9 13.7 13.2
16.4
0
2
4
6
8
10
12
14
16
18
2004 2005 2006 2007 2008 2009 2010 2011 2012 2013
US$
BIL
LIO
NS
Total OECD DAC donorsOther government donors
Humanitarian assistance from government donors reached an unprecedented high in 2013. At US$16.4 billion, it was 18% higher than the previous highest total of US$13.9 billion in 2010 – and represented the steepest annual percentage rise since 2004. For reporting purposes, donors are categorised as ‘OECD DAC donors’ – the 29 members of the OECD DAC including EU institutions – and ‘other government donors’ or ‘non-DAC donors’. In 2013, both of these groups gave their highest levels of humanitarian assistance to date. This was not the case in 2012, when a fall in OECD DAC donor contributions was cushioned by a rise in humanitarian assistance from other government donors, notably Turkey.
Governments outside the OECD DAC provided 14% of humanitarian assistance from government donors in 2013 and have provided 7% of the total over the last decade. These donors
increased their combined humanitarian assistance by 58% between 2012 and 2013, while funding from OECD DAC donors increased by 20%.
Funding patterns over the last decade show a repeated ‘ratchet effect’ amongst government donors that is likely to be replicated beyond 2013. When response to major crises such as the Indian Ocean earthquake-tsunami generates peaks in humanitarian assistance as in 2005, it does not subsequently fall back to pre-crisis levels. As Figure 3.1 shows, the funding levels in 2005 in response to the tsunami, in 2008 in response to the global food crisis and 2010 in response to the Haiti earthquake and Pakistan floods, all left a residual and sustained increase in humanitarian funding from international government donors.
Source: Development Initiatives based on OECD DAC and UN OCHA FTS data Notes: OECD DAC data for 2013 is partial and preliminary. Funding from OECD DAC donors includes contributions from EU institutions.
Government donors
GLOBAL HUMANITARIAN ASSISTANCE REPORT 2014
26
Canada US$691m
Sweden US$785m
Germany US$949m
Japan US$1.1bnTurkey U
S$1.6bnEU
inst
itutio
ns U
S$1.
9bn
US
US$
4.7b
n
UK U
S$1.
8bn
US$109m
Saudi Arabia
US$147m Ireland
US$162m FinlandUS$250m Belgium
US$253m Spain
US$276m Italy
US$327m Kuwait
US$357m
Aust
ralia
U
S$39
9m S
witz
erla
nd
US$
409m
Den
mar
k N
etherlands US$410m
France US$427m
Norway US$613m
Figure: 3.2
Top 20 government contributors of international humanitarian assistance, 2013
Source: Development Initiatives based on OECD DAC and UN OCHA FTS data Notes: 2013 data for OECD DAC and Turkey is preliminary. The contributions of EU member states includes an imputed amount of the EU institutions’ expenditure (see Data & guides for further details).
CHAPTER 3: WHERE DOES IT COME FROM?
27
The largest donors in 2012 generally gave even more in 2013. Nine of the 10 largest government donors in 2013 showed a rise in their giving from the previous year. The five largest government donors in 2013 made some of the largest increases.
The largest donors in 2012 generally gave even more in 2013. Nine of the ten largest government donors in 2013 showed a rise in their giving from the previous year. The five largest in 2013 (the United States (US), the United Kingdom (UK), Turkey, Japan and Germany) made some of the largest increases.
These increases in spending mark a clear departure from 2012 when volumes from the US, the UK and Japan all declined significantly from the previous year. The US had shown significant annual decreases in the two previous years. In 2013, the biggest decrease by far was from Australia (down by US$98 million). China also appeared to significantly reduce its humanitarian expenditure for the second year running, although this could be due to inconsistent reporting.
The top government donors remain largely unchanged since 2012. The US continues to be by far the largest donor, providing 29% of government humanitarian assistance in 2013 and more than the total of the next three largest government donors (UK, Turkey and Japan) combined. Over the last 10 years the US has provided US$40.9 billion in humanitarian funding – 33% of the total from international governments combined and nearly four times more than the next largest donor, the UK.
The UK and Turkey retained their positions as second and third largest government donors respectively in 2013. Turkey's humanitarian assistance increased by US$591 million. Although a breakdown of Turkey’s humanitarian assistance is not yet available for 2013, it is likely that a significant part of this represents its response to the Syrian crisis and includes some assistance to Syrian refugees inside Turkey. While not a member, Turkey reports to the OECD DAC. Under OECD DAC definitions of humanitarian assistance, developing countries may report their expenditure on support to refugees within their borders as part of their humanitarian assistance.
Japan overtook Sweden and Germany to become the fourth largest government donor in 2013, nearly doubling its humanitarian assistance from US$698 million in 2012 to US$1.1 billion in 2013.
In 2013, Kuwait was the second largest government donor outside the OECD DAC group after Turkey, and the 14th largest government donor overall, contributing US$327 million. This marks a significant change from 2012, when it reported just US$14 million in humanitarian assistance and ranked as the 32nd largest government donor.
This dramatic increase is because of the Syria response – 78% of Kuwait’s reported US$327 million has gone to Jordan, Lebanon, Syria and Turkey. In January 2013, the First International Humanitarian Pledging Conference for Syria was held in Kuwait City, at which Kuwait pledged US$300 million.
Increased humanitarian funding from Saudi Arabia and the United Arab Emirates (UAE) to the Syria crisis also drove up the overall level of contributions in 2013. UAE’s assistance more than doubled from US$42 million to US$90 million and its top two recipients – Jordan (US$48 million) and Lebanon (US$29 million) – are both affected by the situation in Syria. Saudi Arabia’s contributions increased by US$21 million from US$88 million in 2012 to US$109 million in 2013, of which US$24 million went to Jordan and US$20 million to Lebanon.
GLOBAL HUMANITARIAN ASSISTANCE REPORT 2014
Top 10 donor increases, 2013
Top 10 donor decreases, 2013US$100m
US$90m
US$50m
US$40m
US$30m
US$10m
US$0m
US$800m
US$700m
US$600m
US$400m
US$300m
US$100m
US$0m
US$20m
US
UK
Turkey
Japan
Kuwait313
415
591
658
723
153 Canada138 Germany130 EU institutions101 Denmark
87 Norway
Australia
Brazil
Qatar
Russian Federation
China
-98
-52
-36
-26
-23
-6.6 -6.5 -5.5 -4.0 -1.3
ItalyNetherlands
Ireland
LuxembourgSri Lanka
-6.6 -6.5 -5.5
-1.3 -4.0
-99%
-84%
-97%
-45%
-34%
-21%
-4%
-2%
-2%
-2%
2315%
56%
57%
59%
18%
33%
28%17%
7%
16%
28
Top 10 donor increases, 2013
Top 10 donor decreases, 2013US$100m
US$90m
US$50m
US$40m
US$30m
US$10m
US$0m
US$800m
US$700m
US$600m
US$400m
US$300m
US$100m
US$0m
US$20m
US
UK
Turkey
Japan
Kuwait313
415
591
658
723
153 Canada138 Germany130 EU institutions101 Denmark
87 Norway
Australia
Brazil
Qatar
Russian Federation
China
-98
-52
-36
-26
-23
-6.6 -6.5 -5.5 -4.0 -1.3
ItalyNetherlands
Ireland
LuxembourgSri Lanka
-6.6 -6.5 -5.5
-1.3 -4.0
-99%
-84%
-97%
-45%
-34%
-21%
-4%
-2%
-2%
-2%
2315%
56%
57%
59%
18%
33%
28%17%
7%
16%
Figure 3.3
Top 10 largest changes in international humanitarian assistance from government donors and EU
institutions, 2012 –2013
Source: Development Initiatives based on OECD DAC and UN OCHA FTS data Notes: 2013 data for OECD DAC and Turkey is preliminary. The contributions of EU member states includes an imputed amount of the EU institutions’ expenditure (see Data & guides for further details).
CHAPTER 3: WHERE DOES IT COME FROM?
29
Turkey0.21%
Norway120
Most generous countries in 2013 (% GNI)
Kuwait0.20%
Luxembourg0.15%
Sweden0.14% Denmark
0.12%
Norway0.12%
Ireland0.08%
UK0.07%
Finland0.07%
Switzerland0.06%
Netherlands0.05%
Belgium0.05%
Canada0.04% Qatar
0.03%US
0.03%
Germany
0.03%
New
Zealand0.02%
Most generous countries in 2013 (per citizen)
UAE9
Germany12
Monaco13
Liechtenstein13US
15Australia15
Canada20
Turkey22
Belgium22
Netherlands24
UK29
Qatar29Finland
30
Ireland32
Switzerland49
Denmark73
Sweden81
Kuwait95
Luxembourg110
UAE0.02%
Australia0.02%
Bahrain0.03%
Humanitarian assistance as a percentage of ODA
Turkey50%
Ireland18%
Russian Federation
18%Estonia
17%
US15% Luxembourg
15% Denmark15%
Sweden14%
Canada14%
Spain13%
Switzerland13% Latvia
13%
Belgium12%
Finland12%
Norway11% Poland
11%
Slovak Republic
11%
Czech Republic
10%
UK10%
Greece10%
MOST GENEROUS
MOST GENEROUS
MOST PRIORITY GIVEN
Turkey0.21%
Norway120
Most generous countries in 2013 (% GNI)
Kuwait0.20%
Luxembourg0.15%
Sweden0.14%Denmark
0.12%
Norway0.12%
Ireland0.08%
UK0.07%
Finland0.07%
Switzerland0.06%
Netherlands0.05%
Belgium0.05%
Canada0.04%Qatar
0.03%US
0.03%
Germany
0.03%
New
Zealand0.02%
Most generous countries in 2013 (per citizen)
UAE9
Germany12
Monaco13
Liechtenstein13 US
15 Australia15
Canada20
Turkey22
Belgium22
Netherlands24
UK29
Qatar29 Finland
30
Ireland32
Switzerland49
Denmark73
Sweden81
Kuwait95
Luxembourg110
UAE0.02%
Australia0.02%
Bahrain0.03%
Humanitarian assistance as a percentage of ODA
Turkey50%
Ireland18%
Russian Federation
18%Estonia
17%
US15%Luxembourg
15%Denmark15%
Sweden14%
Canada14%
Spain13%
Switzerland13%Latvia
13%
Belgium12%
Finland12%
Norway11%Poland
11%
Slovak Republic
11%
Czech Republic
10%
UK10%
Greece10%
MOST GENEROUS
MOST GENEROUS
MOST PRIORITY GIVEN
Figure 3.4
Top 20 government donors, 2013
GLOBAL HUMANITARIAN ASSISTANCE REPORT 2014
Turkey0.21%
Norway120
Most generous countries in 2013 (% GNI)
Kuwait0.20%
Luxembourg0.15%
Sweden0.14% Denmark
0.12%
Norway0.12%
Ireland0.08%
UK0.07%
Finland0.07%
Switzerland0.06%
Netherlands0.05%
Belgium0.05%
Canada0.04% Qatar
0.03%US
0.03%
Germany
0.03%
New
Zealand0.02%
Most generous countries in 2013 (per citizen)
UAE9
Germany12
Monaco13
Liechtenstein13US
15Australia15
Canada20
Turkey22
Belgium22
Netherlands24
UK29
Qatar29Finland
30
Ireland32
Switzerland49
Denmark73
Sweden81
Kuwait95
Luxembourg110
UAE0.02%
Australia0.02%
Bahrain0.03%
Humanitarian assistance as a percentage of ODA
Turkey50%
Ireland18%
Russian Federation
18%Estonia
17%
US15% Luxembourg
15% Denmark15%
Sweden14%
Canada14%
Spain13%
Switzerland13% Latvia
13%
Belgium12%
Finland12%
Norway11% Poland
11%
Slovak Republic
11%
Czech Republic
10%
UK10%
Greece10%
MOST GENEROUS
MOST GENEROUS
MOST PRIORITY GIVEN
30
Source: Development Initiatives based on OECD DAC, UN OCHA FTS and World Bank data Note: Data for 2013 is partial and preliminary
Turkey0.21%
Norway120
Most generous countries in 2013 (% GNI)
Kuwait0.20%
Luxembourg0.15%
Sweden0.14% Denmark
0.12%
Norway0.12%
Ireland0.08%
UK0.07%
Finland0.07%
Switzerland0.06%
Netherlands0.05%
Belgium0.05%
Canada0.04% Qatar
0.03%US
0.03%
Germany
0.03%
New
Zealand0.02%
Most generous countries in 2013 (per citizen)
UAE9
Germany12
Monaco13
Liechtenstein13US
15Australia15
Canada20
Turkey22
Belgium22
Netherlands24
UK29
Qatar29Finland
30
Ireland32
Switzerland49
Denmark73
Sweden81
Kuwait95
Luxembourg110
UAE0.02%
Australia0.02%
Bahrain0.03%
Humanitarian assistance as a percentage of ODA
Turkey50%
Ireland18%
Russian Federation
18%Estonia
17%
US15% Luxembourg
15% Denmark15%
Sweden14%
Canada14%
Spain13%
Switzerland13% Latvia
13%
Belgium12%
Finland12%
Norway11% Poland
11%
Slovak Republic
11%
Czech Republic
10%
UK10%
Greece10%
MOST GENEROUS
MOST GENEROUS
MOST PRIORITY GIVEN
CHAPTER 3: WHERE DOES IT COME FROM?
31
Source: Development Initiatives based on OECD DAC, UN OCHA FTS and World Bank data Note: Data for 2013 is partial and preliminary
In focus: Japan
Japan has long been a major humanitarian donor, providing US$6.8 billion in humanitarian assistance between 2004 and 2013, ranking it the fourth largest government donor in that period. Since 2010 Japan has consistently featured amongst the top 10 most generous government donors, in volume terms, ranking second in both 2004 and 2005.
However Japan, like Turkey and China, has had to respond to crises both internationally and within its own borders. In 2011 the Tohoku earthquake and subsequent tsunami in northern Japan caused widespread devastation and destruction, killing an estimated 19,846 people and affecting more than 360,000.1
Japan’s latest Humanitarian Aid Policy, produced by the Ministry of Foreign Affairs in 2011, sets out its strategic approach to humanitarian response and financing.2 Its ‘policy of response’ identifies five priority areas: refugees and internally displaced persons (IDP) assistance; transition
to recovery and development; natural disasters; aid-worker security; and civil military coordination.
In 2013, Japan was the fourth largest government donor, rising from sixth place in 2012 and significantly increasing its funding even factoring in the major fluctuations in the value of the Yen (see box). In 2011, the year of the Tohoku earthquake, humanitarian assistance from Japan increased by 41% from the previous year. Following a decrease the following year, in 2013 it rose again.
Afghanistan was the largest recipient of humanitarian assistance from Japan between 2011 and 2013, receiving a total of US$325 million over the period. Japan provides humanitarian assistance to a geographically diverse group of recipients. In 2013 the top 10 recipients included countries in Africa, the Middle East and Southern Asia. Afghanistan, Somalia, DRC and Ethiopia have each featured every year since 2011.
Figure 3.5
Humanitarian assistance from Japan, 2004 –2013
Source: Development Initiatives based on OECD DAC data Note: Data for 2013 is partial and preliminary.
1,088 1,048
297 171
346 337
692
972
698
1,112
0
200
400
600
800
1,000
1,200
2004 2005 2006 2007 2008 2009 2010 2011 2012 2013
US$
MIL
LIO
NS
GLOBAL HUMANITARIAN ASSISTANCE REPORT 2014
GHA’s calculation of humanitarian assistance from OECD DAC donors comprises: total bilateral humanitarian assistance (as reported to OECD DAC table 1); imputed EU contributions (for EU member states); humanitarian assistance to core UN agencies and funds, including the Central Emergency Response Fund (CERF). See Data & guides for more information.
In order to take into account inflation or exchange rate variations between years, we use constant 2012 prices for all of these components.3 The baseline year for OECD DAC constant prices is 2012, and therefore figures reflect exchange rates for that year. For donors experiencing extreme currency or inflation fluctuations, the difference for current and constant prices is exaggerated, as in the case of Japan. In 2012, the value of the yen against the dollar dropped dramatically, fluctuating between JYP76 and JPY90 to the dollar. 4
32
Figure 3.6
Top 10 recipients of humanitarian assistance from Japan, 2011-2013US$ millions
Source: Development Initiatives based on OECD DAC and UN OCHA FTS data Note: Analysis for 2013 is based on UN OCHA FTS data. OECD DAC refers to the West Bank & Gaza Strip while the UN refers to occupied Palestinian territory (oPt)
2011 2012 2013
Pakistan 280 Afghanistan 85 Afghanistan 95 Afghanistan 145 Philippines 61 South Sudan 71 Philippines 59 Sudan 35 Mali 67 Sudan 50 Kenya 31 Somalia 63 Somalia 34 Thailand 27 Yemen 61 DRC 29 West Bank & Gaza Strip 26 Jordan 55 Kenya 29 Somalia 22 Ethiopia 55 Ethiopia 24 South Sudan 22 Sudan 50 Indonesia 20 Ethiopia 21 DRC 50 Turkey 18 DRC 15 oPt 48 Others 211 Others 195 Others 548
Funding to disaster prevention and preparedness totalled US$451 million (14% of Japan's total humanitarian assistance) between 2008 and 2012, steadily increasing from US$51 million in 2008 to US$146 million in 2012.
Japan’s long history of responding to disasters domestically has placed it at the forefront of DRR policies and approaches.5 Based on its expertise and experience, particularly following the Tohoku earthquake and tsunami,
the Japan International Cooperation Agency has undertaken research on ”mainstreaming disaster risk reduction [to achieve] sustainable development”.6
20092008 2010 2011 2012
US$351mUS$398m US$750m US$974m US$659m
Material relief assistance
and services
Emergency food aid
Relief co-ordination; protection and
support services
Reconstruction relief and
rehabilitation
Disaster prevention and preparedness
13364 179 321
92
125
187
110
146
21261
276
105
89
180
204
97
25
155
55
52
10103
101
51
Figure 3.7
Japan’s humanitarian assistance by sector, 2008 –2012
Source: Development Initiatives based on OECD DAC CRS data
CHAPTER 3: WHERE DOES IT COME FROM?
33
Donors outside the OECD DAC group
Humanitarian assistance from government donors outside the OECD DAC group increased significantly for the second consecutive year in 2013. Their contributions increased by 86% between 2011 and 2012 and by 58% between 2012 and 2013. Overall, these donors provided 14% of the total response from international governments. As shown in Figure 3.3, the largest volumes and rises between 2012 and 2013 came from Turkey and Kuwait, while Brazil's and Qatar’s assistance decreased significantly – by 97% and 34% respectively.
The combined humanitarian expenditure of governments outside the OECD DAC group fluctuates considerably. This may be explained partly by inconsistent reporting, but also by response to major disasters or large, one-off contributions. For example, the 2005 peak reflects
response to the Indian ocean earthquake and tsunami; the 2008 peak includes US$624 million from Saudi Arabia, of which 59% went to World Food Programme (WFP); and the 2012 and 2013 rises were both largely down to Turkey’s response to the Syria crisis. Turkey’s total humanitarian assistance accounted for 72% and 71% respectively of all non-DAC contributions in these years.
Figure 3.8
Humanitarian assistance from non-DAC donors, 2004 –2013
Source: Development Initiatives based on UN OCHA FTS and OECD DAC data
US$
BIL
LIO
NS
0.3
1.0
0.5 0.4
1.0
0.7 0.9
0.8
1.5
2.3
0.0
0.5
1.0
1.5
2.0
2.5
2004 2005 2006 2007 2008 2009 2010 2011 2012 2013
Donors outside the OECD DAC group provided 14% of the total response from international governments in 2013.
GLOBAL HUMANITARIAN ASSISTANCE REPORT 2014
34
In focus: Gulf states
Figure 3.9
Humanitarian assistance from Kuwait, Qatar, Saudi Arabia and UAE, 2009–2013
Source: Development Initiatives based on UN OCHA FTS data
US$
MIL
LIO
NS
370
118 189
42 90
120
305
87
88 109
14
2
12
105 69
42
11
13 14
327
545
436
301 249
595
100
0
200
300
400
500
600
700
2009 2010 2011 2012 2013
Kuwait Qatar Saudi Arabia UAE
Over the five-year period between 2009 and 2013, the combined contributions from Kuwait, Qatar, Saudi Arabia and UAE accounted for 35% of the total from non-DAC donors and 3% of the total from all government donors. Contributions from the Gulf states have historically accounted for a significant proportion of all humanitarian assistance from non-DAC donors. However, their share has fallen since Turkey’s humanitarian assistance increased sharply in response to the Syrian crisis in 2012 and 2013.
UAE was the largest Gulf donor over the 2009–2013 period, providing US$809 million in humanitarian assistance – making it the 18th largest government donor overall. Saudi Arabia was the second largest Gulf donor, with contributions of US$709 million (making it the 19th largest government donor), although a recent pledge of US$500 million to the Iraq response may change this picture for 2014. Qatar was the only Gulf donor whose humanitarian assistance declined in 2013 (from US$105 million in 2012 to US$69 million in 2013).In 2013, Kuwait was the largest Gulf state donor and the 14th largest of all government donors. Its contribution
25% US$81m Jordan 24% US$79m Lebanon
23% US$75m Syria
16% US$52m Regional
6% US$21m Turkey
4% US$11m Iraq
2% US$5m Egypt
0.4% US$1m Mauritania 0.2% US$0.5m Unspecified
Figure 3.10
Recipients of Kuwait’s humanitarian assistance, 2013
Source: Development Initiatives based on UN OCHA FTS data Notes: ‘Regional’ is used when no single recipient country is specified. For example, regional funding in response to the Syria crisis, which has affected Jordan, Lebanon and Turkey, as per the UN Syria regional refugee response plan (RRP).
of US$327 million represented 2% of total contributions from governments and EU institutions that year. Kuwait’s 2013 humanitarian assistance allocation reveals a regional preference; over three-quarters of its funding went to the Syrian crisis.
In January 2013 Kuwait hosted the First Pledging Conference for Syria, and pledged US$300 million for the crisis.7 Pledges from other Gulf States included Bahrain (US$20 million), Saudi Arabia (US$78 million) and the UAE (US$300 million).
CHAPTER 3: WHERE DOES IT COME FROM?
35
Figure 3.11
private and government humanitarian assistance and annual percentage change, 2008 –2012
Over one-quarter of all international humanitarian assistance came from private donors between 2008 and 2012. Private donors contributed US$4.1 billion of humanitarian assistance in 2012, representing 24% of the total international response.
Private funding tends to display sharper rises and steeper falls in response to both increasing and decreasing humanitarian need than funding from government donors. Private donors responded generously to the large-scale disasters of 2010, increasing donations by 47% from the previous year, compared with a 10% increase from governments – but these also dropped away more sharply.
Following this pattern, preliminary data for 2013 indicates a 35% rise from the previous year to an estimated US$5.6 billion. Although detailed, final data on this is not yet available, this rise is likely to have been prompted by the crisis in Syria and Typhoon Haiyan.
Private donors
DATA pOVERTY: pRIVATE FUNDING
A significant amount of financial and in-kind humanitarian assistance comes from private donors such as individuals, trusts and foundations, and companies and corporations. Yet the precise value of this private giving is unknown as the vast majority of it is not reported to the OECD DAC or to the UN OCHA FTS. To fill this data gap, the Global Humanitarian Assistance (GHA) programme conducts original research and analysis, which provides a global estimate of funding from
the private donors that directly fund humanitarian non-governmental organisations (NGOs), UN agencies and the International Red Cross and Red Crescent Movement. A full explanation of our methodology can be found in the Data & guides section. Most figures cover the period 2008 –2012 as full data is not currently available for 2013. Where 2013 data is given, it is a preliminary estimate.
GLOBAL HUMANITARIAN ASSISTANCE REPORT 2014
36
Source: Development Initiatives based on GHA's unique dataset of private humanitarian funding Notes: Government data for 2013 are partial and preliminary, private data for 2013 are estimates.
Figure 3.12
private humanitarian assistance by donor type, 2008 –2012
Individuals contribute the overwhelming majority of private funding, and their share grew in both 2011 and 2012. Private companies and corporations, foundations, Red Cross and Red Crescent (RCRC) national societies and United Nations Children’s Fund (UNICEF) national committees have contributed 23% of the total, on average, between them since 2008.
Private companies and corporations provided an estimated US$201 million in humanitarian funding in 2012, US$1.1 billion in aggregate between 2008 and 2012. While their share of the financial total has decreased in recent years, their role and profile in humanitarian response is changing significantly. Many are moving beyond a direct donorship role towards a ‘corporate partnership’ approach, providing a range of skills and resources whose financial value is unknown. For example, a number
of technology companies offer free software, as well as technical systems advice and even personnel to respond to crises.
According to data reported to the UN OCHA FTS, four of the top five largest single private donors over the past five years are foundations or charitable organisations based in Gulf states. Most of these contributions were in response to the Syria crisis. However, the Bill & Melinda Gates Foundation remained the largest single donor of private humanitarian assistance, reporting over US$51 million between 2009 and 2013.
RCRC national societies and UNICEF national committees provided an estimated 5% of all private giving in 2012. Over 75% of RCRC private funding comes from national societies which generate their funds from diverse sources. Full data on incoming funds for all RCRC national
societies is not currently available. However, previous research by GHA has suggested that privately generated funds may account for up to 41% of their income.
This income generation includes some innovative models. The Colombian Red Cross8 raises funds for its work in the country by running a national lottery. In 2012 the lottery – La Lotería de la Cruz Roja Colombiana – raised 11.6 billion Colombian pesos (US$6.2 million) for the Red Cross’s health-related work in Colombia. In 2011 the Kenyan Red Cross and domestic mobile phone network Safaricom established the Kenyans 4 Kenya (K4K) domestic fundraising campaign in response to the Horn of Africa food crisis. The campaign raised Ksh678 million (US$7.7 million) through cash and in-kind donations, most of which was spent on children and mothers with young babies.
Individuals
2008
US$5.1bn US$3.8bn
2009
US$5.6bn
2010
US$4.9bn
2011
US$4.1bn
2012
Trusts and foundations Private companies and corporations
OtherRCRC national societies and UNICEF national committeesIndividuals
2008
$5.1bn $3.8bn
2009
$5.6bn
2010
$4.9bn
2011
$4.1bn
2012
Trusts and foundations Private companies and corporations
OtherRCRC national societies and UNICEF national committees
CHAPTER 3: WHERE DOES IT COME FROM?
37
Source: Development Initiatives based on GHA's unique dataset of private humanitarian funding
NGOs are the largest mobilisers of private funding, raising an estimated US$3.8 billion in 2012, and over US$20 billion in the five years between 2008 and 2012. Overall, Médecins Sans Frontières (MSF) is by far the largest of all fundraisers of private humanitarian assistance. In 2012 it is thought to have raised 26% of total private humanitarian assistance, representing more than the combined total of the 23 other humanitarian agencies included in the GHA study set.
Collectively, the six UN agencies in our study set – UNICEF, United Nations Development Programme (UNDP),
United Nations High Commissioner for Refugees (UNHCR), United Nations Relief and Works Agency for Palestine Refugees in the Near East (UNRWA), the World Food Programme (WFP) and the World Health Organization (WHO) – rely on private sources for less than 5% of their humanitarian funding. However, this masks large differences between agencies. In 2012, for example, 10% of UNICEF’s humanitarian income came from private sources, as did 6% of UNHCR’s. In the same year, only 0.4% of WFP’s humanitarian funding came from private sources.
4.6
3.4
4.7 4.4 3.8
0.2
0.2
0.5 0.3
0.2
0.3
0.2
0.4
0.2
0.1
5.1
3.8
5.6 4.9
4.1
0
1
2
3
4
5
6
2008 2009 2010 2011 2012
US$
BIL
LIO
NS
RCRC MovementUNNGOsTotal
Figure 3.13
private humanitarian assistance by fundraising organisation type, 2008 –2012
Source: Development Initiatives based on GHA's unique dataset of private humanitarian funding
Overall, Médecins Sans Frontières is by far the largest of all fundraisers of private humanitarian assistance. In 2012 it is thought to have raised 26% of the total figure.
Top 5 fundraisers of private humanitarian assistance, 2012
Source: Development Initiatives based on GHA's unique dataset of private humanitarian funding
However, UN agencies are increasing their share of private funds, particularly their share of funds from private companies and corporations. In 2008, UN agencies received less than 1% of all such funds; by 2012 this had increased to 15%. UNHCR’s private humanitarian income alone has increased almost nine-fold in just seven years, from US$22 million in 2006 to US$191 million in 2013, and it is now the world’s second highest private humanitarian fundraiser after MSF. The International Red Cross and Red Crescent Movement (RCRC) received less than 4% of total estimated private funds in 2012.9
RCRC private funding peaked in 2010 at US$400 million in response to the Haiti and Pakistan crises but has since dropped back down by 63%. Within the Movement, the International Federation of Red Cross and Red Crescent Societies (IFRC) has consistently relied on private funding for a greater share (65%–96% between 2008 and 2012) of its humanitarian income than has the International Committee of the Red Cross (ICRC), whose share was consistently between 7% and 8% over the same period.
CHAPTER 3: WHERE DOES IT COME FROM?
39
In focus: NGO fundraising coalitions and Typhoon HaiyanWorking through fundraising coalitions, NGOs can raise significant sums. Fundraising appeals through these platforms can bring profile for a crisis as well as funds, and also catalyse funding from government donors. The UK government, for example, match-funded the first US$5 million raised by the Disasters Emergency Committee (DEC) (a fundraising platform for UK-based INGOs) for its Philippines Typhoon appeal.
The nine coalitions, featured in Figure 3.15 raised more funds for Typhoon Haiyan than their respective national governments. Belgium’s Consortium 12-12 raised over six times the amount reported by its government and Switzerland’s Chaîne du Bonheur 10 times that of the Swiss government.
The data for this funding for the Haiyan appeal illustrates the reporting gaps in private funding. Only two of these nine organisations (the DEC and Dutch SHO) appear as donors in UN OCHA’s Financial Tracking Service (FTS) and, of the US$49 million raised by the SHO, only US$817,000 has been reported to the FTS. However, other funding raised through these coalitions may be captured under general categories. UN OCHA FTS data for Typhoon Haiyan includes US$89.3 million of funding from “Private (individuals and organisations)” and “various donors (details not yet provided)”.
Figure 3.15
Funds raised for Typhoon Haiyan by nine NGO fundraising coalitions, and funding from their respective governmentsUS$ millions
Source: Development Initiatives based on data from the Humanitarian Coalition (Canada), the DEC (UK), the Belgian Consortium for Emergency Situations (Consortium 12-12), Aktion Deutschland Hilft (Germany), AGIRE (Italy), the Japan Platform, Dutch Cooperating Aid Agencies (SHO), Radiohjälpen (Sweden), Chaîne du Bonheur (Switezrland) and UN OCHA FTS Notes: Germany's fundraising coalition figure is an estimate based on the total amount raised by all Emergencies Appeals Alliance (EAA) organisations, minus the total raised by the remaining seven members. DEC includes GB£5 million from the UK government. Other coalitions’ data may also include funds donated to the platform by the national government. Data downloaded 3 July 2014. Exchange rates applied.
Fundraising coalition Government
Canada
7
64
UK
152
121
Belgium
13
2
Germany
34
17
Italy
1
3
Japan
3
62
Netherlands
49
14
Sweden
4
17
Switzerland
46
5
GLOBAL HUMANITARIAN ASSISTANCE REPORT 2014
40
DOMESTIC HUMANITARIAN CONTRIBUTIONS AS A % OF NATIONAL BUDGET
Bold colours represent volume of domestic
humanitarian expenditure
Lighter shades represent volume of international
humanitarian assistance
India Philippines
Kenya
0.0% 0.2% 0.4% 0.6% 0.8% 1.0% 1.2% 1.4% 1.6%
Figure 3.16
Average annual domestic and international humanitarian contributions for India, Kenya and the philippines, 2008–2012
Source: Development Initiatives based World Bank BOOST Initiative data; Ministry of Finance, ‘Union Budget’, Government of India; Government of India Press Information Bureau; Chakrabarti D & Prabodh G, UNISDR, 2012; Department of Budget and Management, ‘National Expenditure Program 2014’, Government of the Philippines; José, UNISDR, 2012; UN OCHA FTS and OECD DAC CRS data Notes: Philippines data represents an annual average for 2009–2012. Domestic figures include all domestic DRR-related funding, whereas international humanitarian assistance figures include only DRR reported as humanitarian.
Domestic governments, whether facing long-term, enduring crises or sudden onset crises, can spend substantial sums on humanitarian action and are often the primary responders. As affirmed in a UN resolution, each state has the responsibility first and foremost to take care of the victims of natural disasters and emergencies occurring on their own soil.10 As Chapter 7 details, international humanitarian assistance is only required when there is insufficient national capacity or readiness to respond.
The scope and scale of these domestic resources varies significantly by country. India spent an estimated US$7 billion and the Philippines an estimated US$2.4 billion between 2009 and 2012, exceeding all international support. In contrast, Kenya, a less wealthy country, spent less on
domestic humanitarian expenditure than it received in international humanitarian assistance.
As well as responding to crises, many disaster-affected countries are investing growing sums in risk reduction and disaster management. Indonesia, Bangladesh and Pakistan, for example, all have dedicated disaster management governmental departments and legislative frameworks.
In conflict, the role of domestic governments can be more complex – particularly where a state is implicated in the conflict, or is unwilling or unable to assist affected populations. However, neighbouring developing countries can, and do, play an important role in hosting and assisting refugees. In 2013, developing countries hosted 86% of the world’s refugee population.11
Domestic governments
DATA pOVERTY: DOMESTIC RESpONSE
Domestic government spending on humanitarian response and preparedness is not captured at a global level, as national governments do not report their domestic humanitarian expenditure to any international tracking system.
In the absence of such global data, the GHA programme has carried out its own research into domestic government resources for DRR and disaster relief for India, Kenya and the Philippines, analysing publicly available national budgets and departmental accounts.
CHAPTER 3: WHERE DOES IT COME FROM?
41
Total
DRR
Disaster relief
1.7
1.3
0.4
2012 2010
1.7
0.5
1.2
2009
0.5
1.1
1.6
2011
0.4
1.4
1.9
2013
1.4
0.6
2.0
Figure 3.17
Domestic disaster relief and DRR resources, India, 2009-2013US$ billions
Source: Development Initiatives based on Ministry of Finance, ‘Union Budget’, Government of India; Government of India Press Information Bureau; and Chakrabarti D & Prabodh G, UNISDR, 2012 data Note: Data includes a combination of budget, actual and revised figures,depending on the year and due to conversions from fiscal to calendar years. Data may include international assistance channelled through the public sector.
India
India is home to the second highest number of people affected by natural disasters in the world after China. Between 2000 and 2013, 22% of people affected by natural disasters globally lived in India. Despite this, India has met these humanitarian needs domestically while also investing in preparedness and risk reduction.
International humanitarian assistance is eclipsed by India’s own domestic spending on disaster relief and DRR. Between 2009 and 2012 India's domestic government resources for disaster relief and disaster risk reduction stood at US$7 billion, while international humanitarian resources amounted to US$137 million. In 2013 India's resources stood at US$2 billion, with the majority US$1.4 billion, allocated to disaster relief. DRR spending was just under one-third of this in 2013
(US$0.6 billion), representing India’s largest domestic investment in DRR in the past five years.
India’s long-term investment in disaster management was driven in part in response to two huge disasters – the Odisha cyclone (1999) and the Gujarat earthquake (2001), which caused devastating economic damage and loss of life; 9,843 people were killed in the cyclone and 20,005 people in the earthquake. The subsequent domestic investment in DRR is thought to have been vital in limiting the fatalities of Cyclone Phailin (2013) to 45 people – a huge reduction from the comparable Cyclone Odisha 14 years previously.
The latest available data shows that between 2005 and 2010, 24% of all India’s state disaster management expenditure was in the four states in the Bay of Bengal. The disaster-
prone state of Adhra Pradesh invested US$632 million in disaster management and the state of Odisha, US$373 million.12 Both states have their own disaster management departments, have built hundreds of coastal cyclone shelters and have invested in advanced weather prediction technology.
India's DRR policy is thought to have been vital in limiting the fatalities of Cyclone Phailin to 45 people
GLOBAL HUMANITARIAN ASSISTANCE REPORT 2014
42
CHAPTER 3: WHERE DOES IT COME FROM?
Source: Development Initiatives based on Department of Budget and Management, ‘National Expenditure Program 2014’, Government of the Philippines and José, UNISDR, 2012 Notes: Data includes a combination of budget and actual figures; DRR data for 2012 and 2013 were extracted from multiple ministry budgets and may be underestimated; data for 2009 and 2011 are principally sourced from José (2012); data from the Quick Response Fund in José's paper has been subtracted to avoid double counting. Data may include international assistance channelled through the public sector.
Total
2009 2010 2011 2012 2013
DRR
Disaster relief 385 364 474 556 810
139 54 240 154 293
524 418 714 710 1,103
Figure 3.18
Domestic resources for disaster response and recovery and DRR and preparedness, the philippines, 2009-2013US$ millions
The Philippines
As the Philippines is prone to natural disasters, domestic expenditure on disaster relief and preparedness has long overshadowed international assistance to the country. In 2011, the year that saw 11.7 million people affected by a surge in frequency of floods and storms in the Philippines, its domestic government resources for disaster response, recovery and risk reduction reached US$714 million – nearly six times the humanitarian assistance provided by the international community.
The Philippine government contributed US$710 million towards domestic disaster response and DRR in 2012, more than five times as much as the country received in international humanitarian assistance (US$139 million). Even taking domestic DRR resources out of the equation for data comparability purposes, the US$240 million spent on disaster response in 2012 was much higher than this international humanitarian assistance.
As Figure 3.18 shows, domestic investment in DRR is consistently higher than spending on disaster response and recovery – more than triple the amount between 2009 and 2013. Domestic resources for both DRR and disaster response and recovery reached a five-year high, totalling US$1.1 billion in 2013 – a year marked by Typhoon Haiyan and the Bohol earthquake.
It is possible that for the first time in recent years international humanitarian assistance may have come closer to levels of domestic resources in the Philippines – although comprehensive figures for 2013 are not yet available. The scale and severity of Typhoon Haiyan, coming in the same year as the Bohol earthquake, led the UN to declare a Level 3 (L3) emergency in 2013 (see Chapter 4). A UN-coordinated appeal was launched with requirements reaching US$781 million to support the government’s response. By July 2014, this appeal alone had raised
over US$460 million of international humanitarian assistance – yet from the outset, the Philippine government has led this response, making it a combined domestic and international operation.
Government humanitarian assistance, either domestic or international, was only part of the financial and in-kind support to typhoon-affected communities. Remittances are an important resource flow to the Philippines, and in the three months following the typhoon were officially reported to have reached US$6.7 billion (see Chapter 8). There was also a high level of private sector engagement in the response to Typhoon Haiyan, in which Manila’s cross-sector business associations, such as the Philippine Disaster Recovery Foundation, played an important role in delivery and in coordination between domestic and international actors.
43
Kenya
Kenya has long been prone to food insecurity, with notable peaks experienced during the 2010–2011 Horn of Africa drought. An average of 36% of the population was food insecure between 2011 and 2013.13 The country is also host to over 550,000 registered refugees, the vast majority of whom are from Somalia and South Sudan.
Kenya’s annual domestic humanitarian expenditure fluctuated between US$19 million and US$38 million between 2008 and 2012. The increases in 2009 and 2010 were in response to the 2009 food crisis which was declared a national disaster. In 2012, following the 2011 Horn of Africa food crisis, Kenya’s domestic humanitarian expenditure reached US$38 million – 0.3% of its national budget.
The majority of Kenya's domestic humanitarian resources have been spent on refugee response, totalling US$138 million between 2008 and 2012. Disaster relief, which includes the categories of disaster emergency
response coordination, national disaster operations, and relief and rehabilitation, totalled US$22 million in this period.
There are also investments in DRR and preparedness from domestic humanitarian and other budgets, as well as through joint projects delivered by the domestic government and financed by international bodies. Projects include the arid lands projects in Northern Kenya, and the World Bank eight-year Western Kenya Flood Mitigation Project. However, reporting makes it difficult to discern the total domestic investment in these.
International humanitarian assistance to Kenya peaked at US$436 million in 2011, in response to the food insecurity in the region. This was equivalent to fifteen times the domestic response that year. In 2012, international humanitarian assistance fell to US$363 million – over 10 times the domestic response.
2009 2008 2010 2011 2012
Total
Disaster relief
Refugee affairs
0.7
19
19
1
30
29
7
44
37
6
29
23
7
38
31
Figure 3.19
Domestic humanitarian expenditure by type, Kenya, 2008 –2012
Source: Development Initiatives based on World Bank BOOST Initiative data
GLOBAL HUMANITARIAN ASSISTANCE REPORT 2014
44
WHERE DOES IT GO?
4CHApTER
While the international humanitarian response has increased significantly, it is still not enough to fully meet global needs. Although responding to needs is central to humanitarian commitments, donors make choices as to where to direct their finite resources, prioritising certain crises over others and responding to institutional preferences. In the absence of a global process for division of labour in humanitarian response, the result is an uneven coverage of needs with a set of established and high-profile recipients and an entrenched set of forgotten crises.
In 2012, 37% of the international humanitarian response went to the top 10 recipient countries – 24% to just five countries. Combined, these top five recipient countries represented 39% of all UN-coordinated appeal requirements for that year. Half of the top 10 recipient countries have long been donor priorities – appearing in the top 10 every year for the past five years. However, Syria attracted more funding than any of those well established major recipients in 2012.
Just as priority crises with longer-term needs tend to retain donor interest for several years, forgotten crises tend to remain deprioritised for funding. The European Commission’s Department of Humanitarian Aid and Civil Protection (ECHO)’s forgotten crisis assessment (FCA) index identifies crises that have been overlooked or neglected by the international community. Many countries, including India, Nepal, Myanmar and Algeria, repeatedly appear in the index.
Levels of funding to crises with a UN-coordinated appeal also present a stark picture of uneven response to needs. While UN-coordinated appeals were, overall, 60% funded in 2012 and 65% funded in 2013, there is an average 57 percentage point difference between the best and worst funded crises over the 2009–2013 period. Private funding allows some delivery agencies a degree of flexibility to redress the balance. Only two of the top five recipients of bilateral government funding in 2012, South Sudan and Somalia, were among the top five recipients of private funds in the same year.
DATA pOVERTY: TIMELINESS
We use the Organisation for Economic Cooperation (OECD)'s Development Assistance Committee (DAC) Creditor Reporting System (CRS) for contributions from DAC donors. However, complete data relating to the recipients of DAC donor funding in 2013 is not available until December 2014. Therefore, while every attempt is made to use 2013 data wherever possible, there are some instances where we have to refer to 2012 figures.
45
Half of the top 10 recipients in 2012 have featured in the top 10 every year for the past five years, and four of them – West Bank & Gaza Strip, Afghanistan, Ethiopia and Sudan – have featured every year for the past 10 years. Four of the top 10 recipients in 2012 saw increases in funding from the previous year.
Syria received US$1.5 billion in 2012 – the largest amount of international humanitarian assistance received by a single crisis that year. This was not a record figure, it was only half the amount that Haiti received in 2010 (US$3.2 billion) and less than the US$2.2 billion for Pakistan in response to the floods that same year. However, indications suggest that 2013 data will show a significant rise in funding for Syria as the conflict escalated going into its third year.
Source: Development Initiatives based on OECD DAC and UN OCHA FTS data Note: 'Top ten appearances' indicates number of top ten appearances in the past 10 years. The Syria RRP 2012 focuses on four countries: Lebanon, Jordan, Turkey and Iraq. oPt = occupied Palestinian territory; DRC = Democratic Republic of Congo; RRP = Syria Regional Refugee Response Plan; SHARP = Syria Humanitarian Assistance Response Plan
GLOBAL HUMANITARIAN ASSISTANCE REPORT 2014
46
Figure 4.1
Top 10 recipients of international humanitarian response, 2012
CHAPTER 4: WHERE DOES IT GO?
47
TOP 20 RECIPIENTS
Sud
an U
S$10
.8bn
US$1.2bn M
yanmar
US$1.4bn South Sudan
US$1.5bn Jordan
US$1.7bn Uganda
US$2.0bn Zimbabwe
US$2.0bn Chad
US$2.1bn Sri L
anka
US$2.
2bn
Leba
non
US$
2.3b
n Sy
ria
Indonesia US$ 2.7bn
Somalia US$4.4bn
DRC US$4.4bn
Haiti US$4.6bn
Afghanistan US$5.6bn
Iraq US$5.7bn Ethiopia US$6.2bn
Wes
t Ban
k & G
aza
Strip
US$
6.8b
n
Pak
ista
n U
S$6.
9bn
Kenya U
S$2.7bn
The top 20 recipients of international humanitarian response over this 10-year period accounted for 75% of all country-allocated humanitarian assistance. The top five recipients accounted for 36%.
Some countries are consistently in the top 20 due to protracted or recurrent
crises. Amongst these are Sudan, Afghanistan, West Bank and Gaza Strip, Ethiopia and Somalia. Others, such as Haiti and Indonesia, appear in this list due to single, large-scale, natural disasters. Major crises have propelled others into the list more recently, including Syria, Jordan and the recently independent South Sudan.
For example, despite only receiving humanitarian assistance as an independent country since mid-2011, the volume of funding to South Sudan makes it the 19th largest recipient of humanitarian funding in the 10 years from 2003 to 2012.
Figure 4.2
Top 20 recipients of international humanitarian response, 2003–2012
Source: Development Initiatives based on OECD DAC and UN OCHA FTS data
GLOBAL HUMANITARIAN ASSISTANCE REPORT 2014
48
US$ MILLIONS US$ MILLIONS
Private Institutional
0 20 40 60 80
Haiti
DR Congo
South Sudan
Somalia
Kenya
Sudan
Zimbabwe
Chad
Afghanistan
Nigeria
0 200 400 600 800
Figure 4.3
Top 10 recipients of private humanitarian assistance and their humanitarian funding from governments, 2012
Source: Development Initiatives based on GHA's unique dataset of private humanitarian funding, UN OCHA FTS and OECD DAC data
Geographic priorities for private spending are not the same as those of government donors. Only two of the top five recipients of bilateral government funding in 2012, South Sudan and Somalia, were among the top five recipients of private funds allocated by 10 of the organisations in our study set (see Data & guides).1
In cases such as Haiti and Nigeria, private funds supported humanitarian
crises that were accorded lower priority by government donors. In 2012, Haiti was the highest recipient of private funds – and only 17th on the list of recipients of government funding. Conversely, Syria was a high funding priority for governments but was a lower recipient of private funds from our study set organisations.
Private donors tend to respond more generously to rapid-onset, natural
disasters than to slow-onset, chronic crises, such as those resulting from internal conflict. As seen in Chapter 3, this is illustrated by record levels of private funding in 2005 and 2010 in response to the Indian Ocean earthquake-tsunami and the Haiti earthquake. On average, a UK Disasters Emergency Committee (DEC) appeal in response to a natural disaster raises three times more than a conflict-related appeal.
0% 10% 20% 30% 40% 50% 60% 70% 80% 90% 100%
Earthquake and tsunami Japan 2011
Typhoon Haiyan Philippines 2013
Syria 2013
Central African Republic 2014
Rap
id-o
nset
na
tura
l dis
aste
rs
Chr
onic
cri
ses:
inte
rnal
con
flic
t
OtherInstitutionalPrivate
Figure 4.4
proportion of funding from private, government and other donors for rapid-onset and chronic crises
Source: Development Initiatives based on UN OCHA FTS data
CHAPTER 4: WHERE DOES IT GO?
49
96% 89%
123%
155%
111%
91%
73% 87% 87% 83%
64% 67% 66% 71% 71% 72% 62% 62% 60% 65%
14% 28%
6% 2%
27% 32%
19%
33% 18% 36%
2004 2005 2006 2007 2008 2009 2010 2011 2012 2013
Highest level of needs met Overall level of needs met (all appeals) Lowest level of needs met
IRAQ NAMIBIA
INDIAN OCEANTSUNAMI
LEBANON
GREAT LAKES REGION
ZIMBABWE
EL SLAVADOR
MONGOLIA DZUD
SOMALIA
KOREA DPR
LEBANON
SOUTHERN AFRICANREGION
ZIMBABWE
PAKISTAN
MAURITANIA
DJIBOUTI TAJIKISTAN
SYRIA
CHAD
HAITI
Figure 4.5
Best and worst-funded UN-coordinated appeals, 2004 –2013
Source: Development Initiatives based on UN OCHA FTS data Note: Data reflects UN-coordinated appeals.
The difference between the best and worst-funded UN-coordinated appeals has significantly narrowed in recent years but remains wide. Between 2009 and 2013 it averaged 57 percentage points, compared with 99 percentage points over the 2004–2008 period.
Of the 19 countries that had UN appeals in both 2012 and 2013, more than two-thirds (13) experienced a fall in the proportion of their requirements met. For a second consecutive year, Haiti’s appeal requirements were less than 50% funded. Before Typhoon Haiyan in November 2013, the Philippines had experienced the greatest fall in needs met – from 69% in 2012 to 54% in 2013.
Mauritania was the best-funded UN-coordinated appeal in 2013 with 83% of its requirements met, though this may be because it had the fourth lowest requirements (US$107 million) out of the 23 appeals that year. However, there is not a clear correlation between size of appeal and level of funding – the lowest appeals do not always have the highest levels of coverage and, of the four appeals requesting over US$1 billion, South Sudan had 75% coverage in 2013 while Somalia had just 51%.
50
By designating a crisis a ‘Level 3' (L3) emergency, the UN’s Emergency Relief Coordinator aims to mobilise the resources, leadership and capacity of the humanitarian system to respond to exceptional circumstances. The decision to designate an L3 emergency is based on five criteria: the scale, urgency and complexity of the needs, as well as the lack of
domestic capacity to respond and the ”reputational risk” for the UN Office for the Coordination of Humanitarian Affairs (OCHA) and the UN.”2
In 2013, there were three L3 designations – for the responses to the conflicts in Syria and Central African Republic (CAR) and to the typhoon in the Philippines. Of these, the Syria
appeal was overwhelmingly the largest. The combined requirements for the response within Syria (SHARP) and in neighbouring countries (RRP) was US$4.4 billion – over 22 times larger than the appeal for CAR, which had revised requirements of US$195.1 million. In February 2014, South Sudan also became an L3 emergency.
In focus: 2013 ‘Level 3’ emergencies
1% $0.1bn CAR 2013 appeal0% $0.1bn CAR 2013 outside the appeal
Funding to L3 emergencies and all other funding reported to UN OCHA’s Financial Tracking Service (FTS), 2013
Source: Development Initiatives based on UN OCHA FTS data Note: Level 3 appeals data downloaded 24th June 2014. ‘Other humanitarian assistance’ includes all other humanitarian assistance reported to UN OCHA FTS for 2013. While the CAR and Syria appeals are for the 2013 calendar year, the Philippines Typhoon Haiyan appeal runs from November 2013 to October 2014. As such, 2013 funding data for Typhoon Haiyan includes funding decisions made from the date of the typhoon up to and including 31 December 2013
1% $0.1bn CAR 2013 appeal
4% $0.4bn Philippines Typhoon Haiyan SRP
11% $0.9bn Syria SHARP24% $2.2bn Syria RRP
60% $5.3bn Other UN appeals funding
Figure 4.7
Level 3 appeals and all other UN-coordinated appeals funding, 2013
Source: Development Initiatives based on UN OCHA FTS data Note: Data for Typhoon Haiyan includes funding decisions made from the date of the typhoon up to and including 31 December 2013. Data downloaded 24th June 2014. SRP = strategic response plan.
CHAPTER 4: WHERE DOES IT GO?
51
Figure 4.8
Forgotten crises
Source: Development Initiatives based on OECD DAC data and the ECHO FCA index Notes: Funding from EU institutions is official bilateral humanitarian assistance. IDP = internally displaced persons.
Forgotten emergencies cannot be detected simply by looking at volumes of funding or appeals data. They might not be the subject of UN-coordinated appeals (as in the case of Colombia or Algeria), and volumes of funding at a country level may conceal neglected crises at the sub-national level.
A number of ways have therefore been developed to identify, assess and respond to such emergencies, the best known, and perhaps most widely used of which, is ECHO’s forgotten crisis assessment (FCA). The FCA is used by ECHO to identify crises that have been overlooked or neglected by the international community. These often include crises that affect particular groups or minorities within a country.
The FCA index is compiled annually using a series of weighted indicators to come up with an overall ranking of emergency situations. The following four factors are used to rank crises: vulnerability; media coverage; public aid per capita; and a qualitative assessment by ECHO geographical units and experts.
A number of countries appear in the forgotten crises rankings year on year. Appearing at the top of the index does not have a consistent correlation with the amount of humanitarian assistance received. Myanmar has appeared towards the top of the index every year since 2003-2004. Funding to Myanmar has increased and decreased in that time period in response to specific emergencies – Cyclone Nargis in 2008 in particular – but not apparently as a direct result of the FCA index.
However, in some cases, appearing at the top of the FCA index is immediately followed by an increase in funding. In CAR for example, EU humanitarian assistance has increased year on year since the country appeared in the index (with the exception of 2012) but its continued low ranking against the vulnerability, media coverage and the qualitative assessment indicators in particular mean that it remains on the list.
In 2013-2014, the highest scoring crisis on the index is Myanmar, scoring eleven points out of a possible twelve, followed by Algeria, CAR and Chad, all scoring 10 points. Bangladesh, Colombia, India, Papua New Guinea and Yemen all score nine.
GLOBAL HUMANITARIAN ASSISTANCE REPORT 2014
52
Source: Development Initiatives based on OECD DAC data and the ECHO FCA index Notes: Funding from EU institutions is official bilateral humanitarian assistance. IDP = internally displaced persons.
CHAPTER 4: WHERE DOES IT GO?
53
Conflict between government forces and non-state armed groups has affected Myanmar for over 50 years. More than 640,000 people are displaced and a further 480,000 people are thought to be seeking refuge elsewhere.3,4 The Kachin conflict in Myanmar was the top forgotten crisis on the FCA index in both 2012-2013 and 2013-2014. Myanmar is the most frequently occurring country on the index, appearing every year since 2003-2004.
Myanmar is also highly prone to natural hazards, including floods, landslides, cyclones, storm surges, earthquakes, forest fires and drought. It is top of UN OCHA’s list of at-risk countries in the Asia-Pacific regions, with projections that it is likely to experience a medium to large-scale natural disaster approximately every two years.5
In 2014, the International Red Cross and Red Crescent Movement (ICRC) included Myanmar in its list of top
six under-funded operations, with a funding gap of around US$20 million.6 As at end July 2014, the UN-coordinated appeal for Kachin and Rakhine States was 43% funded, leaving a funding gap of almost US$109 million.7
Humanitarian funding to Myanmar has fluctuated over recent years. Between 2004 and 2007, it increased slowly year on year but remained low according to the FCA funding indicator, with only US$57 million received in 2007 from all donors, and US$12m from EU institutions. The EU institutions, which use the FCA index as a key tool for ranking and prioritising emergencies, have been the top donor to Myanmar for the last five years.
In 2008, funding from all donors peaked dramatically when Cyclone Nargis made landfall in the Ayeyarwady and Yangon Divisions, killing around 140,000 people and devastating the lives and livelihoods of an estimated 2.4 million. The UN’s
initial humanitarian appeal was 96% funded within two months of the emergency, and the revised appeal for over US$477 million received contributions of US$349 million (73% of requirements). Including contributions outside of the UN appeal, humanitarian assistance to Myanmar in 2008 reached a record high of US$522 million.
From 2009 to 2011 there was a significant decrease in humanitarian assistance to the country, though not to pre-Cyclone Nargis levels. 2012 saw a 41% (US$38 million) increase to US$130 million and, in 2013, a total of US$205 million was received, predominantly as contributions to the two separate UN-coordinated appeals for Rakhine and Kachin States, which were 81% and 52% funded respectively. Despite these increased levels, the funding shortfall remains significant.
EU institutions International humanitarian assistance
Figure 4.9
Humanitarian assistance to Myanmar
Source: Development Initiatives based on the ECHO FCA index, OECD DAC data for 2004 to 2012 and UN OCHA FTS data for 2013
GLOBAL HUMANITARIAN ASSISTANCE REPORT 2014
54
HOW DOES IT GET THERE?
5CHApTER
International humanitarian assistance is not a direct transaction between the donor and recipient. Funding moves through chains of transaction of varying lengths and complexity. Donors choose to direct their funding through a first level ‘channel of delivery’, such as a UN agency, the Red Cross and Red Crescent Movement (RCRC) or a non-governmental organisation (NGO), which in turn decides how to reach the intended recipient. They may do this directly themselves, or indirectly by providing funding to another delivery agency – for example, a UN agency may fund an international NGO, which may in turn partner with a local NGO to deliver the assistance.
In 2012, the most recent year for data on channels of delivery, the largest proportion of international humanitarian assistance from government donors (61%) was channelled through multilateral agencies – 88% of which went through UN agencies. In contrast, according to data reported to the UN Office for the Co-ordination of Humanitarian Affairs (OCHA) Financial Tracking Service (FTS), private donors tend to channel the larger share of their funding through the RCRC and NGOs1. National and local NGOs form an essential part of the humanitarian response, but in 2013 only directly received US$49 million - just 0.2% of the total international humanitarian response.
In 2013, over US$1 billion (4.7% of all international humanitarian assistance) was channelled through pooled funds, representing a 6% increase on the previous year (US$966 million). The United Kingdom (UK) is the largest contributor to pooled funds, providing US$1.3 billion between 2009 and 2013 – nearly US$600 million more than Sweden, the second largest donor. The Democratic Republic of Congo (DRC) was the largest recipient of pooled funding between 2009 and 2013, receiving US$592 million.
After a significant peak in 2010, the amount of humanitarian assistance reported as channelled through the military declined drastically, accounting for just 1% of humanitarian funding from Organisation for Economic Co-operation and Development (OECD) Development Assistance Committee (DAC) donor governments and EU institutions in 2012. Given the levels of international support via the military in response to Typhoon Haiyan, this proportion may increase in 2013.
55
Channels of delivery
DATA pOVERTY: TRACEABILITY
The flow of funding in Figure 5.2 (opposite) is a partial estimate – and the data becomes increasingly sparse at each transaction level. In 2012, only US$12.1 billion of the total international humanitarian response (70% of the total) could be traced to a first-level recipient – data on the remaining 30% was missing. The amount of information available varies substantially between different humanitarian providers – less than 4% of private funding reported to UN OCHA FTS was traceable to a first-level recipient in 2012.
Data is not systematically captured beyond this first level of transaction, so it is impossible to track humanitarian funding step by step from the donor to the crisis-affected person, or to have full accountability or understanding of the cost-effectiveness of the various transaction chains. The International Aid Transparency Initiative (IATI) ultimately aims to provide a common reporting system that will allow funding to be geocoded and fully traceable from donor to recipient (see Chapter 9 for details).
US$
BIL
LIO
NS
98%
29%
4%
0%
20%
40%
60%
80%
100%
0
2
4
6
8
10
12
14
DAC donors Other governments Private
Humanitarian assistance traced to a first-level recipient% of total humanitarian assistance traced to a first-level recipient
Figure 5.1
Humanitarian assistance traced to first-level recipients by donor type, 2012
Source: Development Initiatives based on OECD DAC and UN OCHA FTS data
GLOBAL HUMANITARIAN ASSISTANCE REPORT 2014
56
OEC
D D
AC d
onor
sU
S$11
.8 b
illio
n
Oth
er g
over
nmen
ts U
S$1.
5 bi
llio
n
Pri
vate
fund
ing
US$
4.1
bill
ion
Don
orFi
rst-
leve
l rec
ipie
ntSe
cond
-lev
el r
ecip
ient
(and
furt
her
leve
ls)
Pub
lic s
ecto
r U
S$0.
8 bi
llio
n
NG
Os
US$
2.3
bill
ion
Inte
rnat
iona
l Red
Cro
ss a
nd R
edC
resc
ent M
ovem
ent U
S$1.
2 bi
llio
n
Oth
er U
S$0.
4 bi
llio
n
Unk
now
n U
S$5.
2 bi
llio
n
Mul
tilat
eral
org
anis
atio
nsU
S$7.
4 bi
llio
n
Tota
l int
erna
tiona
l hu
man
itaria
n re
spon
seU
S$17
.3 b
illio
n
Figu
re 5
.2
Hum
anita
rian
fund
ing
chan
nels
, 201
2
Sour
ce: D
evel
opm
ent I
nitia
tives
bas
ed o
n O
ECD
DAC
, UN
OC
HA
FTS,
UN
CER
F da
ta a
nd G
HA'
s un
ique
dat
aset
of p
riva
te v
olun
tary
con
trib
utio
ns
CHAPTER 5: HOW DOES IT GET THERE?
57
Nearly two-thirds (61%) of international humanitarian assistance in 2012 went directly to multilateral organisations, primarily UN agencies. NGOs were the next largest first-level recipients of humanitarian assistance, directly receiving US$2.3 billion (19%).
Donors display different preferences for delivery channels. Overall, those outside the OECD DAC group are more likely to channel their assistance through the public sector. Public
sector channels include central, state or local government departments in both donor and recipient countries,2 and may also include situations where the donor delegates implementation of a given activity to another donor country. Over the 2008–2012 period, governments outside the OECD DAC channelled nearly one-third (31%) of their humanitarian funding through the public sector (US$1.1 billion), compared to just 10% for OECD DAC donors.
While multilateral organisations are the preferred channel of delivery for all international donors, this preference is strongest for OECD DAC donors. In the past five years, OECD DAC donors have given 60% of their funding to multilateral organisations. This compares with 44% for non-DAC donors and 35% for private contributors.
Public sector NGOs RCRC Multilateral organisations Other
2.1
2.1
1.0 7.7
0.5
2008
1.2
2.2
1.2 7.9
0.3
2009
2.0
3.4
1.4 8.2
0.5
2010
1.1
2.7
1.8 8.1
0.7
2011
0.8
2.3
1.2 7.4
0.4
2012
US$13.4bn US$12.8bn US$15.5bn US$14.3bn US$12.1bn
Figure 5.3
First-level recipients of international humanitarian assistance, 2008–2012
Source: Development Initiatives based on OECD DAC and UN OCHA FTS data Note: The ‘other’ category is driven by OECD DAC data and includes funding to public private partnerships, to be defined, and other.
6.1
11.6
5.2 36.5
1.7
Public sector NGOs RCRC Multilateral organisations Other
1.1
0.1 0.4
1.5
0.4
0.01
1.0
0.9
1.3
0.3
DAC donors
US$61.2bn US$3.5bn US$3.5bn
Non-DAC donors Private funding
Figure 5.4
First-level recipients of international humanitarian assistance by donor type, 2008 –2012
Source: Development Initiatives based on OECD DAC and UN OCHA FTS data
GLOBAL HUMANITARIAN ASSISTANCE REPORT 2014
58
Funding to UN agencies
Figure 5.5
Government funding to four UN agencies: UNHCR, UNRWA, UNICEF and WFp, 2008 –2012
Source: Development Initiatives based on OECD DAC and UN OCHA FTS data
CHAPTER 5: HOW DOES IT GET THERE?
UN agencies are the largest first-level recipients of humanitarian assistance. In 2012, US$6.5 billion (54%) of international humanitarian assistance from government donors was channelled through UN agencies. Of this, 78% (US$5.2 billion) went to four major UN agencies engaged in humanitarian response – the World Food Programme (WFP), the UN High Commissioner for Refugees (UNHCR), the UN Children’s Fund (UNICEF), and the UN Relief and Works Agency for Palestine Refugees in the Near East (UNWRA).
Government donors provide the majority of funding to these UN agencies, and donors from the OECD DAC group provide the bulk of this – 97% in 2012 (US$ 5.1 billion), a proportion which has increased from 92% in 2008. However, this high proportion may partly be due to more detailed reporting by this group of donors. The highest individual donors to these UN agencies in 2012 were the United States (US$2.5 billion), the United Kingdom (US$ 355 million) and Japan (US$349 million).
The proportion provided by countries outside the OECD DAC group has
more than halved, from 8% (US$429 million) in 2008 to 3% (US$146 million) in 2012.
Pooled funds and private donors provide further sources of funding for UN agencies (see Chapters 3 and 5). In 2012 the CERF, ERFs and CHFs provided a total of US$452 million to UNHCR, UNICEF, UNRWA and WFP combined.
WFP received more humanitarian funding than UNHCR, UNRWA and UNICEF put together over the 2008 –2012 period. In the past five years, US$14.1 billion of humanitarian assistance has been channelled through WFP – 52% of total funding to these four UN agencies. The proportion received by UNHCR increased steadily from 23% in 2008 to 33% in 2012, and it received the second highest amount in this period overall (US$7.7 billion, or 28%).
UN agencies often play multiple roles, including coordinator (as cluster lead), donor, appealing agency and implementer. As Figure 5.2 shows, comprehensive data to show how much of the funding received by UN agencies is spent on the programmes
they implement themselves, the costs directly incurred by these agencies, or how much is passed on to second-level recipients is not available. While some of this data is captured in the financial reports of individual agencies, it is not comprehensively gathered in a single reporting format.
10%
10%
UNHCRUNRWAUNICEF
52% WFP
28%
54% of international humanitarian assistance from government donors was channelled through UN agencies in 2012.
59
Pooled funds
Humanitarian pooled funds aim to facilitate coordinated funding that is more responsive to changing crises, and can act as a counter-weight to bilateral donor preferences. They also provide a trusted channel for donors who are new to responding in a particular context.
An increasing volume (but not proportion) of funding is being channelled through pooled funds. In 2009 they received US$824 million (5.0% of the total international humanitarian response); in 2013 they received over US$1 billion (4.7%).
The Central Emergency Response Fund (CERF) provides funding to new – or sudden escalations in – crises, as well as to forgotten emergencies. It is managed at a global level by UN OCHA and disburses funds only to UN agencies and the International Organization for Migration (IOM). In 2013, 72 government and private donors provided US$464 million through the CERF, which disbursed funds to 45 countries. Roughly half – 46% – of all pooled funds have been
directed through the CERF over the past five years.
At country level, pooled funding mechanisms include common humanitarian funds (CHFs), which typically support projects outlined in UN-coordinated response plans, and emergency response funds (ERFs, sometimes known as humanitarian response funds). ERFs aim to fill unforeseen needs outside of UN-coordinated response plans. They are designed to disburse smaller grants, predominantly through NGOs, which received 58% of ERF funding in 2013. Less funding was channelled through the 13 ERFs in 2013 (US$178 million) than through the four CHFs (US$382).
The total volume of pooled funds and the proportion of total assistance channelled through them varies between countries. In 2013, Sudan received the highest volume of pooled funds (US$115 million, or 18% of international assistance to Sudan). Pooled funds constituted the highest proportion of humanitarian assistance for the Philippines (35%)
– but only 2.2% of the humanitarian assistance directed to the West Bank and Gaza Strip.
Humanitarian pooled funds are a small part of the complex architecture of multi-donor funding mechanisms. Some countries have a myriad of funds - including for humanitarian assistance, recovery, reconstruction, stabilisation, peace-building and development. Some are country-specific, such as the UN Stabilization and Recovery Funding Facility in Democratic Republic of Congo (DRC). Others, like the Millennium Development Goals (MDG) Achievement Fund, have global coverage. The volume, accessibility and speed of disbursement vary enormously between these different mechanisms. With the exception of the World Bank Afghanistan Reconstruction Trust Fund, which disbursed almost US$700 million last year, none of these funds released significant volumes for the top 10 recipients of humanitarian assistance in 2013.
2010 2011 2012 2013 2009
CHF 309 382 400 382 278
ERF 244 163 140 178 125
Total 1006 998 966 1,024 824
CERF 454 453 425 464 421
Figure 5.6
Total funding to humanitarian pooled funds, 2009–2013US$ millions
Source: Development Initiatives based on UN OCHA FTS and CERF data Note: Constant 2012 prices.
GLOBAL HUMANITARIAN ASSISTANCE REPORT 2014
60
17% 19%
16% 15%
10%
23%
5%
13%
9%
3%
0%
5%
10%
15%
20%
25%
50
0
100
150
200
250
300
350
UK
Swed
en
Nor
way
Net
herl
ands
Den
mar
k
Irel
and
Can
ada
Bel
gium
Aus
tral
ia
Ger
man
y
US$
MIL
LIO
NS
CERF CHF ERF % of total international humanitarian assistance
Figure 5.7
Top 10 government contributors to humanitarian pooled funds, 2013
Source: Development Initiatives based on UN OCHA FTS, CERF and OECD DAC data
18%
11% 14%
11%
4%
9%
35%
7% 10%
3%
0%
5%
10%
15%
20%
25%
30%
35%
40%
20
40
60
80
100
120
140
Suda
n
Sout
h Su
dan
Som
alia
DR
C
Syri
a
Ethi
opia
Phi
lippi
nes
Yem
en
Pak
ista
n
Leba
non
US$
MIL
LIO
NS
ERFCHFCERFPooled funds % humanitarian assistance reported to FTS
Figure 5.8
Top 10 recipients of money channelled through pooled funds, 2013
Source: Development Initiatives based on UN OCHA FTS and CERF data
CHAPTER 5: HOW DOES IT GET THERE?
61
Figure 5.9
Top 10 recipients of humanitarian assistance 2013, by pooled funding mechanism type
Source: Development Initiatives based on UN OCHA FTS, CERF, UN Multi-Partner Trust Fund Office and World Bank data
GLOBAL HUMANITARIAN ASSISTANCE REPORT 2014
62
Source: Development Initiatives based on UN OCHA FTS, CERF, UN Multi-Partner Trust Fund Office and World Bank data
CHAPTER 5: HOW DOES IT GET THERE?
63
National and local NGOs directly access a tiny share of international humanitarian funding but represent an essential part of the humanitarian response; they have presence, access and knowledge where international actors often do not. In 2013, only 93 national NGOs and 22 local NGOs were recorded as having received funding in the UN OCHA FTS, compared with 294 international NGOs.
Between 2009 and 2013, local and national NGOs combined received a total of US$212 million – 1.6% of the total given directly to NGOs and 0.2% of the total international humanitarian response over the period. However, this represents only the amount they received as first-level recipients, and both types of NGOs access unreported quantities of funding further down the transaction chain. Direct funding to national NGOs peaked at US$45 million in 2011, US$16 million of which was for Somalia – an operating environment largely inaccessible to international humanitarian agencies.
ERFs and CHFs are designed to be accessible to NGOs, including national and local NGOs, while CERF funding is only available to UN agencies and the IOM. ERFs are predominantly intended to facilitate the work of NGOs in an emergency and to support local NGO capacity-building. However, in the past five years national and local NGOs have only accessed US$31 million of the US$464 million disbursed through
ERFs. This represented 12% of the total disbursed to all NGOs by ERFs in the period compared with the 82% received by international NGOs, many of whom may have then allocated funding to local or national partners.
Between 2009 and 2013, local and national NGOs combined received a total of US$212 million – 1.6% of the total given directly to NGOs and 0.2% of the total international humanitarian response over the period.
Funding channelled through domestic NGOs
GLOBAL HUMANITARIAN ASSISTANCE REPORT 2014
64
CHAPTER 5: HOW DOES IT GET THERE?
Figure 5.10
Humanitarian assistance to NGOs, by type, 2009-2013
Figure 5.11
ERF funding channelled through NGOs, by type, 2009-2013
US$3m1.3%
US$1.1bn8.4%
Undefined
US$134m1.0%
US$4m1.7%
Affiliated national NGOs
US$169m1.3%
US$24m9.5%
National NGOs
US$85m0.7%
US$7m2.7%
Southern international
NGOs
US$43m0.3%
US$6m2.5%
Local NGOs
International NGOs
US$210m82%
US$11.4bn88%
Source: Development Initiatives based on UN OCHA FTS data Notes: Scaled by percentage. NGO coding methodology, see Data & guides.
Source: Development Initiatives based on UN OCHA FTS data Notes: Scaled by percentage. NGO coding methodology, see Data & guides
65
In focus: NGO-led pooled fundsIn focus: NGO-led pooled funds
NGO-led pooled funds are smaller in number and financial volume than those led by multilaterals but provide complementarity and innovation in terms of focus, agility and balance of recipients.
In South Sudan, the Small Grants Mechanism within the South Sudan Recovery Fund (SSRF), managed by United National Development Programme (UNDP) and coordinated by BRAC South Sudan, awarded US$2.7million in grants to national and local NGOs and community-based organisations between 2009 and 2012. In Sudan, the Small Grants Scheme within the larger Darfur Community Peace and Stability Fund, aims to engage and build capacity of local NGOs and community-based organisations in peace-building and is implemented by Catholic Relief Services, World vision and the Sudanese Community Development Association.
Also operating at a country level, the RAPID Fund in Pakistan is managed
by Concern Worldwide, with funding from USAID. Between 2009 and 2013, the RAPID Fund provided over US$29 million to local, national and international NGOs. The fund is small in comparison to the Pakistan ERF, which disbursed US$52 million in the same period, but fills a gap in terms of the speed and flexibility of disbursements. It has no fixed funding windows and takes an average of 9 or 10 days from proposal to disbursement, compared to the 75 days reported by the ERF in its 2013 annual report.3 It also puts an emphasis on supporting local and national NGOs that otherwise may not be able to secure international funding. In 2013, 78% of grants went to local and national NGOS, compared to 34% from the ERF.
Operating at a global level, the Start Fund is described as a “multi-donor pooled fund managed by NGOs, for NGOs”.4 It launched in April 2014 for an initial six-month trial period with a budget of US$3 million from the UK government's Department for
International Development (DFID) and Irish Aid. Grants are available to the 19 international NGO members of the START Network (formerly the Consortium of British Humanitarian Agencies (CBHA)) and their implementing partners.
The Start Fund is set up to fill identified gaps in emergency funding. It particularly focuses on small-to-medium-scale ‘under-the-radar’ emergencies, providing early response to slow-onset crises and rapid response to spikes in chronic emergencies. On receiving an alert from a member agency, the allocation committee must meet within 24 hours, funding must be disbursed within 72 hours and spent within 45 days. In the four months following its launch, the Start Fund disbursed over US$2 million for crises in South Sudan, Myanmar, Somalia, Sierra Leone, Yemen and Cameroon, targeting around 1.3 million people.
Pakistan RAPID Fund Pakistan ERF
27%
51% 49%
22%
22%
12%
9%
8%
Local NGOs
National NGOs
United Nations
Undefined
International NGOs
Figure 5.12
Breakdown of allocations from pakistan ERF5 and RApID fund by recipient organisation type, 2013
Source: Development Initiatives based on UN OCHA FTS and RAPID Fund data
GLOBAL HUMANITARIAN ASSISTANCE REPORT 2014
66
8
2005
411
80
2006
183
83
2007
142
151
2008
201
65
2009
139
62
2010
585
3
2011
140
0.1
2012
116
2004
0.5
171
All other donors, US$ millions
United States, US$ millions
% of total official humanitarian assistance
4% 2% 2% 3% 2% 5% 1% 1%2%
In keeping with humanitarian principles, the delivery of humanitarian assistance through military channels should only be considered as a last resort, taking place in exceptional circumstances when other agencies are unable to deliver the assistance.
For the past two years, military delivery has indeed represented a small proportion of humanitarian assistance. This followed a peak in 2010 when donors spent relatively high levels of humanitarian assistance through their militaries, the overwhelming majority (US$462 million of US$500 million) of which was spent in Haiti. In 2012 it reached a new low, accounting for just 1% of humanitarian funding from OECD
DAC donors. The United States (US) is the main reporter of humanitarian assistance delivered through defence agencies.
Between 2008 and 2012, Afghanistan received US$247 million of humanitarian assistance via military actors, including provincial reconstruction teams. This figure decreased substantially throughout the period from a peak of US$125 million in 2008 to US$8 million in 2012.6
National militaries have played a significant role in the response to Typhoon Haiyan in the Philippines. At least 20 countries lent support through military assets. These assets ranged from the delivery of relief and airlifting of survivors to providing medical
response personnel. The US was one of the main countries providing military support but smaller countries such as New Zealand, vietnam, Brunei and Singapore also contributed military assets and personnel. It will be interesting to see the extent to which this assistance is reflected in the 2013 data when this becomes available.
Reporting of humanitarian assistance channelled through the military is particularly poor. The data relating to almost three quarters of this type of assistance in 2012 failed to specify the recipient country.
Figure 5.13
Official humanitarian assistance via donor defence agencies, 2004 –2012
Source: Development Initiatives based on OECD DAC CRS data
Humanitarian assistance is spent on a range of activities and services, the mix of which depends on the particular needs of a particular crisis. Overall, the majority of humanitarian assistance in 2012 (the latest year for which sector data is available) was spent on activities to provide basic goods and services such as water and sanitation, health and shelter. Food aid accounted for just under one quarter.
In certain contexts, such as the Syria refugee response, providing assistance in the form of cash rather than goods has proven benefits for recipients, local economies and for cost effectiveness. But while donor interest in cash programming is on the rise, reported spending is at a five-year low.
The proportion of humanitarian assistance spent on disaster prevention and preparedness (DPP, or disaster risk reduction, DRR) by Organisation for Economic Co-operation and Development (OECD) Development Assistance Committee (DAC) donors remains low but has steadily increased in recent years. Following the aftermath of the 2010 mega-disasters, there has also been a slight shift from post-disaster reconstruction to pre-disaster programming. These figures do not, however, capture the significant investment in this area from domestic governments or from international donors’ development budgets; such investments remain hard to track.
Promoting gender equality is a stated commitment of UN agencies and many donors and should be explicit in the reporting of any kind of programming that donors choose to fund. A gender marker has been created to track funding against this commitment but in the three years since it was implemented, reporting remains too poor to yield an accurate picture of how much is spent.
Source: Development Initiatives based on OECD DAC CRS data Notes: Includes EU institutions. Percentages show the proportion of bilateral humanitarian assistance made up by each expenditure type for the given year.
Types of expenditure
GLOBAL HUMANITARIAN ASSISTANCE REPORT 2014
70
Humanitarian assistance funds a wide range of programmes to respond to specific needs of crisis-affected people. These programmes are categorised in different ways by different actors for the purposes of planning, coordination and reporting. The UN Office for the Coordination of Humanitarian Affairs (OCHA)’s Financial Tracking Service (FTS) has 12 standard sector categories (see Figure 6.4). The OECD DAC currently groups humanitarian assistance into five categories for the purposes of financial reporting of bilateral expenditure, see box.1
The distribution of spending between the OECD DAC categories has remained relatively constant over the past five years. Year on year, the largest proportion of bilateral humanitarian assistance from OECD DAC donors is spent on material relief and assistance, which includes water and sanitation, shelter and health. Food aid is consistently the second largest, notably expanding in response to the 2008 global food crisis, but not showing a similar variation in response to the 2011 and 2012 food crises in the Horn of Africa and in the Sahel. Since 2008, the proportion and volume of humanitarian assistance delivered as emergency food aid has declined.
There is, however, a perceptible shift in the balance of spending between pre-disaster preparedness and post-disaster reconstruction, although volumes spent on both remain comparatively small. The proportion of expenditure on reconstruction decreased significantly following the
aftermaths of the Haiti earthquake and Pakistan floods in 2010 and 2011. At the same time, the small proportion spent on DPP increased from 2.9% in 2008 to 6.2% in 2012. Increased policy attention in this area has both driven more funding to the sector and generated incentives to improve the reporting of such expenditure, and it is unclear which of these most explains overall reported increases in disaster prevention.
CHAPTER 6: WHAT IS IT SPENT ON?
OECD DAC CATEGORIES OF HUMANITARIAN ASSISTANCE
Material relief assistance and services
Shelter, water, sanitation and health services, supply of medicines and other non-food relief items; assistance to refugees and internally displaced people in developing countries other than for food or protection
Emergency food aid Food aid or special supplementary feeding programmes
Relief coordination; protection and support services
Coordination measures, including logistics and communications systems; measures to promote and protect the safety, well-being, dignity and integrity of civilians and those no longer taking part in hostilities
Reconstruction relief and rehabilitation
Short-term reconstruction work after an emergency or conflict limited to restoring pre-existing infrastructure; social and economic rehabilitation in the aftermath of emergencies to facilitate transition and enable populations to return to their previous livelihood or develop a new livelihood in the wake of an emergency situation
Disaster prevention and preparedness
Disaster risk reduction activities; early warning systems; emergency contingency stocks and contingency planning including preparations for forced displacement
71
Different types of crisis and country contexts require different types of assistance. In keeping with this, food aid was the dominant expenditure type for Ethiopia (68%) and South Sudan (52%) in 2012, while material relief assistance and services dominated for Syria (83%), and Lebanon (97%). The
highest proportions of reconstruction relief and rehabilitation were in Afghanistan (19%), Pakistan (20%) and the West Bank & Gaza Strip (18%). However, DPP spending was low for all 10 of the top recipients in 2012 at less than 2% in all countries except Ethiopia (2.4%).
0%
10%
20%
30%
40%
50%
60%
70%
80%
90%
100% Le
bano
n
Pak
ista
n
Som
alia
Sout
h Su
dan
Suda
n
Syri
a
Wes
t Ban
k &
Gaz
a St
rip
Relief coordination; protection and support servicesReconstruction relief and rehabilitationMaterial relief assistance and servicesEmergency food aidDisaster prevention and preparedness
Afg
hani
stan
DR
C
Ethi
opia
Figure 6.2
Breakdown of expenditure type for the top 10 recipients of bilateral humanitarian assistance from OECD DAC donors, 2012
Source: Development Initiatives based on OECD DAC CRS data
Reconstruction relief and rehabilitationEmergency food aid
Relief co-ordination; protection and support servicesMaterial relief assistance and servicesDisaster prevention and preparedness
Pakistan
20%
40%
60%
80%
100%
20%
40%
60%
80%
100%
20%
0% 0% 0%
40%
60%
80%
100%
2008
2009
2010
2011
2012
2008
2009
2010
2011
2012
2008
2009
2010
2011
2012
Ethiopia Lebanon
Reconstruction relief and rehabilitationEmergency food aid
Relief co-ordination; protection and support servicesMaterial relief assistance and servicesDisaster prevention and preparedness
EthiopiaPakistan Lebanon
Source: Development Initiatives based on OECD DAC CRS data
CHAPTER 6: WHAT IS IT SPENT ON?
The types of expenditure also change with time. In Pakistan, the years following the 2010 floods saw a clear shift to reconstruction and also growth in preparedness for future disasters. Expenditure in Lebanon shows a move away from rehabilitation and reconstruction following internal violence to a funding landscape dominated by material assistance to Syrian refugees in 2012. There was a brief investment of US$1.3 million in DPP in 2011, the year of a high-level meeting in Beirut on risk reduction in the region. Ethiopia has long received
high levels of food aid. However, there was a slight but noteworthy shift in proportions from food aid to DPP after the 2011 Horn of Africa food crisis. In terms of volume, food aid has decreased year on year since 2008, from US$630 million to US$246 million in 2012 – a decline that continued even through the 2011 food crisis.
73
GLOBAL HUMANITARIAN ASSISTANCE REPORT 2014
Source: Development Initiatives based on UN OCHA FTS data Notes: 'Multi-sector' is predominantly used for multi-sector assistance to refugees. In the FTS, contributions are tagged with both ‘standard sectors’ and clusters. Cluster names vary across different appeals, whereas sectors are standardised into 12 categories and allow for comparative analysis across countries and appeals.
Figure 6.4
Appeal requirements and proportions met by sector in UN-coordinated appeals, 2009–2013US$ billions
Food
Multi-sector
Health
Agriculture
Water andsanitation
Shelter and non-food items
Coordination and support
services
Protection
Economic recovery and infrastructure
Education
Mine action
Safety and security
84%
58%
42%
16%
0.7
0.1
Requirement unmet Requirement met
KEY
2.6
3.1
4.1
4.3
7.6
58%
59%
59%
42%
41%
41%
45%55%
44%68%
32%
27%
73%
37%
62%
38%
63%
56%
32%
68%
3.6
7.3
17.3
2.8
2.1
Funding by sector in UN-coordinated appeals
UN-coordinated appeals categorise requirements under twelve standard sectors. Food programmes have made up the largest share of these over the last five years. At US$17 billion, requirements were nearly one-third of the total over the 2009–13 period. Requirements for food aid have been consistently high
since 2009, averaging over US$3 billion each year.
The proportion of requirements met varies considerably by sector. Food aid, the largest in terms of requirements, also has the highest proportion of those requirements met (84%). Four other sectors received over half of their requested
requirements: coordination and support services (73%); health (59%); multi-sector (58%); and mine action (58%). The remaining seven sectors were all under 50% funded. The most underfunded were protection (32% funded) and safety and security (32% funded).
74
CHAPTER 6: WHAT IS IT SPENT ON?
Providing people with cash or vouchers, rather than commodities, can have a number of benefits, including stimulating local markets and increasing choice. It can also allow people to invest in rebuilding their livelihoods and so boost their resilience to future shocks.
There is a wide range of cash programming modalities, including transferring cash directly to individuals or households, grants schemes, providing payment for work, or vouchers for goods. For reporting purposes, programmes are defined either as ‘full’ or entirely composed of cash transfers, or ‘partial’, indicating that a programme has some element of cash transfer within it.
Approximately US$692 million was spent on ‘full’ humanitarian cash transfer programmes by 53 donors between 2009 and 2013. A further US$78 million has been reported to the FTS in the first six months of 2014. Funding peaked at US$236 million in 2010, mainly in response to disasters in Haiti and Pakistan – with large contributions from the United States in particular.
Yet despite widespread interest in cash programming, funding for both full and partial cash-based interventions represents over 1.5% of international humanitarian assistance reported to the FTS over the last five years – and reached a five-year low in 2013.
There was also a notable shift in 2013 in the kinds of full-cash programmes – funding to voucher programmes nearly doubled. This was mainly due to the Syria crisis response, which included a US$20 million programme for food coupons in Lebanon and a US$7.5 million voucher programme for refugees in Turkey.
Fifteen government donors reported spending on cash programmes in 2013, compared with 13 in 2009. The US and the European Union (EU) have consistently been the largest donors to cash programmes. The US ranks as the top donor every year since 2009, providing a total of US$266 million between 2009 and 2013 – the equivalent of 1.5% of its total humanitarian assistance reported to UN OCHA FTS during this period.
Full Partial
2010 2009
Full Partial Full Partial
2012
Full Partial
2013
Full Partial
2011
50
100
150
200
139
236
86
242
120 110
45 403923
250
US$
MIL
LIO
NS
Voucher Combined Cash grant Cash transfer Cash/food for work
Full Partial
2010 2009
Full Partial Full Partial
2012
Full Partial
2013
Full Partial
2011
50
100
150
200
139
236
86
242
120 110
45 403923
250
US$
MIL
LIO
NS
Voucher Combined Cash grant Cash transfer Cash/food for work
Figure 6.5
Humanitarian assistance to cash programmes by type, 2009–2013
Source: Development Initiatives based on UN OCHA FTS data Note: ‘Full’ indicates funding for programmes that are purely cash transfer. ‘Partial’ indicates funding for mixed cash and non-cash programmes.
Cash transfers
DATA pOVERTY: FUNDING TO CASH TRANSFER pROGRAMMES
Tracking funding to cash transfer programmes is problematic as it is often integrated into larger contributions or programmes, so not distinctly labelled. GHA therefore undertakes its own customised analysis of the available data (see Data & guides). This can only capture donor funding that is clearly labelled as such, or that has been reported to FTS by the recipients specifically for cash programming. First-level recipients often pass on funding to implementing partners and this is not recorded in FTS.
In 2013, in response to the lack of current and comprehensive data, the Cash Learning Partnership launched the Cash Atlas, an online interactive map to track funding to cash programmes in humanitarian settings.2
75
GLOBAL HUMANITARIAN ASSISTANCE REPORT 2014
The largest share of US funding for cash programmes went to occupied Palestinian territory (oPt) – 46% (US$122 million), followed by Pakistan 25% (US$67 million) and Haiti 5% (US$14 million). However, the amount from the US fluctuates significantly, with a peak in 2010, largely driven by the Pakistan floods response, and more than halving between 2012 and 2013, after a 2012 rise, which was partly driven by response to the food
crises in West Africa. In 2010 the Democratic Republic of Congo (DRC) reported US$3 million to Haiti for cash-for-work for early recovery and stabilisation following the earthquake.
In 2013 the United Arab Emirates (UAE) provided the second highest amount of funding for cash-based programming, directing US$20 million to the Syria response – US$4 million more than the EU’s total global
funding for full cash programming activities. Germany, the United Kingdom (UK) and Russia also increased their contributions for cash-based programming in 2013.
OPt remains the highest recipient of funding for cash programming. It has received US$304 million in the past five years – more than the combined total of all the other top nine recipients over the same period.
Bangladesh 2 Kyrgyzstan 5 Afghanistan 3 Niger 9 Haiti 7
Zimbabwe 2 Niger 4 Yemen 2 Mauritania 7 Jordan 4
Kenya 1 Somalia 3 Sri Lanka 2 Pakistan 5 Kyrgyzstan 4
Pakistan 1 Sri Lanka 3 Pakistan 1 Chad 5 Yemen 3
Burundi 0.4 Syria 3 DRC 1 Senegal 4 DRC 3
Egypt 0.3 Zimbabwe 2 Zimbabwe 0.2 Kenya 4 Mali 2
Figure 6.7
Top 10 recipients of humanitarian cash transfer programmes, 2009–2013
Source: Development Initiatives based on UN OCHA FTS data Note: For cash transfer methodology see Data & guides.
76
CHAPTER 6: WHAT IS IT SPENT ON?
Disaster prevention, preparedness and risk reduction
DIS
AST
ER P
REV
ENTI
ON
A
ND
PR
EPA
RED
NES
S A
S A
SH
AR
E O
F H
UM
AN
ITA
RIA
N
ASS
ISTA
NC
E
2008
330
2.9%
2009
416
3.8%
2010
413
3.6%
2011
520
4.6%
2012
630
6.2%
DIS
AST
ER P
REV
ENTI
ON
AN
D P
REP
AR
EDN
ESS
(US$
MIL
LIO
NS)
There is widespread consensus that a number of trends, such as climate change, resource scarcity and urbanisation, are combining to increase the risks faced by vulnerable people. There is also evidence that as well as preventing suffering and loss of life, investment in DRR, including early warning systems, is cost effective.3
Although DRR (or DPP in OECD DAC reporting), falls within the scope of humanitarian assistance, it is clear that it cannot be exclusively addressed by humanitarian funding or approaches. Supporting disaster prevention and management systems and addressing the long-term factors that increase risk and vulnerability also demands other resources: from domestic budgets (as seen in Chapter 3); and from development assistance, climate financing and new risk financing modalities (as detailed in Chapter 8).
In March 2015, the Hyogo Framework for Action (HFA) will expire and be replaced by a new international DRR framework to be agreed in Sendai, Japan. Member states have also highlighted the need to address DRR and climate change adaptation in setting the sustainable development goals.
Against the backdrop of these inter-governmental processes, OECD DAC donors spending on DPP continues to increase – but remains a very small share of their bilateral humanitarian assistance, accounting for just US$630 million in 2012, or 6% of the total. In comparison, the most recent estimate from 2011 suggests that DRR made up less than 0.7% of all development assistance from OECD DAC donors.4
Figure 6.8
OECD DAC donor spending on Dpp as a share of total bilateral humanitarian assistance, 2008–2012
Source: Development Initiatives based on OECD DAC data
77
GLOBAL HUMANITARIAN ASSISTANCE REPORT 2014
25%
8% 11%
6% 7%
3% 1%
0%
5%
10%
15%
20%
25%
30%
0
20
40
60
80
100
120
140
160
Japa
n
EU in
stitu
tions
US
Aus
tral
ia
Swed
en
Nor
way
Ger
man
y
Switz
erla
nd
Can
ada
UK
US$
MIL
LIO
NS
DPP, 2012 Funding to DPP as % of bilateral humanitarian assistance
22%
6%
3%
Figure 6.9
Dpp funding from top 10 OECD DAC donors as a share of their bilateral humanitarian assistance, 2012
Source: Development Initiatives based on OECD DAC data
As detailed in Chapter 3, Japan’s DPP funding has steadily increased from US$51 million in 2008 to US$146 million in 2012. Japan’s long history of responding to disasters domestically has placed it at the forefront of DRR policies and approaches.
Five donors contributed 74% of total DPP funding from OECD DAC donors' humanitarian assistance in 2012: Japan (US$146 million); EU institutions (US$101 million); the US (US$98 million); Australia (US$87 million); and Sweden (US$37 million). This does not represent all of DPP or DRR funding from these donors, or others, as it is likely that they are also funding this sector through development channels.
DATA pOVERTY: DISASTER RISK REDUCTION
DRR is often delivered as a component of other programmes, making expenditure hard to track within both humanitarian assistance and overall official development assistance (ODA). Searching project descriptions for DRR-related activities within the OECD DAC Creditor Reporting System (CRS) can provide some indication of the variety of sectors into which DRR is integrated. However, this is heavily reliant on donor reporting, and lack of standardised guidelines for recording these investments means that estimates are not likely to be comprehensive.
A marker for disaster risk management (DRM) is currently under consideration by the DAC
Working Party on Development Finance Statistics at the OECD, as a way of improving visibility of spending on risk management (including DRR) within the current data. The marker will not be able to pull out the specific volumes of funding dedicated to DRM within broader programming, but will help to identify where it has been mainstreamed within development and humanitarian assistance and which sectors it crosses. It is hoped that the presence of the marker will encourage the mainstreaming of DRM into development planning, as it will require the review of every aid activity through a ”DRM lens”.5
78
CHAPTER 6: WHAT IS IT SPENT ON?
In 2009, UN Secretary-General Ban Ki-moon called on all UN-managed funds to implement a gender marker “to assist in tracking the proportion of funds devoted to advancing gender equality”.6 In 2010, he set a target that the primary purpose of 15% of all UN-managed funds in support of peace-building should “address women’s specific needs, advance gender equality or empower women”,7 including preventing and responding to sexual and gender-based violence (SGBv).
In 2010, the Inter-Agency Standing Committee (IASC) rolled out a gender marker for donors and agencies to use as a tool to track gender equality in humanitarian assistance. Coding is based on the extent to which: (i) a project has considered the needs of men and women equally; (ii) its activities respond equally to these needs; and (iii) the project has led to gender-related outcomes.
Most projects that are reported under the gender marker in UN OCHA’s FTS have a significant or limited gender equality element to them. The investment in such projects has increased from US$3.2 billion in 2012 to US$4.9 billion in 2013. However, the US$566 million spending on projects that did not consider gender (gender marker zero) in 2013 is nearly four times more than was spent on projects whose 'main purpose' was to advance gender equality (US$147 million). Expenditure under the gender marker zero category has also increased two and half times since 2012, whereas it has decreased for the main purpose projects.
Gender reporting remains poor, resulting in an unreliable picture of whether commitments to gender equality are being met. In 2013, 56% of funding (US$7.9 billion) recorded in the UN OCHA FTS was left blank or
‘undefined’ – meaning that the project was not coded for a gender marker.
A more standardised and systematic approach to donor reporting on gender in emergencies would help to fill this gap in information, strengthen accountability, and enable resources to be better allocated to respond to the different needs of girls, women, men and boys. The current IASC Gender Marker could be expanded for this purpose - from a proposal development tool to a programme cycle tool - drawing lessons from the application of the Gender and Age Marker8 developed by the European Commission’s Humanitarian Aid and Civil Protection (ECHO) department in 2013.
0
1
2
3
4
5
6
7
8
9
10
2011 2012 2013
US$
BIL
LIO
NS
4. Not applicable
0.40.9
2.0
0.1 0.3 0.2
1.12.0
0.2 0.2
7.9
1.4
0.1 0.1
5.8
0.61.4
3.5
0.5
9.3
0. No signs gender issues were considered
1. Limited gender equality element in project
2a. Significant gender equality element in project
2b. Main purpose of project is to advance gender equality
3. Not specified Blank/undefined
Figure 6.10
Funding to gender, as per IASC gender marker, 2011–2013
Source: Development Initiatives based on UN OCHA FTS data Notes: 4 – not applicable: only used for very small number of projects, such as 'support services'
Gender
79
GLOBAL HUMANITARIAN ASSISTANCE REPORT 2014
Figure 6.11
Top 12 government donors funding SGBV-related projects in emergencies, 2012
Addressing SGBv during and after humanitarian crises is a priority for many donors and agencies yet, once again, data is scarce on the financial resources directed to this. According to the OECD DAC’s CRS, a total of US$346 million in ODA was spent on programming to address SGBv in 2012, of which 19% came from humanitarian funds (US$64 million).
According to reported data, in 2012 the US was the largest donor funding projects to address SGBv from overall ODA programmes (US$115 million), followed by Sweden (US$51.7 million) and Norway (US$34 million). The three largest donors supporting projects to address SGBv through their humanitarian assistance were Sweden (US$33.7 million), the US (US$13 million) and the EU (US$5.2 million).
DRC was the largest recipient of humanitarian assistance for SGBv (US$10.1 million) in 2012, receiving
more than the next two largest recipients, Iraq and Ethiopia, combined (US$4.8 million each).
The extent that donors channel spending to address SGBv through humanitarian assistance, rather than through development assistance, varies substantially. Almost two-thirds (65.2%) of Sweden’s spending on SGBv-related projects is reported as humanitarian assistance. In contrast, the UK, which in 2012 launched a series of high profile unilateral and multilateral initiatives to address sexual violence in crises, reported just US$5,000 of bilateral humanitarian funding for SGBv to the CRS. This was only 0.04% of the UK’s spending on SGBv-related projects that year (US$13 million of ODA).
In November 2013, a number of donor governments (including the UK, US, Australia, Sweden and Japan), six UN agencies, the
International Committee of the Red Cross (ICRC), and the International Organization for Migration endorsed a communiqué outlining future action and commitments to keep women and girls safe in emergencies. As a result, the UK committed US$33.2 million of humanitarian assistance in November 2013 to support relevant programmes of the UN Population Fund, the International Rescue Committee (IRC) and the ICRC in emergency contexts. In addition, US$30.4 million was also committed by Switzerland, Japan, the US and the European Commission’s Department of Humanitarian Aid and Civil Protection.10 The US government has since established the Gender-Based violence Emergency Response Initiative to provide financial support to women and girls in emergencies. These recent commitments suggest that spending on gender in humanitarian contexts might increase.
Source: Development Initiatives based on OECD DAC CRS data 9 Notes: Figures only include projects reported by donors, so relevant projects may not be included due to inaccuracies in reporting. Figures include spending on SGBv in all countries (conflict/post-conflict and non-conflict) and capture all projects using terminology related to SGBv (in various languages). Figures include projects that focus on SGBv or ‘mainstream’ it/focus on it as a sub-objective.
Humanitarian assistance to SGBV-related projects Development assistance to SGBV-related projects
US$
MIL
LIO
NS
0
20
40
60
80
100
120
140
US
Swed
en
Nor
way
Aus
tral
ia
Can
ada
Irel
and
Ger
man
y
EU
UK
Den
mar
k
Switz
erla
nd
Net
herl
ands
80
HOW QUICKLY
7CHApTER
and for how long?Crises rarely fit neatly into ‘sudden onset’ or ‘protracted emergency’ boxes; and people’s needs and vulnerabilities can rarely be described as neatly ‘humanitarian’ or ‘development’. Humanitarian assistance encompasses action "during and in the aftermath" of emergencies as well as preparedness and prevention.1 So humanitarian actors are stretched between the imperatives to act early and stay late. The diversity of demands on humanitarian response requires flexible approaches as well as availability of other kinds of funding.
The humanitarian imperative requires quick response, often within a short window of time, to heed early warnings, meet urgent needs and prevent further loss of life or escalation of suffering. Timely humanitarian action depends on timely funding. Rapid response funds and other gear-shifting mechanisms have been designed to enable this.
Yet overall, even for acute crises triggered by sudden natural disasters, the time it takes for donors to respond at scale can vary enormously in the first weeks and months. In conflict and complex emergencies, humanitarian funding tends to get off to a much slower start following the launch of an appeal, and shows an unpredictable pattern of response to increases in severity of humanitarian need.
The overwhelming majority (78%) of humanitarian spending from Organisation for Economic Co-operation and Development (OECD) Development Assistance Committee (DAC) donors continues to be for protracted emergencies in long- and medium-term recipient countries, prompting new initiatives including multi-year appeals and funding. Most long-term assistance is also spent in countries with high levels of poverty and low levels of government spending, once again highlighting the need for both longer-term funding models and better links with development spending and other resources to build resilience.
81
Speed and timing of response
Timely response to humanitarian crises is critical for effective action. This involves heeding early warning signs, reacting to sudden crises or deteriorations and responding promptly and predictably to appeals. While appeals may be for a response over many months, having strong funding commitments early on enables better planning, continuity and pre-positioning.
For disasters triggered by sudden natural hazards, such as earthquakes or extreme weather events, the speed of response varies significantly (see Figure 7.1). The anomalous response in 2005 to the UN-coordinated appeal following the Indian Ocean earthquake-tsunami saw more than double the proportion of needs met in the first month than the appeal following Typhoon Haiyan in the Philippines in 2013. Again, the proportion of needs met in the first month of the Haiti appeal (49%) was more than double that at the same point following the Pakistan floods (24%). It was only around the fifth month after each of the Haiti earthquake and the Pakistan floods that the differences began to level out and both saw over 65% of their requirements met. Yet, at the same point, the proportion of needs met for Typhoon Haiyan was trailing at just above 55%.
Conflict-related and complex crises saw a slower response to the requirements set out in their UN-coordinated appeals (see Figure 7.2). Levels of requirements, access, lack of sustained media and political attention, as well as donor preferences and funding cycles, all play a role in this. None of the appeals for South Sudan, Syria, Central African Republic (CAR) or Yemen were 50% funded by the sixth month. Indeed, at this point, even the relatively high-profile Syria humanitarian assistance response plan (SHARP) and regional response plan (RRP) appeal requirements were only 24% met.
These collective appeal responses do, however, mask the individual response times of specific donors and funding mechanisms. There are a number of pooled funds that seek to support a rapid humanitarian response, including the Central Emergency Response Fund (CERF)’s rapid response window as well as the NGO-led RAPID and Start Funds (see Chapter 5). The UK Department of International Develoment (DFID)’s rapid response facility (RRF) also aims to support more agile humanitarian response. In certain rapid onset emergencies, or sudden spikes in chronic disasters, it releases funds within 72 hours to pre-screened and pre-qualified implementing partners. RRF funding has been disbursed in situations including the South Sudan conflict in January 2014 and flooding in northern India in July 2013.
While humanitarian funding needs to be able to scale up rapidly for early response, development funding needs to anticipate and respond to cyclical and predictable crises – both conflict- and natural disaster-related. One development financing mechanism designed to enable a rapid gear-shift in reaction to warning signs or sudden changes is the ‘crisis modifier’. The US Agency for International Development (USAID) introduced these after the 2011 food crisis, to speed up the pace of disaster response in the Horn of Africa and other drought-prone areas.2 Project activities are linked with triggers to alert decision-makers to a worsening of food security, livelihoods and nutrition indicators. Before a critical tipping point has been reached, the system prompts a simplified and accelerated funding approval process and an expansion of interventions including the provision of emergency fodder and animal health services.3 DFID is experimenting with a similar initiative in Yemen.4
GLOBAL HUMANITARIAN ASSISTANCE REPORT 2014
82
74%
84%
49% 56%
24%
68%
36%
67%
10%
20%
30%
40%
50%
60%
70%
80%
90%
End month
PR
OP
OR
TIO
N O
F R
EQU
IREM
ENTS
MET
(%)
Indian Ocean earthquake-tsunami 2005Haiti Humanitarian Appeal 2010Pakistan Floods Relief and Early Recovery Response Plan 2010Philippines − Typhoon Haiyan Strategic Response Plan
1 2 3 4 5 6
End month 1 2 3 4 5 6 7 8 9 10 11 12
71%
48% 53% 58% 62%
10%
20%
30%
PR
OP
OR
TIO
N O
F R
EQU
IREM
ENTS
MET
(%)
40%
50%
60%
70%
80%
Mon
th 3
Mon
th 4
Mon
th 5
Republic of South Sudan 2013Central African Republic 2013Yemen Humanitarian Response Plan 2013Syria (SHARP)Syria (RRP)
End month 1 2 3 4 5 6 7 8 9 10 11 12
71%
48% 53% 58% 62%
10%
20%
30%
PR
OP
OR
TIO
N O
F R
EQU
IREM
ENTS
MET
(%)
40%
50%
60%
70%
80%
Mon
th 3
Mon
th 4
Mon
th 5
Republic of South Sudan 2013Central African Republic 2013Yemen Humanitarian Response Plan 2013Syria (SHARP)Syria (RRP)
Figure 7.1
Timing of funding response to four natural disasters: Indian Ocean tsunami-earthquake, Haiti earthquake, pakistan floods and philippines' Typhoon Haiyan
Figure 7.2
Timing of funding response to five UN appeals, 2013: conflicts and complex emergencies in Syria, Central African Republic, Yemen and South Sudan
Source: Development Initiatives based on UN OCHA FTS data
Source: Development Initiatives based on UN OCHA FTS data
CHAPTER 7: HOW QUICKLY AND FOR HOW LONG?
83
Figure 7.3
Funding to Syria crisis and number of registered Syrian refugees, December 2012 to December 2013
Figure 7.4
Funding to CAR crisis and number of internally displaced persons, December 2012 to December 2013
Source: Development Initiatives based on UN OCHA FTS, UNHCR, IDMC data and media reports
US$
MIL
LIO
NS
0
0.5
1.0
1.5
2.0
2.5
0 100 200 300 400 500 600 700 800
Jan Feb Mar Apr May Jun Jul Aug Sep Oct Nov Dec NU
MB
ER O
F R
EFU
GEE
S (M
ILLI
ON
S)
Funding to Syria emergency Number of registered Syrian refugees
US$
MIL
LIO
NS
30 January 2013
Donors pledge more than US$1.5bn towards the crisis at a pledging conference in Kuwait
15 January 2013
Syria declared a Level 3 Emergency
19 December 2012
UN launches Syria 2013 SHARP and RRP, with combined requirements of US$1.6bn
April 2013
Number of registered Syrian refugees exceeds 1 million
July 2013
Syrian death toll reaches 100,000
21 August 2013
Chemical weaponsreported to havebeen used
December 2013
Number of internallydisplaced persons rises to 6.5 million
19 December 2013
UN launches Syria 2014 SHARP and RRP. Needs in excess of US$6bn
7 June 2013
SHARP and RRP requirements increasesharply to US$4.4bn
0 100 200 300 400 500 600700
800
0 5
10 15 20 25 30 35 40 45
NU
MB
ER O
F IN
TER
NA
LLY
DIS
PLA
CED
P
EOP
LE (T
HO
USA
ND
S)
Funding to CAR emergency Number of internally displaced persons
5 December 2013
UN Security Councilapproves new peace-keeping force in CARamid mounting violence
17 July 2013
CAR UN appealrequirements increase to US$195m
September 2013
Sectarian violence flares up between Séléka and anti-Balaka groups
December 2012
Séléka rebels launchoffensive against CARgovernment
24 March 2013
Séléka seize power − CAR President François Bozizé flees
November 2013
1.3 million inurgent need offood assistance
18 August 2013
Séléka coup leader swornin as CAR president
10 December 2012
UN launches CAR 2013 consolidated appeal, with requirements of US$129m
11 December 2013
CAR declared aLevel 3 Emergency
Dec Jan Feb Mar Apr May Jun Jul Aug Sep Oct Nov Dec 2012 2013
Dec 2012 2013
US$
MIL
LIO
NS
0
0.5
1.0
1.5
2.0
2.5
0 100 200 300 400 500 600 700 800
Jan Feb Mar Apr May Jun Jul Aug Sep Oct Nov Dec NU
MB
ER O
F R
EFU
GEE
S (M
ILLI
ON
S)
Funding to Syria emergency Number of registered Syrian refugees
US$
MIL
LIO
NS
30 January 2013
Donors pledge more than US$1.5bn towards the crisis at a pledging conference in Kuwait
15 January 2013
Syria declared a Level 3 Emergency
19 December 2012
UN launches Syria 2013 SHARP and RRP, with combined requirements of US$1.6bn
April 2013
Number of registered Syrian refugees exceeds 1 million
July 2013
Syrian death toll reaches 100,000
21 August 2013
Chemical weaponsreported to havebeen used
December 2013
Number of internallydisplaced persons rises to 6.5 million
19 December 2013
UN launches Syria 2014 SHARP and RRP. Needs in excess of US$6bn
7 June 2013
SHARP and RRP requirements increasesharply to US$4.4bn
0 100 200 300 400 500 600700
800
0 5
10 15 20 25 30 35 40 45
NU
MB
ER O
F IN
TER
NA
LLY
DIS
PLA
CED
P
EOP
LE (T
HO
USA
ND
S)
Funding to CAR emergency Number of internally displaced persons
5 December 2013
UN Security Councilapproves new peace-keeping force in CARamid mounting violence
17 July 2013
CAR UN appealrequirements increase to US$195m
September 2013
Sectarian violence flares up between Séléka and anti-Balaka groups
December 2012
Séléka rebels launchoffensive against CARgovernment
24 March 2013
Séléka seize power − CAR President François Bozizé flees
November 2013
1.3 million inurgent need offood assistance
18 August 2013
Séléka coup leader swornin as CAR president
10 December 2012
UN launches CAR 2013 consolidated appeal, with requirements of US$129m
11 December 2013
CAR declared aLevel 3 Emergency
Dec Jan Feb Mar Apr May Jun Jul Aug Sep Oct Nov Dec 2012 2013
Dec 2012 2013
GLOBAL HUMANITARIAN ASSISTANCE REPORT 2014
84
The majority of international humanitarian assistance continues to go to long-term recipient countries. In 2012, 66% of humanitarian assistance from OECD DAC donors went to such countries, defined as those having received an above-average share of their official development assistance (ODA) in the form of humanitarian assistance for eight or more of the alast 15 years. In the same year, a further 12% went to medium-term recipients – those receiving an above average share for three to seven years inclusive.5
OECD DAC recipient country data for 2013 is not yet available, so these figures do not reflect the high levels of funding to Syria or neighbouring countries affected by the conflict. Most of these countries would currently fall into the short-term recipient category, as they have been in receipt of high levels of humanitarian assistance for less than two years. However, it appears that the conflict and the refugee situation will not be short-
term crises and Syria and some of its neighbours may become medium or long-term recipients.
Despite the fact that less than one-quarter (22%) of humanitarian assistance from OECD DAC donors in 2012 went to short-term recipients, humanitarian assistance still tends to be conceived and delivered in short-term cycles. The fact that the majority of humanitarian assistance goes to long-term recipients experiencing recurrent or protracted crises and people facing chronic poverty (see Figure 7.6), poses a challenge to humanitarian donors and implementing organisations to fund and plan over a longer timeframe. As this and the analysis in Chapter 8 shows, it also poses a challenge to development actors to invest in building resilience and in addressing the chronic poverty, risks and vulnerabilities that cause crises to recur or become entrenched.
Long and medium-term humanitarian assistance
2
4
6
8
10
12
1990
1991
1992
1993
1994
1995
1996
1997
1998
1999
2000
2001
2002
2003
2004
2005
2006
2007
2008
2009
2010
2011
2012
US$
BIL
LIO
NS
Long term (8 years or more) Medium term (3-7 years inclusive) Short term (under 3 years)
Source: Development Initiatives based on OECD DAC data
Figure 7.5
Long, medium and short-term recipients of official humanitarian assistance from DAC donors, 1990–2012
CHAPTER 7: HOW QUICKLY AND FOR HOW LONG?
85
CHAPTER 7: HOW QUICKLY AND FOR HOW LONG?
The need for a longer-term humanitarian assistance and resilience approach in protracted and recurrent crises has prompted the advent of multi-year, UN-coordinated appeals. In 2013, Somalia was the first and only country to launch a multi-year appeal. In 2014, a further 13 countries had multi-year strategic response plans (SRPs).6
The Somalia plan integrates life-saving and livelihood support to address the cycle of recurring crises brought on by drought and conflict. Within its multi-year framework (called a consolidated appeal process (CAP) appeal because it was introduced in 2013, before the changes to the system), annual SRPs are developed to reflect changes and short-term shocks.
This framework could be an opportunity to secure multi-year funding, supporting predictability, continuity and long-term approaches in programming. However, while the umbrella document for the Somalia CAP provides an indication of financial requirements for the full three-year timeframe, the annual response plans present strategies with one-year financial requirements only; and multi-year initiatives are not easily distinguishable from short-term projects.
The two largest donors in Somalia (the United States (US) and the EU institutions) continue their 12 or 18-month funding cycles but the following donors are providing multi-year funding:
• United Kingdom (UK) – US$89 million over four years (late 2013 to late 2017), including US$41 million to a joint UNICEF/Food and Agriculture Organization (FAO)/World Food Programme (WFP) resilience programme and US$33 million to the Livelihoods and Resilience Consortium; DFID agreed this multi-year programme prior to the introduction of the multi-year CAP.
• Sweden – US$15 million over three years (2013–2015), of which US$9 million is for the multi-year (2013–2016) Somalia Resilience Program (SomReP); Sweden cites the multi-year CAP as the main reason for its multi-year funding.
• Denmark – over US$11m to Office of the United Nations High Commissioner for Refugees (UNHCR) over two years (2012–2013), and over US$20 million over three years (2013 –2015) including grants to FAO and SomReP. Notably, this funding comes from both development and humanitarian budget lines; grants were awarded prior to the multi-year CAP but are in line with its priorities.
The Somalia Humanitarian Donor Group (chaired by European Commission's Department of Humanitarian Aid and Civil Protection (ECHO) and Sweden) is currently considering the effects of this multi-year CAP. One concern is that its strong resilience focus may over-shadow insufficiently sign-posted urgent humanitarian needs. Indeed, in June 2014, the Emergency Response Coordinator (ERC) issued an urgent request to the UN Security Council for an immediate injection of US$60 million7 to meet the most urgent funding needs within the critically underfunded appeal. A full evaluation of the Somalia multi-year CAP is not in OCHA’s plans, but such a review would yield lessons for all multi-year appeals – including effects on volumes and duration of humanitarian assistance and other resource flows, as well as challenges in balancing urgent response with resilience-building.
In focus: Multi-year approaches and the Somalia appeal
In 2013, Somalia had the first and only multi-year appeal. In 2014, a further 13 countries had them.
GLOBAL HUMANITARIAN ASSISTANCE REPORT 2014
86
Resilience has been defined as “the ability of individuals, communities and states and their institutions to absorb and recover from shocks, while positively adapting and transforming their structures and means for living in the face of long-term changes and uncertainty”.8 The concern for resilience arises from the need to address the underlying poverty, inequalities and insecurities that drive people into crisis and prevent them from emerging and staying out of crisis. As such it demands resources and policies beyond humanitarian assistance, a context-specific blend including those resource flows explored in Chapter 8.
The concept of resilience continues to gain momentum in the run-up to three major global processes in 2015: the creation of a successor to the Hyogo Framework for Action (HFA2) 2005–2015, the agreement of the post–2015 sustainable development goals and a new, international climate change agreement. The World Humanitarian Summit in 2016 represents an opportunity to develop a humanitarian ecosystem that supports and complements the commitments emerging from these three processes. To date, resilience discussions and initiatives have tended to focus on drought, food insecurity and natural disasters, with strong links to DRR. Application of this approach to conflict settings is much more emergent, with UNICEF trialling the first multi-stakeholder resilience systems analysis in Eastern DRC in 2014.9
While resilience demands a major change in policy, institutional structures and programming, it also demands shifts in funding;
and shifts in funding can, in turn, change behaviour and approaches. Some donors have developed resilience funding initiatives to better bridge humanitarian and development aid.
European Commission: Supporting Horn of Africa's Resilience (SHARE)
Established in 2012 after the food crisis, SHARE is a US$358 million10 joint humanitarian and development initiative to build resilience to drought. It aims to improve the livelihoods of farming and pastoralist communities as well as the capacity of public services to respond to crises. SHARE-funded programmes include improving land resource management, as well as the income opportunities for livestock-dependent populations. In the long term they aim to find lasting solutions for the heavy burden of both chronic malnutrition and protracted displacement.11
USAID: Resilience in the Sahel-Enhanced (RISE) initiative12
Through the five-year RISE initiative, USAID aims to join up its humanitarian and development efforts in the Sahel to address the root causes of vulnerability in the region. In its first two years, US$130 million has been allocated for areas in Niger and Burkina Faso. Its stated goal is to break the crisis cycle of an estimated 1.9 million people, and to reduce the need for future
humanitarian assistance. RISE is not a new programme as such but rather an initiative to integrate existing humanitarian and development programming [or assistance].
DFID: Multi-year approach in Yemen
As seen in the Somalia example on page 86, multi-year humanitarian assistance can contribute to resilience-building but cannot be expected to do so alone or automatically. To better understand this relationship, DFID has commissioned a global review of its multi-year funding, including in DRC, Pakistan and Yemen. In Yemen, a major medium-term recipient of humanitarian assistance, DFID is the first donor to move to multi-year humanitarian financing and is doing so with an explicit resilience focus.13 A pilot ‘crisis modifier’ (see page 82) is under development; this aims to help people maintain their purchasing power in the event of dramatic changes in food prices.14
Sweden: Inclusion in humanitarian and development assistance
The Swedish International Development Cooperation Agency (Sida) considers reducing risk as a key component of both humanitarian and long-term development assistance and is committed to including risk reduction and resilience in its programming.15 Financial contributions include US$7 million to UNDP’s Comprehensive Disaster Management Programme in Bangladesh, 2011–2012.16 The programme aims to strengthen national capacity to manage risks, including during response and recovery efforts. An important part of this approach is recognising all hazards, as well as integrating DRR and adaptation measures to build communities’ resilience.
Financing for resilience
The concept of resilience continues to gain momentum in the run up to three major global processes in 2015: HFA2, the post-2015 sustainable development goals, and a new climate change agreement.
CHAPTER 7: HOW QUICKLY AND FOR HOW LONG?
87
GLOBAL HUMANITARIAN ASSISTANCE REPORT HIGHLIGHTS 2014GLOBAL HUMANITARIAN ASSISTANCE REPORT 2014
MILLIONS OF PEOPLE LIVING IN $1.25 A DAY POVERTY
AN
NU
AL
GO
VER
NM
ENT
EXP
END
ITU
RE
PER
PER
SON
(PP
P$
)
Long
-ter
m r
ecip
ient
of H
uman
itari
an A
ssis
tanc
e (8
yea
rs o
r m
ore)
M
ediu
m-t
erm
rec
ipie
nt (3
−7 y
ears
incl
usiv
e)
Shor
t-te
rm r
ecip
ient
(und
er 3
yea
rs)
0 1
10
100
1,0
00 0
500
1,00
0 1,
500
2,00
0 2,
500
DR
C CA
R
Eth
iopi
a
Nig
er
Mal
i
Pak
ista
n
Ban
glad
esh
Su
dan
Cam
eroo
n
Côt
e d'
Ivoi
re
Ph
ilip
pin
es
Yem
en
Indo
nes
ia
Con
go,
Rep
ubl
ic o
f
Sri
Lan
ka
Iran
Geo
rgia
Mau
rita
nia
Ken
ya
Mad
agas
car
Indi
a
Figu
re 7
.6
Long
, med
ium
and
sho
rt-t
erm
rec
ipie
nts
of h
uman
itari
an a
ssis
tanc
e: le
vels
of p
over
ty,
dom
estic
res
ourc
es a
nd h
uman
itari
an a
ssis
tanc
e, 2
012
Sour
ce: D
evel
opm
ent I
nitia
tives
bas
ed o
n W
orld
Ban
k an
d O
ECD
DAC
dat
a
Not
e: C
hart
use
s a
loga
rith
mic
sca
le. B
ubbl
e si
ze r
epre
sent
s th
e vo
lum
e of
hum
anita
rian
ass
ista
nce
each
cou
ntry
rec
eive
d in
201
2. P
over
ty d
ata
is th
e la
test
ava
ilabl
e es
timat
e (n
ote
that
for
som
e co
untr
ies
estim
ates
are
pre
-cr
isis
). Fo
r So
uth
Suda
n, S
omal
ia a
nd A
fgha
nist
an th
ere
are
no e
stim
ates
of $
1.25
a d
ay p
over
ty. L
onge
r-te
rm r
ecip
ient
s ar
e de
fined
as
thos
e ha
ving
rec
eive
d an
abo
ve a
vera
ge s
hare
of t
heir
OD
A in
the
form
of h
uman
itari
an
assi
stan
ce fo
r ei
ght o
r m
ore
of th
e la
st 1
5. M
ediu
m-t
erm
is d
efine
d as
thre
e to
sev
en y
ears
incl
usiv
e an
d sh
ort-
term
as
unde
r th
ree
year
s.
GLOBAL HUMANITARIAN ASSISTANCE REPORT 2014
88
International humanitarian assistance should act to fill the gap where domestic resources are not able to meet urgent needs. Government spending across all developing countries is on average PPP$2,170 (2011 PPP$) but in many countries that receive humanitarian assistance, the figure is much lower.
Indeed, 35% of total humanitarian assistance in 2012 went to countries where government spending is less than PPP$500 per citizen per year, such as Ethiopia, Democratic Republic of Congo (DRC), Niger and Mali; and a further 19% to countries where government spending is between PPP$500 and PPP$1,000 per citizen per year.
It is not surprising that long-term crisis, poverty and limited domestic capacity are often found in the same places. Crises both drive people into poverty and erode their ability to improve their wellbeing, while poverty, in turn, undermines their resilience to shocks. An estimated 179.5 million people were living in extreme poverty in the 30 long-term recipient countries of humanitarian assistance.17
In 2012, 38% of funding to long-term humanitarian recipients was spent in countries with per capita government expenditure of less than PPP$500 and 50% was spent in those with less than PPP$1,000. This can be seen in Figure 7.6 where recipients of large volumes of humanitarian assistance are long-term recipients (shaded blue) and also tend to appear in the top left corner of the distribution as they have large populations living in poverty and low per capita government expenditure.
Conversely, in countries such as Turkey, which has relatively high levels of government spending and low incidence of poverty, international humanitarian assistance acts to support response to short-term
shocks rather than to respond to recurrent or protracted crises that are rooted in chronic vulnerabilities.
The relationship between poverty and humanitarian crisis is long-understood and is increasingly gaining recognition. Resilience is providing a common concept to bring humanitarian and development actors together to address the challenges of poverty, risk and crisis. While this connection was not explicit in the targets set in the Millennium Development Goals, it is informing the negotiation of the forthcoming sustainable development goals, due to be finalised in 2015.
Poverty and long-term humanitarian assistance
DATA pOVERTY: pOVERTY DATA
Of the 30 countries categorised as long-term recipients over the past 15 years, 25 were classed as fragile states in 2013.9 Reliable data, such as government expenditure and poverty rates, is often absent in such countries, part of the pervasive challenge of measuring poverty faced in many contexts. For example, the levels of extreme poverty are not known for eight of the 30 long-term recipient countries, including Somalia, Afghanistan and Myanmar.
Even in countries where data is available, it is possible that humanitarian crises have increased poverty levels and affected government expenditure even further since figures were last gathered. In Syria for example, there is no data to show how steeply the conflict has driven up poverty; the most recent data on poverty was collected a decade ago and shows pre-conflict
poverty at the relatively low rate of 1.7% (2004). The conflict has had a dramatic effect on the poverty levels of the population in Syria, both directly and indirectly as a result of falling agricultural production and a contracting economy. Measured against national benchmarks, almost two-thirds of the population are now living in extreme poverty.18
In sub-Saharan Africa, 43 of 49 countries conduct poverty surveys
– but only 28 of these have been conducted in the past seven years. A quarter of the region’s population is estimated to be living in extreme poverty – but this figure is derived from data collected in 2005 or earlier.
CHAPTER 7: HOW QUICKLY AND FOR HOW LONG?
89
PakistanDemocratic Republic of Congo
POVERTY RATES
Total population
$2 a day, % of population
$1.25 a day, % of population
$4 per day % of population
NET ODA PER POOR PERSON
GOVERMENT SPENDING PER CAPITA
HUMANITARIAN ASSISTANCE PER CRISIS-AFFECTED PERSON
$99 $110
$104 $68
$88
88%95%99%
31%21%
60%93%
66%94%
Ethiopia
$127
$206
$124
$939
Figure 7.7
Poverty and major resource profiles of three long-term recipients of humanitarian assistance, 2012
Source: Development Initiatives based on World Bank, OECD DAC, UN OCHA FTS and IMF WEO data, and UNHCR, EMDAT CRED, IDMC and UN appeal documents
GLOBAL HUMANITARIAN ASSISTANCE REPORT 2014
90
WHAT OTHER RESOURCES ARE IMpORTANT?
8CHApTER
While humanitarian assistance constitutes just 3% of international resource flows to the top humanitarian recipients, it retains a critical and unique function. It is intended to impartially and independently reach those who are in most acute need – and who are often beyond the reach of other resources. However, those worst affected by humanitarian crises are the most vulnerable: people facing poverty, insecurity and marginalisation. This means it is vital that all resources – public, private, domestic, international – are used coherently to improve the lives of these crisis-affected people in the long and the short term.
This chapter compares resource flows to the top recipients of humanitarian assistance against developing countries more broadly and finds some notable differences. For many major humanitarian assistance recipients, per capita government expenditure – a measure of a government’s capacity to meet the needs of its people and manage challenges – is low, with little prospect for growth. This accords greater importance to international resources.
Official development assistance (ODA) represents more than twice the proportion of international resources for top humanitarian recipients than for other developing countries. Peacekeeping is seven times the proportion: in conflict-affected states, peacekeeping missions represent a significant source of international expenditure. Conversely, private investment constitutes a much lower proportion of international resource flows, and much of this is captured by a limited group of countries. Climate financing and new risk financing products exemplify areas where both private and public resources have a role to play in building resilience and reducing risk – but currently have limited application in crisis-affected countries. Remittances constitute an average 21% of international resources for the largest humanitarian recipients. But their significance varies widely between countries – in Pakistan, for example, they account for 66% of incoming international resources.
91
US$ 41.2bn
US$67.8bn
US$ 28.6bn
US$ 7.5bn
US$ 43.9bn
US$419.8bnDOMESTIC GOVERNMENT
EXPENDITURE
FOREIGN DIRECTINVESTMENT
LONG-TERM DEBT
US$6.4bn PEACEKEEPING
US$6.8bn OTHER OFFICIAL FLOWS (GROSS)
DEVELOPMENTASSISTANCE
SHORT-TERM DEBT
REMITTANCES
US$5.5bn INTERNATIONAL HUMANITARIAN ASSISTANCE
PEOPLE IN CRISIS
US$2.0bn PORTFOLIO EQUITY
Not to scale
Figure 8.1
Funding flows to top humanitarian assistance recipients, 2012
Source: Development Initiatives based on IMF World Economic Outlook (WEO), OECD DAC, UN OCHA FTS, World Bank, UNCTAD and SIPRI data Notes: Recipient data for some flows, such as private development assistance from NGOs, is not available and is therefore excluded from this analysis. Data in this graph and throughout the chapter includes 17 of the top 20 recipients between 2003 and 2012. Due to data limitations, West Bank & Gaza Strip, Somalia and Syria have been excluded from the analysis. Negative values for short-term debt and portfolio equity have been changed to zero.
92
Of the top 20 recipients of humanitarian assistance over 2003–2012, seventeen have comparable data across a range of other financial resources.1 Comparing this group to developing countries as a whole reveals substantial differences in the scale and range of resources available.
Domestic government expenditure is by far the largest resource available to developing countries – US$6.4 trillion on aggregate in 2012. But in the top humanitarian assistance recipients, domestic expenditure per person is extremely low, averaging PPP$1,190 (when adjusted for purchasing power parity) across the group. This is just over half the PPP$2,170 average for all developing countries and just 7% of the Organisation for Economic Cooperation and Development (OECD) Development Assistance Committee (DAC) average of PPP$16,920.
Among the ten largest humanitarian assistance recipients, six have extremely low domestic spending levels: Democratic Republic of Congo (DRC) (PPP$88 per person in 2012, just 4% of the all developing country average); Ethiopia (PPP$206, 9%); Haiti (PPP$433, 20%); Sudan (PPP$457, 21%); Afghanistan (PPP$471, 22%); and Pakistan (PPP$939, 43%).
Domestic resources in most – but not all – crisis-affected countries look likely to remain stagnant with little prospect of government expenditure rising to required levels. They are trapped in a vicious circle of low income growth, which limits the potential for raising tax revenues.
These domestic limitations mean international flows are much more important for crisis-affected countries – equivalent to approximately 50% of domestic government spending available to the top humanitarian recipients, compared to the 30% developing country average.
Within these international flows to the group of top humanitarian recipients, ODA (excluding humanitarian assistance) notably accounts for more than double the proportion of international flows (14%) than for the developing country average (5%). It is the largest international resource flow for Afghanistan (75%), Kenya (49%), and Ethiopia (39%) and accounts for over one-quarter of international flows into Uganda (33%), DRC (30%), Iraq (28%) and Haiti (25%).
The proportion of humanitarian assistance to the top humanitarian recipients is six times higher than to developing countries more widely, and peacekeeping is seven times higher to the top humanitarian recipients.Although humanitarian assistance still only accounts for around 3% of total international resources to this group, it remains critical to meet needs that other resources do not. Of the top 20 humanitarian assistance recipients between 2003 and 2012, nine received over 5% of their international inflows in the form of humanitarian assistance in 2012, the highest being Chad.
Debt was notably the largest single international resource flow to the group, in 2012: short and long-term debt combined accounted for 36% of international resources ($75.3 billion). However, three quarters of this was driven by one large emerging economy, Indonesia: debt accounted for 62% of its total resource inflows that year.
Remittances and foreign direct investment (FDI) are also significant, each accounting for over US$40 billion of inflows to the largest humanitarian recipients. Remittances account for 21% of total inflows (US$43.9 billion) and are the largest single international resource for Pakistan (66% of all international flows), Sri Lanka (51%), Jordan (43%), Haiti (39%) and Lebanon (38%).
FDI reached US$41.2 billion for the group of largest humanitarian recipient countries in 2012. This accounts for 20% of all international flows to these countries, a notably lower proportion than the 26% for developing countries. However, it accounted for more than half of inflows for Myanmar (67%) and Iraq (59%) and large proportions for DRC (41%) and Sudan (40%). All four are resource-rich countries and FDI is attracted by their large extractive industries.
In the top recipient countries of humanitarian assistance, domestic spending per person is half of the average in developing countries – and just 7% of that in DAC member countries.
Resources available to countries in crisis
DATA pOVERTY: OTHER RESOURCES
Data on resource flows beyond ODA can be poor – and for some recipients, and often those most affected by crises, such as South Sudan, Somalia and the West Bank & Gaza Strip, data is minimal. There is an equal paucity of data on poverty (see Chapter 7).
While national data may be poor, sub-national data is usually completely absent. This is particularly problematic for regional and local crises within countries or in border regions, and makes it extremely difficult to target resources effectively.
CHAPTER 8: WHAT OTHER RESOURCES ARE IMPORTANT?
93
3% 14%
3%
21% 20%
4%
1%3%
4%
20 largest humanitarian assistance recipients
All developing countries
Portfolio equity Peacekeeping
Humanitarian assistance
Humanitarian
assistance
Development assistance Development
assistance
Other official flows (gross)
Other official flows (gross)
Remittances Foreign direct investment
Foreign direct investment
Short-term debt
Portfolio equity Peacekeeping
32%
Long-term debt
US$1.9 trillionInternational resources
0.4%5%
0.4%
20%
Remittances
26%32%
Long-term debt
Short-term debt
6%
7%
US$209.9bn
US$419.8bn
International resources
Domestic government expenditure
US$6.4 trillionDomestic government
expenditure
Figure 8.2
2012 resource mix for the top 20 recipients of humanitarian assistance, 2003–2012
Source: Development Initiatives based on IMF WEO, OECD DAC, UN OCHA FTS, World Bank, UNCTAD and SIPRI data Notes: Figures are based on 2012 funding flows for 17 of the top 20 recipients of humanitarian assistance between 2003 and 2012. Humanitarian assistance is GHA's international humanitarian assistance figure. Development assistance is total ODA minus official humanitarian assistance. Negative values for short-term debt and portfolio equity have been changed to zero.
GLOBAL HUMANITARIAN ASSISTANCE REPORT 2014
94
3% 14%
3%
21% 20%
4%
1%3%
4%
20 largest humanitarian assistance recipients
All developing countries
Portfolio equity Peacekeeping
Humanitarian assistance
Humanitarian
assistance
Development assistance Development
assistance
Other official flows (gross)
Other official flows (gross)
Remittances Foreign direct investment
Foreign direct investment
Short-term debt
Portfolio equity Peacekeeping
32%
Long-term debt
US$1.9 trillionInternational resources
0.4%5%
0.4%
20%
Remittances
26%32%
Long-term debt
Short-term debt
6%
7%
US$209.9bn
US$419.8bn
International resources
Domestic government expenditure
US$6.4 trillionDomestic government
expenditure
Figure 8.3
2012 resource mix for all developing countries, 2003–2012
CHAPTER 8: WHAT OTHER RESOURCES ARE IMPORTANT?
Source: Development Initiatives based on IMF WEO, OECD DAC, UN OCHA FTS, World Bank, UNCTAD and SIPRI data Note: Figures are based on 2012 funding flows for 17 of the top 20 recipients of humanitarian assistance between 2003 and 2012. Negative values for short-term debt and portfolio equity have been changed to zero.
95
International resources Domestic government expenditure
International resources Domestic government expenditure
7%
39%
1%
7%
32%
13%
7%
7% 10%
1%
6%
40%
29%
Humanitarian assistance
Humanitarian assistance
Development assistance
Development assistance
OOFs (gross)
OOFs (gross)
OOFs (gross)
OOFs (gross)
OOFs (gross) OOFs
(gross)
OOFs (gross)
Remittances
Remittances
Sudan
Ethiopia Iraq
Pakistan Afghanistan Haiti
Democratic Republic of Congo Indonesia
FDI
FDI
Peace-keeping
Humanitarian assistance
Development assistance Remittances
FDI
Long / short-term debt
Long / short-term debt
Long / short-term debt
Long / short-term debt
Long / short-term debt
Long / short-term debt
Long / short-term debt
2% 6%28%
59%
0.2%
5%
Humanitarian assistance
Development assistance
Remittances
FDI
Portfolio equity
Portfolio equity Portfolio
equity
Peace-keeping
11%
4%
11%2%
1%
66%
4%
1%
30%6%
18% 4%
41%
Humanitarian assistance
Development assistance
FDI
Peace-keeping
6% 75%
1%
6%
0.1%
1%
0.02%
0.03% 11%
Humanitarian assistance
Development assistance
Remittances
FDI
Portfolio equity
Peace-keeping
0.1%
5%
8%2%
2% 62%
22%
Humanitarian assistance
Development assistance
Remittances
FDI
Portfolio equity
25%
0.2%
6% 39%
8%17%
4%
Humanitarian assistance
Development assistance
Remittances
FDI
Peace-keeping
US$6.1bn
US$8.5bn
US$21.2bn
US$48.6bn
US$7.2bn
US$7.2bn
US$8.3bn
US$5.1bn
US$4.2bn
US$2.2bn
US$8.0bn
US$5.4bn
US$91.6bn
US$173.1bn US$93.5bn
US$4.3bn
Figure 8.4
2012 resource mix for top humanitarian recipients, 2003 –2012
Source: Development Initiatives based on IMF WEO, OECD DAC, UN OCHA FTS, World Bank, UNCTAD and SIPRI data Notes: Humanitarian assistance is GHA's international humanitarian assistance figure. Development assistance is total ODA minus official humanitarian assistance.
GLOBAL HUMANITARIAN ASSISTANCE REPORT 2014
International resources Domestic government expenditure
International resources Domestic government expenditure
7%
39%
1%
7%
32%
13%
7%
7% 10%
1%
6%
40%
29%
Humanitarian assistance
Humanitarian assistance
Development assistance
Development assistance
OOFs (gross)
OOFs (gross)
OOFs (gross)
OOFs (gross)
OOFs (gross) OOFs
(gross)
OOFs (gross)
Remittances
Remittances
Sudan
Ethiopia Iraq
Pakistan Afghanistan Haiti
Democratic Republic of Congo Indonesia
FDI
FDI
Peace-keeping
Humanitarian assistance
Development assistance Remittances
FDI
Long / short-term debt
Long / short-term debt
Long / short-term debt
Long / short-term debt
Long / short-term debt
Long / short-term debt
Long / short-term debt
2% 6%28%
59%
0.2%
5%
Humanitarian assistance
Development assistance
Remittances
FDI
Portfolio equity
Portfolio equity Portfolio
equity
Peace-keeping
11%
4%
11%2%
1%
66%
4%
1%
30%6%
18% 4%
41%
Humanitarian assistance
Development assistance
FDI
Peace-keeping
6% 75%
1%
6%
0.1%
1%
0.02%
0.03% 11%
Humanitarian assistance
Development assistance
Remittances
FDI
Portfolio equity
Peace-keeping
0.1%
5%
8%2%
2% 62%
22%
Humanitarian assistance
Development assistance
Remittances
FDI
Portfolio equity
25%
0.2%
6% 39%
8%17%
4%
Humanitarian assistance
Development assistance
Remittances
FDI
Peace-keeping
US$6.1bn
US$8.5bn
US$21.2bn
US$48.6bn
US$7.2bn
US$7.2bn
US$8.3bn
US$5.1bn
US$4.2bn
US$2.2bn
US$8.0bn
US$5.4bn
US$91.6bn
US$173.1bn US$93.5bn
US$4.3bn
96
International resources Domestic government expenditure
International resources Domestic government expenditure
7%
39%
1%
7%
32%
13%
7%
7% 10%
1%
6%
40%
29%
Humanitarian assistance
Humanitarian assistance
Development assistance
Development assistance
OOFs (gross)
OOFs (gross)
OOFs (gross)
OOFs (gross)
OOFs (gross) OOFs
(gross)
OOFs (gross)
Remittances
Remittances
Sudan
Ethiopia Iraq
Pakistan Afghanistan Haiti
Democratic Republic of Congo Indonesia
FDI
FDI
Peace-keeping
Humanitarian assistance
Development assistance Remittances
FDI
Long / short-term debt
Long / short-term debt
Long / short-term debt
Long / short-term debt
Long / short-term debt
Long / short-term debt
Long / short-term debt
2% 6%28%
59%
0.2%
5%
Humanitarian assistance
Development assistance
Remittances
FDI
Portfolio equity
Portfolio equity Portfolio
equity
Peace-keeping
11%
4%
11%2%
1%
66%
4%
1%
30%6%
18% 4%
41%
Humanitarian assistance
Development assistance
FDI
Peace-keeping
6% 75%
1%
6%
0.1%
1%
0.02%
0.03% 11%
Humanitarian assistance
Development assistance
Remittances
FDI
Portfolio equity
Peace-keeping
0.1%
5%
8%2%
2% 62%
22%
Humanitarian assistance
Development assistance
Remittances
FDI
Portfolio equity
25%
0.2%
6% 39%
8%17%
4%
Humanitarian assistance
Development assistance
Remittances
FDI
Peace-keeping
US$6.1bn
US$8.5bn
US$21.2bn
US$48.6bn
US$7.2bn
US$7.2bn
US$8.3bn
US$5.1bn
US$4.2bn
US$2.2bn
US$8.0bn
US$5.4bn
US$91.6bn
US$173.1bn US$93.5bn
US$4.3bn
Source: Development Initiatives based on IMF WEO, OECD DAC, UN OCHA FTS, World Bank, UNCTAD and SIPRI data Notes: Humanitarian assistance is GHA's international humanitarian assistance figure. Development assistance is total ODA minus official humanitarian assistance.
International resources Domestic government expenditure
International resources Domestic government expenditure
7%
39%
1%
7%
32%
13%
7%
7% 10%
1%
6%
40%
29%
Humanitarian assistance
Humanitarian assistance
Development assistance
Development assistance
OOFs (gross)
OOFs (gross)
OOFs (gross)
OOFs (gross)
OOFs (gross) OOFs
(gross)
OOFs (gross)
Remittances
Remittances
Sudan
Ethiopia Iraq
Pakistan Afghanistan Haiti
Democratic Republic of Congo Indonesia
FDI
FDI
Peace-keeping
Humanitarian assistance
Development assistance Remittances
FDI
Long / short-term debt
Long / short-term debt
Long / short-term debt
Long / short-term debt
Long / short-term debt
Long / short-term debt
Long / short-term debt
2% 6%28%
59%
0.2%
5%
Humanitarian assistance
Development assistance
Remittances
FDI
Portfolio equity
Portfolio equity Portfolio
equity
Peace-keeping
11%
4%
11%2%
1%
66%
4%
1%
30%6%
18% 4%
41%
Humanitarian assistance
Development assistance
FDI
Peace-keeping
6% 75%
1%
6%
0.1%
1%
0.02%
0.03% 11%
Humanitarian assistance
Development assistance
Remittances
FDI
Portfolio equity
Peace-keeping
0.1%
5%
8%2%
2% 62%
22%
Humanitarian assistance
Development assistance
Remittances
FDI
Portfolio equity
25%
0.2%
6% 39%
8%17%
4%
Humanitarian assistance
Development assistance
Remittances
FDI
Peace-keeping
US$6.1bn
US$8.5bn
US$21.2bn
US$48.6bn
US$7.2bn
US$7.2bn
US$8.3bn
US$5.1bn
US$4.2bn
US$2.2bn
US$8.0bn
US$5.4bn
US$91.6bn
US$173.1bn US$93.5bn
US$4.3bn
CHAPTER 8: WHAT OTHER RESOURCES ARE IMPORTANT?
97
Remittances play an important but often overlooked role in the international humanitarian resourcing ecosystem. As a means of financing that reaches households relatively directly (with the only intermediary being the money transfer system), remittances represent an immediate, flexible and often predictable source of income. As such, they can support people and local economies to build resilience and preparedness, meet basic needs during a crisis and recover and rebuild afterwards.
Globally, the exact value of remittances to developing countries through both formal and informal channels is unknown. The World Bank estimates that remittances received by developing countries through formal channels reached US$379 billion in 2012, a real increase of 169% since 2000. In the top 20 humanitarian recipients, reported remittances through formal channels amounted to US$43.9 billion in 2012 – over one-fifth of international inflows to these countries.
The significance of remittances in relation to other international flows varies between countries. For Pakistan, Sri Lanka, Jordan, Haiti and Lebanon, remittances are the largest single international resource (see
Figure 8.4). While the World Bank does not collect remittance data for Somalia, the Food and Agriculture Organization (FAO) estimates that remittances to Somalia amount to at least US$1.2 billion per year –double the amount of international humanitarian assistance received by Somalia in 2012 (US$627 million).2 International concern was raised in 2013 when measures taken to counteract terrorism financing and money-laundering jeopardised major formal money transfer channels to Somalia from the UK.3
Remittances to the Philippines have more than trebled over the past decade, reaching US$23.4 billion in 2012.4 The number of Filipinos living abroad rose by 3.1 million between 2000 and 2012.5 Globally, the Philippines is now the third largest recipient of remittances, after India and China.6
The Central Bank of the Philippines reported US$6.7 billion of remittances in the three months following Typhoon Haiyan – nearly 10 times more than the US$709 million of international humanitarian assistance reported to UN Office for the Coordination of Humanitarian Affairs (OCHA’s) Financial Tracking Service (FTS) for the Philippines in the same period.
These remittances were of course not all prompted by or directed to the typhoon response. But the volume was 2.1% higher than the total in the previous three months and a larger increase than observed in previous years. In recognition of the importance of this flow, financial services companies such as Western Union reduced or waived remittance fees for a specific period in the aftermath of the typhoon.
Remittances
1.0%
0.1%
-0.6%
0.5%
2.1%
-1.0%
-0.5%
0.0%
0.5%
1.0%
1.5%
2.0%
2.5%
Nov 09-Jan 10
Nov 10-Jan 11
Nov 11-Jan 12
Nov 12-Jan 13
Nov 13-Jan 14
% change in remittances from previous quarter
Figure 8.5
percentage change in remittances to the philippines from previous quarter, November to January, 2009–2014
Source: The Central Bank of the Philippines (Bangko Sentral Ng Pilipinas)
DATA pOVERTY: REMITTANCES
Global data on remittances is collected by the World Bank’s Development Prospects Group, which covers annual remittance inflows for 170 countries and monthly information for 20 countries. However, global data on remittances does not exist for several crisis-affected countries. This includes the top four recipients of humanitarian assistance in 2012 (Syria, South Sudan, West Bank & Gaza Strip and Somalia) and seven of the top 20 recipients of humanitarian assistance between 2003 and 2012. Monthly data is available for only two of these countries –Pakistan and Kenya.
GLOBAL HUMANITARIAN ASSISTANCE REPORT 2014
98
Official development assistance (ODA) is the only international flow explicitly aimed at the economic development and welfare of developing countries. Under the Millennium Development Goals (MDGs), governments united around specific poverty and deprivation objectives backed by financial commitments. By 2013, two years from the 2015 MDG deadlines, ODA reached US$135 billion. This represents an average of 0.3% of donor countries' gross national income (GNI), against the 0.7% commitment made by a number of donors.
Increasing numbers of countries are providing international development assistance. Some former aid recipients are now aid donors, such as South Korea, whose development cooperation has tripled over the last decade, while current aid recipients like India and China are also donors.
ODA and ODA-like flows from donors outside the OECD DAC members group increased to an estimated US$14.3 billion in 2012, equivalent to 10% of total global development cooperation. Levels also appear to have grown at twice the rate of ODA from OECD DAC donors over the last decade – though this is partly due to better reporting, including from the 17 non-DAC donors that now report to the OECD DAC. Donors that do not report to the OECD DAC use and report on their own definitions of official development cooperation - making direct comparison with ODA problematic.
ODA plays an important role for crisis-affected countries. It represents 14% of all international resource flows to the largest recipients of humanitarian assistance – more than double the proportion going to developing countries overall, even when humanitarian assistance is excluded (see Figure 8.2). And for some countries, it is particularly significant: ODA represents 75% of Afghanistan’s international resource flows, 49% of Kenya’s and 39% of Ethiopia’s.
As a proportion of ODA, humanitarian assistance from OECD DAC donors has remained consistent at around 10% over the last decade, fluctuating only by one percentage point over the period. The relationship between this humanitarian assistance and other ODA is important, as Chapter 7 has shown. Harnessing development assistance to address people’s underlying risks and vulnerabilities, including chronic poverty, is crucial for breaking the cycle of crisis.
Official development assistance
CHAPTER 8: WHAT OTHER RESOURCES ARE IMPORTANT?
REDEFINING ODA
While ODA can be provided in many forms, the OECD DAC has strict eligibility criteria for what can and cannot be included: it must have as its primary objective the economic development and welfare of a defined group of developing countries; it must be concessional through the provision of grants or
‘soft’ loans; and certain activities, including military aid, peacekeeping operations and anti-terrorism cannot be counted. Funding from non-government donors, such as philanthropic foundations or public contributions to non-governmental organisations, cannot be considered as ODA.
In December 2012, the DAC High-Level Meeting set out an agenda to modernise the ODA definition in an attempt to make it more relevant to a post-2015 development finance agenda. It recognised that some of the rules defining the eligibility criteria (such as how concessionality is defined) have become outdated. It also recognised that government support outside the ODA definition
may have beneficial outcomes. The agenda thus attempts to recognise the wider official effort, measured both in terms of costs to donors and benefits to recipients, while maintaining a core definition of ODA that allows donors to be fairly assessed and held to account. Final recommendations are due to be adopted by OECD DAC ministers in December 2014.
Central to this may be a focus on the stated purpose of ODA. Redefining this away from economic growth and welfare to an explicit attention on people in poverty, such as the global bottom 20%, could address a number of concerns. It ensures, for example, that a focus on poverty eradication, whether direct through bilateral assistance or by supporting global public goods, is maintained. And by requiring a demonstrable focus on poor people, the debate can shift from a focus on what types of resources qualify as ODA to how they best are used.
99
Figure 8.6
ODA and development cooperation flows from OECD DAC and non-DAC donors, 2004–2013
Source: Development Initiatives based on OECD DAC data and national development cooperation data for those countries not reporting to the DAC6
Figure 8.7
Official humanitarian assistance as a share of ODA from OECD DAC donors, 2004–2013
Source: Development Initiatives based on OECD DAC data Note: 2013 data is partial and preliminary
9.9%
11.4% 10.5%
9.3% 10.4%
9.5% 10.0% 10.1% 9.5%
10.8%
0%
2%
4%
6%
8%
10%
12%
0
20
40
60
80
100
120
140
2004 2005 2006 2007 2008 2009 2010 2011 2012 2013
Humanitarian assistance from DAC donors ODA (excl. humanitarian assistance) from DAC donors Humanitarian assistance as % of ODA
US$
BIL
LIO
NS
OFF
ICIA
L H
UM
AN
ITA
RIA
N A
SSIS
TAN
CE
AS
% O
F O
DA
0
20
40
60
80
100
120
140
160
180
Development cooperation from donors not reporting to the DACODA from non-DAC donors reporting to the DACODA from DAC donors
US$
BIL
LIO
NS
2004
2006
2008
2007
2005
2010
2012
2013
2011
2009
GLOBAL HUMANITARIAN ASSISTANCE REPORT 2014
100
CHAPTER 8: WHAT OTHER RESOURCES ARE IMPORTANT?
Figure 8.8
Bilateral ODA from OECD DAC donors to conflict, peace and security, 2002–2012
Source: Development Initiatives based on OECD DAC CRS data
US$
BIL
LIO
NS
0.0%
0.5%
1.0%
1.5%
2.0%
2.5%
3.0%
3.5%
0.5
0
1.0
1.5
2.0
2.5
3.0
3.5
4.0
2002
2003
2004
2005
2006
2007
2008
2009
2010
2011
2012
Conflict, peace and securityConflict, peace and security as % of gross ODA
Development expenditure on conflict, peace and security
A small proportion of security and peacekeeping expenditure can currently be counted as ODA, if it has a development objective and does not involve direct military support.7 This includes funding for peace-building and conflict resolution, for landmine clearance and for some security sector reform activities.
The percentage of gross ODA reported as allocated to conflict, peace and security has declined to 2.4% (US$2.8 billion) from a peak
of 3.3% (US$3.7 billion) of overall ODA in 2009. However, the scope of this ODA category is controversial and fluctuations may be a result of reporting decisions by donors, as well as of changes in actual expenditure.
Between 2008 and 2012, civilian peace-building, conflict prevention and resolution accounted for the largest share of ODA from within the category of conflict, peace and security spending (47%). Landmine clearance accounted for 10%. According to
the Landmine and Cluster Munition Monitor, in 2013, 59 states and four other areas were mine-affected, causing direct casualties as well as limiting land-based livelihoods.8 The smallest share (1% or US$0.1billion) went towards the prevention or demobilisation of child soldiers. A 2014 UN report documented cases of child soldiers in eight national armies and 51 armed groups including in Syria, Iraq, Nigeria and South Sudan.9
Figure 8.9
Bilateral ODA from OECD DAC donors to conflict, peace and security, 2008–2012
Source: Development Initiatives based on OECD DAC CRS data Notes: Post-conflict peace building code (15230) was changed to participation in international peacekeeping operations in 2010. SALW = small arms and light weapons
25% US$4.1bn Security system management and reform
47% US$7.9bn Civilian peace-building, conflict prevention and resolution
11% US$1.9bn Participation in international peacekeeping operations
6% $1.0bn Reintegration and SALW control
10% US$1.7bn Land mine clearance
1% $0.1bn Child soldiers (prevention and demobilisation)
101
GLOBAL HUMANITARIAN ASSISTANCE REPORT 2014
Figure 8.10
Cost of multilateral peacekeeping operations, 2003–2014
Source: Development Initiatives based on SIPRI and UN data Notes: Includes ECCAS, OAS, ECOWAS missions as well as bilateral or independent missions such as the Swiss / Swedish on the Korean border. Iraq multinational force has been left out. UN figure includes political and observer missions. For 2013 only full figures for UN operations are available, and for 2014 only estimates for UN operations.
3.1
4.8
6.4 6.7 7.5
8.8 9.1 8.9 9.8
9.1 7.8
8.6
0
2
4
6
8
10
12
2003
2004
2005
2007
2008
2009
2010
2012
2013
2014
UN (estimate)OtherOSCEAUEUNATOAU/UNUN
2006
2011
US$
BIL
LIO
NS
Peacekeeping
Global military and security expenditure in 2012 was an estimated US$1.8 trillion, or 2.5% of global gross domestic product (GDP). This expenditure encompassed a vast range of objectives, activities (military and non-military) actors (state and non-state), and of course had a vast range of impacts on civilians. Against this, an estimated US$212 billion was spent worldwide by states on multilateral peacekeeping and foreign military interventions in developing countries in 2011.10 Of this, US$197 billion was spent in Afghanistan and Iraq.
In 2012, the latest year for which comprehensive data is available, spending on multilateral peacekeeping missions was US$9.1 billion, US$5.7 billion of which was on UN missions. During the same year, government contributions to humanitarian assistance totalled US$13.2 billion.
However, available data since 2012 indicates that the global peacekeeping figure may rise in 2013 and 2014, reflecting a rise in the number as well as the cost of peacekeeping missions. In 2013, the UN deployed a peacekeeping mission to Mali (MINUSMA) with a 2013 –2014 budget of US$602 million, and, in 2014, to the Central African Republic (MINUSCA) with estimated costs of US$313 million for the year.11
The 2013 –2014 UN peacekeeping budget was set at just over US$7.8 billion, and the 2014–2015 budget estimated at US$8.6 billion, to cover 16 peacekeeping missions with just under 120,000 personnel. The largest of these missions is in Democratic Republic of Congo (DRC), with over 25,000 personnel and a 2013 –2014 budget of US$1.5 billion.12 By way of comparison, DRC received US$464 million in humanitarian assistance in 2012.
102
The NATO-led International Security Assistance Force (ISAF) in Afghanistan is the largest of the NATO peacekeeping missions, with estimated costs of US$601 million (excluding troop-contributing country costs). ISAF expenditure peaked in 2011 with a surge in troops but mission costs decreased in 2012 and 2013 as troops and assets were progressively withdrawn and donors shifted attention to support the Afghan National Security Forces, in preparation for the complete withdrawal of international troops in 2014.13
The share of peacekeeping costs from other bodies fluctuates since, when new conflicts break out, regional bodies are often among the first to respond. For example, the International Support Mission to Mali, organised by the Economic Community of West African States was re-hatted as the UN-led MINUSMA.
Each multilateral body has a different financing system for peacekeeping. For UN missions, expenses are distributed among UN member states according to a scale of assessment that apportions a specific percentage share of the costs to each state based on their relative wealth and ability to contribute (resulting in the United States (US) contributing by far the largest share, followed by Japan, France, Germany, the United Kingdom (UK) and China). States can also make voluntary contributions to particular peace operations, but these
account for a very small proportion of peacekeeping funds – 0.08% for 2013–2014.14
While the majority of funding for peacekeeping comes from developed countries, the majority of peacekeeping troops come from developing countries. The largest troop-contributing countries to UN missions are Bangladesh, India, Pakistan, Ethiopia and Rwanda. They also contribute other personnel: for example, at end of June 2014, in addition to just over 7,000 peacekeeping soldiers, Bangladesh was contributing 65 military experts and just under 1,700 police.15
CHAPTER 8: WHAT OTHER RESOURCES ARE IMPORTANT?
In 2012, global military and security expenditure was an estimated US$1.8 trillion. Spending on multilateral peacekeeping was US$9.1 billion.
103
In focus: Public and private support in risk financingFor crisis-prone communities, financial preparedness against risks is preferable to a reliance on post-crisis assistance – allowing people greater resilience and control in the face of disaster. It can reduce the impacts of a disaster as well as create incentives to further reduce risk and bring greater confidence to invest – bringing potential to stimulate economic growth and reduce poverty.
Such financial preparedness requires multiple sources and instruments because ODA and humanitarian assistance are not always sufficiently resourced, nor best placed to support these initiatives. In certain contexts, complementary approaches can come from the increasing range of market-mediated financial and insurance products, for which there is growing demand and political commitment. Extending risk financing (such as savings, reserves and credit facilities) and risk transfer products (such as insurance or catastrophe bonds) to developing countries is now feasible on a scale unthinkable 10 years ago due to developments in the products and payment distribution, as well as technical innovation in measuring and modelling risk.
Financial preparedness is a core element of a comprehensive approach to risk management. It involves identifying exposure to and the financial consequences of risk, then putting in place strategies to reduce risks and manage residual risk (that which cannot be practically or cost-effectively reduced).
Managing residual risk typically involves a layered set of options to directly manage and meet the financial cost of the most frequent and low-impact risks (such as sickness) through a combination o f savings or reserves and access to credit. For less frequent but potentially high-impact risks (such as droughts or floods), against which it might not be feasible to retain sufficient reserves, the cost of meeting post-disaster financing can be met through insurance, risk pooling and catastrophe bonds, effectively 'transferring' the cost to others – such as the private sector. Paying premiums
spreads the cost of risk over time, while combining the premiums across multiple fee-payers spreads the risk itself across space.
Risk financing and risk transfer requires the expertise, technological and financial capacity of a broad range of actors across public and private sectors and civil society. The role of donors and other international actors is typically catalytic, providing seed-funding to test and scale up initiatives. They can also support domestic governments to develop their own sovereign risk financing strategies and invest in public goods to build understanding of risk and demand for risk financing and enable markets to function better.
The ‘enabling’ conditions for risk financing and risk transfer to function effectively and sustainably may require significant and sustained investments over many years, and in specific contexts. This means that in practice they have limitations: risk financing and transfer mechanisms have largely focused on providing financial preparedness against natural disaster risks and are not likely to be feasible in protracted,
conflict-related humanitarian crises. In such instances, internationally financed humanitarian preparedness and response will remain critical to meeting the needs of people at risk of crisis.
But as outlined in Chapter 9, even where risk-financing and risk-transfer models are not possible, more ‘risk-informed’ humanitarian action, which invests in preparedness and responds to early indicators of a deteriorating situation, would confer some of the benefits of better financial preparedness for disasters. These include a more timely and cost-effective response, improved humanitarian outcomes and protection of livelihoods.
GLOBAL HUMANITARIAN ASSISTANCE REPORT 2014
Risk financing involves taking measures to ensure that adequate funds are directly available to meet financial needs should a disaster occur. Such financing can be established internally through the accumulation of funds set aside for future use or obtained externally through prearranged credit facilities. The banking sector, capital markets and international lending institutions are all sources of risk financing.
Risk transfer involves shifting of the cost of risks to others who, in exchange for a premium, provide compensation when a disaster occurs, ensuring any financing gap that might emerge is partially or fully bridged. Risk transfer may be obtained through insurance policies or capital market instruments such
as catastrophe bonds. The insurance and reinsurance sectors are the main sources of risk transfer, although capital markets provide an alternative source. The pay-outs of risk transfer instruments may be calculated on the basis of an assessment of actual losses sustained (indemnity-based), or a pre-agreed payment based on the occurrence of a particular trigger, such as reduced rainfall over a defined period of time (parametric and index-lined insurance). The advantage of the latter is that assessments are not necessary, so expediting pay-outs and reducing administrative costs.16
Risk retention: (savings, reserves, access to credit
Macro level: The enabling environmentPolicy, legislation, market regulation, consumer protection, sovereign risk financing, national social protection schemes
Micro level: Interface• Commercial, mutual and informal insurers• Agents• Brokers and intermediaries • Education • Demand
Meso level: Support infrastructureFinancial services, insurance markets, information technology providers, distribution networks (social protection schemes, mobile money networks)
Figure 8.11
Financial risk management strategies and partnerships supporting finance at individual/community level.
Source: Development Initiatives based on Forum for Agricultural Risk Management in Development and Lloyd’s 360° Risk Insight and the Microinsurance Centre17,18
CHAPTER 8: WHAT OTHER RESOURCES ARE IMPORTANT?
RISK FINANCING AND RISK TRANSFER IN ACTION: THE R4 RURAL RESILIENCE INITIATIVE, ETHIOpIA
The R4 Rural Resilience Initiative (R4) is a strategic partnership between Oxfam America and the UN World Food Programme, initiated in 2010. It provides a combination of risk management strategies including improved resource management (risk reduction), insurance (risk transfer), microcredit (prudent risk-taking) and savings (risk reserves).
The initiative complements the existing government-led productive safety net programme (PSNP) and uses the PSNP’s local infrastructure and targeting mechanisms to identify and access clients. Client farmers receive automatic pay-outs in the event of seasonal droughts, triggered when certain climate thresholds are breached. The pay-outs should enable farmers to purchase seeds
and inputs to replant the following season and avoid selling assets. Access to credit is also provided through partnership with a micro-finance institution, which uses the insurance as collateral, providing farmers with capital to make productive investments.
In 2013, over 20,000 farmers purchased insurance in Tigray and Amhara. Around 80% of Tigray’s newly enrolled farmers purchased their insurance premiums with a combination of cash (10% of the premium) and labour. Farmers who paid for insurance premiums with their labour contributed to risk reduction activities in their communities, including improved irrigation capabilities and soil management practice.
105
Climate financing and disaster risk reductionThe fifth Intergovernmental Panel on Climate Change report19 concluded in 2013 that human-induced climate change was a near certainty. Climatic unpredictability, a key driver of crisis and entrenched poverty, is projected to become exacerbated through climate change, with both more intense and more frequent events.
Extreme events alone do not cause disasters: the greatest effects of climate change are felt where people and populations are most vulnerable and least resilient to these hazards. More intense events are set to have an impact on greater numbers of people in the future, while shorter intervals between disasters will leave even less time for people to recover and build up assets, exacerbating vulnerability to the next wave.
As described in Chapter 7, long-term humanitarian crisis, chronic poverty and limited domestic capacity to respond occur in the same places, challenging humanitarian and development communities to
invest in building resilience and in addressing the chronic poverty, risks and vulnerabilities that cause crises to recur and become entrenched.
Many countries regularly receiving humanitarian assistance are also highly vulnerable to current and anticipated climate risks. For example, 9 of the top 20 recipients of humanitarian assistance between 2003 and 2012 (Afghanistan, Zimbabwe, Iraq, Chad, Sudan, DRC, Ethiopia, Myanmar and Haiti), are in the bottom 20 countries ranked in the University of Notre Dame's Global Adaptation Index (ND-GAIN), which ranks 177 countries according to both vulnerability to, and ability to cope with, climate change.20 Most of these countries have been affected by conflict in recent years, highlighting the fact that many ‘natural disasters’ are in fact complex emergencies.
Figure 8.12
Top 20 recipients of approved climate adaptation funds, 2003 –2013
Source: Climate Funds Update Note: The countries highlighted in yellow are top 20 humanitarian recipients, 2003 –2012.
US$
MIL
LIO
NS
309
183 159
120 120 105 98 98 93
69 68 66 59 50 50 48 42 38 34 33
0
50
100
150
200
250
300
350
Disbursed Approved not disbursed Total approved
Suda
n
Uga
nda
Rw
anda
Ken
ya
Bo
livi
a
Eth
iop
ia
DR
C
Yem
en
Ind
on
esi
a
Sa
mo
a
Za
mb
ia
Ta
jikis
tan
Ne
pa
l
Vie
tna
m
Mo
zam
biq
ue
Ph
ilip
pin
es
Nig
er
Ca
mb
od
ia
Pa
kis
tan
Ba
ng
lad
esh
GLOBAL HUMANITARIAN ASSISTANCE REPORT 2014
106
CHAPTER 8: WHAT OTHER RESOURCES ARE IMPORTANT?
To address the challenges faced by developing countries, the 16th Conference of Parties to the United Nations Framework Convention on Climate Change (UNFCCC) in November 2010 saw developed countries committing to jointly mobilising US$100 billion a year by 2020. Climate change finance constitutes a range of public and private flows directed at initiatives to either mitigate the exacerbation of climate change or to minimise the impacts of climate change through adaptation. The majority of climate change flows come from the private sector, which contributed 62% of the estimated US$359 billion total in 2012.21
Investments in climate mitigation account for the vast majority of climate change finance flows, with much of this going to China and other emerging economies. By contrast, funding for adaptation in developing countries accounts for just an estimated 6% of all climate change financing to date, of which the majority has been channelled towards capacity-building.
An aggregate US$537 million of adaptation finance was approved between 2003 and 2013 for the top 20 recipients of humanitarian assistance,
accounting for 19% of all such country-specific funding. However, only US$63 million has so far been disbursed in this period.
Only one of the top twenty humanitarian recipients, Pakistan, is among the top 10 recipients of approved climate adaptation funding in this period. A further six (Ethiopia, DRC, Indonesia, Kenya, Uganda and Sudan) are between 11th and 20th largest recipients of climate adaptation funding. Afghanistan, Iraq and Zimbabwe are all among the bottom five countries on the ND-GAIN and receive very small amounts of approved climate adaptation financing – US$14 million, US$ 0.1 million and US$7 million respectively.
Nine of out the top 20 recipient countries of humanitarian assistance are in the bottom 20 of the GAIN climate change vulnerability index. Most of these nine were also conflict-affected.
In the aftermath of the Typhoon the Philippines government launched the Foreign Aid Transparency Hub (FAiTH)– an online platform designed to record financial and in-kind pledges and donations from international governments and institutions – to ensure accountability and improve coordination of resources.
THE STORY
108
BETTER INFORMATION
9CHApTER
People affected by, or at risk of, crises have dynamic and interlinked needs that often go beyond even the widest interpretation of humanitarian response (see Chapters 7 and 8). To best address these, donors as well as operational agencies and domestic governments require an accurate and current picture of people’s needs as well as of the landscape of available resources. Timely, accessible, high-quality and openly available information about needs and financing flows does not guarantee better decision-making on resourcing – but is essential to informing it.
The High Level Panel on the Post–2015 Development Agenda recognised this need in the development context and called for a “data revolution for sustainable development, with a new international initiative to improve the quality of statistics and information available to citizens”. In response, governments and development organisations are looking at ways to improve the collection, transparency and use of data, particularly at national and sub-national level.
At the same time as the post-2015 data revolution takes shape, there is an ongoing need for improvements in the quality, coordination and accessibility of information on both humanitarian needs and humanitarian financing. As this chapter details, there has been innovation and progress in these areas over recent years, with many new needs assessments and aid transparency initiatives. The challenges remain to continue to adapt, implement and invest in these – as well as to see that this evidence is well-used in decision-making.1
For better response
109
DISAGGREGATED DATA
Different groups of people are affected by crises in very different ways and humanitarian actors require evidence of these different impacts so they can best reach those in most need. Gender and age are two factors that contribute to heightened vulnerability in crises, but the collection of sex- and age-disaggregated data, though improving, remains lacking.
At the same time, available evidence is not systematically used to inform response. In the Philippines, for
example, age-disaggregated data shows that the three areas worst hit by Typhoon Haiyan have higher shares of older people than the national average. Using this information in the strategic response plan (SRP) could have allowed programmers and decision-makers to take the specific needs of these populations into account.3
Humanitarian assistance is driven by the imperative to respond according to need. This imperative is at the heart of the humanitarian principles and reiterated in the principles of Good Humanitarian Donorship and the European Consensus on Humanitarian Aid, which state that funding should be allocated in proportion to needs and on the basis of strong needs assessments.
Yet it is not a simple task to assess the multi-dimensional needs of the most vulnerable people in dynamic, complex and sometimes inaccessible crisis situations. The logistical and methodological challenges can be vast. Defining and prioritising needs is further complicated by the potentially wide scope of humanitarian action – from early action and risk reduction through to recovery and reconstruction. Assessments can also risk being biased towards the needs of those who are most visible, or towards the needs that fit agencies’ repertoires of response.2
Recent needs assessment initiatives
Over the past five years, there have been renewed efforts to improve the quality, timeliness and coordination of needs assessments. These come both from established humanitarian actors and from newer ones including ‘digital humanitarians’. This area of technological innovation has seen rapid growth in recent years and includes the volunteer mobilisation of the Digital Humanitarian Network and Artificial Intelligence for Disaster Response platform from the Qatar Computing Institute.
From established actors, the change in the UN-coordinated appeals process in 2013 was in part an attempt to give more primacy and independence to setting out needs. The previous consolidated appeals process (CAP) integrated needs assessment and project requirements in a single document, thus risking skewing the picture of needs. The new process separates out humanitarian needs overviews, from subsequent strategic response plans (SRPs, see Chapter 2).
Another recent initiative, which feeds into some humanitarian needs overviews, is the multi-cluster/sector initial rapid assessment (MIRA).4 Developed in 2012 by the Inter-Agency Standing Committee, MIRA is a multi-stakeholder assessment, usually conducted in the first two weeks of a sudden onset disaster. Over 40 agencies participated in the first two phases of the MIRA in the Philippines following Typhoon Haiyan in late 2013, the results of which informed the UN-coordinated SRP.5 While this multisectoral, coordinated approach is being widely used and adapted in many sudden onset crises, it has not yet been rolled out or adapted for the protracted crises that account for most humanitarian needs.6
The Assessment Capacities project (ACApS), set up by a consortium of NGOs in 2009, works across all kinds of humanitarian crises. It seeks to improve the system-wide assessment of humanitarian needs in crises. It does so through global and country-specific needs briefings, tools, training and deployment of assessment specialists. As well as providing independent support for coordinated assessments in the event of an emergency, ACAPS works with humanitarian actors to strengthen assessment preparedness in high disaster-risk countries.
Better information about risks and needs
GLOBAL HUMANITARIAN ASSISTANCE REPORT 2014
110
NEEDS-BASED BUDGETING
In 2014, a number of UN-coordinated SRPs, including those in Afghanistan and Democratic Republic of Congo, are piloting different methodologies for needs-based budgeting. Previously the consolidated appeal process budgets simply represented the sum of individual project requirements in each cluster. While methodologies differ across countries, generally the new approach begins with each cluster budgeting its activities by assigning an approximate average unit or beneficiary cost to each planned activity, then multiplying that amount by the number of people to be reached to meet the needs of the target population. A UN Office for the Coordination of Humanitarian Affairs (OCHA) review of this pilot approach, due for publication later in 2014, will inform the wider roll-out of activity-based costing.
THE SYRIA NEEDS ANALYSIS pROJECT
The Syria Needs Analysis Project (SNAP) is a joint project between ACAPS and MapAction that has been running since January 2013. It aims to improve understanding of the impact of the conflict in Syria. It does so through identifying, mapping and analysing existing assessment data and providing technical advice to support new, coordinated assessments. Products include monthly overviews of the humanitarian situation as well as specific thematic reports, such as on the cross-border movement
of goods. SNAP operates as an independent project, with no affiliation to any one operational agency. Therefore, its assessments are not biased by a resource mobilisation agenda or fixed response repertoire. A mid-term review of SNAP in October 2013 concluded that the project has added significant value to the humanitarian community by improving the targeting of assistance and building a shared situational awareness of the needs of the Syrian population.7
Recent risk assessment initiatives
Better information is also required on risks and early warning signs, before these become manifest or acute humanitarian needs. This information should enable preparedness and trigger appropriate resourcing (development or humanitarian, national and international) to protect lives and livelihoods and build resilience. Early warning signs of violence and conflict need to be monitored as well as those of resource scarcity and natural hazards. There are a number of country-specific early warning systems that seek to do this. One example is the Drought Early Warning System in Karamoja, Uganda. This initiative allows the analysis of community vulnerability indicators and weather forecasts, and issues warnings and advice to at-risk communities.8
Focusing on global and national levels, Information for Risk Management is a new risk index to be launched in November 2014. A collaborative project of the Inter-Agency Standing Committee and the European Commission’s Joint Research Centre, it aims to identify where crises may occur based on a series of indicators measuring hazards, vulnerability and capacity across 191 countries.
Coordinating needs-based funding
While there is more data on risks and needs, and more coordinated needs assessments than ever before, there is still a need for continued improvement in information gathering, analysis and accessibility.9 At the same time, the challenge remains to systematically ensure that the allocation of funding is based on this improved understanding of needs, both at a country level and a global level.
A number of recommendations have been proposed in this regard. At global and country levels, donors should work together better to share their analysis of funding needs and gaps and decide collectively on an explicitly agreed division of labour (see Chapter 4). At the global level, this could be managed and coordinated through an operational wing of the Good Humanitarian Donorship Initiative; and at country level through various country-specific donor coordination groups.10 Not only would this encourage donors to agree and act on a collective analysis of priority needs but it would also support a more transparent and accountable approach to global resource allocation.
CHAPTER 9: BETTER INFORMATION FOR BETTER RESPONSE
111
Without sufficient funds to meet all needs, there are real opportunity costs for the choices that donors make. Donors must target their finite humanitarian funds according to information about needs; but they also need to know what other humanitarian funds are being channelled, and where, in order to best direct their own.
Improving access to this real-time data is critical to improving the effectiveness, coordination and efficiency of the collective humanitarian response – and so to avoid neglect or duplication. It is also critical for full accountability to people on the receiving end of humanitarian assistance. Yet as highlighted throughout this report, there are many areas of data poverty – timely, standardised and accessible data on financial flows is still largely lacking.
Calls for greater transparency in humanitarian assistance are increasing, including through the Open Humanitarian Initiative, which promotes the sharing of information in the humanitarian space through the principles of open data.
International Aid Transparency Initiative
The multi-stakeholder International Aid Transparency Initiative (IATI) is one way in which better data and information on humanitarian assistance could be made publicly available. Launched at the High Level Forum on Aid Effectiveness in Accra in 2008, there are currently over 260 organisations publishing information to the IATI standard. Originally designed for development aid, initiatives are now underway to modify IATI for the particular time-bound demands and definitions of humanitarian assistance.
The ultimate vision is that IATI will provide a single standardised format to which all actors (governments, private donors and aid agencies) can publish their data. Once published to IATI standard the data can be reused and redirected to any number of reporting platforms, including the UN OCHA Financial Tracking Service (FTS), and to fulfil donor reporting requirements. This would reduce the multiple
reporting burden currently placed on donors and delivery agencies. It would also allow project-level data to be geo coded so that resources can be traced all the way from donor to final recipient (see Figure 9.1).
Following the first IATI humanitarian stakeholders’ workshop in 2013, proposed modifications range from adding a specific humanitarian marker so that humanitarian data can be easily identified, to creating a completely new element specifically for additional humanitarian-related information. Some governments are already using IATI data in their own tracking and transparency initiatives.
DFID's Development Tracker
The UK government’s Department for International Development (DFID) uses IATI data to drive its portal, Development Tracker. By using this we can see, for example, that £98m of DFID’s £355 million Girls’ Education Challenge fund has so far been spent, £19.1 million of which is currently showing as having been allocated by fund manager Price Waterhouse Cooper to projects for implementation. Funds can then be traced to the organisations tasked with delivering the work. Once work is being delivered using Girls' Education Challenge funds, projects should be fully geocoded, enabling access to a detailed mapping of project delivery. While this example relates to development financing, it demonstrates the potential for geocoded data on humanitarian funding to improve traceability and thus effectiveness and accountability.
Netherlands' budget tracker
The Netherlands Ministry of Foreign Affairs has launched an interactive budget webpage that uses IATI data to track national budget items, with the potential to allow users to trace funds all the way through to local project delivery on the ground. Data is presented in four blocks:
1) an overview of the overall budget for international trade and development cooperation
2) an overview of the budget by priority areas
3) a map showing countries receiving expenditure of over 1 million euros
4) a listing of individual activities. Users can filter the data presented by budget area (including humanitarian assistance), or by country.
Philippines' FAiTH
Following Typhoon Haiyan, in order to ensure accountability and improve coordination of resources, the government of the Philippines turned to IATI to track resources coming into the country. However, the data was not readily available because not enough donors are yet publishing their contributions to the IATI standard.
The government responded by creating the online Foreign Aid Transparency Hub (FAiTH) an online platform designed to record financial and in-kind pledges and donations from international governments and institutions channelled through the government, as well as donations provided through the Commission on Filipinos 'Overseas' Lingkod sa Kapwa Pilipino Program. It does not record donations made directly to private groups and organisations such as NGOs, UN agencies or private organisations and foundations.11
While FAiTH’s goals are commendable, functionality is poor. While it was originally intended to enable users to track the status of donations to the point of delivery, this is not possible with the data that is currently available. If funding information was already published to the IATI standard by all donors and all actors, the government would have been able to pull the relevant data directly from the IATI registry, rather than setting up its own system.12 Full IATI data would allow all funds to be traced, not just resources channelled through line ministries of the national government. It would also allow funds to be tracked all the way through the system – from the original source, through the various channels of delivery and, ultimately, to see where, how and by whom the aid was eventually delivered on the ground.
• Sector: Civilian peace-building, conflict prevention and resolution (100%)
• Implementing organisation: United Nations Office for Project Services
• Funder: Other UNDP JP
• Title: Prison Project in Central African Republic on behalf of the Peacebuilding Fund
• Implementing organisation: United Nations Development Programme
• Funder: The Netherlands
• Title: DSH/HO Common Humanitarian Fund Central African Republic 2013
• Sector: Material relief and assistance services (100%)
Figure 9.1
Tracing financing flows using d-portal and IATI data: CAR project examples
CHAPTER 9: BETTER INFORMATION FOR BETTER RESPONSE
d-portal.org is a country-based information platform that tracks development resource flows using data published through IATI and by the Organisation for Economic Development (OECD) Development Assistance Committee (DAC)’s Creditor Reporting System (CRS). It was set up to enable users to view all resource flows from a recipient country perspective, helping to expose gaps in development provision and highlighting unequal distribution at a national level. d-portal also assists with the planning and monitoring of development activities by enabling
ministries, parliamentarians and civil society to track where resources come from and who they go to on a project-by-project basis. As the scope and quality of IATI data increases, platforms such as d-portal will provide a means of tracing the funds all the way through from donors to end recipients.
This example shows the data available for two projects in CAR, demonstrating how d-portal and similar aid-tracking devices can allow funding to be traced through the system using IATI data.
THE STORYRemittances are an essential source of income for many households. The total global value of remittances – sent both through formal and informal channels – is unknown, but estimates suggest that formal flows alone account for nearly one fifth of total international resources (US$43.9 billion) to the top recipient countries of humanitarian assistance. For some of these countries they represent the largest single international inflow – in Pakistan they account for 66% and in Haiti, 39%. This woman survived the 2010 Haitian earthquake which destroyed her family home. She is the primary carer for her eight grandchildren and relies on money sent from her son, who lives abroad, to pay their school fees.
114
DATA & GUIDES
10CHApTER
115
GLOBAL HUMANITARIAN ASSISTANCE REPORT 2014
116
Humanitarian action is designed to save lives, alleviate suffering and maintain and protect human dignity during and in the aftermath of emergencies. This definition is set out in the Good Humanitarian Donorship (GHD) Principles and Good Practice Guidelines. In this report, when used in the context of data, humanitarian assistance refers to the financial resources for this action.
As well as being focused on emergencies, humanitarian assistance differs from other forms of foreign and development assistance because it is intended to be governed by the key humanitarian principles of:
• humanity – saving human lives and alleviating suffering wherever it is found
• impartiality – acting solely on the basis of need, without discrimination between or within affected populations
• neutrality – acting without favouring any side in an armed conflict or other dispute
• independence – ensuring autonomy of humanitarian objectives from political, economic, military or other objectives.
These principles are set out in the fundamental principles of the Red Cross and Red Crescent Movement, reaffirmed in UN General Assembly resolutions and enshrined in numerous humanitarian standards and guidelines such as the Sphere Humanitarian Charter.
There is no universal obligation or system for reporting expenditure on humanitarian assistance (see Chapter 9), so what is counted in humanitarian assistance reporting can vary by donor. However, the Organisation for Economic Co-operation and Development (OECD)’s Development Assistance Committee (DAC) does set out clear definitions of humanitarian assistance for those donors (both member and non-member) that report to its databases.
We include what donors themselves report as ‘humanitarian’ in our analysis, but aim to consistently label and source the data we have used. OECD DAC donors report their humanitarian assistance as a sub-sector of official development assistance (ODA) against strict criteria. Yet other providers of development cooperation outside the OECD DAC who voluntarily report their humanitarian assistance to the UN Office for the Coordination of Humanitarian Affairs (OCHA) Financial Tracking Service (FTS) are not bound by the same criteria as donors reporting to the OECD DAC.
What is humanitarian assistance?
Methodology and definitionsCash
Our analysis of cash transfers is based on UN OCHA FTS data. There is currently no specific identifier or flag within the source data, so we carry out a keyword search on the project title, description and cluster. Our keywords include: cash, cash transfer, unconditional cash, conditional cash transfer, cash grant, voucher, cash for work, CfW, cash for assets, CfA, tokens, coupons, e-money, e-cash, food for work, voucher for work, public works programme, and cash transfer programme. Our coding also distinguishes between full and partial cash programmes. Projects that are labelled ‘full’ are designed primarily for cash transfer interventions; those labelled ‘partial’ combine cash transfer interventions with other activities.
Channels of delivery
We use this term to describe the agencies and organisations receiving funding for the delivery of humanitarian assistance – UN agencies, non-governmental organisations (NGOs), the public sector, pooled funds and the International Red Cross and Red Crescent Movement – whether they deliver the assistance themselves or pass it on to partner organisations. For example, a donor may fund a UN agency, which may in turn fund an international NGO, which may in turn partner with a local NGO to deliver the assistance. Currently, we are only able to track humanitarian assistance expenditure to the first transaction level. However, in this year’s report we have carried out further analysis of funding to NGOs as the channel of delivery, based on our own categorisation of NGOs (see ‘NGO classifications’ and Chapter 5).
Our channels of delivery data comes from both the OECD DAC Creditor Reporting System (CRS) and the UN OCHA FTS.
Conflict, peace and security ODA
Funding to conflict prevention and resolution, peace and security appears as its own category within sector-specific ODA. In this category, activities include support of security system management and reform, removal of land mines and other explosives, demobilisation of child soldiers, reintegration of demobilised military personnel, small arms and light weapons control, peace-building, conflict prevention and resolution and participation in international peacekeeping operations.
Domestic governments
Data on what domestic governments spend in response to disasters and crises within their own borders is not systematically collated and reported to a single body. In this year’s report we include the results of our own research into the domestic disaster relief and disaster risk reduction contributions of three governments – Kenya, India and the Philippines – using publicly available national budget documents (see pages 41–44). We use the following sources of data for our analysis:
• India – Chakrabarti D, Prabodh G, ‘Understanding Existing Methodologies for Allocating and Tracking DRR Resources in India’, UNISDR, Geneva, 2012 and Ministry of Finance, ‘Union Budget’, Government of India, New Delhi. Analysis includes data for the Central Response Fund/State Disaster Response Fund and the National Calamity Contingency Fund/National Disaster Response Fund.
• Philippines – Jose, Susan Rachel G, ‘Preliminary Examination of Existing Methodologies for Allocating and Tracking National Government Budget for Disaster Risk Reduction (DRR) in the Philippines’, UNISDR, Geneva, December 2012 and Department of Budget and Management, ‘National Expenditure Program 2014’, Government of the Philippines, Manila.
• Kenya – the World Bank’s BOOST Initiative data for the fiscal years 2006/07 to 2012/13.
CHAPTER 10: DATA & GUIDES
117
GLOBAL HUMANITARIAN ASSISTANCE REPORT 2014
Exchange rates
We predominately use OECD DAC exchange rates for OECD DAC members and exchange rates from the International Monetary Fund’s World Economic Outlook database (April 2014 edition) for countries outside of the OECD DAC group.
Financing mechanisms
All of our humanitarian assistance categories include money spent through pooled funds and financing mechanisms such as the Central Emergency Response Fund (CERF) and country-level humanitarian pooled funds.
Forgotten crises
Our analysis of forgotten crises is based on the European Commission Department of Humanitarian Aid and Civil Protection (ECHO)’s forgotten crisis assessment (FCA) index, which is compiled annually using a series of weighted indicators to come up with an overall ranking of emergency situations.
Governments (and European Union) institutions
Our data and definition of international government funding for humanitarian crises comprises:
• the total ‘official’ humanitarian assistance expenditure of the 29 members of the OECD DAC – Australia, Austria, Belgium, Canada, Czech Republic, Denmark, Finland, France, Germany, Greece, Iceland, Ireland, Italy, Japan, Korea, Luxembourg, the Netherlands, New Zealand, Norway, Poland, Portugal, Slovak Republic, Slovenia, Spain, Sweden, Switzerland, the United Kingdom, the United States and the European institutions – a subset of ODA, which is reported to the OECD DAC each year
• expenditure by ‘other governments’, sometimes referred to as ‘non-DAC donors’ or ‘South-South development partners’, as captured by UN OCHA FTS.
Note that:
• domestic government expenditure is treated separately (see Domestic governments methodology, page 117)
• although it is not an OECD DAC donor, Turkey’s reporting to the OECD DAC is more comprehensive than its reporting through UN OCHA FTS. We therefore use OECD DAC data when reporting on Turkey’s humanitarian assistance contributions.
• when we report on the individual contributions of OECD DAC donors who are members of the European Union (EU), we also include an imputed calculation of their humanitarian assistance channelled through the EU institutions.
118
CHAPTER 10: DATA & GUIDES
Humanitarian needs
Our analysis in Chapter 1 of who was affected by crises is based on:
• the number of people affected by crises – data is sourced from UN-coordinated appeals, the CRED EM-DAT disaster database (data downloaded 8 May 2014) and United Nations High Commissioner for Refugees (UNHCR) and reflects the highest number of people affected within each country at any given point during the year
• the proportion of the total population affected in crisis countries (based on World Bank 2012 population data).
International humanitarian response
This comprises the combined contributions of:
• international governments (data taken from both OECD DAC and UN OCHA FTS)
• individuals, trusts and foundations, and private companies and corporations (either using our own research or as reported in UN OCHA FTS).
Long-term humanitarian assistance countries
In this report, long-term humanitarian assistance countries are defined as those receiving a greater than average proportion of ODA (excluding debt relief) in the form of humanitarian assistance for more than eight years between 1998 and 2012. ‘Medium term’ refers to those receiving a lower than average proportion for between three and seven years inclusive, and ‘short term’ means under three years.
NGO classifications
Analysis of funding to NGOs is based on our own categorisation of five types of NGO, which was established following consultation with a range of recognised sources and stakeholders. Categories include:
• international NGOs – defined as those based in an OECD DAC member country and carrying out operations in one or more developing countries (e.g. Save the Children UK, Catholic Relief Services, Oxfam GB, Norwegian Refugee Council)
• southern international NGOs (SINGOs) – those not based in an OECD DAC member country and carrying out operations in one or more developing countries (e.g. BRAC, Mercy Malaysia)
• affiliated national NGOs – nationally-operating NGOs that are affiliated to an international NGO (e.g. World vision South Sudan and Food for the Hungry)
• national NGOs – those operating in the developing country where they are headquartered, working in multiple sub-national regions, and not affiliated to an international NGO (e.g. Almanar voluntary Organization, Somali Humanitarian Aid and Development Organization (SHADO))
• local NGOs – those operating in a specific, geographically defined, sub-national area, without affiliation to either a national or international NGO; this grouping can also include community-based organisations (CBOs, e.g. Abyei Community Action for Development, Nuba Mountain Relief, Rehabilitation and Development Organization).
119
GLOBAL HUMANITARIAN ASSISTANCE REPORT 2014
Official development assistance (ODA)
ODA is a grant or loan from an OECD member country to a developing country (as defined by the OECD) or multilateral agency for the promotion of economic development and welfare. It is reported by members of the OECD DAC, along with several other government donors and institutions, according to strict criteria each year. It includes sustainable and poverty-reducing development assistance (for sectors such as governance and security, social services, education, health, and water and sanitation) as well as humanitarian assistance from OECD DAC members and other donors reporting to the OECD DAC.
In this report we express our total ODA figures as net of debt relief, apart from in Chapter 8, where development assistance is based on gross ODA.
Other official flows (OOFs)
Other official flows are official sector transactions reported by governments to the OECD DAC that do not meet the ODA criteria, because their primary purpose is not development-motivated, or because their grant element is below the 25% threshold that would make them eligible to be recorded as ODA. Transactions classified as OOFs include export- and investment-related transactions, rescheduling of OOF loans, and other bilateral securities and claims.
poverty
We refer to three international poverty lines in this report and use World Bank data in our analyses:
• $1.25 a day (‘extreme’ or ‘absolute’ poverty)
• $2 a day
• $4 a day
These measures are expressed in ‘international dollars’, based on purchasing power parity (PPP) exchange rates from 2005.
private funding
This comprises contributions from individuals, private foundations, trusts, private companies and corporations. We have developed a unique methodology to attempt to quantify and analyse this under-reported resource flow (see opposite).
Rounding
There may be minor discrepancies in some of the totals in our graphs and charts, and between those and the text; this is because of rounding.
Total ‘official’ humanitarian assistance
Total ‘official’ humanitarian assistance forms a core part of our international government and humanitarian response calculations and is used when making comparisons with other development assistance and other resource flows to developing countries.
Total ‘official’ humanitarian assistance includes:
• bilateral humanitarian expenditure of OECD DAC members, as reported through the OECD DAC
• multilateral (core and totally unearmarked) ODA contributions to UNHCR, United Nations Relief and Works Agency for Palestine Refugees in the Near East (UNRWA), United Nations Children’s Fund (UNICEF) and World Food Programme (WFP).
120
CHAPTER 10: DATA & GUIDES
GHA’s unique calculations
121
INTERNATIONAL HUMANITARIAN ASSISTANCE FROM GOVERNMENTS
Our calculation of international humanitarian assistance from government donors is the sum of:
• total ‘official’ humanitarian assistance (OECD DAC)
• humanitarian assistance from providers of development cooperation outside the OECD DAC (see Government donors page 26)
Our total ‘official’ humanitarian assistance calculation comprises:
• bilateral humanitarian assistance of the 29 OECD DAC donors, as reported in the OECD DAC database under table ‘DAC1 Official and Private Flows’, item ‘Hist: Humanitarian aid grants’ (net disbursements)
• total multilateral ODA disbursements to UNHCR, UNRWA, UNICEF and WFP, as recipients, reported in the OECD DAC database under table ‘DAC2a ODA Disbursements’. We do not include all ODA to WFP and UNICEF but apply a percentage in order to take into account the fact that these two agencies also have a ‘development’ mandate. These shares (applied to all years retrospectively) have been calculated using 2010–2012 data from www.unsceb.org.
• When reporting on the total official humanitarian assistance of individual donors, we include imputed calculations of humanitarian assistance contributed through the EU institutions. When reporting on the total official humanitarian assistance of individual donors to specific countries (e.g. the United Kingdom to Afghanistan), we impute contributions made via the Central Emergency Response Fund (CERF). Until 2009 CERF contributions were reported in table DAC2a as ‘bilateral unspecified‘, from 2010 data is not reported in sufficient detail in the DAC tables, so we take this data directly from the CERF.
To calculate the funding from government donors outside the OECD DAC we use UN OCHA FTS data. However, while Turkey is not an OECD DAC donor, its reporting to this database is more comprehensive than through UN OCHA FTS. We therefore use OECD DAC data to report Turkey’s humanitarian contributions.
pRIVATE FUNDING
Our definition of private funding includes contributions from individuals, trusts and foundations, and private companies and corporations. We approach humanitarian delivery agencies (including NGOs, UN agencies with a humanitarian mandate and the International Red Cross and Red Crescent Movement) directly and request financial information on their income and expenditure by means of a standardised dataset. Where direct data collection is not possible, we use publicly available annual reports and audited accounts to extract key data and complete the dataset ourselves.
Our dataset includes the following:
• 75 NGOs that form part of nine representative and well-known NGO alliances and umbrella organisations, such as Oxfam International (see table)
• six key UN agencies engaged in humanitarian response: UNICEF, UNHCR, UNRWA, WFP, United Nations Development Programme (UNDP) and the World Health Organization (WHO)
• the International Federation of Red Cross and Red Crescent Societies (IFRC) and the International Committee of the Red Cross (ICRC).
Our private funding calculation comprises an estimate of total private humanitarian income for all NGOs, plus the private humanitarian income reported by the six UN agencies, the IFRC and ICRC. To estimate the total private humanitarian income of NGOs globally, we calculate the annual proportion that the 75 NGOs in our dataset represent of all NGOs reporting to the UN OCHA FTS. The total private humanitarian income reported to us by the NGOs in our dataset is then scaled up according to this proportion.
Due to limited data, we provide an estimate for 2013 private funding by calculating the share of overall private humanitarian assistance represented by Médecins Sans Frontières (MSF) for the previous five years. Using data for 2013 provided to us by MSF, we then scale their private humanitarian income figure up according to the average share, to reach a global estimate.
ORGANISATION NUMBER OF MEMBER ORGANISATIONS IN THE DATASET
Action Contre la Faim 1
Caritas 1
Concern Worldwide 3
Danish Refugee Council 1
EMERGENCY 1
GOAL 1
HelpAge 1
International Medical Corps 2
International Rescue Committee 4
Islamic Relief 15
Medair 1
Médecins Sans Frontières 23
Mercy Corps 2
Norwegian Refugee Council 1
Oxfam 16
World Relief 1
ZOA 1
Total 75
GLOBAL HUMANITARIAN ASSISTANCE REPORT 2014
For further details, please visit our website: www.globalhumanitarianassistance.org/tools .
122
CHAPTER 10: DATA & GUIDES
Data sources
Bangko Sentral Ng pilipinas, ‘Economic and Financial Statistics’, Manila
www.bsp.gov.ph/statistics/efs_ext3.asp accessed 3 July 2014.
Centre for Research on the Epidemiology of Disasters, ‘EM-DAT International Disaster Database’, CRED, Université Catholique de Louvain, Brussels
www.emdat.be/database accessed 8 May 2014.
Climate Funds Update, ‘The data’, Climate Funds Update, Overseas Development Institute (ODI) and Heinrich Böll Stiftung North America, Berlin and Washington DC
www.climatefundsupdate.org accessed 10 July 2014.
Management, ‘National Expenditure Program 2014’, Government of the Philippines, Manila
www.dbm.gov.ph accessed 30 July 2014.
Department for International Development, ‘Development Tracker’, UK Government, London
http://devtracker.dfid.gov.uk accessed 6 July 2014.
European Union Humanitarian Aid and Civil protection, ‘Global vulnerability and Crisis Assessment / Forgotten Crisis Assessment’, ECHO, Brussels
http://echo-global-vulnerability-and-crisis.jrc.ec.europa.eu accessed 12 May 2014.
Ministry of Finance, ‘Union Budget’, Government of India, New Delhi
http://indiabudget.nic.in accessed 30 April 2014.
International Committee of the Red Cross, ‘Annual Report’, ICRC, Geneva
www.icrc.org/eng/resources/annual-report accessed 21 April 2014.
International Federation of Red Cross and Red Crescent Societies, ‘Donor response to programmes and appeals’, IFRC, Geneva
www.ifrc.org/en/publications-and-reports/donor-response accessed 21 April 2014 (unless otherwise stated).
International Monetary Fund, ‘World Economic Outlook Database’, IMF, Washington DC
http://www.imf.org/external/pubs/ft/weo/2014/01/weodata/index.aspx accessed April 2014.
Office of the UN High Commissioner for Refugees, ‘Syria Regional Refugee Response’, Inter-Agency Information Sharing Portal, UNHCR
http://data.unhcr.org/syrianrefugees/ regional.php accessed 28 July 2014.
Office of the UN High Commissioner for Refugees, ‘Statistical Online Database’, UNHCR, Geneva
http://popstats.unhcr.org/Default.aspx accessed 22 July 2014.
Organisation for Economic Co-operation and Development, ‘OECD.Stat’, OECD, Paris
http://stats.oecd.org accessed 16 April 2014.
Stockholm International peace Research Institute, ‘SIPRI Multilateral Peace Operations Database’, Solna
www.sipri.org/databases/pko accessed 12 May 2014.
UN Conference on Trade and Development, ‘UNCTADstat’, UNCTAD, Geneva
http://unctadstat.unctad.org accessed June 2014.
UN Office for the Coordination of Humanitarian Affairs, ‘Central Emergency Response Fund’, UN OCHA, New York
www.unocha.org/cerf accessed 8 May 2014.
UN Office for the Coordination of Humanitarian Affairs, ‘Financial Tracking Service’, UN OCHA, Geneva
http://fts.unocha.org accessed 14 April 2014 (unless stated otherwise).
UN System Chief Executives Board for Coordination, ‘UN System Statistics’, UN CEB, Geneva and New York
www.unsceb.org/content/stats-fb accessed 24 April 2014.
Uppsala Conflict Data program, ‘UCDP Conflict Encyclopedia’, UCDP, Department of Peace and Conflict Research, Uppsala Universitet, Uppsala
www.ucdp.uu.se/gpdatabase/search.php accessed 22 April 2014.
World Bank, ‘BOOST Initiative’, World Bank, Washington DC
http://wbi.worldbank.org/boost /boost-initiative accessed 24 March 2014.
CpA Comprehensive Peace Agreement (between Sudan and southern Sudan)
CRED Centre for Research on the Epidemiology of Disasters
CRS Creditor Reporting System (OECD DAC)
DAC Development Assistance Committee (OECD)
DEC Disasters Emergency Committee
DFID Department for International Development (UK)
Dpp Disaster prevention and preparedness
DpRK Democratic People’s Republic of Korea
DRC Democratic Republic of Congo
DRM Disaster risk management
DRR Disaster risk reduction
EC European Commission
ECHO Department of Humanitarian Aid and Civil Protection (EC)
ECOWAS Economic Community of West African States
ERC Emergency Relief Coordinator
ERF Emergency Response Fund
EU European Union
FAiTH Foreign Aid Transparency Hub (Philippines)
FAO Food and Agriculture Organization
FCA Forgotten crisis assessment (ECHO)
FDI Foreign direct investment
FTS Financial Tracking Service (UN OCHA)
GDp Gross domestic product
GHA Global Humanitarian Assistance (the programme)
GHD Good Humanitarian Donorship
GNI Gross national income
HNO Humanitarian needs overview
IASC Inter-Agency Standing Committee
IATI International Aid Transparency Initiative
ICRC International Committee of the Red Cross
IDp Internally displaced person(s)/people
IDMC Internal Displacement Monitoring Centre
IFRC International Federation of Red Cross and Red Crescent Societies
IMF International Monetary Fund
INGO International non-governmental organisation
IOM International Organization for Migration
L3 ‘Level 3’ emergency (UN)
MDG Millennium Development Goals
Acronyms and abbreviations
125
GLOBAL HUMANITARIAN ASSISTANCE REPORT 2014
MINUSMA Multidimensional Integrated Stabilization Mission in Mali (UN)
MIRA Multi-cluster initial rapid assessment
MSF Médecins Sans Frontières
NATO North Atlantic Treaty Organisation
ND-GAIN Notre Dame Global Adaptation Index
NGO Non-governmental organisation
NNSC Neutral Nations Supervisory Commission
OCHA Office for the Coordination of Humanitarian Affairs (UN)
ODA Official development assistance
OECD Organisation for Economic Co-operation and Development
OOFs Other official flows
opt Occupied Palestinian territory (UN)
OSCE Organization for Security and Co-operation in Europe
ppp Purchasing power parity
R4 The R4 Rural Resilience Initiative
RCRC Red Cross Red Crescent
RRF Rapid response facility (RRF)
RRp Regional refugee response plan (South Sudan and Syria)
SGBV Sexual and gender-based violence
SHARp Syria Humanitarian Assistance Response Plan
Sida Swedish International Development Cooperation Agency
SINGO Southern international non-governmental organisation
SIpRI Stockholm International Peace Research Institute
SNAp Syria Needs Analysis Project
SomRep Somalia Resilience Program
SRp Strategic response plan
UAE United Arab Emirates
UN United Nations
UNCTAD United Nations Conference on Trade and Development
UNDG United Nations Development Group
UNDp United Nations Development Programme
UNFpA United Nations Population Fund
UNHCR Office of the United Nations High Commissioner for Refugees
UNICEF United Nations Children’s Fund
UNISDR United Nations International Strategy for Disaster Reduction
UNRWA United Nations Relief and Works Agency for Palestine Refugees in the Near East
UK United Kingdom
US United States
USAID US Agency for International Development
WEO World Economic Outlook (IMF)
WFp World Food Programme
WHO World Health Organization
126
GLOBAL HUMANITARIAN ASSISTANCE REPORT HIGHLIGHTS 2014
ALL
UN
-CO
OR
DIN
ATED
Ap
pEA
LS20
0420
0520
0620
0720
0820
0920
1020
1120
1220
13R
evis
ed r
equi
rem
ents
(US$
bill
ions
)3.
56.
05.
95.
58.
110
.012
.99.
510
.513
.2Fu
ndin
g (U
S$ b
illio
ns)
2.2
4.0
3.9
4.0
5.7
7.1
8.0
5.8
6.3
8.5
Unm
et n
eed
(US$
bill
ions
)1.
32.
02.
01.
62.
32.
84.
93.
64.
24.
6%
nee
ds m
et64
%67
%66
%71
%71
%72
%62
%62
%60
%65
%N
umbe
r of
app
eals
in y
ear
3226
3337
3327
2524
2623
Aver
age
requ
irem
ents
per
app
eal (
US$
mill
ions
)10
923
017
915
024
436
951
639
440
457
3Av
erag
e fu
ndin
g pe
r ap
peal
(US$
mill
ions
)69
155
118
107
174
265
321
243
240
371
CO
NSO
LID
ATED
Ap
pEA
LS20
0420
0520
0620
0720
0820
0920
1020
1120
1220
13R
evis
ed r
equi
rem
ents
(US$
bill
ions
)3.
03.
84.
94.
86.
39.
57.
78.
19.
212
.9Fu
ndin
g (U
S$ b
illio
ns)
2.0
2.3
3.2
3.5
4.6
6.8
4.7
5.2
5.7
8.3
Unm
et n
eed
(US$
bill
ions
)0.
91.
51.
71.
31.
72.
63.
03.
03.
54.
5%
nee
ds m
et68
%59
%65
%74
%73
%72
%61
%63
%62
%65
%N
umbe
r of
app
eals
in y
ear
2215
1715
1315
1515
2119
Aver
age
requ
irem
ents
per
app
eal (
US$
mill
ions
)13
525
328
731
848
463
151
254
343
767
6Av
erag
e fu
ndin
g pe
r ap
peal
(US$
mill
ions
)92
150
187
234
351
456
312
344
273
439
FLA
SH A
pp
EALS
2004
2005
2006
2007
2008
2009
2010
2011
2012
2013
Rev
ised
req
uire
men
ts (U
S$ m
illio
ns)
451
2,18
132
237
383
628
03,
577
773
38no
neFu
ndin
g (U
S$ m
illio
ns)
179
1,76
627
521
359
214
42,
549
476
24no
neU
nmet
nee
d (U
S$ m
illio
ns)
271
415
4715
924
413
51,
027
297
15no
ne%
nee
ds m
et40
%81
%85
%57
%71
%52
%71
%62
%62
%no
neN
umbe
r of
app
eals
in y
ear
910
715
108
46
1no
neAv
erag
e re
quir
emen
ts p
er a
ppea
l (U
S$ m
illio
ns)
5021
846
2584
3589
412
938
none
Aver
age
fund
ing
per
appe
al (U
S$ m
illio
ns)
2017
739
1459
1863
779
24no
ne
NO
N-C
Ap
Ap
pEA
LS20
0420
0520
0620
0720
0820
0920
1020
1120
1220
13
Rev
ised
req
uire
men
ts (U
S$ m
illio
ns)
7314
707
391
929
214
1,64
554
21,
274
338
Fund
ing
(US$
mill
ions
)27
443
323
457
515
979
119
050
120
5U
nmet
nee
d (U
S$ m
illio
ns)
4610
274
157
354
5585
435
177
313
3%
nee
ds m
et36
%28
%61
%60
%62
%74
%48
%35
%39
%61
%N
umbe
r of
app
eals
in y
ear
11
97
104
63
44
Aver
age
requ
irem
ents
per
app
eal (
US$
mill
ions
)73
1479
5693
5427
418
131
884
Aver
age
fund
ing
per
appe
al (U
S$ m
illio
ns)
274
4833
5740
132
6312
551
Sour
ce: D
evel
opm
ent I
nitia
tives
bas
ed o
n U
N O
CH
A FT
S an
d U
NH
CR
dat
a
Tabl
e 10
.1
UN
-coo
rdin
ated
app
eals
, 200
4–20
13
Reference tables
127
GLOBAL HUMANITARIAN ASSISTANCE REPORT 2014
Tabl
e 10
.2
Top
20 g
over
nmen
t don
ors,
plu
s EU
inst
itutio
ns, i
nter
natio
nal h
uman
itari
an a
ssis
tanc
e, 2
004–
2013
US$
mill
ions
Sour
ce: D
evel
opm
ent I
nitia
tives
bas
ed o
n O
ECD
DAC
, UN
OC
HA
FTS
and
CER
F da
ta.
Not
es: D
ata
for
mem
bers
for
the
OEC
D D
AC 2
000–
2012
, inc
lude
s th
eir
core
OD
A to
UN
HC
R, U
NR
WA,
as
wel
l as
calc
ulat
ed p
ropo
rtio
ns o
f WFP
and
UN
ICEF
OD
A co
ntri
butio
ns. E
U c
ontr
ibut
ions
are
als
o im
pute
d fo
r O
ECD
DAC
EU
m
embe
rs a
nd T
urke
y. A
ll fig
ures
incl
ude
cont
ribu
tions
thro
ugh
the
UN
’s C
entr
al E
mer
genc
y R
espo
nse
Fund
(CER
F). A
ll fu
ndin
g is
in c
onst
ant 2
012
pric
es. D
ata
for
2013
is p
artia
l and
pre
limin
ary
for
OEC
D D
AC d
ata.
EU
inst
itutio
ns
are
high
light
ed w
ith w
hite
as
part
of t
his
fund
ing
has
alre
ady
been
impu
ted
into
EU
mem
bers
’ tot
al fi
gure
s. T
he E
U is
in th
is ta
ble
to s
how
whe
re it
ran
ks a
long
side
gov
ernm
ent d
onor
s.
2004
2005
2006
2007
2008
2009
2010
2011
2012
2013
1 U
S 2
,959
U
S 3
,907
U
S 3
,381
U
S 3
,263
U
S 4
,669
U
S 4
,629
U
S 5
,087
U
S 4
,396
U
S 3
,963
U
S 4
,686
2
EU
inst
itutio
ns
1,4
22
EU
inst
itutio
ns
1,6
31
EU
inst
itutio
ns
1,7
72
EU
inst
itutio
ns
1,5
82
EU
inst
itutio
ns
1,8
69
EU
inst
itutio
ns
1,5
38
EU
inst
itutio
ns
1,6
50
EU
inst
itutio
ns
1,7
44
EU
inst
itutio
ns
1,7
51
EU
inst
itutio
ns
1,8
81
3 J
apan
1
,088
J
apan
1
,048
U
K
1,1
51
UK
8
22
UK
9
71
UK
1
,106
U
K
1,0
10
UK
1
,227
U
K
1,1
66
UK
1
,825
4
UK
8
51
UK
9
21
Ger
man
y 7
75
Ger
man
y 6
10
Ger
man
y 6
84
Sw
eden
6
88
Sw
eden
7
70
Jap
an
972
T
urke
y 1
,046
T
urke
y 1
,638
5
Ger
man
y 5
47
Ger
man
y 7
36
Net
herl
ands
6
28
Sw
eden
5
78
Sw
eden
6
47
Ger
man
y 6
77
Ger
man
y 7
40
Sw
eden
8
18
Ger
man
y 8
11
Jap
an
1,1
12
6 N
ethe
rlan
ds
445
N
orw
ay
672
S
wed
en
606
N
orw
ay
552
S
audi
Ara
bia
624
S
pain
5
83
Jap
an
692
G
erm
any
794
S
wed
en
777
G
erm
any
949
7
Nor
way
4
33
Net
herl
ands
6
20
Nor
way
5
36
Net
herl
ands
5
25
Net
herl
ands
5
91
Nor
way
4
94
Can
ada
601
N
orw
ay
559
J
apan
6
98
Sw
eden
7
85
8 S
wed
en
386
S
wed
en
558
F
ranc
e 4
34
Can
ada
383
S
pain
5
61
Net
herl
ands
4
94
Nor
way
5
57
Can
ada
510
C
anad
a 5
38
Can
ada
691
9
Fra
nce
356
A
ustr
alia
3
70
Can
ada
365
F
ranc
e 3
62
Nor
way
5
08
Aus
tral
ia
474
S
pain
4
88
Aus
tral
ia
499
N
orw
ay
527
N
orw
ay
613
10
Ital
y 3
29
Fra
nce
368
S
pain
3
43
Spa
in
359
C
anad
a 4
61
Can
ada
435
N
ethe
rlan
ds
469
S
pain
4
34
Aus
tral
ia
455
F
ranc
e 4
27
11 C
anad
a 2
57
Ital
y 3
45
Ital
y 3
35
Ital
y 3
52
Aus
tral
ia
420
F
ranc
e 3
70
Aus
tral
ia
462
N
ethe
rlan
ds
415
N
ethe
rlan
ds
417
N
ethe
rlan
ds
410
12
Sw
itzer
land
2
54
Den
mar
k 3
14
Aus
tral
ia
328
S
audi
Ara
bia
268
F
ranc
e 4
01
UAE
3
70
Fra
nce
432
F
ranc
e 4
11
Fra
nce
391
D
enm
ark
409
13
Aus
tral
ia
223
S
witz
erla
nd
305
D
enm
ark
306
D
enm
ark
266
It
aly
383
J
apan
3
37
Sau
di A
rabi
a 3
05
Ital
y 3
40
Sw
itzer
land
3
45
Sw
itzer
land
3
99
14 S
pain
2
04
Can
ada
301
J
apan
2
97
Sw
itzer
land
2
63
Jap
an
346
It
aly
335
It
aly
283
S
witz
erla
nd
326
D
enm
ark
308
A
ustr
alia
3
57
15 D
enm
ark
174
S
pain
2
77
Sw
itzer
land
2
82
Aus
tral
ia
241
D
enm
ark
283
D
enm
ark
238
D
enm
ark
268
D
enm
ark
290
It
aly
283
K
uwai
t 3
27
16 B
elgi
um
130
T
urke
y 2
32
Bel
gium
1
74
Irel
and
211
S
witz
erla
nd
230
S
witz
erla
nd
221
S
witz
erla
nd
241
T
urke
y 2
64
Spa
in
232
It
aly
276
17
UAE
1
23
Sau
di A
rabi
a 1
61
Sau
di A
rabi
a 1
72
Jap
an
171
B
elgi
um
209
B
elgi
um
199
B
elgi
um
234
B
elgi
um
259
B
elgi
um
186
S
pain
2
53
18 F
inla
nd
89
Bel
gium
1
48
Tur
key
149
B
elgi
um
161
Ir
elan
d 2
08
Fin
land
1
52
Fin
land
1
76
UAE
1
89
Fin
land
1
57
Bel
gium
2
50
19 Ir
elan
d 6
6 F
inla
nd
141
F
inla
nd
141
F
inla
nd
153
F
inla
nd
142
Ir
elan
d 1
33
Tur
key
145
F
inla
nd
167
Ir
elan
d 1
52
Fin
land
1
62
20 T
urke
y 6
5 C
hina
1
20
Irel
and
123
A
ustr
ia
54
UAE
1
11
Sau
di A
rabi
a 1
20
Irel
and
129
Ir
elan
d 1
26
Qat
ar
105
Ir
elan
d 1
47
128
CHAPTER 9: DATA & GUIDES
RA
NK
2003
2004
2005
2006
2007
2008
2009
2010
2011
2012
1Ir
aq
1,42
4 Ir
aq
1,16
6 Su
dan
1,46
4 Su
dan
1,47
4 Su
dan
1,42
8 Su
dan
1,53
0 Su
dan
1,50
1 H
aiti
3,20
1 P
akis
tan
1,42
0 Sy
ria
1,53
6 2
Ethi
opia
84
0 Su
dan
1,03
9 In
done
sia
1,00
2 W
est B
ank
& G
aza
Stri
p, 6
15
Wes
t Ban
k &
G
aza
Stri
p, 6
23
Ethi
opia
93
7 W
est B
ank
&
Gaz
a St
rip
1,17
8 P
akis
tan
2,24
2 So
mal
ia
1,08
8 So
uth
Suda
n 86
5 3
Afgh
anis
tan
530
Wes
t Ban
k &
G
aza
Stri
p, 7
02
Pak
ista
n 95
1 In
done
sia
586
DR
C
443
Afgh
anis
tan
930
Ethi
opia
73
8 Su
dan
958
W
est B
ank
&
Gaz
a St
rip,
838
W
est B
ank
&
Gaz
a St
rip,
654
4
Wes
t Ban
k &
G
aza
Stri
p, 4
88
Ethi
opia
47
4 Ir
aq
757
Leba
non
581
Iraq
41
2 W
est B
ank
&
Gaz
a St
rip,
661
Af
ghan
ista
n 69
3 Et
hiop
ia
674
Afgh
anis
tan
768
Som
alia
62
7 5
Suda
n 38
4 Af
ghan
ista
n 46
3 Et
hiop
ia
698
P
akis
tan
553
Afgh
anis
tan
351
Som
alia
63
4 D
RC
61
4 W
est B
ank
&
Gaz
a St
rip,
644
Et
hiop
ia
685
Pak
ista
n 52
9 6
Ango
la
340
DR
C
301
Sri L
anka
62
6 D
RC
46
4 B
angl
ades
h 34
0 D
RC
56
2 P
akis
tan
611
Afgh
anis
tan
642
Japa
n 56
6 Af
ghan
ista
n 49
2 7
DR
C
273
Ango
la
234
Wes
t Ban
k &
G
aza
Stri
p 38
3 Ir
aq
435
Leba
non
339
Mya
nmar
52
2 So
mal
ia
600
DR
C
491
Suda
n 54
7 Et
hiop
ia
484
8Er
itrea
18
9 Li
beri
a 18
6 Af
ghan
ista
n 34
0 Af
ghan
ista
n 38
1 Et
hiop
ia
328
Iraq
41
0 Ir
aq
525
Ken
ya
304
Ken
ya
533
DR
C
464
9B
urun
di
157
Uga
nda
180
DR
C
323
Ethi
opia
37
8 So
mal
ia
291
Zim
babw
e 35
4 K
enya
42
2 C
had
292
Hai
ti 52
7 Su
dan
441
10U
gand
a 15
4 B
urun
di
172
Zim
babw
e 23
0 So
mal
ia
341
Pak
ista
n 26
5 C
hina
33
6 Zi
mba
bwe
420
Som
alia
25
2 Li
bya
518
Leba
non
404
11
Som
alia
15
4 So
mal
ia
171
Som
alia
20
7 K
enya
26
9 In
done
sia
246
K
enya
32
3 C
had
336
Nig
er
246
Sout
h Su
dan
488
Ken
ya
404
12
DP
RK
15
3 Ir
an
167
Eritr
ea
199
Uga
nda
243
Uga
nda
242
Cha
d 25
9 In
done
sia
281
Sri L
anka
21
3 D
RC
44
4 Y
emen
30
5 13
Jord
an
141
DP
RK
14
5 U
gand
a 19
2 Sr
i Lan
ka
185
Sri L
anka
22
1 Sr
i Lan
ka
256
Sri L
anka
26
6 Ir
aq
209
Iraq
30
2 Jo
rdan
30
3 14
Serb
ia
137
Serb
ia
137
Bur
undi
17
7 B
urun
di
161
Ken
ya
205
Uga
nda
252
Syri
a 18
5 Zi
mba
bwe
209
Cha
d 25
9 C
had
298
15Si
erra
Leo
ne
136
Eritr
ea
131
Indi
a 15
6 Li
beri
a 15
7 C
had
197
Pak
ista
n 22
2 M
yanm
ar
167
Jord
an
177
Yem
en
221
Nig
er
291
16Ta
nzan
ia
130
Jord
an
115
Libe
ria
152
Zim
babw
e 12
4 Zi
mba
bwe
170
Hai
ti 21
9 U
gand
a 16
4 In
done
sia
143
Nig
er
182
Mal
i 25
8 17
Libe
ria
114
Cha
d 11
3 C
had
136
Cha
d 11
6 C
olom
bia
114
Leba
non
194
Hai
ti 14
8 Le
bano
n 12
7 In
done
sia
169
Hai
ti 23
7 18
Zim
babw
e 98
B
angl
ades
h 10
9 An
gola
12
7 Jo
rdan
11
1 B
urun
di
114
Yem
en
152
Geo
rgia
14
4 Sy
ria
125
Zim
babw
e 16
2 Zi
mba
bwe
152
19Le
bano
n 86
K
enya
99
N
iger
12
7 C
olom
bia
106
Jord
an
114
Indo
nesi
a 14
7 Jo
rdan
14
1 Ye
men
11
8 Jo
rdan
15
1 P
hilip
pine
s 13
9 20
Ken
ya
82
Leba
non
95
Jord
an
114
Indi
a 87
Li
beri
a 11
3 Jo
rdan
14
7 Le
bano
n 14
1 M
yanm
ar
112
Cot
e d’
Ivoi
re
137
Mya
nmar
13
0
Tabl
e 10
.3
Top
20 r
ecip
ient
s of
inte
rnat
iona
l hum
anita
rian
res
pons
e fr
om g
over
nmen
t don
ors
and
priv
ate
cont
ribu
tions
, 200
3–20
12U
S$ m
illio
ns
Sour
ce: D
evel
opm
ent I
nitia
tives
bas
ed o
n O
ECD
DAC
dat
a fo
r D
AC g
over
nmen
ts, T
urke
y an
d EU
inst
itutio
ns. A
ll ot
her
data
from
UN
OC
HA
FTS
and
UN
CER
F
129
GLOBAL HUMANITARIAN ASSISTANCE REPORT HIGHLIGHTS 2014
RA
NK
2004
2005
2006
2007
2008
2009
2010
2011
2012
2013
1U
S23
.0
US
27.2
U
S24
.2
US
3.4
U
S27
.7
US
30.1
U
S31
.5
US
30.4
U
S30
.6
US
30.9
2
Japa
n10
.6
Japa
n10
.9
EU in
stitu
tions
11.4
EU
inst
itutio
ns11
.6
EU in
stitu
tions
12.1
EU
inst
itutio
ns12
.8
UK
13.8
EU
inst
itutio
ns16
.3
EU in
stitu
tions
7.5
UK
17.7
3
EU in
stitu
tions
10.2
EU
inst
itutio
ns10
.8
Japa
n10
.8
Ger
man
y9.
4 G
erm
any
10.7
U
K12
.2
Ger
man
y12
.8
UK
13.7
U
K13
.8
EU in
stitu
tions
15.2
4
Fran
ce8.
0 Fr
ance
7.7
UK
8.9
UK
8.8
UK
10.5
Ja
pan
11.5
EU
inst
itutio
ns12
.7
Ger
man
y13
.0
Ger
man
y12
.4
Ger
man
y13
.2
5G
erm
any
7.9
UK
7.5
Ger
man
y8.
6 Fr
ance
8.4
Japa
n9.
7 G
erm
any
11.5
Ja
pan
11.6
Fr
ance
11.0
Ja
pan
10.6
Ja
pan
11.8
6
UK
7.4
Ger
man
y7.
4 Fr
ance
8.0
Japa
n8.
4 Fr
ance
9.3
Fran
ce10
.7
Fran
ce11
.4
Japa
n10
.6
Fran
ce10
.6
Fran
ce10
.2
7N
ethe
rlan
ds4.
6 N
ethe
rlan
ds5.
4 N
ethe
rlan
ds5.
7 N
ethe
rlan
ds5.
8 N
ethe
rlan
ds6.
3 N
ethe
rlan
ds6.
1 N
ethe
rlan
ds5.
8 N
ethe
rlan
ds5.
8 C
anad
a5.
5 Sw
eden
5.6
8C
anad
a3.
9 C
anad
a4.
7 Sw
eden
4.5
Can
ada
4.8
Spai
n5.
8 Sp
ain
6.0
Can
ada
5.6
Can
ada
5.5
Net
herl
ands
5.4
Nor
way
5.5
9N
orw
ay3.
8 N
orw
ay4.
2 C
anad
a4.
4 Sp
ain
4.7
Can
ada
5.3
Swed
en5.
3 Sp
ain
5.4
Swed
en5.
2 Au
stra
lia5.
4 Au
stra
lia5.
2 10
Swed
en3.
4 Sw
eden
4.2
Nor
way
4.1
Swed
en4.
6 Sa
udi A
rabi
a5.
1 N
orw
ay5.
1 N
orw
ay5.
0 Sa
udi A
rabi
a5.
0 Sw
eden
5.2
Net
herl
ands
5.1
11Ita
ly2.
8 Ita
ly4.
0 Sp
ain
3.6
Nor
way
4.5
Swed
en4.
9 C
anad
a4.
9 Sw
eden
4.9
Aust
ralia
5.0
Nor
way
4.7
UAE
5.1
12Au
stra
lia2.
7 Au
stra
lia2.
9 Au
stra
lia3.
1 Ita
ly3.
5 N
orw
ay4.
3 Au
stra
lia4.
0 Au
stra
lia4.
5 N
orw
ay4.
7 Sw
itzer
land
3.0
Can
ada
5.0
13Sp
ain
2.6
Spai
n2.
7 D
enm
ark
2.5
Aust
ralia
3.
4 Ita
ly3.
7 Sa
udi A
rabi
a3.
3 Sa
udi A
rabi
a3.
6 Sp
ain
3.8
Italy
2.7
Turk
ey3.
3 14
Den
mar
k2.
5 D
enm
ark
2.5
Saud
i Ara
bia
2.3
UAE
2.6
Aust
ralia
3.7
Italy
3.0
Den
mar
k2.
8 Ita
ly3.
5 D
enm
ark
2.7
Switz
erla
nd3.
2 15
Switz
erla
nd2.
2 Sw
itzer
land
.2
Italy
2.3
Den
mar
k2.
6 D
enm
ark
2.6
Den
mar
k2.
8 Ita
ly2.
8 Sw
itzer
land
2.8
Turk
ey2.
5 Ita
ly3.
1 16
Saud
i Ara
bia
2.1
Bel
gium
1.8
Switz
erla
nd2.
2 Sw
itzer
land
2.1
Switz
erla
nd2.
3 Sw
itzer
land
2.5
Switz
erla
nd2.
5 D
enm
ark
2.8
Bel
gium
2.0
Den
mar
k2.
8 17
Bel
gium
1.5
Saud
i Ara
bia
1.2
Bel
gium
1.8
Bel
gium
1.8
Bel
gium
2.2
Bel
gium
2.5
Bel
gium
2.5
Bel
gium
2.5
Spai
n2.
0 B
elgi
um2.
2
18Fi
nlan
d0.
8 Fi
nlan
d0.
9 Ir
elan
d1.
0 Sa
udi A
rabi
a1.
7 U
AE1.
3 Fi
nlan
d1.
3 Fi
nlan
d1.
4 Fi
nlan
d1.
3 K
orea
1.6
Spai
n1.
9 19
Aust
ria
0.7
Kor
ea0.
8 Fi
nlan
d1.
0 Ir
elan
d1.
0 Ir
elan
d1.
1 Au
stri
a1.
1 K
orea
1.2
Kor
ea1.
3 Fi
nlan
d1.
3 K
orea
1.7
20Ir
elan
d0.
6 Au
stri
a0.
8 U
AE0.
9 Fi
nlan
d1.
0 Fi
nlan
d1.
1 K
orea
1.0
Aust
ria
1.1
Turk
ey1.
3 Sa
udi A
rabi
a1.
3 Fi
nlan
d1.
4
Tabl
e 10
.4
Top
20 g
over
nmen
t don
ors
of o
ffici
al d
evel
opm
ent a
ssis
tanc
e (O
DA
), 20
04 –
2013
US$
bill
ions
Sour
ce: D
evel
opm
ent I
nitia
tives
bas
ed o
n O
ECD
DAC
dat
a N
otes
: Dat
a fo
r 20
13 is
pre
limin
ary.
OD
A ex
clud
es d
ebt r
elie
f.
GLOBAL HUMANITARIAN ASSISTANCE REPORT 2014
130
CHAPTER 9: DATA & GUIDESCHAPTER 10: DATA & GUIDES
RA
NK
2003
2004
2005
2006
2007
2008
2009
2010
2011
2012
1Ir
aq2.
9Ir
aq5.
4Ir
aq9.
3Ir
aq6.
0Ir
aq4.
6Af
ghan
ista
n4.
9Af
ghan
ista
n6.
4Af
ghan
ista
n6.
5Af
ghan
ista
n6.
6Af
ghan
ista
n6.
52
viet
nam
2.4
Afgh
anis
tan
2.8
Afgh
anis
tan
3.3
Afgh
anis
tan
3.3
Afgh
anis
tan
4.1
Iraq
3.4
viet
nam
4.0
Ethi
opia
3.6
viet
nam
3.5
viet
nam
4.1
3Ta
nzan
ia2.
2vi
etna
m2.
3In
done
sia
2.5
Pak
ista
n2.
4vi
etna
m2.
9Et
hiop
ia3.
3Et
hiop
ia4.
0Ta
nzan
ia3.
1Et
hiop
ia3.
5Et
hiop
ia3.
24
Afgh
anis
tan
2.1
Chi
na2.
1vi
etna
m2.
3Et
hiop
ia2.
3Et
hiop
ia2.
6vi
etna
m2.
7Ta
nzan
ia3.
1vi
etna
m3.
1P
akis
tan
3.2
Turk
ey3.
05
Ethi
opia
2.1
Ethi
opia
2.0
Ethi
opia
2.2
Suda
n2.
2P
akis
tan
2.3
Suda
n2.
5Ir
aq2.
9H
aiti
3.0
Indi
a3.
2Ta
nzan
ia2.
86
Chi
na1.
8Ta
nzan
ia2.
0C
hina
2.2
viet
nam
2.2
Tanz
ania
2.3
Tanz
ania
2.3
Pak
ista
n2.
7In
dia
2.9
Turk
ey3.
0K
enya
2.6
7B
angl
ades
h1.
7B
angl
ades
h1.
7In
dia
2.2
Tanz
ania
2.2
Suda
n2.
1W
est B
ank
&
Gaz
a St
rip,
2.3
Indi
a2.
7P
akis
tan
2.9
Ken
ya2.
4D
RC
2.3
8In
done
sia
1.6
Pak
ista
n1.
7Su
dan
2.1
Moz
ambi
que
1.8
Moz
ambi
que
1.8
Indi
a2.
2W
est B
ank
&
Gaz
a St
rip,
2.6
Wes
t Ban
k
& G
aza
Stri
p, 2
.5Ta
nzan
ia2.
4B
angl
ades
h2.
29
Jord
an1.
5Eg
ypt
1.5
Pak
ista
n1.
8U
gand
a1.
8U
gand
a1.
8B
angl
ades
h2.
1D
RC
2.4
Iraq
2.2
DR
C2.
3M
ozam
biqu
e2.
110
Serb
ia1.
5M
ozam
biqu
e1.
5Ta
nzan
ia1.
7In
dia
1.5
Wes
t Ban
k
& G
aza
Stri
p, 1
.7M
ozam
biqu
e2.
0Su
dan
2.4
DR
C2.
2W
est B
ank
&
Gaz
a St
rip,
2.3
Nig
eria
1.9
11M
ozam
biqu
e1.
4U
gand
a1.
5D
RC
1.6
DR
C1.
5C
hina
1.7
DR
C1.
8M
ozam
biqu
e2.
1N
iger
ia2.
1M
ozam
biqu
e2.
0P
akis
tan
1.9
12U
gand
a1.
3D
RC
1.4
Moz
ambi
que
1.5
Chi
na1.
5B
angl
ades
h1.
6U
gand
a1.
6U
gand
a1.
9Su
dan
2.1
Iraq
1.9
Wes
t Ban
k
& G
aza
Stri
p, 1
.813
Wes
t Ban
k
& G
aza
Stri
p, 1
.3Se
rbia
1.4
Ban
glad
esh
1.5
Wes
t Ban
k
& G
aza
Stri
p, 1
.4In
dia
1.4
Pak
ista
n1.
5K
enya
1.8
Moz
ambi
que
2.0
Gha
na1.
8G
hana
1.8
14G
hana
1.2
Wes
t Ban
k
& G
aza
Stri
p, 1
.3Sr
i Lan
ka1.
4In
done
sia
1.4
Ken
ya1.
4C
hina
1.5
Nig
eria
1.7
Uga
nda
1.8
Nig
eria
1.7
Indi
a1.
715
Bol
ivia
1.2
Gha
na1.
3U
gand
a1.
4G
hana
1.4
DR
C1.
3K
enya
1.4
Gha
na1.
6G
hana
1.7
Hai
ti1.
7U
gand
a1.
716
Col
ombi
a1.
0Su
dan
1.2
Gha
na1.
3B
angl
ades
h1.
4N
iger
ia1.
2G
hana
1.3
Turk
ey1.
3K
enya
1.7
Uga
nda
1.5
Sout
h Su
dan
1.6
17P
hilip
pine
s1.
0B
oliv
ia0.
9W
est B
ank
& G
aza
Stri
p, 1
.2C
olom
bia
1.1
Gha
na1.
2In
done
sia
1.3
Zam
bia
1.3
Indo
nesi
a1.
5B
angl
ades
h1.
5M
oroc
co1.
5
18Sr
i Lan
ka0.
9Za
mbi
a0.
9Se
rbia
1.0
Mor
occo
1.1
Zam
bia
1.0
Nig
eria
1.2
Ban
glad
esh
1.3
Ban
glad
esh
1.5
Sout
h Af
rica
1.4
Bra
zil
1.3
19Eg
ypt
0.9
Indi
a0.
9Za
mbi
a1.
0B
urki
na F
aso
1.0
Mor
occo
1.0
Zam
bia
1.1
Indo
nesi
a1.
2M
ali
1.1
Mor
occo
1.4
Iraq
1.3
20So
uth
Afri
ca0.
9M
adag
asca
r0.
9N
iger
ia0.
9Se
rbia
1.0
Bur
kina
Fas
o1.
0Tu
rkey
1.1
Hai
ti1.
2B
urki
na F
aso
1.1
Cot
e d’
Ivoi
re1.
3H
aiti
1.3
Tabl
e 10
.5
Top
20 r
ecip
ient
s of
offi
cial
dev
elop
men
t ass
ista
nce
(OD
A),
2003
–20
12U
S$ b
illio
ns
Sour
ce: D
evel
opm
ent I
nitia
tives
bas
ed o
n O
ECD
DAC
dat
a N
otes
: OD
A fr
om O
ECD
DAC
don
ors
and
mul
tilat
eral
inst
itutio
ns. O
DA
excl
udes
deb
t rel
ief.
131
GLOBAL HUMANITARIAN ASSISTANCE REPORT HIGHLIGHTS 2014
BIG
GES
T D
ON
OR
S 20
13
(US$
MIL
LIO
NS)
MO
ST G
ENER
OU
S C
OU
NTR
IES
IN
201
3 (%
GN
I)M
OST
GEN
ERO
US
CO
UN
TRIE
S
IN 2
013
(pER
CIT
IzEN
)M
OST
pR
IOR
ITY
TO H
UM
AN
ITA
RIA
N
ASS
ISTA
NC
E W
ITH
IN O
VER
ALL
AID
p
RO
GR
AM
MES
IN 2
013
(% O
DA
)
US
4,6
86
Turk
ey0.
21%
Nor
way
120
Turk
ey50
%
UK
1,8
25
Kuw
ait
0.20
%Lu
xem
bour
g11
0Ir
elan
d18
%
Turk
ey 1
,638
Lu
xem
bour
g0.
15%
Kuw
ait
95R
ussi
an F
eder
atio
n18
%
Japa
n 1
,112
Sw
eden
0.14
%Sw
eden
81Es
toni
a17
%
Ger
man
y 9
49
Den
mar
k0.
12%
Den
mar
k73
US
15%
Swed
en 7
85
Nor
way
0.12
%Sw
itzer
land
49Lu
xem
bour
g15
%
Can
ada
691
Ir
elan
d0.
08%
Irel
and
32D
enm
ark
15%
Nor
way
613
U
K0.
07%
Finl
and
30Sw
eden
14%
Fran
ce 4
27
Finl
and
0.07
%Q
atar
29C
anad
a14
%
Net
herl
ands
410
Sw
itzer
land
0.06
%U
K29
Spai
n13
%
Den
mar
k 4
09
Net
herl
ands
0.05
%N
ethe
rlan
ds24
Switz
erla
nd13
%
Switz
erla
nd 3
99
Bel
gium
0.05
%B
elgi
um22
Latv
ia13
%
Aust
ralia
357
C
anad
a0.
04%
Turk
ey22
Bel
gium
12%
Kuw
ait
327
Q
atar
0.03
%C
anad
a20
Nor
way
11%
Italy
276
U
S0.
03%
Aust
ralia
15P
olan
d11
%
Spai
n 2
53
Bah
rain
0.03
%U
S15
Slov
ak R
epub
lic11
%
Bel
gium
250
G
erm
any
0.03
%Li
echt
enst
ein
13C
zech
Rep
ublic
10%
Finl
and
162
U
AE0.
02%
Mon
aco
13U
K10
%
Irel
and
147
Au
stra
lia0.
02%
Ger
man
y12
Gre
ece
10%
Saud
i Ara
bia
109
N
ew Z
eala
nd0.
02%
UAE
9Ja
pan
9%
Tabl
e 10
.6
20 la
rges
t gov
ernm
ent c
ontr
ibut
ors
of in
tern
atio
nal h
uman
itari
an a
ssis
tanc
e, 2
013
Sour
ce: D
evel
opm
ent I
nitia
tives
bas
ed o
n O
ECD
DAC
, UN
OC
HA
FTS
and
Wor
ld B
ank
data
N
otes
: OD
A fo
r al
l don
ors
is b
ased
on
OEC
D D
AC d
ata
incl
usiv
e of
deb
t rel
ief,
exce
pt fo
r B
razi
l, R
ussi
a, In
dia,
Chi
na a
nd S
outh
Afr
ica
(BR
ICS)
whi
ch is
OD
A-lik
e co
nces
sion
al fl
ows
colle
cted
by
the
OEC
D D
AC.
GLOBAL HUMANITARIAN ASSISTANCE REPORT 2014
132
CHAPTER 9: DATA & GUIDESCHAPTER 10: DATA & GUIDES
DO
MES
TIC
FLO
WS
OTH
ER IN
TER
NAT
ION
AL
FLO
WS
pR
IVAT
E FL
OW
S O
THER
FLO
WS
GO
VER
NM
ENT
EXp
END
ITU
RE
OTH
ER O
FFIC
IAL
FLO
WS
(GR
OSS
) D
EVEL
Op
MEN
T A
SSIS
TAN
CE
INTE
RN
ATIO
NA
L H
UM
AN
ITA
RIA
N
ASS
ISTA
NC
E
REM
ITTA
NC
ES
FO
REI
GN
DIR
ECT
INVE
STM
ENT
pEA
CEK
EEp
ING
Afgh
anis
tan
5,07
9 5
4 6,
253
492
4
60
94
924
Cha
d 2
,963
3
6 23
9 2
98
-
323
-
DR
C
5,3
76
44
2,41
7 4
64
-
3,3
12
1,4
79
Ethi
opia
7
,181
9
7 2,
863
484
5
24
970
-
Hai
ti 2,
224
10
1,05
8 2
37
1,6
12
179
7
21
Indo
nesi
a 1
73,1
20
4,1
21
2,27
2 5
1 7
,212
1
9,85
3 -
Iraq
9
3,51
7 -
1,
220
98
271
2
,549
2
02
Jord
an
9,67
8 6
18
1,44
1 3
03
3,5
74
1,4
03
-
Ken
ya
12,1
83 2
64
2,78
9 4
04
1,2
27
259
-
Leba
non
13,3
06 1
16
489
404
7
,322
3
,787
5
35
Mya
nmar
1
5,14
0 1
4
03
130
5
66
2,2
43
-
Pak
ista
n 4
8,57
2 9
16
2,38
3 5
29
14,
007
847
-
Som
alia
-
-
49
1 6
27
-
-
219
Sout
h Su
dan
3,5
62
-
725
8
65
-
-
789
Sri L
anka
1
1,69
7 3
34
931
8
3 6
,001
7
76
-
Suda
n 8
,544
6
3 6
40
441
4
01
2,4
66
1,7
86
Syri
a -
1
6 1
,153
1
,536
-
-
6
6
Uga
nda
4,05
8 1
46
1,62
8 8
0 7
33
1,7
21
5
Wes
t Ban
k &
Gaz
a St
rip
-
31
1,37
5 6
54
-
-
13
Zim
babw
e 3
,569
2
2 8
73
152
-
4
00
-
Tabl
e 10
.7
Inte
rnat
iona
l hum
anita
rian
ass
ista
nce
to to
p 20
rec
ipie
nts,
in th
e co
ntex
t of o
ther
offi
cial
, dom
estic
and
pri
vate
flow
s, 2
012
US$
mill
ions
Sour
ce: D
evel
opm
ent I
nitia
tives
bas
ed o
n IM
F W
orld
Eco
nom
ic O
utlo
ok, O
ECD
DAC
, UN
OC
HA
FTS,
Wor
ld B
ank,
UN
CTA
D a
nd S
IPR
I dat
a N
ote:
Top
20
reci
pien
ts r
eflec
t 200
3–20
12 p
erio
d. F
undi
ng fl
ows
base
d on
201
2 da
ta.
133
GLOBAL HUMANITARIAN ASSISTANCE REPORT HIGHLIGHTS 2014
RA
NK
CR
ISIS
INTE
RN
ATIO
NA
L H
UM
AN
ITA
RIA
N
ASS
ISTA
NC
E, 2
012
VOLU
ME
CH
AN
GE
2011
–201
2 (U
S$m
)
% C
HA
NG
E 20
11–2
012
(%)
FCA
A
pp
EAR
AN
CES
(2
004–
2014
)
% U
N-
CO
OR
DIN
ATED
Ap
pEA
L FU
ND
ED
2013
% U
N-
CO
OR
DIN
ATED
A
pp
EAL
UN
DER
FUN
DED
20
13
1M
yanm
ar (c
onfli
ct in
Rak
hine
and
Kac
hin
Stat
es,
and
Mya
nmar
ref
ugee
s in
Tha
iland
) 13
038
41%
1172
%28
%
2Al
geri
a (S
ahra
wi c
risi
s)
311
3%10
No
appe
aln/
a
3In
dia
(Nax
alite
-affe
cted
regi
ons,
Jam
ma
and
Kas
hmir
, Nor
th E
ast I
ndia
con
flict
s)
330.
41%
10N
o ap
peal
n/a
4N
epal
(Bhu
tane
se R
efug
ees)
45-7
-14%
9N
o ap
peal
n/a
5C
olom
bia
(Inte
rnal
arm
ed c
onfli
ct)
75-1
4-1
5%8
No
appe
aln/
a
6Th
aila
nd (M
yanm
ar b
orde
r)85
1217
%7
No
appe
aln/
a
7B
angl
ades
h (C
hitt
agon
g H
ill T
ract
s, R
ohin
gyas
) 87
56%
7N
o ap
peal
n/a
8C
AR (i
nter
nal a
rmed
con
flict
and
the
hum
anita
rian
cri
sis
caus
ed b
y th
e LR
A)
69-1
-1%
653
%47
%
9Ye
men
(con
flict
in th
e no
rth
and
refu
gees
from
the
Hor
n of
Afr
ica)
30
584
38%
655
%45
%
Tabl
e 10
.8
Mos
t fre
quen
tly a
ppea
ring
cou
ntri
es o
n EC
HO
's fo
rgot
ten
cris
is a
sses
smen
t (FC
A) i
ndex
, 200
4 –2
014
Sour
ce: D
evel
opm
ent I
nitia
tives
bas
ed o
n EC
HO
FC
A in
dex,
OEC
D D
AC, U
N O
CH
A FT
S an
d U
N a
ppea
ls d
ata
GLOBAL HUMANITARIAN ASSISTANCE REPORT 2014
134
CHAPTER 10: DATA & GUIDES
Notes
Chapter 11 Ferris, Elizabeth, Daniel Petz and Chareen Stark, ‘The
Year of Recurring Disasters: A Review of Natural Disasters in 2012’, Brookings Institution and London School of Economics Project on Internal Displacement, Washington and London, November 2013.
2 UNHCR, UNHCR Global Trends 2012: Displacement: the New 21st Century Challenge, UNHCR, June 2013.
Chapter 21 Good Humanitarian Donorship, ‘Principles and Good
Practice of Humanitarian Donorship’, GHD, Stockholm, 2003.
2 International Committee of the Red Cross, Key data for 2014 (Emergency appeals summary), ICRC, Geneva, 2014. www.icrc.org/eng/assets/files/2013/overview-icrc-operations-2014.pdf.
3 International Committee of the Red Cross, ‘Overview of operations 2013’, ICRC, Geneva, 2012, p80.
4 International Federation of Red Cross and Red Crescent Societies, ‘Appeals, plans and updates’ IFRC, Geneva, www.ifrc.org/en/publications-and-reports/appeals.
5 All IFRC data was downloaded in April 2014, except for data for the Somalia appeal, which was downloaded in June 2014.
Chapter 31 Centre for Research on the Epidemiology of Disasters,
‘EM-DAT International Disaster Database’, CRED, Université Catholique de Louvain, Brussels, www.emdat.be/database.
2 Ministry of Foreign Affairs, ‘Humanitarian Aid Policy of Japan’, Government of Japan, Tokyo, www.mofa.go.jp/policy/emergency/pdfs/aid_policy_japan.pdf.
3 Organisation for Economic Co-operation and Development, ‘Technical Guide to terms and data in the Creditor Reporting System (CRS) Aid Activities database’, OECD, Paris, www.oecd.org/dac/stats/crsguide.htm.
5 Organisation for Economic Co-operation and Development, ‘Development Co-operation Peer Reviews: Japan 2014’, OECD Publishing, Paris, 2014.
6 Japan International Cooperation Agency, JICA 2013 Annual Report, JICA, Tokyo, 2013, p88.
7 UN Office for the Coordination of Humanitarian Affairs, ‘International Humanitarian Pledging Conference for Syria’, UN OCHA, Kuwait, 2013, www.unocha.org/first-international-humanitarian-pledging-conference-syria.
8 La Lotería Nacional de la Cruz Roja Colombiana, Colombian Red Cross Society, Bogotá www.lotecruz.org.co.
9 Data presented in this section includes only analysis of funds channelled through the ICRC and the IFRC’s international headquarters, as financial statements from individual national societies are not always comparable.
10 UN General Assembly Resolution 46/182, Strengthening of the Coordination of Humanitarian Emergency Assistance of the United Nations, A/RES/46/182, New York, 19 December 1991.
11 Office of the UN High Commissioner for Refugees, ‘War’s Human Cost, Global Trends 2013’, UNHCR, Geneva, 2014.
12 Development Initiatives based on: (i) Chakrabarti D, Prabodh G, ‘Understanding Existing Methodologies for Allocating and Tracking DRR Resources in India’, UNISDR, Geneva, 2012; and (ii) International Monetary Fund, ‘World Economic Outlook Database’, IMF, Washington DC, http://www.imf.org/external/pubs/ft/weo/2014/01/weodata/index.aspx. Currency converted from Indian rupees to US dollars using 2012 exchange rates.
13 Food and Agricultural Organization of the United Nations, ‘Food security indicators’, FAO, Rome, 2014, www.fao.org/economic/ess/ess-fs/ess-fadata/en/#.U5xva_mwI9t.
Chapter 51 Throughout this report we use GHA’s unique dataset on
private funding for our analysis of private flows. However, for purposes of comparability and data availability, we use FTS data in this section, to compare channels of delivery by donor type.
2 Funding channelled through the public sector in the donor country may include use by the central aid authorities of other public sector agencies in the donor country for implementation of specific activities. See www.oecd.org/development/stats/45917818.pdf for OECD definitions of funding channels.
3 UN Office for the Coordination of Humanitarian Affairs, ‘Emergency Response Fund Pakistan Annual Report 2013’, UN OCHA, Geneva, 2013, p3.
5 Our analysis of allocations from the Pakistan ERF using OCHA FTS data differs to that of OCHA as outlined in its annual report (referenced above). OCHA’s own breakdown is as follows: 48% to national NGOs, 44% to international NGOs and 8% to UN agencies. We have used our own analysis primarily in order to distinguish between funding to national and local NGOs.
6 Development Initiatives, ‘Afghanistan beyond 2014: financing for security and development’, Development Initiatives, Bristol, forthcoming 2014.
Chapter 41 Our private humanitarian spending figures are based
on data provided by 10 international organisations. It is therefore not necessarily reflective of global expenditure patterns of private humanitarian assistance.
2 Inter-Agency Standing Committee, ’Humanitarian System-Wide Emergency Activation: definition and procedures‘, IASC Working Group Paper, IASC, Geneva, 2012.
3 Internal Displacement Monitoring Centre, ‘Myanmar: comprehensive solutions needed for recent and long-term IDPs alike’, IDMC, Geneva, 2014 www.internal-displacement.org/south-and-south-east-asia/myanmar/2014/myanmar-comprehensive-solutions-needed-for-recent-and-long-term-idps-alike.
4 Office of the UN High Commissioner for Refugees, ‘Refugee population by country of asylum, 1960-2013 (end-year figures)’ and ‘Refugee population by origin, 1960-2013 (end-year figures)’, UNHCR, Geneva, 2013, www.unhcr.org/statistics/Ref_1960_2013.zip.
5 UN Office for the Coordination of Humanitarian Affairs, ‘Myanmar: A country prone to a range of natural disasters’, UN OCHA, http://reliefweb.int/sites/reliefweb.int/ files/resources/Myanmar-Natural%20Disaster_Aug %202013.pdf.
6 International Committee of the Red Cross, ‘Six underfunded ICRC operations’, ICRC, June 2014, http://reliefweb.int/report/south-sudan/six-underfunded-icrc-operations.
7 UN Office for the Coordination of Humanitarian Affairs, ‘Humanitarian Bulletin, Myanmar’, Issue 5, 2014, http://reliefweb.int/sites/reliefweb.int/files/resources/Bulletin_Humanitarian_OCHA_May2014_0.pdf.
Chapter 71 As set out in the 23 Principles and Good Practice for Good
Humanitarian Donorship, 2003, and in OECD DAC definition of humanitarian assistance.
2 USAID, ‘Building Resilience to Recurring Crises, USAID Policy and Program Guidance’, USAID, Washington DC, December 2012.
3 Russell J, ‘Building Resilience in the Horn of Africa’, Interaction, Washington DC, 2012, http://interaction.org/blog/building-resilience-horn-africa.
4 McElhinney, Helen, ‘The Evolution of DFID’s Humanitarian Financing in Yemen’, Humanitarian Exchange.
5 Calculations are based on shares of country-allocable humanitarian assistance.
6 SRPs covering the period 2014 to 2015 are in place for Djibouti and Yemen. SRPs covering 2014 to 2016 include: Burkino Faso, Cameroon, Chad, Gambia, Niger, Nigeria, Mauritania, Mali, Sahel, Senegal and South Sudan. ‘Magazine’, Issue 61, Humanitarian Practice Network, 2014.
7 Amos, valerie, Statement of Under-Secretary-General for Humanitarian Affairs and Emergency Relief Coordinator, ‘Security Council briefing on the humanitarian situation in Somalia’, 4 June 2014.
8 Organisation for Economic Co-operation and Development, ‘What does “resilience” mean for donors? An OECD Factsheet’, OECD, Paris, 2013.
9 UNICEF and OECD, ‘Resilience Systems Analysis Eastern Democratic Republic of Congo’, Goma, 2014.
10 Using OECD DAC 2013 exchange rates
12 European Commission Humanitarian Aid and Civil Protection Development and Cooperation, ‘Building Resilience: The EU’s Approach – Factsheet’, ECHO, Brussels, 2014.
12 USAID, ‘RISE: Resilience in the Sahel Enhanced’, USAID, Washington DC, 2014.
13 DFID is providing up to UK£70 million between 2013 and 2015 for multi-year programmes in Yemen. To qualify for DFID funding, projects must run for a minimum period of 24 months in the areas of food security, shelter, clean water and conflict recovery.
14 McElhinney, Helen ‘The evolution of DFID’s humanitarian financing in Yemen‘, Humanitarian Peace Network, May 2014.
15 Christoplos, Ian, Minnie Novaky and Yasemin Aysan, ‘Resilience, Risk and vulnerability at Sida: Final Report – Sida Decentralised Evaluation’, Swedish International Development Agency, Stockholm, 2012.
16 UNDP Comprehensive Disaster Management Programme17 Based on latest estimates for each country where data is
available. Data is not available for eight of the top 30 long-term humanitarian assistance recipient countries.
18 Syrian Center for Policy Research, ‘Syria: Squandering Humanity – Socio-economic Monitoring Report on Syria’, SCPR, UN Relief and Works Agency for Palestine Refugees in the Near East and UN Development Programme, Damascus, 2014.
Chapter 61 Organisation for Economic Co-operation and
Development, ‘DAC Statistics: Classification by type of aid’, OECD, Paris, 2013, www.oecd.org/dac/stats/dacstatisticsanewclassificationbytypeofaid.htm.
2 The Cash Learning Partership, ‘Cash Atlas’, CaLP, London, www.cash-atlas.org/cash-atlas.
3 UN Office for the Coordination of Humanitarian Affairs and DARA, ‘Saving Lives Today and Tomorrow: Managing the Risk of Humanitarian Crises’, OCHA, New York, 2014.
4 Development Initiatives, ‘Global Humanitarian Assistance Report 2013’, Development Initiatives, Bristol, 2013.
5 Organisation for Economic Co-operation and Development, ‘A Proposal to Establish a Policy Marker for Disaster Risk Management (DRM) in the OECD DAC Creditor Reporting System (CRS)’, DAC Working Party on Development Statistics, OECD, Paris, 2014.
6 United Nations Development Group, ‘Financing for Gender Equality and Tracking Systems, Background Note’ UNDG, New York, 2013, p3.
7 UN Commission on the Status of Women, Interactive Expert Panel: Review theme – Evaluation of progress in the implementation for gender equality and the empowerment of women, Fifty-sixth session 27 February – 9 March 2012, New York, p3.
8 European Commission Humanitarian Aid and Civil Protection Department (2013), Gender-Age Marker Toolkit. European Commission, Brussels. http://ec.europa.eu/echo/files/policies/sectoral/gender_ age_marker_toolkit.pdf.
9 Total ODA refers to total gross bilateral ODA as recorded in the CRS database.
10 Department for International Development, Keep Her Safe: Communiqué, UK Government, London, 2013.
Chapter 81 Somalia, Syria and the West Bank & Gaza Strip are
excluded due to data limitations.2 Hammond, Laura, ’Family Ties: Remittances and
Livelihoods Support in Puntland and Somaliland’, Food Security and Nutrition Analysis Unit (FSNAU) for Somalia and Food and Agricultural Organization of the United Nations, 2013.
3 Beechwood International, ‘Safer Corridors Rapid Assessment – Case Study: Somalia and UK Banking‘, UK Government, 2013.
4 Data on Philippine remittances is from Bangko Sentral Ng Pilipinas, ‘Economic and Financial Statistics’, Manila, www.bsp.gov.ph/statistics/efs_ext3.asp.
5 Commission on Filipinos Overseas, ‘Stock Estimate of Overseas Filipinos’ www.cfo.gov.ph.
6 Migration and Remittances Team, Development Prospects Group, ‘Migration and Remittances: Recent Developments and Outlook’, Migration and Development Brief 22, World Bank, Washington DC, 11 April 2014,
7 Organisation for Economic Co-operation and Development, ‘ODA casebook on conflict, peace and security activities’, OECD, Paris, 13 September 2007, www.oecd.org/dac/incaf/39967978.pdf.
8 Landmine and Cluster Munition Monitor, ‘The Issues: Landmines’, Landmine and Cluster Munition Monitor, Geneva, www.the-monitor.org/index.php/LM/The-Issues/Landmines.
9 UN General Assembly Security Council, Children and Armed Conflict – Report of the Secretary–General, General Assembly Sixty-Seventh Session, Agenda Item 65, New York, 15 May 2013, www.un.org/ga/search/view_doc.asp?symbol=A/67/845.
10 This includes UN-mandated peacekeeping, civilian and monitoring missions, NATO operations in Afghanistan and Iraq, as well as other multi-lateral missions such as the Australian-led International Force for East Timor (INTERFET). Figures are provided by SIPRI and include both central costs and estimates of troop-contributing countries’ costs.
11 United Nations, ‘Fifth Committee Considers Proposed $313 Million to Cover Initial Costs of United Nations
Mission in Central African Republic, Press Release, New York, 29 May 2014, www.un.org/News/press/docs/2014/gaab4113.doc.htm.
12 UN Department of Peacekeeping Operations, ‘Peacekeeping Fact Sheet’, DPKO, New York, May 2014, www.un.org/en/peacekeeping/resources/statistics/factsheet.shtml.
3 Poole, Lydia, Afghanistan beyond 2014: financing for security and development, Development Initiatives, Bristol, forthcoming.
4 Coleman, Katharina P, ‘The Political Economy of UN Peacekeeping: Incentivizing Effective Participation,’ International Peace Institute, New York, May 2014.
5 UN Department of Peacekeeping Operations, ‘Monthly Summary of Contributions (Police, UN Military Experts on Mission and Troops)’, DPKO, New York, 30 June 2014, http://www.un.org/en/peacekeeping/contributors/2014/jun14_1.pdf.
16 OECD, ‘Disaster Risk Assessment and Risk Financing: A G20 / OECD methodological framework’, OECD, 2012.
7 The Forum for Risk Management in Development, ‘What is the R4 Initiative?’, FARMD, www.agriskmanagementforum.org/content/what-r4-initiative.
8 Microinsurance Centre and Lloyd’s, ‘Insurance in Developing Countries: Exploring Opportunities in Microinsurance’, Lloyd’s 360 Insight, Lloyd’s, London, 2009.
19 IPCC, ‘Climate Change 2013: The Physical Science Basis. Contribution of Working Group I to the Fifth Assessment Report of the Intergovernmental Panel on Climate Change’. Cambridge University Press, Cambridge and New York, 2013.
20 University of Notre Dame Environmental Change Initiative, ‘Global Adaptation Index (ND-GAIN)’, University of Notre Dame, Washington DC, http://index.gain.org. Note that that this index does not include Somalia or oPt.
21 Climate Policy Initiative, The Global Landscape of Climate Finance 2013, CPI, San Francisco, 2013.
5 UN Office for the Coordination of Humanitarian Affairs, ‘Multi-Cluster/Sector Initial Rapid Assessment (MIRA), Philippines Typhoon Haiyan’, UNOCHA; and UN Office for the Coordination of Humanitarian Affairs /World Food Programme, ‘Multi-Cluster Needs Assessment (Final Report), Philippines Typhoon Haiyan’, UN OCHA and WFP, 2013.
External Mid-Term Review’, ACAPS, Geneva, 2013.8 International Federation of Red Cross and Red Crescent
Societies, Oxfam, Save the Children, World Food
Programme and Food and Agricultural Organization of the United Nations, ‘Early Warning, Early Action: Mechanisms for Rapid Decision Making’, IFRC, Nairobi, 2014.
9 Darcy, James, Heather Stobaugh, Peter Walker and Dan Maxwell, The Use of Evidence in Humanitarian Decision Making – ‘ACAPS Operational Learning Paper’, Feinstein International Center, Tufts University, Somerville, 2013.
10 Poole, Lydia, op. cit.
11 Global Partnership for Effective Development Co-operation, ’GPEDC summit, New Mexico 2014 - Film 2 - Transparency & Results’, The Refinery YouTube Channel, 6 May 2014, www.youtube.com/watch?v=sBAGH8JKJAU&sns=em.
12 “What happened in the Philippines is absolute proof that there are recipient countries who want the information. And when the Philippines government tried to find information on what money was coming in, they found it very difficult.” David Hall-Matthews, Publish What You Fund, ibid. b2
We produce briefings on both high-profile and forgotten humanitarian crises. We aim to make these available to anyone working in and on a particular crisis, via our email list and our dedicated webpage.
We are also partnering with the Start Network to provide analysis to inform their funding allocation decisions. The Start Network is a consortium of British-based humanitarian international NGOs, which has recently launched its own fund to help fill funding gaps and enable rapid response to under-reported crises where need is great. Within 12 hours of a funding alert, GHA produces a rapid overview of the humanitarian funding picture – recent funding, an overview of appeals and funds, and analysis of donor trends.
Emergencies covered have included the conflict in South Kachin, Myanmar; drought and food insecurity in Somalia and Ethiopia, and the Ebola outbreak in Sierra Leone.
All of this analysis is available for anyone interested or engaged in these crises.
Development Initiatives is an independent organisation committed to ending poverty by 2030. Global Humanitarian Assistance (GHA) is a data access and transparency programme of Development Initiatives that analyses resource fl ows to people living in humanitarian crises, and researches and publishes annual GHA reports. The programme is funded by the governments of Canada, Netherlands, Sweden and the United Kingdom. The report is produced entirely independently. The data analysis, content and presentation are solely the work of Development Initiatives and are a representation of its opinions alone. For further details on the content of this report including communication with its authors, or to ask questions or provide comments, please contact us by email ([email protected]) or visit our website at www.globalhumanitarianassistance.org
The Global Humanitarian Assistance Report 2013 uses the latest data to present the most comprehensive assessment of international fi nancing allocated to humanitarian situations. Sections on trends in humanitarian assistance, recent emergencies and their human impact, and efforts to strengthen the response to people in crisis, reveal the complexity of the international humanitarian response. The report answers questions about the way that the world fi nances response to crisis and vulnerability. How much humanitarian assistance is there? Is it enough? Who provides it? Where does it go? How does it get there? Transparent and reliable information, as provided by the Global Humanitarian Assistance Report 2013, is essential for all those working to address humanitarian crisis and vulnerability.
UK offi ceDevelopment Initiatives Ltd, North Quay HouseQuay side, Temple Back, Bristol, BS1 6FL, UKT: +44 (0) 1749 671343 F: +44 (0) 1749 676721Kenya offi ce
Development Initiatives Ltd, Shelter Afrique Building, 4th Floor Mamlaka Road, Nairobi, PO Box 102802-00101, Kenya Development Research and Training, UgandaDevelopment Research and Training (DRT), Ggaba RoadMutesasira Zone, Kansanga, Kampala, PO Box 22459, Uganda
GLO
BA
L HU
MA
NITA
RIA
N A
SSISTAN
CE R
EPO
RT 2013
ww
w.globalhum
anitarianassistance.org
What we do
The Global Humanitarian Assistance (GHA) programme provides objective, independent, rigorous data and analysis on humanitarian financing and related aid flows. Our aim is to enable access to a shared evidence base on resources relevant to crisis-affected people. We believe reliable information is fundamental for improved accountability and effectiveness.
Reports
We have been publishing our flagship annual Global Humanitarian Assistance report since 2000. We also produce a number of other reports on particular crises, humanitarian actors and financing mechanisms. Our most recent special focus reports include:
• Humanitarian assistance from non-state donors: What is it worth?, April 2014
• South Sudan: Donor response to the crisis, January 2014
• UN appeals 2014: Different process, greater needs, December 2013
• Central African Republic: The forgotten crisis, December 2013
www.globalhumanitarianassistance.org/reports
We also contribute to reports published by other organisations. Examples include: Instituto de Estudios sobre Conflictos y Acción Humanitaria (IECAH) Annual Report, 2013, La acción humanitaria en 2012–2013: instalados en la crisis (published in Spanish); World Humanitarian Data and Trends 2012 and 2013, UN Office for the Coordination of Humanitarian Affairs; and research on the cost and impacts of forced migration for the World Disasters Report 2012, International Federation of Red Cross and Red Crescent Societies.
To find out more about the full range of our work you can visit our website at www.globalhumanitarianassistance.org
Follow us on Facebook at www.facebook.com/ghaorg and keep up with us on Twitter at https://twitter.com/gha_org
In 2013, we restructured our website to allow improved and easier access to the range of GHA online products and services.
We maintain an active set of country profiles – and accompanying, unique, core datasets – to capture key information on humanitarian spending across the globe. There are currently 58 country profiles for recipients, donors and countries that are both donors and recipients of humanitarian assistance. Our profiles are updated annually, and new countries added.
The GHA datastore contains the data that underpins our reports and country profiles. The data is drawn from a wide variety of sources, including the Organisation for Economic Co-operation and Development’s Development Assistance Committee, UN OCHA Financial Tracking Service (FTS), UN OCHA field offices, the World Bank and the European Commission. There are seven core datasets:
1) international humanitarian response (what countries in crisis receive)
2) official development assistance (what countries give and receive in the form of OECD-defined ‘aid’)
3) financing mechanisms
4) funding channels
5) needs, crisis, vulnerability
6) capacity (what resources governments allocate to crises within their own countries)
7) reference tables on poverty, risk and vulnerability.
www.globalhumanitarianassistance.org/data-guides
We provide guidance on data sources and methodologies, and offer a range of simple visual tools that help to explain financing in humanitarian crises.
Helpdesk
We have a free, friendly helpdesk, that provides support in using and applying the data. We respond to information and data requests from anyone working on humanitarian issues including donors, NGOs, UN agencies and academics. We receive a wide variety of requests relating to data, methodologies and humanitarian information.
We regularly engage with governments, NGOs, civil society organisations, UN agencies and other members of the humanitarian community, often participating in discussion panels and presenting at meetings and events.
We believe in aid transparency and are committed to making information on financing in humanitarian crises easier to access, understand and use. In June 2013, GHA, the International Aid Transparency Initiative (IATI) and UN OCHA FTS began working to make the IATI standard fit for humanitarian purposes and, ultimately, to improve the reporting of humanitarian assistance. The consortium hosted a multi-stakeholder workshop in November 2013 and is now working with a steering group to take the work forward in partnership with other initiatives.
The Global Humanitarian Assistance programme is funded by the governments of Sweden, the Netherlands, the United Kingdom and Canada.
THE NETHERLANDS
Foreign Affairs, Trade and Development Canada
Affaires étrangères, Commerce et Développement Canada
Development Initiatives is an independent organisation committed to ending poverty by 2030. We make data and information on poverty and resource flows transparent, accessible and useable. We help decision-makers use information to increase their impact for the poorest people in the most sustainable way.
As part of Development Initiatives, the Global Humanitarian Assistance (GHA) programme analyses resource flows to people living in humanitarian crises, promoting data transparency and access to information through our research and publications – including the annual GHA reports. This report is produced entirely independently. The data analysis, content and presentation are solely the work of Development Initiatives and are a representation of its opinions alone. For further details on the content of this report including communication with its authors, to ask questions or provide comments, please contact us by email ([email protected]) or visit our website at www.globalhumanitarianassistance.org
Relief
Resili
ence
Security
Information
Risk reduction
Development
Food insecurity
Remi
ttanc
es
Poverty
Domestic Humanitarian
assistance
Natural
disast
ers
Conflict
resourcesassistance
Global Humanitarian Assistance reports use the latest data to present the most comprehensive assessment of the international financing at work in humanitarian situations. This report answers questions about the way that the world finances response to crisis and vulnerability: How much humanitarian assistance is there? Is it enough? Who provides it? Where does it go? How does it get there? It also highlights other resources that are important to people in crises, such as domestic government spending, remittances, foreign direct investment, official development assistance, and risk and climate financing. Transparent and reliable information, as provided by the Global Humanitarian Assistance Report 2014, is essential for all those working to address humanitarian crisis and vulnerability.
please visit our website at www.globalhumanitarianassistance.org to read previous reports and to download and share this one. To communicate with the authors, ask questions or provide comments, please contact us by email ([email protected]). We welcome your feedback.
UK office
Development Initiatives, North Quay House Quay Side, Temple Back, Bristol, BS1 6FL, UK
T: +44 (0) 1179 272 505
Kenya office
Development Initiatives, Shelter Afrique Building, 4th Floor Mamlaka Road, Nairobi, PO Box 102802-00101, Kenya T: +254 (0) 20 272 5346
Development Research and Training, Uganda
Development Research and Training (DRT), Ggaba Road Mutesasira Zone, Kansanga, Kampala, PO Box 22459, Uganda T: +256 (0) 312 – 263629/30