A PwC IPO Centre publication
Global IPO WatchQ4 2018PwC provides independent guidance to companies in the process of going public and to already listed companies in assessing their position in the equity capital markets.
David Ethridge
Derek Thomson
Kennedy Liu
Geoffrey Tang
Jan-Willem de Groot (author)
Martin Coenen
Ross Hunter
Nadja Picard
Basis of preparationThe Global IPO Watch analyses IPO and FO trends on a quarterly basis, both at a global and regional level. It is based on data extracted from Dealogic, whereby only transactions with a minimum of $5 million money raised have been included. Transaction proceeds include the overallotment option (if exercised). The data excludes PIPO’s and transactions on Over-The-Counter exchanges. In case IPOs or FOs take place on two or more exchanges, the full amount of money raised is attributed to all exchanges. The same applies to countries and regions. This does not apply to two exchanges within the same country or two countries within the same region. Country indicates the company’s country of domicile. Industry classification is based on the FTSE Russell Industry Classification Benchmark. Index performance is based on pricing data extracted from Bloomberg.
PwC
IPO and FO highlights
Q4 2018Global IPO Watch
3
The largest IPO of the year took place in Japan,
as Japanese telco SoftBank raised $21.3bn. It is
the 4th largest IPO in history and could become
2nd if the greenshoe is exercised
5German IPO proceeds were highest in
EMEA following the jumbo IPOs of Siemens
Healthineers, Knorr-Bremse and DWS
3
Cross-border IPO activity accounted
for 29% of proceeds and 26% of the
number of transactions in the US
1
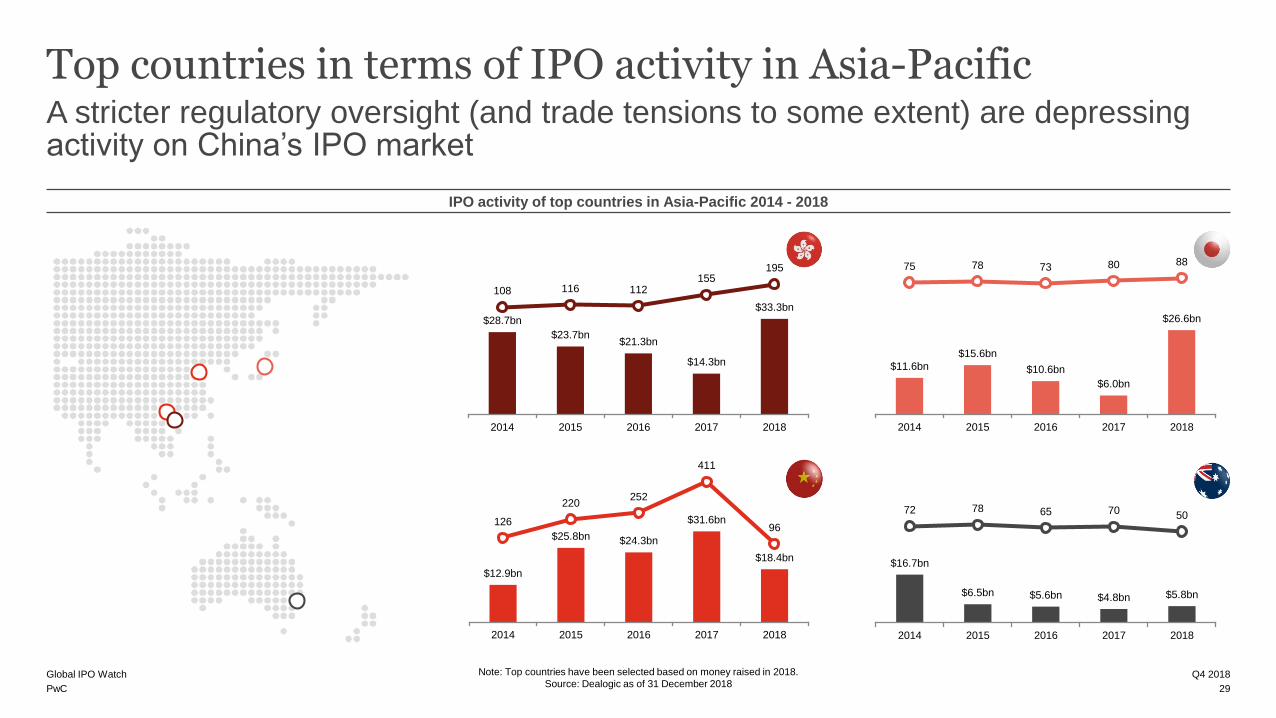
Due to stricter regulatory
oversight IPO proceeds in
China fell by 42%, and the
number of IPOs by 77%
10
The largest FO of the year was
undertaken by the Agricultural
Bank of China, as it raised $15.0bn
on the Shanghai Stock Exchange
4
11 A strong year for Australian IPOs
means the country has the fourth
highest proceeds in Asia-Pacific
Mexico’s IPO market had
its best year ever, as 24
IPOs raised $9.5bn
6
Kazakhstan successfully
executed the first deal in
their privatisation pipeline
and launched the Astana
International Financial
Centre with the intention
of making it a regional hub
9
When Dutch payments
processing firm Adyen went
public in June, the stock
jumped 110% intraday
above the offer price, giving
the company a valuation of
€15.5bn
Despite three Brazilian
companies opting for a
listing in the US in 2018,
IPO proceeds in Brazil were
third highest in the
Americas
7
8
London has seen a
pause in IPO activity in
2018 largely due to
Brexit and high market
volatility, however it
remained EMEA’s most
active market by IPO
volumes
2
PwC
Global money raised via IPOs and FOs
Q4 2018Global IPO Watch
4
Global money raised via IPOs and FOs (10-year overview) Top countries 2018
As a result of a few jumbo IPOs, 2018 IPO proceeds outpaced those in recent years even as volatility returned on equity markets
Note: Top countries have been selected based on money raised in 2018.
Source: Dealogic as of 31 December 2018
$841.8bn
$642.0bn
$479.9bn $509.3bn$588.2bn $613.5bn
$685.8bn
$551.1bn$620.4bn
$458.9bn
3,554 3,5622,902
2,5083,046 3,178 3,323 3,186 3,567
2,801
2009 2010 2011 2012 2013 2014 2015 2016 2017 2018
$121.2bn
$299.1bn
$178.8bn$142.5bn
$195.6bn
$274.3bn
$206.9bn
$142.5bn
$209.1bn $221.6bn
502
1,2581,041
728865
1,167 1,1851,013
1,521
1,177
2009 2010 2011 2012 2013 2014 2015 2016 2017 2018
FO
mo
ne
y r
ais
ed
& #
of
de
als
IPO
mo
ne
y r
ais
ed
& #
of
de
als
United States; 28%
Hong Kong; 15%
Japan; 12%China; 8%
Germany; 6%
Other; 31%
United States, 36%
China, 11%United Kingdom, 8%
Hong Kong, 7%
Australia, 5%
Other, 34%
PwC
2016 2017 2018 Q4 2016 Q4 2017 Q4 2018
IPO activity
Number of IPOs 1,013 1,521 1,177 373 439 284
% sponsor-backed 9.7% 9.3% 7.6% 7.2% 9.8% 3.5%
Money raised $142.5bn $209.1bn $221.6bn $54.5bn $67.7bn $56.1bn
% sponsor-backed 22.9% 22.7% 14.1% 19.8% 21.1% 5.4%
Advanced metrics
Free float % 31.3% 31.9% 32.2% 30.1% 31.5% 31.3%
Overallotment exercised (%)1 25.3% 25.2% 31.5% 19.6% 26.3% 24.5%
% secondary shares 15.1% 14.6% 13.6% 13.2% 17.6% 11.6%
FO activity
Number of FOs 3,186 3,567 2,801 868 1,008 527
Money raised $551.1bn $620.4bn $458.9bn $126.1bn $144.5bn $68.4bn
Overview of global IPO and FO activity
Q4 2018Global IPO Watch
5
• In Q4 2018, 284 IPOs raised $56.1bn. This
represents a decrease of 17% in terms of proceeds
and a 35% drop in the number of deals compared to
last year. For the year as a whole, IPO proceeds
increased by 6% even as the number of transactions
fell by 23%.
• Pricing was more volatile in 2018, as the share of
transactions pricing within their initial pricing range
dropped to a multi-year low.
• The post-IPO performance of 2018 IPOs is lower
than in 2017 as equity markets fell and the share of
historically outperforming Chinese IPOs dropped.
Global IPO and FO activity
IPO pricing dynamics Post-IPO performance (median) Global indices
The last few months of 2018 proved to be poor for equity markets due to political instability and higher interest rates in the US
1
2
1
2
3
3
2017 2018
1) Overallotment exercised (%) presents the percentage of IPOs in which the overallotment option has been exercised (either fully or partially).
Note: IPOs are classified as ‘In Range’ if the IPO is priced in the middle 50% of the price range. The top and bottom 25% are classified as ‘Top of Range’ and ‘Bottom of Range’.
Source: Dealogic, Bloomberg as of 31 December 2018
75
100
125
150
175
Jan-16 Jul-16 Jan-17 Jul-17 Jan-18 Jul-18
FTSE 100 Hang Seng S&P 500
16.3%
4.5%
17.7%
3.5%
20.0%
2.9%
24.4%
1.5%
-2.3%-3.3%
1-Day 1-Week 1-Month 3-Month Current
7% 6% 7%
14% 14% 20%
51% 53% 47%
24% 22% 21%
3% 4% 5%
2016 2017 2018
Below range Bottom of range In range Top of range Above range
PwC
Pricing date Issuer nameIssuer
countrySector Exchange Filing range
Offer
priceDeal Type
Money
raised
Secondary
shares (%)
Performance
1-day 1-month Current
4-Jul-18 Agricultural Bank of China Financials Shanghai SE N/A 3.97 FO - Cash Placing $15.0bn 0.0% -15.4% -11.1% -2.0%
22-Mar-18 Tencent Technology HKEX 439.40 - 439.40 405.00 FO - Accelerated Bookbuild $9.8bn 100.0% 3.7% -1.2% -20.2%
20-Jun-18 Bayer Health Care Deutsche Börse 81.00 - 81.00 81.00 FO - Rights Offer $7.0bn 0.0% 19.0% 13.6% -5.5%
10-Apr-18 Hilton Worldwide Consumer Services NYSE 77.51 - 77.51 73.00 FO - Accelerated Bookbuild $4.8bn 100.0% 9.1% 13.4% 10.7%
11-Sep-18 Yahoo Japan Technology Tokyo SE 353.00 - 360.00 354.00 FO - Accelerated Bookbuild $4.3bn 100.0% 2.5% N/A 15.5%
5-Jun-18 Royal Bank of Scotland Financials LSE 2.81 - 2.81 2.71 FO - Accelerated Bookbuild $3.3bn 100.0% -1.9% -7.6% -7.8%
8-May-18 Canadian Natural Resources Oil & Gas NYSE 35.11 - 35.11 34.10 FO - Bought Deal $3.3bn 100.0% 0.5% -0.6% -4.2%
4-Jan-18 Sempra Energy Utilities NYSE 105.35 - 105.35 107.00 FO - Accelerated Bookbuild $2.9bn 0.0% 1.4% -1.3% 6.3%
1-May-18 Centene Health Care NYSE 110.17 - 110.17 107.50 FO - Accelerated Bookbuild $2.9bn 0.0% 6.3% 9.4% 34.7%
18-Apr-18 Renesas Electronics Technology Tokyo SE 987.00 - 987.00 1,083 FO - Fully Marketed $2.7bn 100.0% 3.4% -2.0% -34.4%
Leading transactions 2018
Q4 2018Global IPO Watch
6
Top 10 largest IPOs 2018
SoftBank’s IPO was the largest of the year with proceeds of $21.3bn, and is potentially the second largest in history (if the overallotment option is exercised)
Top 10 largest FOs 2018
Pricing date Issuer nameIssuer
countrySector Exchange Filing range
Offer
pricePricing
Money
raised
Free
float
Secondary
shares (%)
Performance
1-day 1-month Current
10-Dec-18 SoftBank Telecommunications Tokyo SE 1,500.00 - 1,500.00 1,500.00 In range $21.3bn 33.5% 100.0% -14.5% N/A -9.5%
1-Aug-18 China Tower Technology HKEX 1.26 - 1.58 1.26 Bottom of range $7.5bn 27.1% 0.0% 0.0% -8.7% 17.5%
29-Jun-18 Xiaomi Technology HKEX 17.00 - 22.00 17.00 Bottom of range $5.4bn 11.2% 34.2% -1.2% 0.8% -24.0%
15-Mar-18 Siemens Healthineers Health Care Deutsche Börse 26.00 - 31.00 28.00 In range $5.2bn 15.0% 100.0% 7.9% 16.2% 30.5%
10-Oct-18 Knorr-Bremse Consumer Goods Deutsche Börse 72.00 - 87.00 80.00 In range $4.4bn 29.8% 100.0% 2.1% 5.2% -1.7%
23-May-18 Foxconn Industrial Internet Technology Shanghai SE N/A 13.77 N/A $4.3bn 10.0% 0.0% 44.0% 25.1% -15.8%
13-Sep-18 Meituan Dianping Consumer Services HKEX 60.00 - 72.00 69.00 In range $4.2bn 8.7% 0.0% 5.3% -20.3% -36.4%
9-May-18 AXA Equitable Financials NYSE 24.00 - 27.00 20.00 Below range $3.2bn 28.1% 100.0% 1.7% 5.3% -16.9%
14-Sep-18 Fideicomiso CIB/3057 Financials Mexican SE 1,910.20 - 1,910.20 1,910.20 In range $3.0bn N/A 0.0% N/A N/A N/A
23-Jan-18 PagSeguro Digital Industrials NYSE 17.50 - 20.50 21.50 Above range $2.6bn 38.0% 46.3% 35.8% 50.6% -12.9%
Note: IPOs are classified as ‘In Range’ if the IPO is priced in the middle 50% of the price range. The top and bottom 25% are classified as ‘Top of Range’ and ‘Bottom of Range’.
Source: Dealogic, Bloomberg as of 31 December 2018
PwC
IPO and FO activity per region
Q4 2018Global IPO Watch
7
Americas
Asia-Pacific was the most active region for IPOs, and in terms of FO activity, all three regions recorded a fall in 2018, both in terms of proceeds and deal numbers
EMEA Asia-Pacific
$109.5bn
$50.9bn
$30.8bn
$67.4bn$75.3bn
346248
149
270 295
2014 2015 2016 2017 2018
$230.3bn$243.3bn
$219.7bn $214.8bn$188.2bn
1,144 1,054 1,0721,238
1,025
2014 2015 2016 2017 2018
$81.7bn$71.7bn
$35.7bn
$55.4bn$47.3bn
279 269181
300235
2014 2015 2016 2017 2018
$204.5bn$190.8bn
$119.9bn
$189.9bn
$108.7bn
737 808 755945
749
2014 2015 2016 2017 2018
$83.1bn $84.3bn$77.3bn
$86.2bn$99.1bn
542668 684
951
649
2014 2015 2016 2017 2018
$182.4bn
$259.7bn
$214.8bn $216.8bn
$162.4bn
1,325 1,478 1,367 1,394
1,038
2014 2015 2016 2017 2018
Source: Dealogic, Bloomberg as of 31 December 2018
FO
mo
ne
y r
ais
ed
& #
of
de
als
IPO
mo
ne
y r
ais
ed
& #
of
de
als
PwC
Top exchanges globally based on money raised in 2018
Q4 2018Global IPO Watch
8
Money raised and number of IPOs per Exchange 2016-2018
Despite a 23% drop in the number of IPOs globally in 2018, three out of the five most active exchanges recorded an increase in the number of transactions
Top Exchanges 2018
Money raised and number of FOs per Exchange 2016-2018 Top Exchanges 2018
Japan Exchange
GroupLSE GroupNYSEHKEX
NASDAQ
(Global)
NYSE Shanghai SENASDAQ
(Global)HKEXLSE Group
Note: LSE Group includes Borsa Italiana.
Source: Dealogic, as of 31 December 2018
$21bn $21bn
$34bn
$21bn$14bn
$33bn
$15bn
$35bn $32bn
$11bn$6bn
$27bn
$9bn
$21bn$15bn
131
184 210
112 155
195
38
88 71 72 80 88 59
107 94
2016 2017 2018 2016 2017 2018 2016 2017 2018 2016 2017 2018 2016 2017 2018
$118bn $115bn$104bn
$73bn $75bn $73bn
$40bn$55bn
$38bn$20bn $27bn $30bn
$60bn$50bn
$30bn
348 375 269
527 621 603
313 373
318 246 272
168 150 99 49
2016 2017 2018 2016 2017 2018 2016 2017 2018 2016 2017 2018 2016 2017 2018
NASDAQ (Global), 15%
HKEX, 15%
NYSE, 14%
Japan Exchange Group, 12%
LSE Group, 7%
Deutsche Börse, 6%
Shanghai SE, 5%
Other, 26%
NYSE, 23%
NASDAQ (Global), 16%
LSE Group, 8%
HKEX, 7%Shanghai SE, 7%
ASX, 5%
Japan Exchange Group, 5%
Other, 30%
PwC
Global IPO and FO activity per sector
Q4 2018Global IPO Watch
9
Money raised and number of IPOs and FOs per sector 2016 - 2018
The Technology sector ends 2018 with the 2nd highest IPO proceeds, with 2019 potentially being the year of the 'unicorn' with some major deals in the US pipeline
IndustrialsBasic Materials Health Care TechnologyConsumer Goods Financials Oil & GasConsumer Services Telecommunication Utilities
2.9 9.3
4.5 15.1
24.4 19.2 15.2
26.2 24.6
49.6
67.1 65.3
14.2 13.3 21.4 23.2
35.2 27.1
4.5 10.3
4.6 7.5 17.5
30.7
0.5 1.6
21.9
9.9 4.0 2.3
59101
53
136200
120 102155 137
199
309 321
120157 154
236
376
214
24 36 16
120154 133
2 8 10 15 24 19
'16 '17 '18 '16 '17 '18 '16 '17 '18 '16 '17 '18 '16 '17 '18 '16 '17 '18 '16 '17 '18 '16 '17 '18 '16 '17 '18 '16 '17 '18
51.1 51.0 30.5
48.4 46.7 31.5
54.0 50.9 45.8
118.3
208.5
127.1
45.3 54.3 64.2 94.2 101.7
63.2 74.4
41.0 25.4 31.0 32.6 42.8
6.7 9.7 4.2 27.9 24.0 24.3
369 388289 303 297
210 274 333251
635
851
621448 524 549 540 561
408270 224 167
247 290 22537 37 22 63 62 59
'16 '17 '18 '16 '17 '18 '16 '17 '18 '16 '17 '18 '16 '17 '18 '16 '17 '18 '16 '17 '18 '16 '17 '18 '16 '17 '18 '16 '17 '18
Note: Financials include Closed-End Funds and Real Estate.
Source: Dealogic, as of 31 December 2018
FO
mo
ne
y r
ais
ed
& #
of
de
als
IPO
mo
ne
y r
ais
ed
& #
of
de
als
PwC
Pricing
dateIssuer name Exchange Pricing
Money
raised
Performance
1-day 1-month Current
28-Sep-18 SIG Combibloc SIX Swiss Exchange In range $1.8bn 9.3% 0.0% -7.0%
18-Jan-18 ADT NYSE Below range $1.5bn -11.5% -17.3% -57.1%
3-Oct-18 Aston Martin Lagonda Global LSE In range $1.4bn -4.7% -18.4% -35.6%
12-Jun-18 Adyen Euronext Amsterdam Top of range $1.1bn 89.6% 141.3% 97.9%
20-Sep-18 Farfetch NYSE Above range $1.0bn 42.3% 5.0% -11.5%
23-May-18 GreenSky NASDAQ Top of range $1.0bn 1.6% 5.0% -58.4%
18-Sep-18 Haidilao International HKEx Top of range $1.0bn 0.1% -6.6% -3.6%
1-Aug-18 Cushman & Wakefield NYSE In range $0.9bn 4.8% 3.9% -14.9%
24-Jan-18 Gates Industrial NYSE In range $0.8bn -2.6% -10.2% -30.3%
18-Jan-18 Americold Realty Trust NYSE Top of range $0.8bn 11.1% 12.4% 59.6%
Financial sponsor-backed IPO activity globally
Q4 2018Global IPO Watch
10
FS-backed IPO activity is subdued, falling both in absolute terms and as a share of total IPO activity across all regions
FS-backed activity Americas FS-backed activity EMEA FS-backed activity Asia-Pacific
Top 10 largest FS-backed IPOs 2018 globally Global FS-backed IPOs (by money raised)
Sponsor-backed;
23%
Not Sponsor-backed;
77%
Sponsor-backed;
14%
Not Sponsor-backed;
86% 89 (8%) sponsor-backed IPOs vs
1,088 (92%) non-sponsor-backed
IPOs
142 (9%) sponsor-backed IPOs vs
1,379 (91%) non-sponsor-backed
IPOs
2017 2018
$35.8bn
$15.6bn
$11.5bn
$24.8bn
$18.6bn
96
52
34
67 50
2014 2015 2016 2017 2018
$30.7bn $30.7bn
$16.3bn $15.5bn
$9.7bn
67 67
40 51
26
2014 2015 2016 2017 2018
$17.0bn$14.2bn
$4.8bn$7.2bn
$3.0bn
48 43
24 24 13
2014 2015 2016 2017 2018
Note: Financial sponsor-backed has been abbreviated to FS-backed for practical sake. IPOs are classified as ‘In Range’ if the IPO is priced in the middle 50% of the price range. The top and
bottom 25% are classified as ‘Top of Range’ and ‘Bottom of Range’.
Source: Dealogic, as of 31 December 2018
PwC
Volatility versus IPO activity
Q4 2018Global IPO Watch
11
Volatility reached a multi-year high in Q4 2018, due to tightening monetary policy combined with trade tensions and political uncertainty
Money raised via IPOs versus volatility
Number of IPOs versus volatility
Source: Dealogic, Bloomberg as of 31 December 2018
13.614.8 14.4 14.2 14.8
12.7 13.0
16.0 16.6
13.7
19.417.0
20.5
15.613.2 14.0
11.7 11.5 10.9 10.3
17.215.3
12.9
21.2
$0bn
$25bn
$50bn
$75bn
$100bn
Q1 Q2 Q3 Q4 Q1 Q2 Q3 Q4 Q1 Q2 Q3 Q4 Q1 Q2 Q3 Q4 Q1 Q2 Q3 Q4 Q1 Q2 Q3 Q4
2013 2014 2015 2016 2017 2018
Global money raised via IPOs VIX (average per quarter)
13.614.8 14.4 14.2 14.8
12.7 13.0
16.0 16.6
13.7
19.417.0
20.5
15.613.2 14.0
11.7 11.5 10.9 10.3
17.215.3
12.9
21.2
-
100
200
300
400
500
Q1 Q2 Q3 Q4 Q1 Q2 Q3 Q4 Q1 Q2 Q3 Q4 Q1 Q2 Q3 Q4 Q1 Q2 Q3 Q4 Q1 Q2 Q3 Q4
2013 2014 2015 2016 2017 2018
Number of IPOs globally VIX (average per quarter)
PwC
Money raised via IPOs and FOs in the Americas
Q4 2018Global IPO Watch
13
Top countries 2018
IPO and FO activity diverged in 2018, both in terms of proceeds and the number of transactions
Money raised via IPOs and FOs in the Americas (10-year overview)
$33.3bn$61.2bn $54.0bn $63.9bn
$83.1bn$105.8bn
$43.8bn$26.8bn
$54.9bn $63.2bn$14.1bn
$11.8bn$7.0bn
$13.6bn
$14.4bn
$3.7bn
$7.1bn
$4.3bn
$14.2bn$12.2bn
116
284 255 231322 346
248
149
270 295
2009 2010 2011 2012 2013 2014 2015 2016 2017 2018
North America Latin America Number of IPO's
$291.4bn $257.1bn$184.6bn
$223.3bn $230.9bn $216.0bn $240.8bn $211.7bn $202.3bn $181.4bn
$16.7bn $87.4bn
$24.1bn$14.0bn $23.5bn
$18.3bn$7.9bn
$8.1bn $13.3bn$6.8bn
1,383 1,4691,237
1,032 1,162 1,144 1,054 1,0721,238
1,025
2009 2010 2011 2012 2013 2014 2015 2016 2017 2018
North America Latin America Number of FO's
Note: Top countries have been selected based on money raised in 2018.
Source: Dealogic as of 31 December 2018
United States, 82%
Mexico, 13%
Brazil, 3%Other, 3%
United States, 89%
Canada, 8%Other, 3%
PwC
2016 2017 2018 Q4 2016 Q4 2017 Q4 2018
IPO activity
Number of IPOs 149 270 295 48 85 59
% sponsor-backed 22.8% 24.8% 16.9% 22.9% 18.8% 10.2%
Money raised $30.8bn $67.4bn $75.3bn $11.6bn $20.0bn $11.2bn
% sponsor-backed 37.2% 36.7% 24.7% 45.1% 18.7% 11.9%
Advanced metrics
Free float % 33.6% 37.2% 36.8% 34.7% 35.5% 39.9%
Overallotment exercised (%)1 72.8% 75.4% 72.6% 68.4% 75.0% 66.0%
% secondary shares 8.2% 10.2% 5.9% 8.9% 12.3% 3.2%
FO activity
Number of FOs 1,072 1,238 1,025 300 316 187
Money raised $219.7bn $214.8bn $188.2bn $48.8bn $44.6bn $30.0bn
3.1%1.6%
2.6%0.6%
3.5%2.0%
4.3%
1.4%
-10.1%
-0.3%
1-Day 1-Week 1-Month 3-Month Current
Overview of IPO and FO activity in the Americas
Q4 2018Global IPO Watch
14
• In Q4 2018, 59 IPOs raised $11.2bn. This represents
a decrease of 44% in terms of proceeds and 31% in
the number of deals compared to last year. For the
year as a whole however, IPO proceeds increased by
12% and the number of deals by 9%.
• The share of IPOs pricing at the bottom or below their
initial pricing range has decreased in the Americas, in
a sign of continued investor appetite.
• Despite being negative, the current post-IPO
performance for 2018 IPOs in the Americas is highest
of the three regions.
IPO and FO activity in the Americas
IPO pricing dynamics Post-IPO performance (median) Global indices
The Americas experienced a weak fourth quarter in an otherwise good year
1
2
1
2
3
3
2017 2018
1) Overallotment exercised (%) presents the percentage of IPOs in which the overallotment option has been exercised (either fully or partially).
Note: IPOs are classified as ‘In Range’ if the IPO is priced in the middle 50% of the price range. The top and bottom 25% are classified as ‘Top of Range’ and ‘Bottom of Range’.
Source: Dealogic, Bloomberg as of 31 December 2018
75
100
125
150
175
Jan-16 Jul-16 Jan-17 Jul-17 Jan-18 Jul-18
Dow Jones NASDAQ 100 S&P 500
26% 19% 13%
11%14%
17%
40% 47%46%
12% 9% 11%
11% 11% 12%
2016 2017 2018
Below range Bottom of range In range Top of range Above range
PwC
Pricing date Issuer nameIssuer
countrySector Exchange Filing range
Offer
priceDeal Type
Money
raised
Secondary
shares (%)
Performance
1-day 1-month Current
10-Apr-18 Hilton Worldwide Consumer Services NYSE 77.51 - 77.51 73.00 FO - Accelerated Bookbuild $4.8bn 100.0% 9.1% 13.4% -1.6%
8-May-18 Canadian Natural Resources Oil & Gas NYSE 35.11 - 35.11 34.10 FO - Bought Deal $3.3bn 100.0% 0.5% -0.6% -29.2%
4-Jan-18 Sempra Energy Utilities NYSE 105.35 - 105.35 107.00 FO - Accelerated Bookbuild $2.9bn 0.0% 1.4% -1.3% 1.1%
1-May-18 Centene Health Care NYSE 110.17 - 110.17 107.50 FO - Accelerated Bookbuild $2.9bn 0.0% 6.3% 9.4% 7.3%
14-Nov-18 Baker Hughes a GE Oil & Gas NYSE 23.64 - 23.64 23.00 FO - Accelerated Bookbuild $2.3bn 100.0% 0.7% -4.2% -6.5%
25-Sep-18 CenterPoint Energy Utilities NYSE 27.81 - 27.81 27.25 FO - Accelerated Bookbuild $1.9bn 0.0% 0.0% 1.8% 3.6%
31-Jul-18 HDFC Bank Financials NYSE 109.65 - 109.65 104.00 FO - Accelerated Bookbuild $1.8bn 0.0% -0.3% -2.6% -0.4%
13-Aug-18 First Data Industrials NYSE 24.67 - 24.67 23.75 FO - Accelerated Bookbuild $1.7bn 100.0% 0.8% 8.4% -28.8%
8-May-18 PPL Utilities NYSE 27.45 - 27.45 27.00 FO - Bought Deal $1.7bn 0.0% 3.3% -4.5% 4.9%
13-Sep-18 International Flavors & Fragrances Basic Materials NYSE 128.65 - 128.65 130.25 FO - Accelerated Bookbuild $1.7bn 0.0% 5.4% 0.5% 3.1%
Pricing date Issuer nameIssuer
countrySector Exchange Filing range
Offer
pricePricing
Money
raised
Free
float
Secondary
shares (%)
Performance
1-day 1-month Current
9-May-18 AXA Equitable Financials NYSE 24.00 - 27.00 20.00 Below range $3.2bn 28.1% 100.0% 1.7% 5.3% -16.9%
14-Sep-18 Fideicomiso CIB/3057 Financials Mexican SE 1,910.20 - 1,910.20 1,910.20 In range $3.0bn N/A 0.0% N/A N/A N/A
23-Jan-18 PagSeguro Digital Industrials NYSE 17.50 - 20.50 21.50 Above range $2.6bn 38.0% 46.3% 35.8% 50.6% -12.9%
28-Mar-18 iQIYI Consumer Services NASDAQ 17.00 - 19.00 18.00 In range $2.4bn 19.0% 0.0% -13.6% -0.1% -17.4%
25-Jul-18 Pinduoduo Consumer Services NASDAQ 16.00 - 19.00 19.00 Top of range $1.7bn 8.3% 0.0% 40.5% -9.4% 18.1%
19-Sep-18 Elanco Animal Health Consumer Goods NYSE 20.00 - 23.00 24.00 Above range $1.7bn 20.3% 0.0% 50.0% 31.7% 31.4%
23-Mar-18 Fibra E - Grupo Aeroportuario1 Industrials Mexican SE 100.00 - 100.00 100.00 In range $1.5bn 15.4% 0.0% 0.0% 0.0% -7.0%
18-Jan-18 ADT Industrials NYSE 17.00 - 19.00 14.00 Below range $1.5bn 14.0% 0.0% -11.5% -17.3% -57.1%
24-Oct-18 StoneCo Industrials NASDAQ 21.00 - 23.00 24.00 Above range $1.4bn 21.4% 9.7% 30.6% -9.0% -23.2%
11-Sep-18 NIO Consumer Goods NYSE 6.25 - 8.25 6.26 Bottom of range $1.2bn 17.9% 0.0% 5.4% 14.7% 1.8%
Leading transactions 2018 in the Americas
Q4 2018Global IPO Watch
15
Top 10 largest IPOs 2018 in the Americas
The abundance of cross-border IPOs in the US remains high, accounting for 29% of proceeds and 26% of the number of IPOs
Top 10 largest FOs 2018 in the Americas
1) Fibra E – Grupo Aeroportuario de la Ciudad de Mexico
Note: IPOs are classified as ‘In Range’ if the IPO is priced in the middle 50% of the price range. The top and bottom 25% are classified as ‘Top of Range’ and ‘Bottom of Range’.
Source: Dealogic, Bloomberg as of 31 December 2018
PwC
IPO and FO activity per sector in the Americas
Q4 2018Global IPO Watch
16
Money raised and number of IPOs and FOs per sector 2016 - 2018
Financials accounted for 38% of proceeds 39% of the number of IPOs, primarily driven by a high number of SPACs listing in 2018
Note: Financials include Closed-End Funds and Real Estate.
Source: Dealogic, as of 31 December 2018
0.1 2.5
0.0 3.4 2.1
4.5 1.8
9.4 10.8 11.9
23.8 28.9
3.7 4.7 10.0
3.6 6.1
11.2
2.6
8.4
1.9 3.3
9.5 7.6
- - - 0.3 0.8 0.5
3 13 11 11 15 829 27
45
110 114
40 4479
11 18 18 9 17 8 19 26 303 2 3
'16 '17 '18 '16 '17 '18 '16 '17 '18 '16 '17 '18 '16 '17 '18 '16 '17 '18 '16 '17 '18 '16 '17 '18 '16 '17 '18 '16 '17 '18
16.2 12.9 6.5
11.3 12.3 9.8
20.9 24.8 26.0
41.0
56.8
43.1
26.0
37.4 40.2
13.8
26.1
15.0
60.2
28.6
14.4 13.7 9.6 12.5
1.1 0.7 0.6
15.5
5.5
20.1
125 13286
42 57 44 75 99 89
211289
197261
330 359
88 12479
178109
57 56 75 776 7 5 30 16 32
'16 '17 '18 '16 '17 '18 '16 '17 '18 '16 '17 '18 '16 '17 '18 '16 '17 '18 '16 '17 '18 '16 '17 '18 '16 '17 '18 '16 '17 '18
FO
mo
ne
y r
ais
ed
& #
of
de
als
IPO
mo
ne
y r
ais
ed
& #
of
de
als
IndustrialsBasic Materials Health Care TechnologyConsumer Goods Financials Oil & GasConsumer Services Telecommunication Utilities
PwC
Top countries in terms of IPO activity in the Americas
Q4 2018Global IPO Watch
17
IPO activity of top countries in the Americas 2014 - 2018
IPO activity in the US was highest since 2014, and in Mexico activity levels even reached an all-time record high
$100.5bn
$38.9bn
$26.1bn
$51.5bn
$61.6bn
302
189
122
211243
2014 2015 2016 2017 2018
$0.2bn $0.2bn $0.2bn$6.4bn
$2.0bn
1 1 111
3
2014 2015 2016 2017 2018
$3.5bn $6.9bn $3.6bn $6.4bn $9.5bn
1223
15 1824
2014 2015 2016 2017 2018
$5.4bn $4.9bn$0.7bn $4.3bn $2.0bn
3035
8
2920
2014 2015 2016 2017 2018
Note: Top countries have been selected based on money raised in 2018.
Source: Dealogic as of 31 December 2018
PwC
Money raised via IPOs and FOs in EMEA
Q4 2018Global IPO Watch
19
Top countries 2018
Germany took over the lead in terms of IPO proceeds, despite the United Kingdom continuing to dominate in terms of IPO numbers
Money raised via IPOs and FOs in EMEA (10-year overview)
Note: Top countries have been selected based on money raised in 2018.
Source: Dealogic as of 31 December 2018
$8.0bn$40.4bn $33.3bn
$15.9bn$37.2bn
$69.4bn $68.8bn
$33.4bn$48.1bn $43.7bn$2.5bn
$5.2bn$2.0bn
$2.1bn$3.3bn
$12.9bn $3.5bn
$2.4bn
$7.3bn $4.8bn
60
215167
101182
279 269181
300235
2009 2010 2011 2012 2013 2014 2015 2016 2017 2018
Europe Middle East & Africa Number of IPO's
$318.8bn
$135.2bn $132.4bn $115.1bn$174.2bn $192.4bn $179.1bn
$110.5bn$176.8bn
$97.4bn
$9.9bn
$12.4bn $10.0bn$9.3bn
$6.8bn$13.9bn $12.2bn
$10.3bn
$13.3bn
$11.4bn
817 774628 521
637 737 808 755945
749
2009 2010 2011 2012 2013 2014 2015 2016 2017 2018
Europe Middle East & Africa Number of FO's
Germany; 28%
United Kingdom; 26%Switzerland; 7%
Italy; 5%
The Netherlands; 4%
Other; 29%
United Kingdom, 32%
Germany, 18%France, 8%
Sweden, 4%
Switzerland, 4%
Other, 34%
PwC
2016 2017 2018 Q4 2016 Q4 2017 Q4 2018
IPO activity
Number of IPOs 181 300 235 59 93 53
% sponsor-backed 22.1% 17.0% 11.1% 11.9% 20.4% 5.7%
Money raised $35.7bn $55.4bn $47.3bn $12.6bn $18.6bn $12.9bn
% sponsor-backed 45.6% 28.0% 20.5% 27.5% 40.3% 11.7%
Advanced metrics
Free float % 38.9% 43.5% 40.5% 36.1% 39.5% 35.1%
Overallotment exercised (%)1 29.5% 26.4% 25.6% 21.1% 23.0% 21.7%
% secondary shares 36.8% 32.9% 29.2% 33.4% 35.0% 26.4%
FO activity
Number of FOs 755 945 749 228 261 157
Money raised $119.9bn $189.9bn $108.7bn $29.8bn $33.8bn $16.4bn
Overview of IPO and FO activity in EMEA
Q4 2018Global IPO Watch
20
• In Q4 2018, 53 IPOs raised $12.9bn. This represents
a drop of 31% in terms of proceeds and 43% in terms
of the number of deals compared to last year. For the
year as a whole, IPO proceeds decreased by 15%
and the number of transactions by 22%.
• FO activity also suffered, as proceeds fell 43% and
the number of deals 21% in 2018.
• The share of IPOs pricing at the bottom or below their
initial pricing range was the highest in years.
• Post-IPO performance in EMEA was lowest of the
three regions.
IPO and FO activity in EMEA
IPO pricing dynamics Post-IPO performance (median) Global indices
Equity markets in EMEA suffered early-on from global geopolitical uncertainty and finished the year in negative territory
1
2
3
4
2017 2018
3.0%2.0% 2.0%2.0% 1.7%1.5% 2.4%0.0%
-17.6%
-5.3%
1-Day 1-Week 1-Month 3-Month Current
1) Overallotment exercised (%) presents the percentage of IPOs in which the overallotment option has been exercised (either fully or partially).
Note: IPOs are classified as ‘In Range’ if the IPO is priced in the middle 50% of the price range. The top and bottom 25% are classified as ‘Top of Range’ and ‘Bottom of Range’.
Source: Dealogic, Bloomberg as of 31 December 2018
4
75
100
125
150
Jan-16 Jul-16 Jan-17 Jul-17 Jan-18 Jul-18
CAC 40 DAX FTSE 100
1
2
3
2% 3% 8%
24% 18%20%
65% 68%66%
10% 10% 6%2% 1%
2016 2017 2018
Below range Bottom of range In range Top of range Above range
PwC
Pricing date Issuer nameIssuer
countrySector Exchange Filing range
Offer
priceDeal Type
Money
raised
Secondary
shares (%)
Performance
1-day 1-month Current
20-Jun-18 Bayer Health Care Deutsche Börse 81.00 - 81.00 81.00 FO - Rights Offer $7.0bn 0.0% 19.0% 13.6% -25.2%
5-Jun-18 Royal Bank of Scotland Financials LSE 2.81 - 2.81 2.71 FO - Accelerated Bookbuild $3.3bn 100.0% -1.9% -7.6% -20.0%
4-May-18 Covestro Basic Materials Deutsche Börse 76.48 - 76.48 75.50 FO - Accelerated Bookbuild $2.6bn 100.0% -1.3% 4.6% -42.8%
20-Feb-18 Cineworld Consumer Services LSE 1.57 - 1.57 1.57 FO – ABB (Rump) ; RO $2.5bn 0.0% 53.4% 51.7% 67.6%
11-Jan-18 Covestro Basic Materials Deutsche Börse 88.46 - 88.46 86.25 FO - Accelerated Bookbuild $2.2bn 100.0% 2.6% -3.0% -49.9%
13-Sep-18 Adyen Industrials Euronext Amsterdam 738.20 - 738.20 670.00 FO - Accelerated Bookbuild $1.9bn 100.0% -3.0% -14.4% -29.1%
2-Oct-18 Safran Industrials Euronext Paris 120.40 - 120.40 119.65 FO - Accelerated Bookbuild $1.4bn 100.0% -1.0% -5.5% -11.9%
11-Jun-18 Dubai Islamic Bank Financials Dubai FM 3.11 - 3.11 3.11 FO - Rights Offer $1.4bn 0.0% 66.9% 59.5% 60.8%
25-Jul-18 DS Smith Industrials LSE 3.50 - 3.50 3.50 FO – ABB (Rump) ; RO $1.4bn 0.0% 43.7% 45.1% -14.5%
10-Jul-18 Phoenix Group Financials LSE 5.18 - 5.18 5.18 FO – ABB (Rump) ; RO $1.3bn 0.0% 30.6% 34.3% 11.1%
Pricing date Issuer nameIssuer
countrySector Exchange Filing range
Offer
pricePricing
Money
raised
Free
float
Secondary
shares (%)
Performance
1-day 1-month Current
15-Mar-18 Siemens Healthineers Health Care Deutsche Börse 26.00 - 31.00 28.00 In range $5.2bn 15.0% 100.0% 7.9% 16.2% 30.5%
10-Oct-18 Knorr-Bremse Consumer Goods Deutsche Börse 72.00 - 87.00 80.00 In range $4.4bn 29.8% 100.0% 2.1% 5.2% -1.7%
28-Sep-18 SIG Combibloc Industrials SIX Swiss Exchange 10.50 - 13.50 11.25 In range $1.8bn 47.4% 20.5% 9.3% 0.0% -7.0%
22-Mar-18 DWS Financials Deutsche Börse 30.00 - 36.00 32.50 In range $1.6bn 20.5% 100.0% 1.8% -4.5% -28.1%
3-Oct-18 Aston Martin Lagonda Global Consumer Goods LSE 17.50 - 22.50 19.00 In range $1.4bn 25.1% 100.0% -4.7% -18.4% -35.6%
12-Jun-18 Adyen Industrials Euronext Amsterdam 220.00 - 240.00 240.00 Top of range $1.1bn 13.4% 100.0% 89.6% 141.3% 97.9%
17-Oct-18 Smithson Investment Trust Financials LSE 10.00 - 10.00 10.00 In range $1.1bn 0.0% 0.0% 2.0% 3.7% 0.0%
21-Mar-18 ELKEM Basic Materials Oslo Børs 29.00 - 35.00 29.00 Bottom of range $0.9bn 41.8% 19.2% -4.1% 7.2% -23.5%
3-May-18 CEVA Logistics Industrials SIX Swiss Exchange 27.50 - 52.50 27.50 Bottom of range $0.8bn 72.2% 0.0% -5.8% -7.9% 8.6%
4-May-18 Vivo Energy Consumer Services JSE ; LSE 1.55 - 1.80 1.65 In range $0.8bn 30.5% 100.0% 4.6% 3.0% -24.2%
Leading transactions 2018 in EMEA
Q4 2018Global IPO Watch
21
Top 10 largest IPOs 2018 in EMEA
Knorr-Bremse, the German manufacturer of braking systems, undertook the largest IPO of Q4 2018 in EMEA, raising over $4.4bn on Deutsche Börse
Top 10 largest FOs 2018 in EMEA
Note: IPOs are classified as ‘In Range’ if the IPO is priced in the middle 50% of the price range. The top and bottom 25% are classified as ‘Top of Range’ and ‘Bottom of Range’.
Source: Dealogic, Bloomberg as of 31 December 2018
PwC
IPO and FO activity per sector in EMEA
Q4 2018Global IPO Watch
22
Money raised and number of IPOs and FOs per sector 2016 - 2018
As the Health Care sector accounted for the largest IPO and FO of the year in EMEA, proceeds for both markets displayed a strong uptick
0.2 1.7 1.6 2.9
8.6 7.5 4.4
7.6 3.2
7.5
19.2 17.0
3.2 2.8 6.8 7.5
9.7 6.9
1.0 1.4 0.6 0.3 2.2 2.1 0.5 1.5 0.3
8.2
0.7 1.4
4 8 523 29 22 22
3422
47
97 86
2537
1729
5140
7 10 318
29 30
2 3 3 4 2 7
'16 '17 '18 '16 '17 '18 '16 '17 '18 '16 '17 '18 '16 '17 '18 '16 '17 '18 '16 '17 '18 '16 '17 '18 '16 '17 '18 '16 '17 '18
12.6 10.5 9.4 9.6 12.4 8.0 10.3 11.6 12.5
39.4
93.0
35.2
7.2 11.0 12.4 24.1 24.0
17.9 8.5 5.2 4.8 4.8 5.9 4.4 1.1 3.7 2.4 2.4
12.8 1.6
50 59 40 56 71 56 70112
87
229282
210
95 114 101 123 140108
55 61 70 58 76 579 11 9 10 19 11
'16 '17 '18 '16 '17 '18 '16 '17 '18 '16 '17 '18 '16 '17 '18 '16 '17 '18 '16 '17 '18 '16 '17 '18 '16 '17 '18 '16 '17 '18
Note: Financials include Closed-End Funds and Real Estate.
Source: Dealogic, as of 31 December 2018
FO
mo
ne
y r
ais
ed
& #
of
de
als
IPO
mo
ne
y r
ais
ed
& #
of
de
als
IndustrialsBasic Materials Health Care TechnologyConsumer Goods Financials Oil & GasConsumer Services Telecommunication Utilities
PwC
Top countries in terms of IPO activity in EMEA
Q4 2018Global IPO Watch
23
IPO activity of top countries in EMEA 2014 - 2018
At $13.6bn, German IPO proceeds are at an 18-year high, driven by the jumbo IPOs of Knorr-Bremse, Siemens Healthineers and DWS
$4.7bn
$7.9bn$5.8bn
$3.2bn
$13.6bn
816
6 11 18
2014 2015 2016 2017 2018
$27.9bn
$19.8bn
$7.6bn
$14.8bn$12.7bn
112
74
52
8068
2014 2015 2016 2017 2018
$1.7bn $2.6bn$0.9bn
$4.6bn$3.5bn
6 2 3 4 6
2014 2015 2016 2017 2018
Note: Top countries have been selected based on money raised in 2018.
Source: Dealogic as of 31 December 2018
3.8 $6.2bn
$1.6bn
$6.2bn
$2.4bn
20 239
27 26
2014 2015 2016 2017 2018
PwC
Money raised via IPOs and FOs in Asia-Pacific
Q4 2018Global IPO Watch
25
Top countries 2018
Following the SoftBank IPO, Japan overtakes China in terms of IPO proceeds
Money raised via IPOs and FOs in Asia-Pacific (10-year overview)
$68.3bn
$175.3bn
$91.0bn$51.3bn $48.2bn
$66.2bn $77.8bn $71.5bn $81.5bn $93.3bn
$2.5bn
$8.0bn
$1.5bn
$1.5bn $10.2bn$17.0bn $6.5bn $5.8bn
$4.8bn$5.8bn
326
761620
397 363542
668 684
951
649
2009 2010 2011 2012 2013 2014 2015 2016 2017 2018
Asia Australasia Number of IPO's
$183.4bn $206.8bn
$115.1bn $135.1bn $140.5bn $160.1bn$218.2bn $197.4bn $194.7bn
$139.5bn
$63.5bn $23.6bn
$23.5bn$17.6bn $20.7bn
$22.3bn
$41.5bn$17.8bn $22.1bn
$22.9bn
1,381 1,3521,077 978
1,265 1,325 1,478 1,367 1,3941,038
2009 2010 2011 2012 2013 2014 2015 2016 2017 2018
Asia Australasia Number of FO's
Note: Top countries have been selected based on money raised in 2018.
Source: Dealogic as of 31 December 2018
Hong Kong; 34%
Japan; 27%
China; 19%
Australia; 6%
India; 5%
Other; 10%
China, 30%
Hong Kong, 19%Australia, 14%
Japan, 13%
South Korea, 7%
Other, 17%
PwC
2016 2017 2018 Q4 2016 Q4 2017 Q4 2018
IPO activity
Number of IPOs 684 951 649 266 261 172
% sponsor-backed 3.5% 2.5% 2.0% 3.4% 3.1% 0.6%
Money raised $77.3bn $86.2bn $99.1bn $30.2bn $29.1bn $32.0bn
% sponsor-backed 6.2% 8.4% 3.0% 6.9% 10.4% 0.6%
Advanced metrics
Free float % 28.9% 27.3% 27.5% 28.2% 27.8% 27.8%
Overallotment exercised (%)1 15.6% 12.6% 16.6% 12.2% 13.7% 13.0%
% secondary shares 10.9% 10.1% 11.5% 9.5% 13.1% 9.9%
FO activity
Number of FOs 1,367 1,394 1,038 342 438 184
Money raised $214.8bn $216.8bn $162.4bn $47.6bn $66.8bn $22.0bn
Overview of IPO and FO activity in Asia-Pacific
Q4 2018Global IPO Watch
26
• In Q4 2018, 172 IPOs raised $32.0bn, representing
an increase of 10% in terms of proceeds but a 34%
drop in the number of deals in 2018. Proceeds rose
mainly because of the jumbo SoftBank IPO. A large
privatisation wave in Vietnam can support IPO
activity in the region in the years to come.
• In terms of FOs, both proceeds and the number of
transactions fell in 2018.
• Indian stock indices shrugged off the global
downward trend, as the SENSEX closed the year in
positive territory.
IPO and FO activity in Asia-Pacific
IPO pricing dynamics Post-IPO performance (median) Global indices
In 2018 IPO proceeds rose by 15% whereas the number of deals was down by 32%
1
2
3
3
2017 2018
44.0%
10.4%
74.3%
8.9%
74.6%
8.1%
68.0%
6.0% 4.1%-3.5%
1-Day 1-Week 1-Month 3-Month Current
1) Overallotment exercised (%) presents the percentage of IPOs in which the overallotment option has been exercised (either fully or partially).
Note: IPOs are classified as ‘In Range’ if the IPO is priced in the middle 50% of the price range. The top and bottom 25% are classified as ‘Top of Range’ and ‘Bottom of Range’.
Source: Dealogic, Bloomberg as of 31 December 2018
75
100
125
150
175
Jan-16 Jul-16 Jan-17 Jul-17 Jan-18 Jul-18
Hang Seng Nikkei 225 SENSEX
1
2
3% 2% 3%13% 13%
21%
50% 50%40%
32% 33% 32%
2% 2% 3%
2016 2017 2018
Below range Bottom of range In range Top of range Above range
PwC
Pricing date Issuer nameIssuer
countrySector Exchange Filing range
Offer
priceDeal Type
Money
raised
Secondary
shares (%)
Performance
1-day 1-month Current
4-Jul-18 Agricultural Bank of China Financials Shanghai SE N/A 3.97 FO - Cash Placing $15.0bn 0.0% -15.4% -11.1% -9.3%
22-Mar-18 Tencent Holdings Technology HKEX 439.40 - 439.40 405.00 FO - Accelerated Bookbuild $9.8bn 100.0% 3.7% -1.2% -22.5%
11-Sep-18 Yahoo Japan Technology Tokyo SE 353.00 - 360.00 354.00 FO - Accelerated Bookbuild $4.3bn 100.0% 2.5% 10.2% -22.6%
18-Apr-18 Renesas Electronics Technology Tokyo SE 987.00 - 987.00 1,083.00 FO - Fully Marketed $2.7bn 100.0% 3.4% -2.0% -53.8%
5-Sep-18 Transurban Industrials ASX 10.80 - 10.80 10.80 FO - ABB (Rump); Cash; RO $2.6bn 0.0% 7.7% 1.5% 7.9%
6-Mar-18 Blackcow Food Consumer Goods Shenzhen SE N/A 16.70 FO - Cash Placing $2.4bn 0.0% -0.3% -9.2% -54.4%
4-Aug-18 Huatai Securities Financials Shanghai SE N/A 13.05 FO - Cash Placing $2.1bn 0.0% N/A 18.5% 24.1%
29-Jan-18 Shenwan Hongyuan Financials Shenzhen SE N/A 4.84 FO - Cash Placing $1.9bn 0.0% 13.2% 4.1% -15.9%
14-May-18 Digital Telecommunications1 Technology Thailand SE 13.60 - 13.90 13.90 FO – Guar. Pref. Allocation $1.7bn 0.0% 4.3% 5.0% 3.6%
12-Mar-18 Tata Consultancy Services Technology BSE ; NSE 2,872.00 - 2,925.00 2,872.00 FO - Accelerated Bookbuild $1.4bn 100.0% 0.7% 9.2% -33.8%
Pricing date Issuer nameIssuer
countrySector Exchange Filing range
Offer
pricePricing
Money
raised
Free
float
Secondary
shares (%)
Performance
1-day 1-month Current
10-Dec-18 SoftBank Telecommunications Tokyo SE 1,500.00 - 1,500.00 1,500.00 In range $21.3bn 33.5% 100.0% -14.5% N/A -9.5%
1-Aug-18 China Tower Technology HKEX 1.26 - 1.58 1.26 Bottom of range $7.5bn 27.1% 0.0% 0.0% -8.7% 17.5%
29-Jun-18 Xiaomi Technology HKEX 17.00 - 22.00 17.00 Bottom of range $5.4bn 11.2% 34.2% -1.2% 0.8% -24.0%
23-May-18 Foxconn Industrial Internet Technology Shanghai SE N/A 13.77 N/A $4.3bn 10.0% 0.0% 44.0% 25.1% -15.8%
13-Sep-18 Meituan Dianping Consumer Services HKEX 60.00 - 72.00 69.00 In range $4.2bn 8.7% 0.0% 5.3% -20.3% -36.4%
11-Jul-18 Viva Energy Oil & Gas ASX 2.50 - 2.65 2.50 Bottom of range $2.0bn 54.5% 100.0% 0.0% -2.8% -28.0%
19-Oct-18 Thailand Future Fund Industrials Thailand SE 10.00 - 10.00 10.00 In range $1.4bn 90.0% 0.0% 3.0% 1.0% 1.0%
7-May-18 Vinhomes Financials Ho Chi Minh SE 100,500 - 114,700 114,700 Top of range $1.3bn 10.0% 100.0% -3.7% 1.6% -36.0%
11-Jun-18 Mercari Technology Tokyo SE 2,700.00 - 3,000.00 3,000.00 Top of range $1.2bn 32.2% 55.4% 76.7% 46.3% -38.6%
26-Apr-18 Ping An HealthCare & Technology Consumer Services HKEX 50.80 - 54.80 54.80 Top of range $1.1bn 15.0% 0.0% 0.0% -18.5% -49.6%
Leading transactions 2018 in Asia-Pacific
Q4 2018Global IPO Watch
27
Top 10 largest IPOs 2018 in Asia-Pacific
The three largest global IPOs of the year took place in Asia-Pacific, and together accounted for 35% of IPO proceeds in the region
Top 10 largest FOs 2018 in Asia-Pacific
1) Digital Telecommunications Infrastructure Fund.
Note: IPOs are classified as ‘In Range’ if the IPO is priced in the middle 50% of the price range. The top and bottom 25% are classified as ‘Top of Range’ and ‘Bottom of Range’.
Source: Dealogic, Bloomberg as of 31 December 2018
PwC
IPO and FO activity per sector in Asia-Pacific
Q4 2018Global IPO Watch
28
Money raised and number of IPOs and FOs per sector 2016 - 2018
Industrials remains the most active sector in terms of number of IPOs, but a small number of Telecommunication IPOs raised most proceeds
2.6 5.1 2.9
8.8 13.7
7.3 9.0 9.2 10.6
30.1
24.2 19.5
7.2 5.8 4.6
12.1
19.4
8.9
0.9 0.4 2.2 5.2 5.8
21.1
- 0.1
21.6
1.3 2.5 0.4
5280
48102
160
84 72 92 88 107 102 121
55 76 58
196
307
156
8 9 5
84 9973
5 7 8 20 9
'16 '17 '18 '16 '17 '18 '16 '17 '18 '16 '17 '18 '16 '17 '18 '16 '17 '18 '16 '17 '18 '16 '17 '18 '16 '17 '18 '16 '17 '18
25.4 28.4
14.7
27.5 22.0
13.7 22.8
14.6 7.3
37.9
58.7 48.8
12.0 6.1
11.7
56.4 51.7
30.2
5.7 7.1 6.3 12.5
17.2 25.9
4.5 5.3 1.2 10.0 5.6 2.6
197 202168
206169
110 129 12275
195
280
215
92 82 90
330 298
221
39 55 43
134 14092
22 19 8 23 27 16
'16 '17 '18 '16 '17 '18 '16 '17 '18 '16 '17 '18 '16 '17 '18 '16 '17 '18 '16 '17 '18 '16 '17 '18 '16 '17 '18 '16 '17 '18
Note: Financials include Closed-End Funds and Real Estate.
Source: Dealogic, as of 31 December 2018
FO
mo
ne
y r
ais
ed
& #
of
de
als
IPO
mo
ne
y r
ais
ed
& #
of
de
als
IndustrialsBasic Materials Health Care TechnologyConsumer Goods Financials Oil & GasConsumer Services Telecommunication Utilities
PwC
Top countries in terms of IPO activity in Asia-Pacific
Q4 2018Global IPO Watch
29
IPO activity of top countries in Asia-Pacific 2014 - 2018
A stricter regulatory oversight (and trade tensions to some extent) are depressing activity on China’s IPO market
$28.7bn
$23.7bn$21.3bn
$14.3bn
$33.3bn
108 116 112155
195
2014 2015 2016 2017 2018
Note: Top countries have been selected based on money raised in 2018.
Source: Dealogic as of 31 December 2018
$11.6bn
$15.6bn
$10.6bn
$6.0bn
$26.6bn
75 78 73 80 88
2014 2015 2016 2017 2018
$12.9bn
$25.8bn $24.3bn
$31.6bn
$18.4bn
126
220252
411
96
2014 2015 2016 2017 2018
$16.7bn
$6.5bn $5.6bn $4.8bn $5.8bn
72 78 65 70 50
2014 2015 2016 2017 2018
pwc.com
Disclaimer
© 2019 PwC. All rights reserved. Not for further distribution without the permission of PwC. “PwC” refers to the network of member firms of PricewaterhouseCoopers
International Limited (PwCIL), or, as the context requires, individual member firms of the PwC network. Each member firm is a separate legal entity and does not act as
agent of PwCIL or any other member firm. PwCIL does not provide any services to clients. PwCIL is not responsible or liable for the acts or omissions of any of its
member firms nor can it control the exercise of their professional judgment or bind them in any way. No member firm is responsible or liable for the acts or omissions of
any other member firm nor can it control the exercise of another member firm’s professional judgment or bind another member f irm or PwCIL in any way.