University of Birmingham Global isoprene and monoterpene emissions under changing climate, vegetation, CO 2 and land use Hantson, Stijn; Knorr, Wolfgang; Schurgers, Guy; Pugh, Thomas; Arneth, Almut DOI: 10.1016/j.atmosenv.2017.02.010 License: Creative Commons: Attribution-NonCommercial-NoDerivs (CC BY-NC-ND) Document Version Peer reviewed version Citation for published version (Harvard): Hantson, S, Knorr, W, Schurgers, G, Pugh, T & Arneth, A 2017, 'Global isoprene and monoterpene emissions under changing climate, vegetation, CO 2 and land use', Atmospheric Environment, vol. 155, pp. 35-45. https://doi.org/10.1016/j.atmosenv.2017.02.010 Link to publication on Research at Birmingham portal General rights Unless a licence is specified above, all rights (including copyright and moral rights) in this document are retained by the authors and/or the copyright holders. The express permission of the copyright holder must be obtained for any use of this material other than for purposes permitted by law. • Users may freely distribute the URL that is used to identify this publication. • Users may download and/or print one copy of the publication from the University of Birmingham research portal for the purpose of private study or non-commercial research. • User may use extracts from the document in line with the concept of ‘fair dealing’ under the Copyright, Designs and Patents Act 1988 (?) • Users may not further distribute the material nor use it for the purposes of commercial gain. Where a licence is displayed above, please note the terms and conditions of the licence govern your use of this document. When citing, please reference the published version. Take down policy While the University of Birmingham exercises care and attention in making items available there are rare occasions when an item has been uploaded in error or has been deemed to be commercially or otherwise sensitive. If you believe that this is the case for this document, please contact [email protected] providing details and we will remove access to the work immediately and investigate. Download date: 14. Mar. 2022
Transcript
University of Birmingham
Global isoprene and monoterpene emissions underchanging climate, vegetation, CO 2 and land useHantson, Stijn; Knorr, Wolfgang; Schurgers, Guy; Pugh, Thomas; Arneth, Almut
Citation for published version (Harvard):Hantson, S, Knorr, W, Schurgers, G, Pugh, T & Arneth, A 2017, 'Global isoprene and monoterpene emissionsunder changing climate, vegetation, CO 2 and land use', Atmospheric Environment, vol. 155, pp. 35-45.https://doi.org/10.1016/j.atmosenv.2017.02.010
Link to publication on Research at Birmingham portal
General rightsUnless a licence is specified above, all rights (including copyright and moral rights) in this document are retained by the authors and/or thecopyright holders. The express permission of the copyright holder must be obtained for any use of this material other than for purposespermitted by law.
•Users may freely distribute the URL that is used to identify this publication.•Users may download and/or print one copy of the publication from the University of Birmingham research portal for the purpose of privatestudy or non-commercial research.•User may use extracts from the document in line with the concept of ‘fair dealing’ under the Copyright, Designs and Patents Act 1988 (?)•Users may not further distribute the material nor use it for the purposes of commercial gain.
Where a licence is displayed above, please note the terms and conditions of the licence govern your use of this document.
When citing, please reference the published version.
Take down policyWhile the University of Birmingham exercises care and attention in making items available there are rare occasions when an item has beenuploaded in error or has been deemed to be commercially or otherwise sensitive.
If you believe that this is the case for this document, please contact [email protected] providing details and we will remove access tothe work immediately and investigate.
Global isoprene and monoterpene emissions under changing climate, vegetation,CO2 and land use
Stijn Hantson, Wolfgang Knorr, Guy Schurgers, Thomas A.M. Pugh, Almut Arneth
PII: S1352-2310(17)30080-8
DOI: 10.1016/j.atmosenv.2017.02.010
Reference: AEA 15183
To appear in: Atmospheric Environment
Received Date: 25 October 2016
Revised Date: 30 January 2017
Accepted Date: 6 February 2017
Please cite this article as: Hantson, S., Knorr, W., Schurgers, G., Pugh, T.A.M., Arneth, A., Globalisoprene and monoterpene emissions under changing climate, vegetation, CO2 and land use,Atmospheric Environment (2017), doi: 10.1016/j.atmosenv.2017.02.010.
This is a PDF file of an unedited manuscript that has been accepted for publication. As a service toour customers we are providing this early version of the manuscript. The manuscript will undergocopyediting, typesetting, and review of the resulting proof before it is published in its final form. Pleasenote that during the production process errors may be discovered which could affect the content, and alllegal disclaimers that apply to the journal pertain.
Plants emit large quantities of isoprene and monoterpenes, the main components of global biogenic
volatile organic compound (BVOC) emissions. BVOCs have an important impact on the atmospheric
composition of methane, and of short-lived radiative forcing agents (e.g. ozone, aerosols etc.). It is
therefore necessary to know how isoprene and monoterpene emissions have changed over the past and
how future changes in climate, land-use and other factors will impact them. Here we present emission 20
estimates of isoprene and monoterpenes over the period 1901-2100 based on the dynamic global
vegetation model LPJ-GUESS, including the effects of all known important drivers. We find that both
isoprene and monoterpene emissions at the beginning of the 20th century were higher than at present.
While anthropogenic land-use change largely drives the global decreasing trend for isoprene over the
20th century, changes in natural vegetation composition caused a decreasing trend for monoterpene 25
emissions. Future global isoprene and monoterpene emissions depend strongly on the climate and land-
use scenarios considered. Over the 21st century, global isoprene emissions are simulated to either
remain stable (RCP 4.5), or decrease further (RCP 8.5), with important differences depending on the
underlying land-use scenario. Future monoterpene emissions are expected to continue their present
decreasing trend for all scenarios, possibly stabilizing from 2050 onwards (RCP 4.5). These results 30
demonstrate the importance to take both natural vegetation dynamics and anthropogenic changes in
land-use into account when estimating past and future BVOC emissions. They also indicate that a future
global increase in BVOC emissions is improbable.
MANUSCRIP
T
ACCEPTED
ACCEPTED MANUSCRIPT
35
Highlights
- Global isoprene and monoterpene emission estimates are presented (1901-2100).
- Isoprene and monoterpene emissions decrease strongly over the 20th century.
- Changes in vegetation cover drive global trends in isoprene and monoterpene emissions.
- A future global increase in BVOC emissions is improbable. 40
Keywords: BVOC, land use, isoprene, monoterpenes
1 Introduction
Isoprene and monoterpenes constitute the main part (~65%) of the biogenic volatile organic compounds 45
(BVOCs) emitted by the terrestrial biosphere (e.g. Guenther et al., 2012). BVOCs are produced in most
plant tissues, both above and below ground (Steeghs et al., 2004), and are known to be involved in plant
growth, reproduction and defense. Most BVOC species, including isoprene and monoterpenes, are highly
reactive with respect to major tropospheric oxidants, and they thus exert an important influence on
atmospheric composition (Atkinson, 2000). Under high concentrations of nitrogen oxides (NOx = NO + 50
NO2), the oxidation products of isoprene, and to a lesser extent monoterpenes, can act as precursors for
photochemical ozone production in the troposphere. However, under low NOx conditions, increased
BVOC emissions lead to lower ozone production due to chain-termination reactions reducing ozone
precursor concentrations (Atkinson and Arey, 2003). Generally, oxidation of organic compounds
decreases hydroxyl radical concentrations, thereby increasing the lifetime of methane in the 55
troposphere, and thus increasing radiative forcing. BVOCs, however, are now known to also regenerate
hydroxyl radicals during their oxidation, which moderates this effect, although the ultimate extent of this
moderation is not clear (Lelieveld et al., 2008; Fuchs et al., 2013; Hansen et al., 2017). BVOCs are also the
main precursors of secondary organic aerosols (Claeys et al., 2004; Carslaw et al., 2010; Riccobono et al.,
2014), and through their influence on the load and properties of atmospheric aerosol, they can influence 60
cloud formation and characteristics, and the reflectivity of the atmosphere, with consequent impacts on
the Earth's energy balance (Kanakidou et al., 2005; Rosenfeld et al., 2014; Unger, 2014). It is therefore
important to understand the factors driving global BVOC emissions and how these will vary in the future.
The processes driving isoprene and monoterpene emissions are complex and still not fully understood 65
(Peñuelas and Llusià, 2001; Arneth et al., 2008a; Loreto and Schnitzler, 2010 ; Harrison et al., 2013).
Isoprene and monoterpenes are (side) products of leaf photosynthesis. In plants, they seem to play a
role in the protection of plant membranes against high temperatures and/or oxidative stress, and act as
defense compounds against pathogens and herbivores (e.g. Harrison et al., 2013; Niinemets et al.,
2010a; Loreto and Schnitzler, 2010). As photosynthetic activity is a main driver of isoprene and 70
monoterpene production, radiation and temperature, along with leaf water status, phenological state
and atmospheric CO2 mixing ratio ([CO2]), affect emissions directly (on the leaf-scale) and indirectly (via
plant productivity) (e.g. Guenther et al., 1995; Zimmer et al., 2000; Eisenreich et al., 2001; Niinemets et
MANUSCRIP
T
ACCEPTED
ACCEPTED MANUSCRIPT
al., 2010a; Niinemets et al., 2010b). There is also strong evidence that CO2 directly influences the
isoprene synthesis process, with inhibition under increasing [CO2] (Possell et al., 2005; Rosenstiel et al., 75
2003). Whether or not similar processes operate for monoterpenes is unclear even though the similar
processes of leaf metabolism for isoprene and monoterpenes would suggest this to be the case, with evidence that this is the case for at least some species (e.g. Llorens et al., 2009; Loreto et al., 2001).
In addition to emission effects from climate and [CO2], which operate in principle on all emitting species 80
in a similar way, there exists a large inter-species variability in the amount of the photosynthetic carbon
uptake channeled towards the production of isoprene and/or monoterpenes (Harrison et al., 2013). The
leaf-level emission capacities (emission rates under standardized conditions) depend only to a limited
extent on plant family, with widely varying emission capacity even within the same genus (Kesselmeier
and Staudt, 1999), but those plants that do emit BVOCs tend to emit either isoprene or monoterpenes, 85
not both (Harrison et al., 2013). Natural changes in species distribution resulting from changing
environmental conditions can therefore have important impacts on total BVOC emissions by influencing
relative abundance of species with different emission capacities (Schurgers et al., 2011). In addition to
natural vegetation changes, humans have transformed the Earth’s terrestrial vegetation cover, with 35%
of the global land surface having been converted to agriculture and pastures by the year 2000 (Klein 90
Goldewijk et al., 2011). Crops typically have low isoprene and monoterpene emissions compared to
woody vegetation, so that agricultural expansion in naturally forested areas will typically lead to a
decrease in isoprene and monoterpene emissions (Rosenkranz et al., 2014; Karl et al., 2009). At least for
isoprene, anthropogenic land cover change is therefore considered to be the dominant driver of change
over the 20th century (e.g. Unger, 2013; Lathiere et al., 2010; Lathiere et al., 2006; Acosta Navarro et al., 95
2014).
All these previously described factors have multiple, sometimes opposing, effects on BVOC emissions
and should be taken into account for both past estimates and future projections. In particular the effects
of changing vegetation patterns in response to global climate change, combined with anthropogenic 100
land-use effects have to date only been assessed in some studies for isoprene (e.g. Wu et al., 2012;
Lathiere et al., 2010; Squire et al., 2014; Pacifico et al., 2012), and none for monoterpene emissions at a
global scale.
Here we adopt an approach that accounts for natural vegetation changes as well as anthropogenic land-105
use change, using the LPJ-GUESS dynamic vegetation model with an integrated process-based BVOC
emission scheme (Arneth et al., 2007b; Schurgers et al., 2009a) to perform estimates of global isoprene
and monoterpene emissions for historical (1901-2000) and future (2001-2100) conditions. For these
estimates we take into account changes in climate and the resulting natural vegetation distribution,
changing [CO2], and the impact of land transformation from natural vegetation to crop and pasture 110
lands. We explicitly consider the positive impact of [CO2] on photosynthesis, increasing BVOC emissions,
as well as the counteracting negative direct impact of [CO2] through CO2 inhibition of leaf BVOC
emissions. We compare the resulting range in emission estimates to previously published results, and
assess the current uncertainties.
115
MANUSCRIP
T
ACCEPTED
ACCEPTED MANUSCRIPT
2 Material and methods
2.1 LPJ-GUESS vegetation model
We use the Lund-Potsdam-Jena General Ecosystem Simulator (LPJ-GUESS) to compute the 120
establishment, growth and mortality of potential natural vegetation, as well as plant and soil water
status on a global scale (Sitch et al., 2003; Smith et al., 2001). Carbon and water exchanges are computed
on a daily time step, while establishment, growth and allocation, and mortality by episodic disturbances
and competition are simulated with a yearly time step. The photosynthesis module is an adaptation of
the Farquhar model (Farquhar et al., 1980) following Haxeltine and Prentice (1996). We use the global 125
version of LPJ-GUESS with 11 plant functional types (PFTs), comprising nine tree and two grass PFTs, with
vegetation parameters configured as in Ahlström et al. (2012). Adopting gap-model features, LPJ-GUESS
represents important ecosystem dynamic processes such as establishment and disturbance events as
stochastic processes, with a stochastic general patch-destroying disturbance with an average return
interval of 100 years. For each geographical location, 25 repeated calculations (“patches”) were averaged 130
to account for the stochastic character of vegetation growth and mortality that operates in ecosystems.
Fire disturbances are represented by the SIMFIRE global fire module (Knorr et al., 2016). For each woody
PFT, groups of individuals of similar age and size, or ‘cohorts’, are differentiated within these patches,
and each cohort represented by a single individual. LPJ-GUESS has been widely used and evaluated at
both the ecosystem and the global scale (Smith et al., 2001; Hickler et al., 2008; Morales et al., 2005; 135
Hickler et al., 2012; Wramneby et al., 2008).
2.2 BVOC emissions module
The LPJ-GUESS sub-model for BVOC emissions is able to compute emission rates for both isoprene and 140
monoterpenes. It combines the process-based leaf level emission model from Niinemets et al. (2002;
1999) with the LPJ-GUESS vegetation model as described by Arneth et al. (2007b) for isoprene, and by
Schurgers et al. (2009a) for monoterpenes based on the equation:
�������� = �� �������
The isoprene and monoterpene production in the leaf is linked to the photosynthetic electron flux ,
which supplies important metabolites for BVOC synthesis in the chloroplast. � converts the electron flux 145
into isoprene and monoterpenes with the fraction depending on the production capacity of each PFT �
(being the emission factors as given in Table S1 for isoprene, Is, and monoteprenes, Ms) and on a
temperature factor �� which accounts for the higher temperature optimum of terpene production
(compared to leaf electron transport). S is a seasonality factor only applied to some PFTs for isoprene
production (see Table S1) and not for monoterpenes. ����represents the CO2 inhibition on leaf 150
production of isoprene and monoterpenes relative to the ~370 ppmv [CO2] in the year 2000. Isoprene
and monoterpene production is calculated at a daily time step and all isoprene emissions produced are
directly emitted, while monoterpenes can be either emitted directly or stored in a storage pool � ���.
Monoterpenes get released from the storage pool based on a temperature function �, so that the total
monoterpene emissions depend on both the direct monoterpene production as well as release from 155
storage, where:
MANUSCRIP
T
ACCEPTED
ACCEPTED MANUSCRIPT
��� = ����� ∗ (1 − � ���) + � ��� ∗ �
�� ���
� = � ��� + (����� ∗ � ���)−� ��� ∗ �
It is assumed that coniferous trees and herbaceous vegetation store half of the monoterpenes and
release these as a function of leaf temperature, whereas broadleaf trees emit all monoterpenes directly 160
after production (Schurgers et al., 2009a). Adopting the concept of PFT-specific emission capacities
(Guenther et al., 1995), the emission rates for different PFTs are scaled such that under standard
conditions (a leaf temperature of 30°C, irradiance of 1000µmol PAR m-2s-1 and ambient [CO2] of 370
ppmv) the emissions per unit dry leaf biomass are equal to the emission capacity (isoprene, Is, and
monoteprenes, Ms, as given by Arneth et al. (2007a), and Schurgers et al. (2009a); see also table S1). The 165
model takes into consideration the direct and indirect responses of BVOC emissions to changing climate
and [CO2], including responses at the leaf as well as the ecosystem scale. A more detailed description of
the BVOC module in LPJ-GUESS is given in Arneth et al. (2007a) and Schurgers et al. (2009a).
2.3 Forcing data 170
LPJ-GUESS was forced with monthly, 0.5 degree gridded precipitation, incoming short-wave radiation
and temperature data for the years 1901 to 2100, taken from published simulation results by the CMIP5
project (Taylor et al., 2012). It has to be noted that using monthly data might cause a slight lower bias in
emission estimates (Ashworth et al., 2010). The climate simulations were bias corrected using CRU TS 175
3.10 data following (Ahlström et al., 2012), with the addition that an additive bias correction (instead of
the multiplicative approach in Ahlström et al., 2012) was applied for months in which the CMIP5
precipitation was less than 5mm. Daily precipitation values were generated applying the method of Sitch
et al. (2003) using monthly fraction of wet days. The diurnal temperature range, necessary for the BVOC
simulations, was derived using a linear regression between monthly mean diurnal temperature range 180
and diurnal mean temperature derived from CRU TS3.10 and applying it to the bias corrected monthly
mean temperature. In order to match the variability unexplained by the linear regression model, a
stochastic monthly Gaussian "noise" was added to the diurnal temperature range, with the same
standard deviation as the residual of the linear regression. The same method was used to derive fraction
of wet days from monthly mean bias-corrected precipitation (see Knorr et al., 2016). Annual atmospheric 185
CO2 mixing ratios [CO2] are a combination of direct measurements and data obtained from ice-cores and
future scenarios provided by CMIP5 (Meinshausen et al., 2011). CMIP5 uses emission scenarios from the
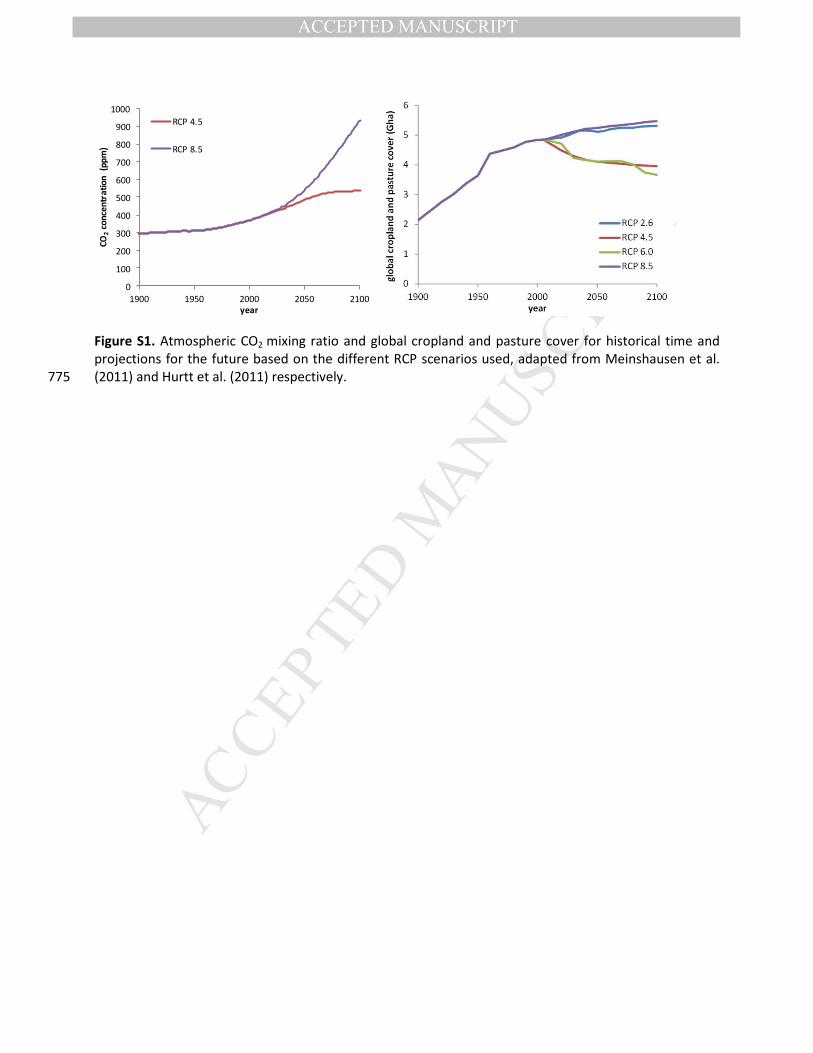
Representative Emissions Pathways (RCP) (Van Vuuren et al., 2011), with [CO2] reaching 538 ppmv and
936 ppmv by 2100 for RCPs 4.5 and 8.5 respectively, compared to approximately 400 ppmv currently
(Figure S1a). 190
Anthropogenic land-use change from natural vegetation to crops and pasture was modeled using the
dataset of Hurtt et al. (2011), with both crop and pasture land being represented by generic C3 and C4
grass plant functional types, with their relative occurrence depending on climate. For each simulation,
MANUSCRIP
T
ACCEPTED
ACCEPTED MANUSCRIPT
two sets of runs were performed, one with potential natural vegetation and one with only herbaceous
PFTs allowed to compete. The output from the latter runs was then assigned to the fraction of land 195
converted to pasture or agriculture corresponding to the RCP land-use scenario. Isoprene and
monoterpene emission capacities in croplands were set equal to those for natural C3 and C4 grass,
consistent with previous syntheses of emissions (e.g. Karl et al., 2009). An overview of the main BVOC
parameters for each PFT can be found in Table S1. Due to the high uncertainty associated with future
land-use projections, all four scenarios are considered, representing a range of possible trends in future 200
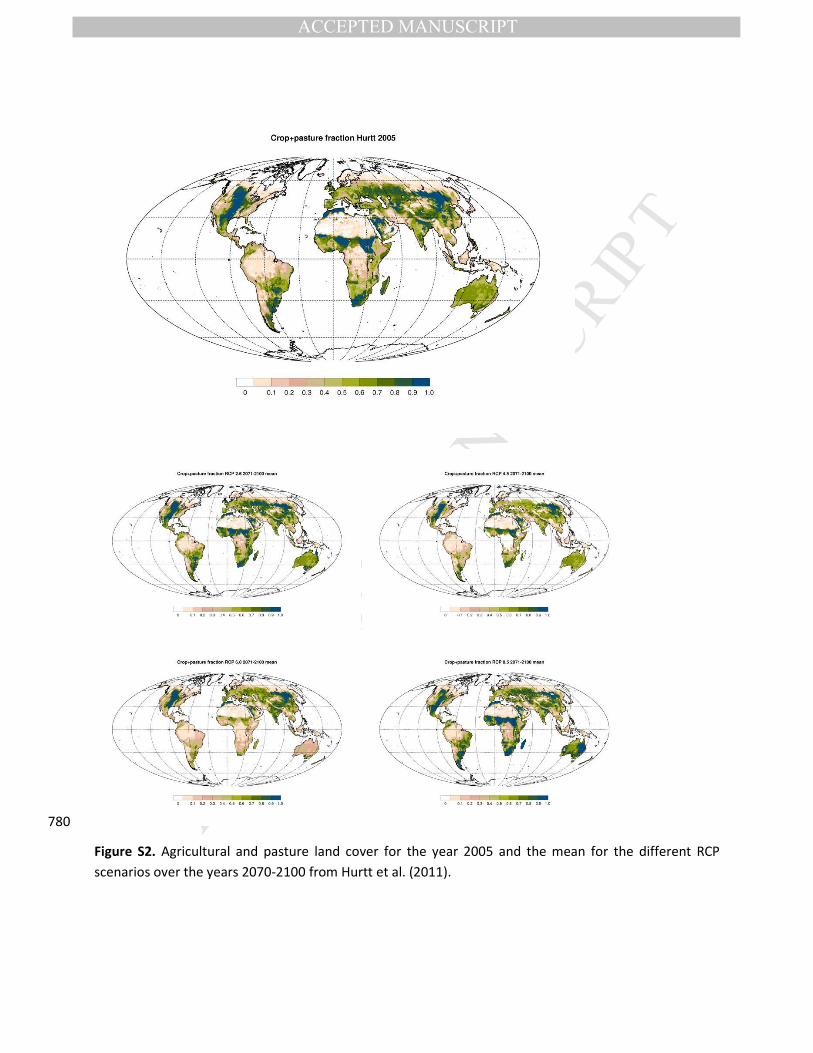
anthropogenic land-use (Table 1). Global maps for current and future land-use are given in Figure S2. The
anthropogenic land-use scenarios for the 21st century fall into two clear groups (Figure S1b), where land-
use under RCP 2.6 and 8.5 undergo a constant increase in crop and pasture land-use while under RCP 4.5
and 6.0 scenarios cropland expansion use shows a decrease, after reaching a peak in early 21st century.
To avoid confusion between future projections in land-use from future climate scenarios, we use “LU” 205
when we want to indicate land-use projections (e.g. land-use associated with RCP 4.5 would thus be LU
4.5). In addition to these anthropogenic land-use changes, changes in natural vegetation under changing
environmental conditions are represented by the dynamic vegetation model as described in section 2.1.
2.4 Simulation summary 210
All LPJ-GUESS simulations were run for the period 1901-2100 after a spin-up period of 500 years so that
all C-pools reached equilibrium recycling the first 30 years of the climate data. The list of simulations is
shown in Table 1. We selected climate forcing data from three well established Earth system models to
take the existing variability and uncertainty in these models into account. We use two different RCP
greenhouse gas scenarios for future projections – RCP 4.5 as a moderate emission scenario and RCP 8.5 215
as a high emission scenario – with and without a set of land-use scenarios (Table 1).
To analyze the future impact of land-use we performed runs with the same forcing data (MPI, RCP 4.5
greenhouse gas scenario) but with all four RCP future projections of land-use to identify the sensitivity of
emissions to a range of land-use assumptions, independent of climate and [CO2].
In an additional set of simulations, the CO2 inhibition effect was switched off in the model. Furthermore, 220
a simulations with constant atmospheric [CO2] for the year 2000 was conducted for all setups to
separate the influence of changing climate and [CO2] on BVOC emissions (Table 1).
3 Results
3.1 Present-day BVOC emission patterns and trends 225
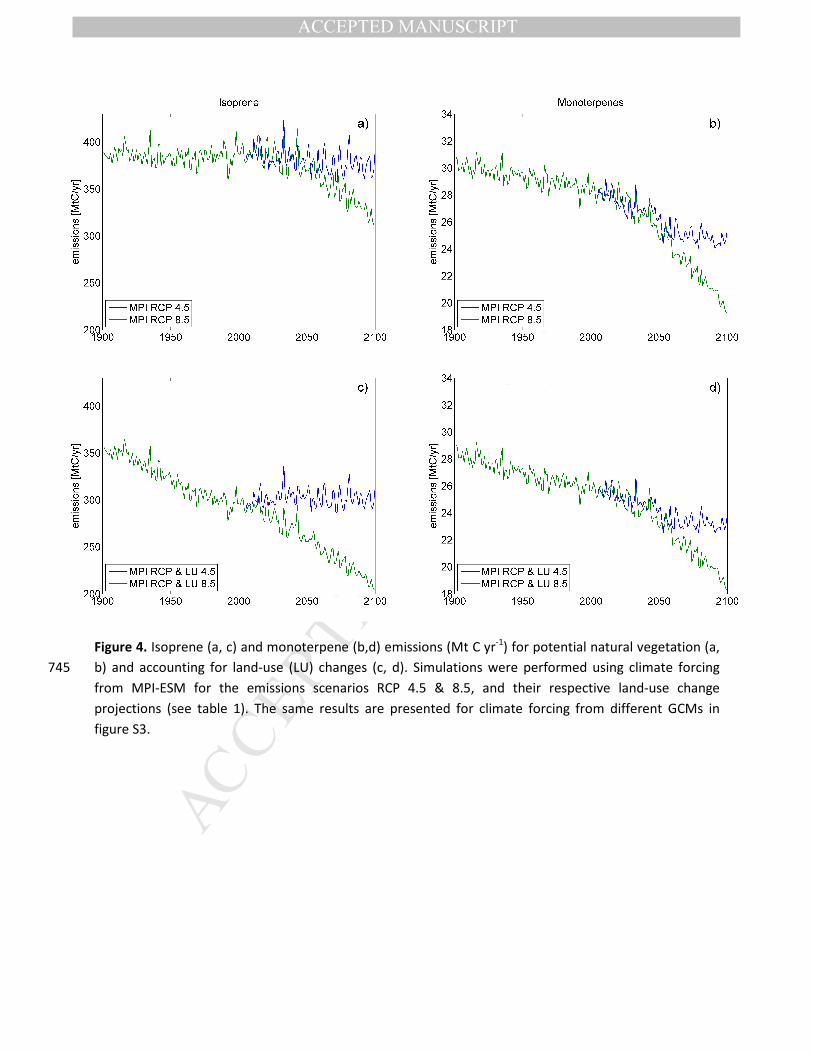
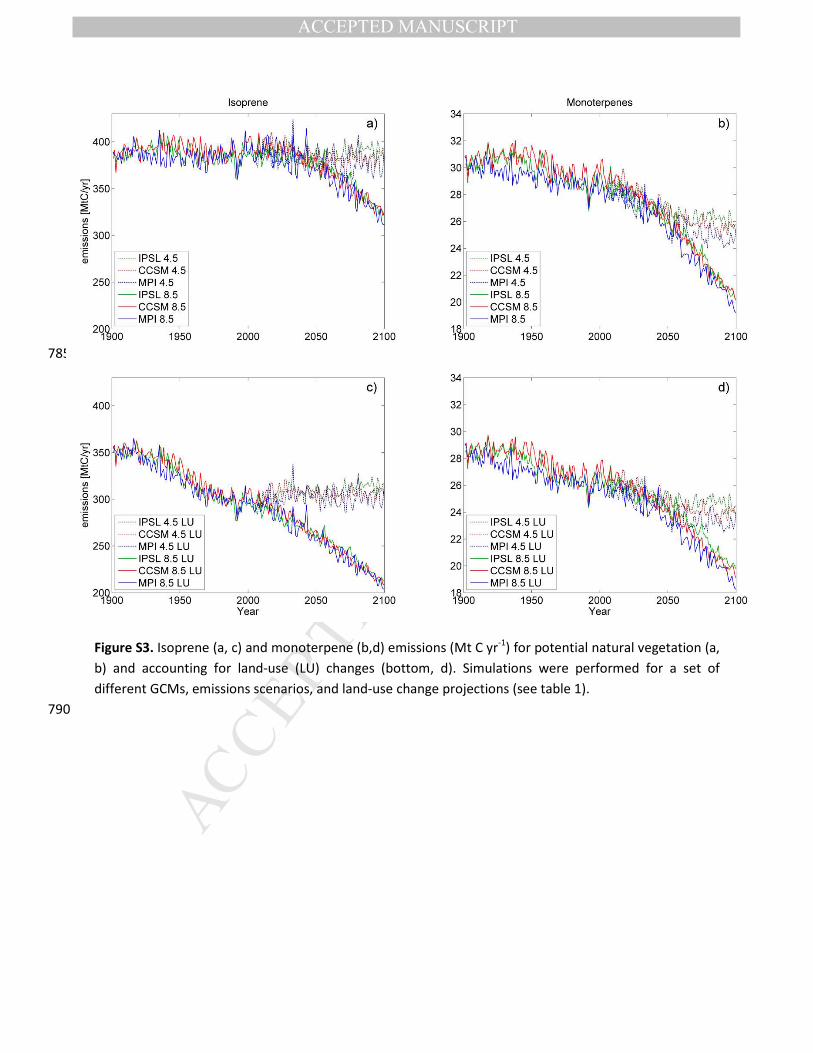
Simulated present-day (1971-2000) global annual isoprene and monoterpene emissions for natural
vegetation were around 400 TgC yr-1 and 30 TgC yr-1, respectively (Table 2), and were not strongly
sensitive to the choice of ESM used for the climate data (Fig. S3). Global emissions of isoprene are
dominated by tropical areas, with maxima >10 gC m-2 yr-1 (Figure 2a). This stands in contrast to
temperate and boreal environments where emissions rarely exceed 4 gC m-2 yr-1. Maximum 230
MANUSCRIP
T
ACCEPTED
ACCEPTED MANUSCRIPT
monoterpene emissions differ much less between tropical, temperate and boreal regions, with typical
regional values of 0.4 to 0.6 gC m-2 yr-1 (Figure 2b).
3.2 Interaction between climate, [CO2] and natural vegetation change
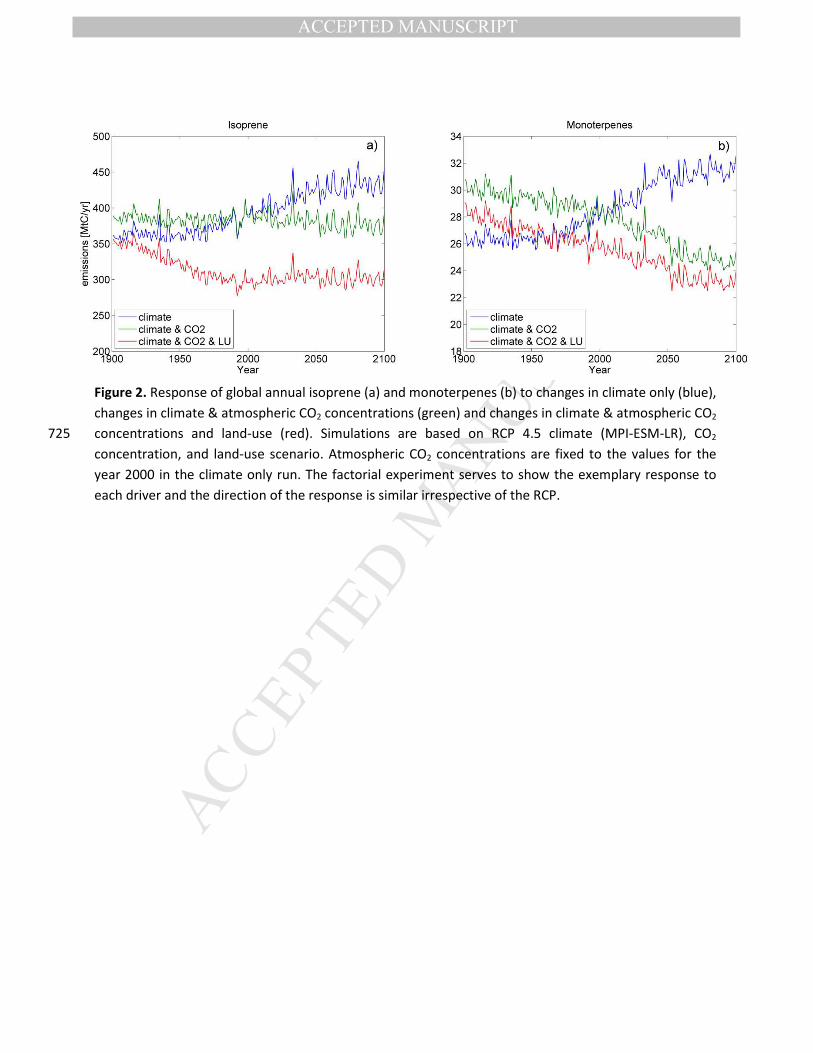
Climate has a strong impact on BVOC emissions due to its impact on vegetation productivity and 235
distribution, and due to the direct sensitivity of leaf BVOC emissions to temperature. When only
accounting for changing climate over the study period (simulation with natural vegetation only and
present day [CO2]), both isoprene and monoterpene emissions increase strongly over the 21st century
(for instance, respectively ±21% and ±23% for the RCP 4.5 scenario with MPI forcing; Figure 2).
Past and future natural emissions from both isoprene and monoterpenes are strongly determined by 240
the CO2 inhibition effect. When the CO2 inhibition of leaf emissions is ignored, both isoprene and
monoterpene emissions increase strongly under future conditions due to changes in climate (Table 2).
However, when taking into account the CO2 inhibition effect, emissions over the 21st century stay more
or less stable for isoprene and decrease by 13% for monoterpenes under RCP 4.5 scenario (Table 2,
Figure 2). For the RCP 8.5 scenarios, with high levels of atmospheric [CO2], a strong decrease over the 245
21st century is observed for both isoprene and monoterpene emissions (Figure 4a &b). As indicated in
Figure 2, the future increase in atmospheric [CO2] counteracts the increase in isoprene and
monoterpene emissions due to changing climate. The strongest climate effect on emissions is obtained
with RCP 8.5, as it represents the scenario with the strongest temperature increase. However,
atmospheric [CO2] also increases strongly until the end of the 21st century for RCP 8.5 (Figure S1a), 250
which more than counteracts the effects of increasing temperature and explains the marked difference
between the simulated trends between RCP 4.5 on one hand and RCP 8.5 on the other (Figure 4a&b).
While interacting effects of climate and CO2 can explain the spread in different climate scenarios, the
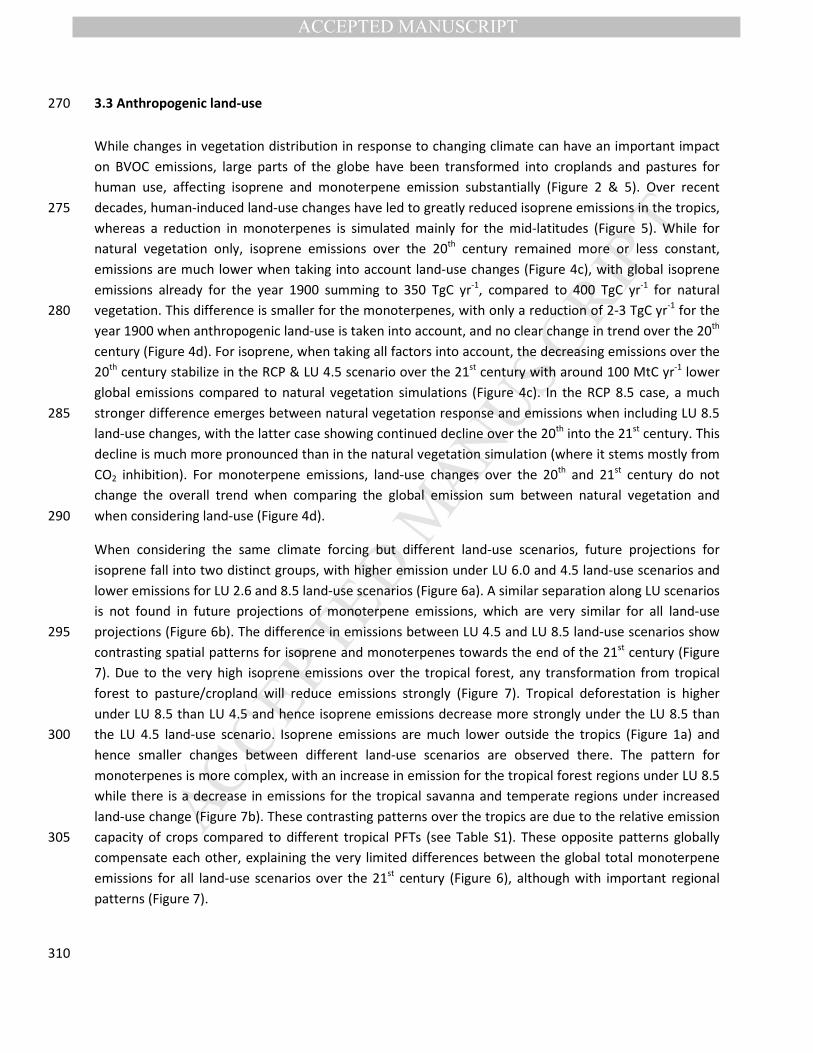
trends for the monoterpenes are different from isoprene when only considering natural vegetation; a
continuous slight decline in monoterpene emissions is simulated during the 20th and first half of the 255
21st century (Figure 4a &b & 3). This appears at first surprising considering the similar production
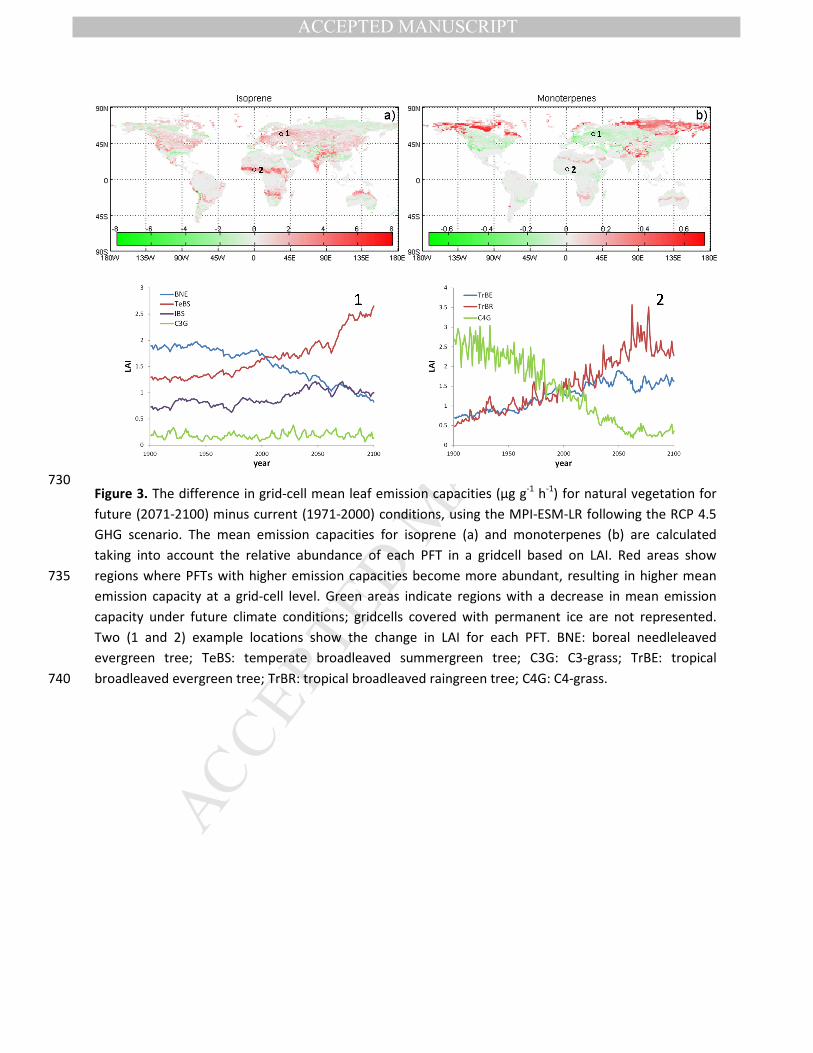
process of both. A large part of the difference, however, can be explained by natural changes in
vegetation distribution under changing climate. Broadly speaking, the emission capacities for isoprene
are higher for PFTs occurring in the tropics and decrease for PFTs growing towards the poles, the
opposite is true for monoterpenes (Table S1). A warming climate is simulated to lead to a widespread 260
shift in the relative abundance of vegetation with different emission capacities in such a way that
gridcell level mean isoprene emissions capacity increases over most of the globe, while the mean
emission capacity of monoterpenes decreases (Figure 3). The spatial pattern of the change in emission
capacity coincides relatively well with the changes in isoprene and monoterpene emissions over the 21st
century (Figure 1c&d). While at high northern latitudes, plants with high monoterpene emission 265
capacities increase strongly in abundance, these barely have an impact on the global numbers because
of the overall low total emissions due to the cold climate and very short growing season (Figure 1b). It is
important to indicate that there often is a shift in relative abundance that affects the grid-cell mean
emission factor, but is not large enough to replace the most abundant PFT (Figure 3).
MANUSCRIP
T
ACCEPTED
ACCEPTED MANUSCRIPT
3.3 Anthropogenic land-use 270
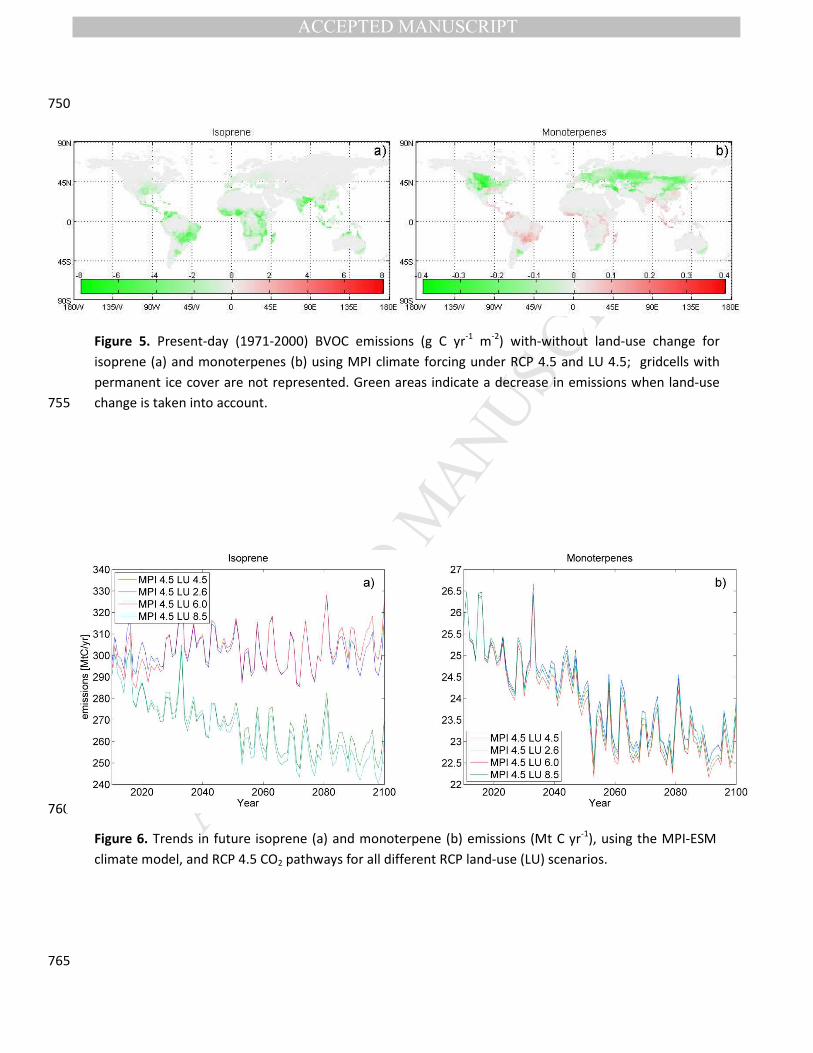
While changes in vegetation distribution in response to changing climate can have an important impact
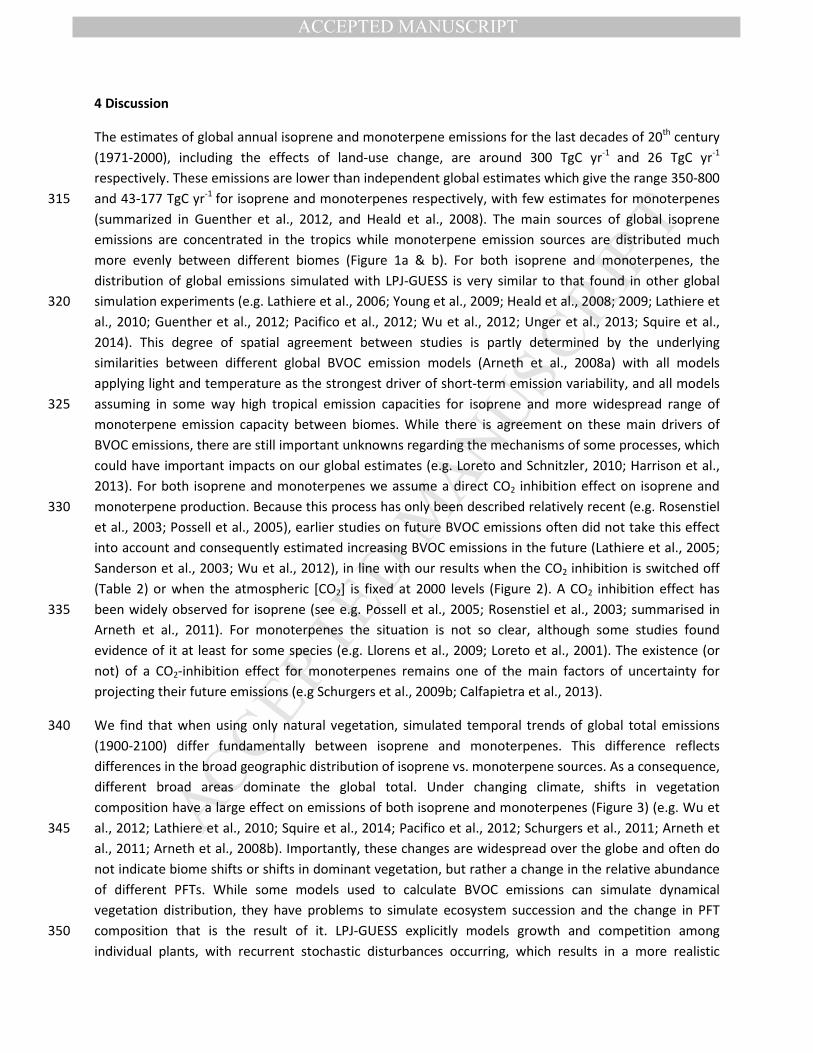
on BVOC emissions, large parts of the globe have been transformed into croplands and pastures for
human use, affecting isoprene and monoterpene emission substantially (Figure 2 & 5). Over recent
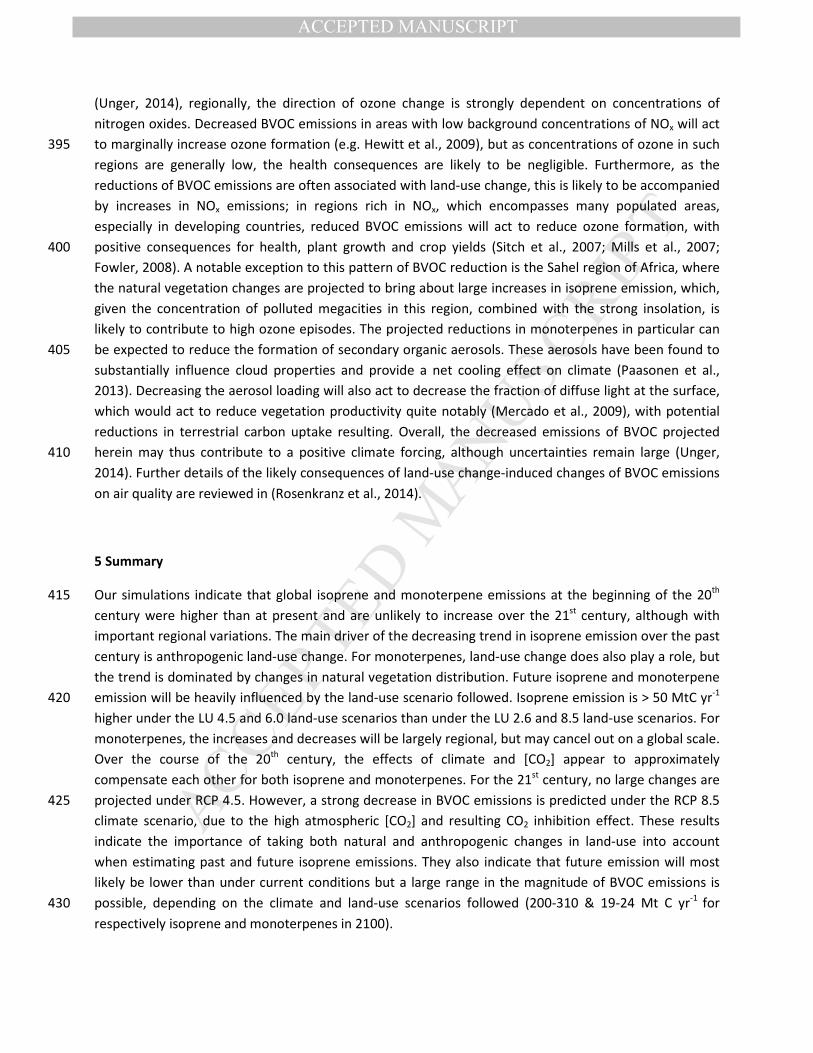
decades, human-induced land-use changes have led to greatly reduced isoprene emissions in the tropics, 275
whereas a reduction in monoterpenes is simulated mainly for the mid-latitudes (Figure 5). While for
natural vegetation only, isoprene emissions over the 20th century remained more or less constant,
emissions are much lower when taking into account land-use changes (Figure 4c), with global isoprene
emissions already for the year 1900 summing to 350 TgC yr-1, compared to 400 TgC yr-1 for natural
vegetation. This difference is smaller for the monoterpenes, with only a reduction of 2-3 TgC yr-1 for the 280
year 1900 when anthropogenic land-use is taken into account, and no clear change in trend over the 20th
century (Figure 4d). For isoprene, when taking all factors into account, the decreasing emissions over the
20th century stabilize in the RCP & LU 4.5 scenario over the 21st century with around 100 MtC yr-1 lower
global emissions compared to natural vegetation simulations (Figure 4c). In the RCP 8.5 case, a much
stronger difference emerges between natural vegetation response and emissions when including LU 8.5 285
land-use changes, with the latter case showing continued decline over the 20th into the 21st century. This
decline is much more pronounced than in the natural vegetation simulation (where it stems mostly from
CO2 inhibition). For monoterpene emissions, land-use changes over the 20th and 21st century do not
change the overall trend when comparing the global emission sum between natural vegetation and
when considering land-use (Figure 4d). 290
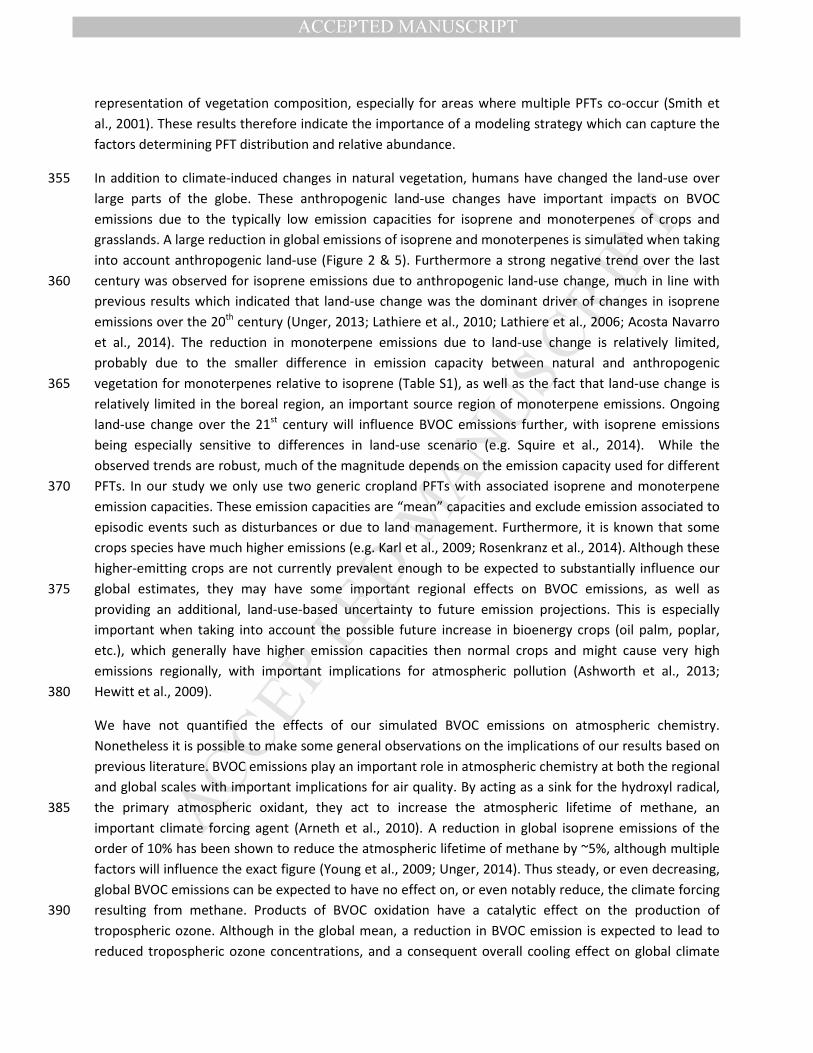
When considering the same climate forcing but different land-use scenarios, future projections for
isoprene fall into two distinct groups, with higher emission under LU 6.0 and 4.5 land-use scenarios and
lower emissions for LU 2.6 and 8.5 land-use scenarios (Figure 6a). A similar separation along LU scenarios
is not found in future projections of monoterpene emissions, which are very similar for all land-use
projections (Figure 6b). The difference in emissions between LU 4.5 and LU 8.5 land-use scenarios show 295
contrasting spatial patterns for isoprene and monoterpenes towards the end of the 21st century (Figure
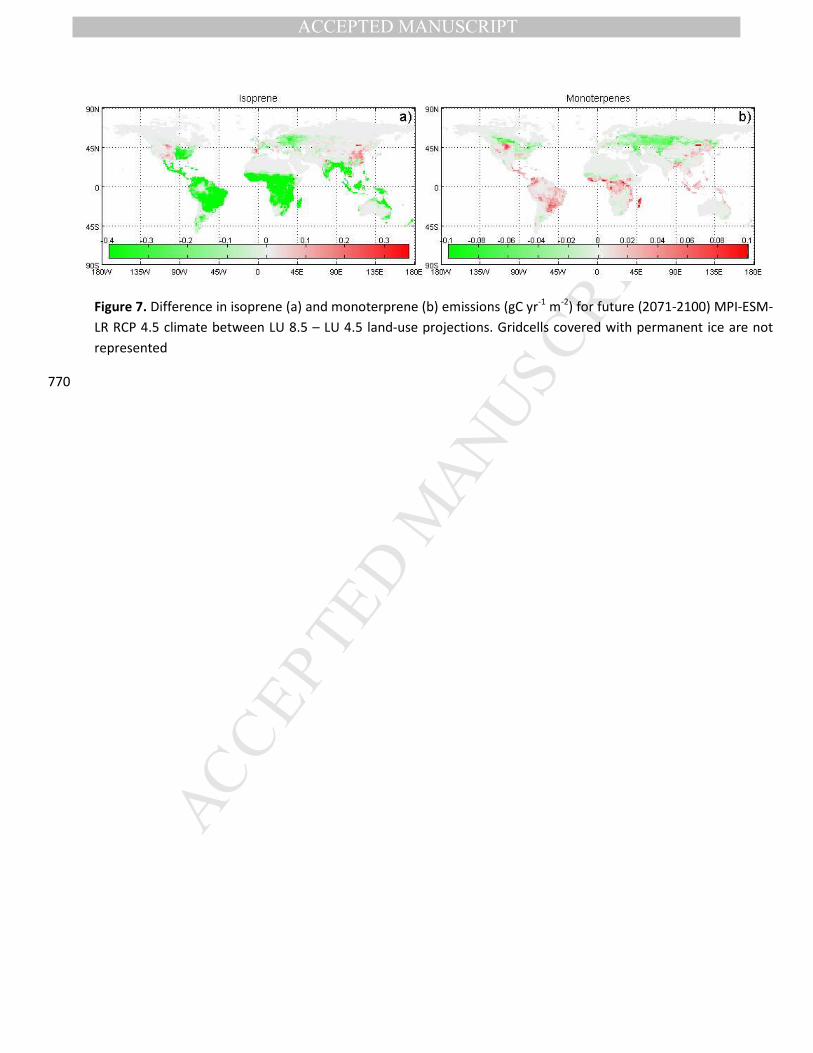
7). Due to the very high isoprene emissions over the tropical forest, any transformation from tropical
forest to pasture/cropland will reduce emissions strongly (Figure 7). Tropical deforestation is higher
under LU 8.5 than LU 4.5 and hence isoprene emissions decrease more strongly under the LU 8.5 than
the LU 4.5 land-use scenario. Isoprene emissions are much lower outside the tropics (Figure 1a) and 300
hence smaller changes between different land-use scenarios are observed there. The pattern for
monoterpenes is more complex, with an increase in emission for the tropical forest regions under LU 8.5
while there is a decrease in emissions for the tropical savanna and temperate regions under increased
land-use change (Figure 7b). These contrasting patterns over the tropics are due to the relative emission
capacity of crops compared to different tropical PFTs (see Table S1). These opposite patterns globally 305
compensate each other, explaining the very limited differences between the global total monoterpene
emissions for all land-use scenarios over the 21st century (Figure 6), although with important regional
patterns (Figure 7).
310
MANUSCRIP
T
ACCEPTED
ACCEPTED MANUSCRIPT
4 Discussion
The estimates of global annual isoprene and monoterpene emissions for the last decades of 20th century
(1971-2000), including the effects of land-use change, are around 300 TgC yr-1 and 26 TgC yr-1
respectively. These emissions are lower than independent global estimates which give the range 350-800
and 43-177 TgC yr-1 for isoprene and monoterpenes respectively, with few estimates for monoterpenes 315
(summarized in Guenther et al., 2012, and Heald et al., 2008). The main sources of global isoprene
emissions are concentrated in the tropics while monoterpene emission sources are distributed much
more evenly between different biomes (Figure 1a & b). For both isoprene and monoterpenes, the
distribution of global emissions simulated with LPJ-GUESS is very similar to that found in other global
simulation experiments (e.g. Lathiere et al., 2006; Young et al., 2009; Heald et al., 2008; 2009; Lathiere et 320
al., 2010; Guenther et al., 2012; Pacifico et al., 2012; Wu et al., 2012; Unger et al., 2013; Squire et al.,
2014). This degree of spatial agreement between studies is partly determined by the underlying
similarities between different global BVOC emission models (Arneth et al., 2008a) with all models
applying light and temperature as the strongest driver of short-term emission variability, and all models
assuming in some way high tropical emission capacities for isoprene and more widespread range of 325
monoterpene emission capacity between biomes. While there is agreement on these main drivers of
BVOC emissions, there are still important unknowns regarding the mechanisms of some processes, which
could have important impacts on our global estimates (e.g. Loreto and Schnitzler, 2010; Harrison et al.,
2013). For both isoprene and monoterpenes we assume a direct CO2 inhibition effect on isoprene and
monoterpene production. Because this process has only been described relatively recent (e.g. Rosenstiel 330
et al., 2003; Possell et al., 2005), earlier studies on future BVOC emissions often did not take this effect
into account and consequently estimated increasing BVOC emissions in the future (Lathiere et al., 2005;
Sanderson et al., 2003; Wu et al., 2012), in line with our results when the CO2 inhibition is switched off
(Table 2) or when the atmospheric [CO2] is fixed at 2000 levels (Figure 2). A CO2 inhibition effect has
been widely observed for isoprene (see e.g. Possell et al., 2005; Rosenstiel et al., 2003; summarised in 335
Arneth et al., 2011). For monoterpenes the situation is not so clear, although some studies found
evidence of it at least for some species (e.g. Llorens et al., 2009; Loreto et al., 2001). The existence (or
not) of a CO2-inhibition effect for monoterpenes remains one of the main factors of uncertainty for
projecting their future emissions (e.g Schurgers et al., 2009b; Calfapietra et al., 2013).
We find that when using only natural vegetation, simulated temporal trends of global total emissions 340
(1900-2100) differ fundamentally between isoprene and monoterpenes. This difference reflects
differences in the broad geographic distribution of isoprene vs. monoterpene sources. As a consequence,
different broad areas dominate the global total. Under changing climate, shifts in vegetation
composition have a large effect on emissions of both isoprene and monoterpenes (Figure 3) (e.g. Wu et
al., 2012; Lathiere et al., 2010; Squire et al., 2014; Pacifico et al., 2012; Schurgers et al., 2011; Arneth et 345
al., 2011; Arneth et al., 2008b). Importantly, these changes are widespread over the globe and often do
not indicate biome shifts or shifts in dominant vegetation, but rather a change in the relative abundance
of different PFTs. While some models used to calculate BVOC emissions can simulate dynamical
vegetation distribution, they have problems to simulate ecosystem succession and the change in PFT
composition that is the result of it. LPJ-GUESS explicitly models growth and competition among 350
individual plants, with recurrent stochastic disturbances occurring, which results in a more realistic
MANUSCRIP
T
ACCEPTED
ACCEPTED MANUSCRIPT
representation of vegetation composition, especially for areas where multiple PFTs co-occur (Smith et
al., 2001). These results therefore indicate the importance of a modeling strategy which can capture the
factors determining PFT distribution and relative abundance.
In addition to climate-induced changes in natural vegetation, humans have changed the land-use over 355
large parts of the globe. These anthropogenic land-use changes have important impacts on BVOC
emissions due to the typically low emission capacities for isoprene and monoterpenes of crops and
grasslands. A large reduction in global emissions of isoprene and monoterpenes is simulated when taking
into account anthropogenic land-use (Figure 2 & 5). Furthermore a strong negative trend over the last
century was observed for isoprene emissions due to anthropogenic land-use change, much in line with 360
previous results which indicated that land-use change was the dominant driver of changes in isoprene
emissions over the 20th century (Unger, 2013; Lathiere et al., 2010; Lathiere et al., 2006; Acosta Navarro
et al., 2014). The reduction in monoterpene emissions due to land-use change is relatively limited,
probably due to the smaller difference in emission capacity between natural and anthropogenic
vegetation for monoterpenes relative to isoprene (Table S1), as well as the fact that land-use change is 365
relatively limited in the boreal region, an important source region of monoterpene emissions. Ongoing
land-use change over the 21st century will influence BVOC emissions further, with isoprene emissions
being especially sensitive to differences in land-use scenario (e.g. Squire et al., 2014). While the
observed trends are robust, much of the magnitude depends on the emission capacity used for different
PFTs. In our study we only use two generic cropland PFTs with associated isoprene and monoterpene 370
emission capacities. These emission capacities are “mean” capacities and exclude emission associated to
episodic events such as disturbances or due to land management. Furthermore, it is known that some
crops species have much higher emissions (e.g. Karl et al., 2009; Rosenkranz et al., 2014). Although these
higher-emitting crops are not currently prevalent enough to be expected to substantially influence our
global estimates, they may have some important regional effects on BVOC emissions, as well as 375
providing an additional, land-use-based uncertainty to future emission projections. This is especially
important when taking into account the possible future increase in bioenergy crops (oil palm, poplar,
etc.), which generally have higher emission capacities then normal crops and might cause very high
emissions regionally, with important implications for atmospheric pollution (Ashworth et al., 2013;
Hewitt et al., 2009). 380
We have not quantified the effects of our simulated BVOC emissions on atmospheric chemistry.
Nonetheless it is possible to make some general observations on the implications of our results based on
previous literature. BVOC emissions play an important role in atmospheric chemistry at both the regional
and global scales with important implications for air quality. By acting as a sink for the hydroxyl radical,
the primary atmospheric oxidant, they act to increase the atmospheric lifetime of methane, an 385
important climate forcing agent (Arneth et al., 2010). A reduction in global isoprene emissions of the
order of 10% has been shown to reduce the atmospheric lifetime of methane by ~5%, although multiple
factors will influence the exact figure (Young et al., 2009; Unger, 2014). Thus steady, or even decreasing,
global BVOC emissions can be expected to have no effect on, or even notably reduce, the climate forcing
resulting from methane. Products of BVOC oxidation have a catalytic effect on the production of 390
tropospheric ozone. Although in the global mean, a reduction in BVOC emission is expected to lead to
reduced tropospheric ozone concentrations, and a consequent overall cooling effect on global climate
MANUSCRIP
T
ACCEPTED
ACCEPTED MANUSCRIPT
(Unger, 2014), regionally, the direction of ozone change is strongly dependent on concentrations of
nitrogen oxides. Decreased BVOC emissions in areas with low background concentrations of NOx will act
to marginally increase ozone formation (e.g. Hewitt et al., 2009), but as concentrations of ozone in such 395
regions are generally low, the health consequences are likely to be negligible. Furthermore, as the
reductions of BVOC emissions are often associated with land-use change, this is likely to be accompanied
by increases in NOx emissions; in regions rich in NOx, which encompasses many populated areas,
especially in developing countries, reduced BVOC emissions will act to reduce ozone formation, with
positive consequences for health, plant growth and crop yields (Sitch et al., 2007; Mills et al., 2007; 400
Fowler, 2008). A notable exception to this pattern of BVOC reduction is the Sahel region of Africa, where
the natural vegetation changes are projected to bring about large increases in isoprene emission, which,
given the concentration of polluted megacities in this region, combined with the strong insolation, is
likely to contribute to high ozone episodes. The projected reductions in monoterpenes in particular can
be expected to reduce the formation of secondary organic aerosols. These aerosols have been found to 405
substantially influence cloud properties and provide a net cooling effect on climate (Paasonen et al.,
2013). Decreasing the aerosol loading will also act to decrease the fraction of diffuse light at the surface,
which would act to reduce vegetation productivity quite notably (Mercado et al., 2009), with potential
reductions in terrestrial carbon uptake resulting. Overall, the decreased emissions of BVOC projected
herein may thus contribute to a positive climate forcing, although uncertainties remain large (Unger, 410
2014). Further details of the likely consequences of land-use change-induced changes of BVOC emissions
on air quality are reviewed in (Rosenkranz et al., 2014).
5 Summary
Our simulations indicate that global isoprene and monoterpene emissions at the beginning of the 20th 415
century were higher than at present and are unlikely to increase over the 21st century, although with
important regional variations. The main driver of the decreasing trend in isoprene emission over the past
century is anthropogenic land-use change. For monoterpenes, land-use change does also play a role, but
the trend is dominated by changes in natural vegetation distribution. Future isoprene and monoterpene
emission will be heavily influenced by the land-use scenario followed. Isoprene emission is > 50 MtC yr-1 420
higher under the LU 4.5 and 6.0 land-use scenarios than under the LU 2.6 and 8.5 land-use scenarios. For
monoterpenes, the increases and decreases will be largely regional, but may cancel out on a global scale.
Over the course of the 20th century, the effects of climate and [CO2] appear to approximately
compensate each other for both isoprene and monoterpenes. For the 21st century, no large changes are
projected under RCP 4.5. However, a strong decrease in BVOC emissions is predicted under the RCP 8.5 425
climate scenario, due to the high atmospheric [CO2] and resulting CO2 inhibition effect. These results
indicate the importance of taking both natural and anthropogenic changes in land-use into account
when estimating past and future isoprene emissions. They also indicate that future emission will most
likely be lower than under current conditions but a large range in the magnitude of BVOC emissions is
possible, depending on the climate and land-use scenarios followed (200-310 & 19-24 Mt C yr-1 for 430
respectively isoprene and monoterpenes in 2100).
MANUSCRIP
T
ACCEPTED
ACCEPTED MANUSCRIPT
Due to the importance of isoprene and monoterpenes for local to regional atmospheric chemistry and
air quality, our estimates can serve atmospheric modelers with a range of possible emission scenarios to
estimate the aerosol and ozone formation and methane lifetime under historical and future conditions.
Decreases in the global load of BVOCs under scenarios with strong [CO2] increases will act to reduce 435
methane lifetime, and thus marginally offset the radiative forcing effect of those [CO2] increases. The
influence on ozone and secondary organic aerosols will be highly regional, and influenced by emissions
of other trace gases, particularly nitrogen oxides, but, given the magnitude of the regional changes in
BVOC emission simulated here, is likely to be notable, and may be particularly so in the Sahel region of
Africa. There is also evidence to suggest that the reduction of monoterpene emissions over the middle-440
high latitudes may contribute to a climate warming, the magnitude of which will need to be assessed
with advanced chemistry-climate modelling.
Acknowledgments
S.H., A.A. and T.P. acknowledge support by the EU FP7 projects BACCHUS (grant agreement no. 603445) 445
and LUC4C (grant ag. no. 603542), and W.K. and A.A. by the EU FP7 project PEGASOS (grant ag. no.
265148). We acknowledge the World Climate Research Programme's Working Group on Coupled
Modelling, which is responsible for CMIP, and we thank the climate modeling groups for producing and
making available their model output (Table 1). This work was supported, in part, by the German Federal
Ministry of Education and Research (BMBF), through the Helmholtz Association and its research 450
programme ATMO, and the HGF Impulse and Networking fund. This is paper number 25 of the
Birmingham Institute of Forest Research.
Data availability: Data are available freely upon request, please contact Stijn Hantson
Acosta Navarro, J. C., Smolander, S., Struthers, H., Zorita, E., Ekman, A. M. L., Kaplan, J. O., Guenther, A., Arneth, A., and Riipinen, I.: Global emissions of terpenoid vocs from terrestrial vegetation in the
last millennium, Journal of Geophysical Research: Atmospheres, 119, 6867-6885,
10.1002/2013jd021238, 2014. 460
Ahlström, A., Schurgers, G., Arneth, A., and Smith, B.: Robustness and uncertainty in terrestrial
ecosystem carbon response to cmip5 climate change projections, Environ Res Lett, 7, 044008,
2012.
Arneth, A., Miller, P. A., Scholze, M., Hickler, T., Schurgers, G., Smith, B., and Prentice, I. C.: Co2 inhibition
of global terrestrial isoprene emissions: Potential implications for atmospheric chemistry, 465
Geophysical Research letters, 34, Doi 10.1029/2007gl030615, 2007a.
Arneth, A., Niinemets, U., Pressley, S., Back, J., Hari, P., Karl, T., Noe, S., Prentice, I. C., Serca, D., Hickler, T., Wolf, A., and Smith, B.: Process-based estimates of terrestrial ecosystem isoprene emissions:
Incorporating the effects of a direct co2-isoprene interaction, Atmos. Chem. Phys., 7, 31-53,
2007b. 470
Arneth, A., Monson, R. K., Schurgers, G., Niinemets, U., and Palmer, P. I.: Why are estimates of global
terrestrial isoprene emissions so similar (and why is this not so for monoterpenes)?, Atmos.
Chem. Phys., 8, 4605-4620, 2008a.
Arneth, A., Schurgers, G., Hickler, T., and Miller, P. A.: Effects of species composition, land surface cover,
co2 concentration and climate on isoprene emissions from european forests, Plant Biology, 10, 475
150-162, DOI 10.1055/s-2007-965247, 2008b.
Arneth, A., Harrison, S. P., Zaehle, S., Tsigaridis, K., Menon, S., Bartlein, P. J., Feichter, J., Korhola, A., Kulmala, M., O'Donnell, D., Schurgers, G., Sorvari, S., and Vesala, T.: Terrestrial biogeochemical
feedbacks in the climate system, Nat Geosci, 3, 525-532, Doi 10.1038/Ngeo905, 2010.
Arneth, A., Schurgers, G., Lathiere, J., Duhl, T., Beerling, D. J., Hewitt, C. N., Martin, M., and Guenther, A.: 480
Global terrestrial isoprene emission models: Sensitivity to variability in climate and vegetation,
Calfapietra, C., Pallozzi, E., Lusini, I., and Velikova, V.: Modification of bvoc emissions by changes in 490
atmospheric [co2] and air pollution, in: Biology, controls and models of tree volatile organic
compound emissions, edited by: Niinemets, Ü., and Monson, K. R., Springer Netherlands,
Dordrecht, 253-284, 2013.
Carslaw, K. S., Boucher, O., Spracklen, D. V., Mann, G. W., Rae, J. G. L., Woodward, S., and Kulmala, M.: A
review of natural aerosol interactions and feedbacks within the earth system, Atmos. Chem. 495
Phys., 10, 1701-1737, 10.5194/acp-10-1701-2010, 2010. Claeys, M., Graham, B., Vas, G., Wang, W., Vermeylen, R., Pashynska, V., Cafmeyer, J., Guyon, P.,
Andreae, M. O., Artaxo, P., and Maenhaut, W.: Formation of secondary organic aerosols through
photooxidation of isoprene, science, 303, 1173-1176, 10.1126/science.1092805, 2004.
Eisenreich, W., Rohdich, F., and Bacher, A.: Deoxyxylulose phosphate pathway to terpenoids, Trends in 500
Plant Science, 6, 78–84, 2001.
Farquhar, G. D., von Caemmerer, S., and Berry, J. A.: A biochemical model of photosynthetic co2
assimilation in leaves of c3 species, Planta, 149, 78-90, 10.1007/bf00386231, 1980.
MANUSCRIP
T
ACCEPTED
ACCEPTED MANUSCRIPT
Fowler, D.: Ground-level ozone in the 21st century: Future trends, impacts and policy implications, Royal
Society, 2008. 505
Fuchs, H., Hofzumahaus, A., Rohrer, F., Bohn, B., Brauers, T., Dorn, H. P., Haseler, R., Holland, F.,
Kaminski, M., Li, X., Lu, K., Nehr, S., Tillmann, R., Wegener, R., and Wahner, A.: Experimental evidence for efficient hydroxyl radical regeneration in isoprene oxidation, Nature Geosci, 6,
1023-1026, 2013.
Guenther, A., Hewitt, C. N., Erickson, D., Fall, R., Geron, C., Graedel, T., Harley, P., Klinger, L., Lerdau, M., 510
McKay, W. A., Pierce, T., Scholes, B., Steinbrecher, R., Tallamraju, R., Taylor, J., and Zimmerman,
P.: A global model of natural volatile organic compound emissions, Journal of Geophysical
Guenther, A. B., Jiang, X., Heald, C. L., Sakulyanontvittaya, T., Duhl, T., Emmons, L. K., and Wang, X.: The
model of emissions of gases and aerosols from nature version 2.1 (megan2.1): An extended and 515
updated framework for modeling biogenic emissions, Geosci. Model Dev., 5, 1471-1492,
10.5194/gmd-5-1471-2012, 2012. Hansen, R. F., Lewis, T. R., Graham, L., Whalley, L. K., Seakins, P. W., Heard, D. E., and Blitz, M. A.: Oh
production from the photolysis of isoprene-derived peroxy radicals: Cross-sections, quantum
yields and atmospheric implications, Physical Chemistry Chemical Physics, 19, 2332-2345, 520
10.1039/c6cp06718b, 2017.
Harrison, S. P., Morfopoulos, C., Dani, K. G. S., Prentice, I. C., Arneth, A., Atwell, B. J., Barkley, M. P.,
Leishman, M. R., Loreto, F., Medlyn, B. E., Niinemets, U., Possell, M., Penuelas, J., and Wright, I.
J.: Volatile isoprenoid emissions from plastid to planet, New Phytol., 197, 49-57, Doi
10.1111/Nph.12021, 2013. 525
Haxeltine, A., and Prentice, I. C.: Biome3: An equilibrium terrestrial biosphere model based on ecophysiological constraints, resource availability, and competition among plant functional
Hewitt, C. N., MacKenzie, A. R., Di Carlo, P., Di Marco, C. F., Dorsey, J. R., Evans, M., Fowler, D., Gallagher, M. W., Hopkins, J. R., Jones, C. E., Langford, B., Lee, J. D., Lewis, A. C., Lim, S. F., McQuaid, J.,
Misztal, P., Moller, S. J., Monks, P. S., Nemitz, E., Oram, D. E., Owen, S. M., Phillips, G. J., Pugh, T.
A. M., Pyle, J. A., Reeves, C. E., Ryder, J., Siong, J., Skiba, U., and Stewart, D. J.: Nitrogen
management is essential to prevent tropical oil palm plantations from causing ground-level 540
ozone pollution, Proceedings of the National Academy of Sciences, 106, 18447-18451,
10.1073/pnas.0907541106, 2009.
Hickler, T., Smith, B., Prentice, I. C., MjÖFors, K., Miller, P., Arneth, A., and Sykes, M. T.: Co2 fertilization
in temperate face experiments not representative of boreal and tropical forests, Global Change
Hickler, T., Vohland, K., Feehan, J., Miller, P. A., Smith, B., Costa, L., Giesecke, T., Fronzek, S., Carter, T. R., Cramer, W., Kühn, I., and Sykes, M. T.: Projecting the future distribution of european potential
natural vegetation zones with a generalized, tree species-based dynamic vegetation model,
Global Ecology and Biogeography, 21, 50-63, 10.1111/j.1466-8238.2010.00613.x, 2012.
Hurtt, G. C., Chini, L. P., Frolking, S., Betts, R. A., Feddema, J., Fischer, G., Fisk, J. P., Hibbard, K., 550
Houghton, R. A., Janetos, A., Jones, C. D., Kindermann, G., Kinoshita, T., Klein Goldewijk, K., Riahi,
K., Shevliakova, E., Smith, S., Stehfest, E., Thomson, A., Thornton, P., van Vuuren, D. P., and
MANUSCRIP
T
ACCEPTED
ACCEPTED MANUSCRIPT
Wang, Y. P.: Harmonization of land-use scenarios for the period 1500–2100: 600 years of global
Kanakidou, M., Seinfeld, J., Pandis, S., Barnes, I., Dentener, F., Facchini, M., Dingenen, R. V., Ervens, B., Nenes, A., and Nielsen, C.: Organic aerosol and global climate modelling: A review, Atmos. Chem.
Phys., 5, 1053-1123, 2005.
Karl, M., Guenther, A., Köble, R., Leip, A., and Seufert, G.: A new european plant-specific emission
inventory of biogenic volatile organic compounds for use in atmospheric transport models, 560
Lathiere, J., Hauglustaine, D., Noblet-Ducoudré, D., Krinner, G., and Folberth, G.: Past and future changes 570
in biogenic volatile organic compound emissions simulated with a global dynamic vegetation
model, Geophysical Research letters, 32, 2005.
Lathiere, J., Hauglustaine, D., Friend, A., Noblet-Ducoudré, N. D., Viovy, N., and Folberth, G.: Impact of
climate variability and land use changes on global biogenic volatile organic compound emissions,
Atmos. Chem. Phys., 6, 2129-2146, 2006. 575 Lathiere, J., Hewitt, C., and Beerling, D.: Sensitivity of isoprene emissions from the terrestrial biosphere
to 20th century changes in atmospheric co2 concentration, climate, and land use, Glob.
Biogeochem. Cycle, 24, 2010.
Lelieveld, J., Butler, T. M., Crowley, J. N., Dillon, T. J., Fischer, H., Ganzeveld, L., Harder, H., Lawrence, M.
G., Martinez, M., Taraborrelli, D., and Williams, J.: Atmospheric oxidation capacity sustained by a 580
tropical forest, Nature, 452, 737-740, 2008.
Llorens, L., Llusià, J., Murchie, E. H., Peñuelas, J., and Beerling, D. J.: Monoterpene emissions and
photoinhibition of “living fossil” trees grown under co2 enrichment in a simulated cretaceous
polar environment, Journal of Geophysical Research: Biogeosciences, 114, G01005, 2009.
Loreto, F., Fischbach, R. J., Schnitzler, J.-P., Ciccioli, P., Brancaleoni, E., Calfapietra, C., and Seufert, G.: 585 Monoterpene emission and monoterpene synthase activities in the mediterranean evergreen
oak quercus ilex l. Grown at elevated co2 concentrations, Global Change Biology, 7, 709-717,
10.1046/j.1354-1013.2001.00442.x, 2001.
Loreto, F., and Schnitzler, J.-P.: Abiotic stresses and induced BVOCs, Trends Plant Sci., 15, 154-166, 2010.
Meinshausen, M., Smith, S. J., Calvin, K., Daniel, J. S., Kainuma, M. L. T., Lamarque, J. F., Matsumoto, K., 590
Montzka, S. A., Raper, S. C. B., Riahi, K., Thomson, A., Velders, G. J. M., and van Vuuren, D. P. P.:
The rcp greenhouse gas concentrations and their extensions from 1765 to 2300, Climatic Change,
109, 213-241, 10.1007/s10584-011-0156-z, 2011.
Mercado, L. M., Bellouin, N., Sitch, S., Boucher, O., Huntingford, C., Wild, M., and Cox, P. M.: Impact of
changes in diffuse radiation on the global land carbon sink, Nature, 458, 1014-1017, 2009. 595 Mills, G., Buse, A., Gimeno, B., Bermejo, V., Holland, M., Emberson, L., and Pleijel, H.: A synthesis of
aot40-based response functions and critical levels of ozone for agricultural and horticultural
crops, Atmos Environ, 41, 2630-2643, 2007.
Morales, P., Sykes, M. T., Prentice, I. C., Smith, P., Smith, B., Bugmann, H., Zierl, B., Friedlingstein, P.,
Viovy, N., Sabaté, S., Sánchez, A., Pla, E., Gracia, C. A., Sitch, S., Arneth, A., and Ogee, J.: 600
Comparing and evaluating process-based ecosystem model predictions of carbon and water
MANUSCRIP
T
ACCEPTED
ACCEPTED MANUSCRIPT
fluxes in major european forest biomes, Global Change Biology, 11, 2211-2233, 10.1111/j.1365-
2486.2005.01036.x, 2005.
Niinemets, U., Arneth, A., Kuhn, U., Monson, R. K., Penuelas, J., and Staudt, M.: The emission factor of
volatile isoprenoids: Stress, acclimation, and developmental responses, Biogeosciences, 7, 2203-605 2223, DOI 10.5194/bg-7-2203-2010, 2010a.
Niinemets, Ü., Tenhunen, J. D., Harley, P. C., and Steinbrecher, R.: A model of isoprene emission based
on energetic requirements for isoprene synthesis and leaf photosynthetic properties for
liquidambar and quercus, Plant, Cell & Environment, 22, 1319-1335, 10.1046/j.1365-
3040.1999.00505.x, 1999. 610
Niinemets, Ü., Seufert, G., Steinbrecher, R., and Tenhunen, J. D.: A model coupling foliar monoterpene
emissions to leaf photosynthetic characteristics in mediterranean evergreen quercus species,
New Phytol., 153, 257-275, 10.1046/j.0028-646X.2001.00324.x, 2002.
Niinemets, Ü., Monson, R. K., Arneth, A., Ciccioli, P., Kesselmeier, J., Kuhn, U., Noe, S. M., Peñuelas, J.,
and Staudt, M.: The leaf-level emission factor of volatile isoprenoids: Caveats, model algorithms, 615 response shapes and scaling, Biogeosciences, 7, 1809-1832, 10.5194/bg-7-1809-2010, 2010b.
Paasonen, P., Asmi, A., Petaja, T., Kajos, M. K., Aijala, M., Junninen, H., Holst, T., Abbatt, J. P. D., Arneth,
A., Birmili, W., van der Gon, H. D., Hamed, A., Hoffer, A., Laakso, L., Laaksonen, A., Leaitch, W. R.,
Plass-Dulmer, C., Pryor, S. C., Raisanen, P., Swietlicki, E., Wiedensohler, A., Worsnop, D. R.,
Kerminen, V. M., and Kulmala, M.: Warming-induced increase in aerosol number concentration 620
likely to moderate climate change, Nat Geosci, 6, 438-442, Doi 10.1038/Ngeo1800, 2013.
Pacifico, F., Folberth, G. A., Jones, C. D., Harrison, S. P., and Collins, W. J.: Sensitivity of biogenic isoprene
emissions to past, present, and future environmental conditions and implications for
Possell, M., Nicholas Hewitt, C., and Beerling, D. J.: The effects of glacial atmospheric co2 concentrations
and climate on isoprene emissions by vascular plants, Global Change Biology, 11, 60-69,
10.1111/j.1365-2486.2004.00889.x, 2005. 630
Riccobono, F., Schobesberger, S., Scott, C. E., Dommen, J., Ortega, I. K., Rondo, L., Almeida, J., Amorim,
A., Bianchi, F., Breitenlechner, M., David, A., Downard, A., Dunne, E. M., Duplissy, J., Ehrhart, S.,
Flagan, R. C., Franchin, A., Hansel, A., Junninen, H., Kajos, M., Keskinen, H., Kupc, A., Kürten, A.,
Kvashin, A. N., Laaksonen, A., Lehtipalo, K., Makhmutov, V., Mathot, S., Nieminen, T., Onnela, A., Petäjä, T., Praplan, A. P., Santos, F. D., Schallhart, S., Seinfeld, J. H., Sipilä, M., Spracklen, D. V., 635
Stozhkov, Y., Stratmann, F., Tomé, A., Tsagkogeorgas, G., Vaattovaara, P., Viisanen, Y., Vrtala, A.,
Wagner, P. E., Weingartner, E., Wex, H., Wimmer, D., Carslaw, K. S., Curtius, J., Donahue, N. M.,
Kirkby, J., Kulmala, M., Worsnop, D. R., and Baltensperger, U.: Oxidation products of biogenic
emissions contribute to nucleation of atmospheric particles, science, 344, 717-721,
10.1126/science.1243527, 2014. 640
Rosenfeld, D., Sherwood, S., Wood, R., and Donner, L.: Climate effects of aerosol-cloud interactions,
science, 343, 379-380, 2014.
Rosenkranz, M., Pugh, T. A. M., Schnitzler, J.-P., and Arneth, A.: Effect of land-use change and
Rosenstiel, T. N., Potosnak, M. J., Griffin, K. L., Fall, R., and Monson, R. K.: Increased co2 uncouples
growth from isoprene emission in an agriforest ecosystem, Nature, 421, 256-259, 2003.
Sanderson, M. G., Jones, C. D., Collins, W. J., Johnson, C. E., and Derwent, R. G.: Effect of climate change
on isoprene emissions and surface ozone levels, Geophysical Research letters, 30, 1936,
10.1029/2003gl017642, 2003. 650
MANUSCRIP
T
ACCEPTED
ACCEPTED MANUSCRIPT
Schurgers, G., Arneth, A., Holzinger, R., and Goldstein, A. H.: Process-based modelling of biogenic
monoterpene emissions combining production and release from storage, Atmos. Chem. Phys., 9,
3409-3423, 2009a.
Schurgers, G., Hickler, T., Miller, P. A., and Arneth, A.: European emissions of isoprene and monoterpenes from the last glacial maximum to present, Biogeosciences, 6, 2779-2797, 2009b. 655
Schurgers, G., Arneth, A., and Hickler, T.: Effect of climate-driven changes in species composition on
regional emission capacities of biogenic compounds, JOURNAL OF GEOPHYSICAL RESEARCH-
ATMOSPHERES, 116, Doi 10.1029/2011jd016278, 2011.
Sitch, S., Smith, B., Prentice, I. C., Arneth, A., Bondeau, A., Cramer, W., Kaplan, J. O., Levis, S., Lucht, W.,
Sykes, M. T., Thonicke, K., and Venevsky, S.: Evaluation of ecosystem dynamics, plant geography 660
and terrestrial carbon cycling in the lpj dynamic global vegetation model, Global Change Biology,
9, 161-185, DOI 10.1046/j.1365-2486.2003.00569.x, 2003.
Sitch, S., Cox, P., Collins, W., and Huntingford, C.: Indirect radiative forcing of climate change through
ozone effects on the land-carbon sink, Nature, 448, 791-794, 2007. Smith, B., Prentice, I. C., and Sykes, M. T.: Representation of vegetation dynamics in the modelling of 665
terrestrial ecosystems: Comparing two contrasting approaches within european climate space,
Global Ecology and Biogeography, 10, 621-637, 10.1046/j.1466-822X.2001.t01-1-00256.x, 2001.
Squire, O. J., Archibald, A. T., Abraham, N. L., Beerling, D. J., Hewitt, C. N., Lathière, J., Pike, R. C., Telford,
P. J., and Pyle, J. A.: Influence of future climate and cropland expansion on isoprene emissions
Steeghs, M., Bais, H. P., de Gouw, J., Goldan, P., Kuster, W., Northway, M., Fall, R., and Vivanco, J. M.:
Proton-transfer-reaction mass spectrometry as a new tool for real time analysis of root-secreted
volatile organic compounds in arabidopsis, Plant Physiology, 135, 47-58, 2004. Taylor, K. E., J., S. R., and Meehl, G. A.: An overview of cmip5 and the experiment design, Bull. Am.
Figure 4. Isoprene (a, c) and monoterpene (b,d) emissions (Mt C yr-1) for potential natural vegetation (a,
b) and accounting for land-use (LU) changes (c, d). Simulations were performed using climate forcing 745
from MPI-ESM for the emissions scenarios RCP 4.5 & 8.5, and their respective land-use change
projections (see table 1). The same results are presented for climate forcing from different GCMs in
figure S3.
MANUSCRIP
T
ACCEPTED
ACCEPTED MANUSCRIPT
750
Figure 5. Present-day (1971-2000) BVOC emissions (g C yr-1 m-2) with-without land-use change for
isoprene (a) and monoterpenes (b) using MPI climate forcing under RCP 4.5 and LU 4.5; gridcells with
permanent ice cover are not represented. Green areas indicate a decrease in emissions when land-use
change is taken into account. 755
760
Figure 6. Trends in future isoprene (a) and monoterpene (b) emissions (Mt C yr-1), using the MPI-ESM
climate model, and RCP 4.5 CO2 pathways for all different RCP land-use (LU) scenarios.
765
MANUSCRIP
T
ACCEPTED
ACCEPTED MANUSCRIPT
Figure 7. Difference in isoprene (a) and monoterprene (b) emissions (gC yr-1 m-2) for future (2071-2100) MPI-ESM-
LR RCP 4.5 climate between LU 8.5 – LU 4.5 land-use projections. Gridcells covered with permanent ice are not
represented
770
MANUSCRIP
T
ACCEPTED
ACCEPTED MANUSCRIPT
Figure S1. Atmospheric CO2 mixing ratio and global cropland and pasture cover for historical time and
projections for the future based on the different RCP scenarios used, adapted from Meinshausen et al.
(2011) and Hurtt et al. (2011) respectively. 775
0
100
200
300
400
500
600
700
800
900
1000
1900 1950 2000 2050 2100
CO
2co
nce
ntr
ati
on
(pp
m)
year
RCP 4.5
RCP 8.5
MANUSCRIP
T
ACCEPTED
ACCEPTED MANUSCRIPT
780
Figure S2. Agricultural and pasture land cover for the year 2005 and the mean for the different RCP
scenarios over the years 2070-2100 from Hurtt et al. (2011).
MANUSCRIP
T
ACCEPTED
ACCEPTED MANUSCRIPT
785
Figure S3. Isoprene (a, c) and monoterpene (b,d) emissions (Mt C yr-1) for potential natural vegetation (a,
b) and accounting for land-use (LU) changes (bottom, d). Simulations were performed for a set of
different GCMs, emissions scenarios, and land-use change projections (see table 1).
790
MANUSCRIP
T
ACCEPTED
ACCEPTED MANUSCRIPT
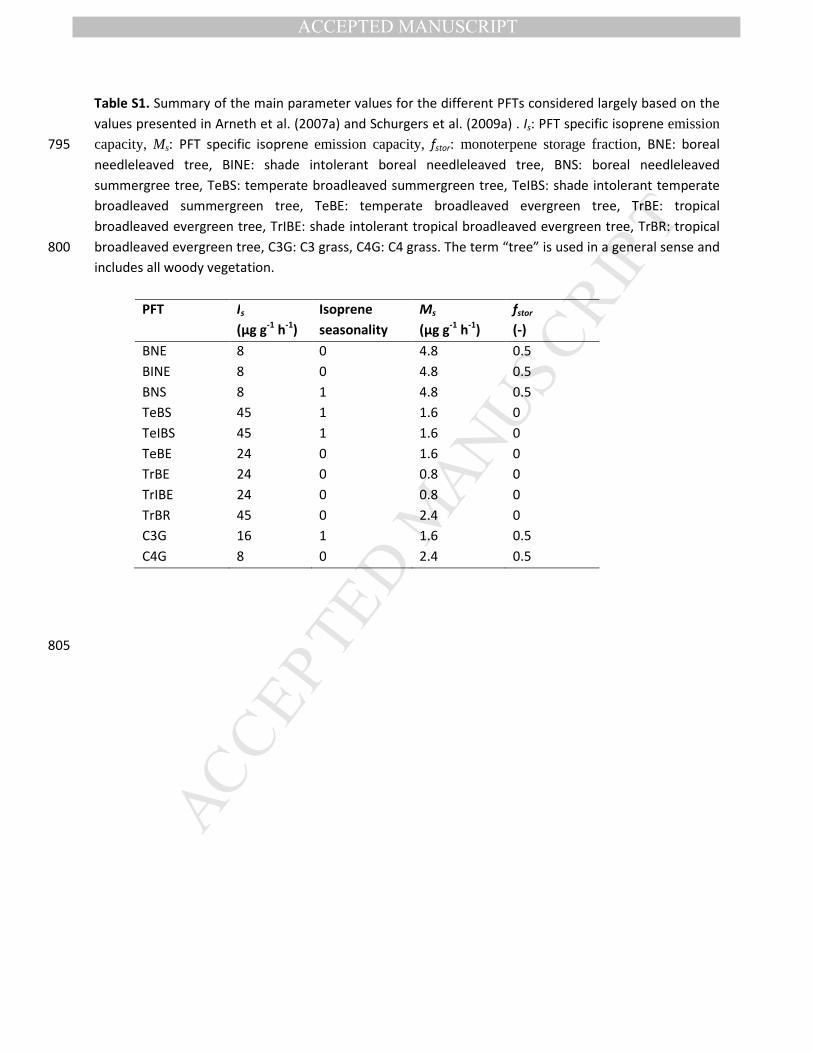
Table S1. Summary of the main parameter values for the different PFTs considered largely based on the
values presented in Arneth et al. (2007a) and Schurgers et al. (2009a) . Is: PFT specific isoprene emission capacity, Ms: PFT specific isoprene emission capacity, fstor: monoterpene storage fraction, BNE: boreal 795