40
KPMG.com Global IT-BPO Outsourcing Deals Analysis Global IT-BPO Outsourcing Deals Analysis February 2016
KPMG.com
Global IT-BPO Outsourcing Deals AnalysisGlobal IT-BPO Outsourcing Deals Analysis
February 2016

© 2016 KPMG International Cooperative (“KPMG International”), a Swiss entity. Member firms of the KPMG network of independent firms are affiliated with KPMG International. KPMG International provides no client services. No member firm has any authority to obligate or bind KPMG International or any other member firm vis-à-vis third parties, nor does KPMG International have any such authority to obligate or bind any member firm. All rights reserved. 2
About global IT-BPO outsourcing deals analysisThe KPMG Shared Services and Outsourcing Advisory (SSOA) practice publishes a quarterly analysis on IT-BPO outsourcing contracts signed across industries and geographies, with a total contract value (TCV) of USD5 million and above per deal.
Methodology and limitations of the study:
The analysis and findings presented in this report are based on select third party deal databases including publicly available outsourcing data as identified throughout this presentation. It does not include contract information gathered from KPMG Sourcing Advisory business engagements.
The count and value of the deals may vary notably in reality and is only indicative of market movements and trends in the IT-BPO space. Readers are requested to use their discretion while assessing the global IT-BPO market accordingly.
For more information on this market research please get in touch with Shailesh Narwaiye ([email protected]).

© 2016 KPMG International Cooperative (“KPMG International”), a Swiss entity. Member firms of the KPMG network of independent firms are affiliated with KPMG International. KPMG International provides no client services. No member firm has any authority to obligate or bind KPMG International or any other member firm vis-à-vis third parties, nor does KPMG International have any such authority to obligate or bind any member firm. All rights reserved. 3
ForewordWe are at the beginning of 2016 and it is worthwhile looking back at the achievements and roadblocks of the past year and plan for a better future.
The SSOA practice is pleased to bring to you the year-end 2015 edition of the KPMG Global IT-BPO Outsourcing Deals Analysis.
The current edition looks at IT-BPO outsourcing contracts signed in the last three years, from 2013 to 2015, and identifies the major trends influencing the market across geographies. This report also includes the regular analysis feature for the latest quarter Q4-2015 (October – December).
In 2015, the number of deals signed globally in the IT-BPO space were 891 with a total contract value (TCV) of USD 159.1 billion. Of the three years (2013 - 15) analyzed in this report, the year 2015 is the strongest year for outsourcing. A continuous rise in average TCV year on year since 2013 is seen even though there were interim movements in TCV and number of contracts signed on either side of the axis in same period.
Like in previous years, dominant sectors like Defense and Government have seen a significant drop in TCV in the last quarter of 2015, while sectors like Automotive and Aerospace, Insurance and Retail have grown since 2014.
Hope you will find these market trends on the IT-BPO deals useful. Happy reading!

© 2016 KPMG International Cooperative (“KPMG International”), a Swiss entity. Member firms of the KPMG network of independent firms are affiliated with KPMG International. KPMG International provides no client services. No member firm has any authority to obligate or bind KPMG International or any other member firm vis-à-vis third parties, nor does KPMG International have any such authority to obligate or bind any member firm. All rights reserved. 4
Table of content
Section 1 Global deals – An overview
Section 2 Deal analysis: 2015
Section 3 Deals by geography
Section 4 4Q15 deal analysis
Section 5 IT-BPO outsourcing outlook
Section 1Global deals – An overview
© 2016 KPMG International Cooperative (“KPMG International”), a Swiss entity. Member firms of the KPMG network of independent firms are affiliated with KPMG International. KPMG International provides no client services. No member firm has any authority to obligate or bind KPMG International or any other member firm vis-à-vis third parties, nor does KPMG International have any such authority to obligate or bind any member firm. All rights reserved. 6
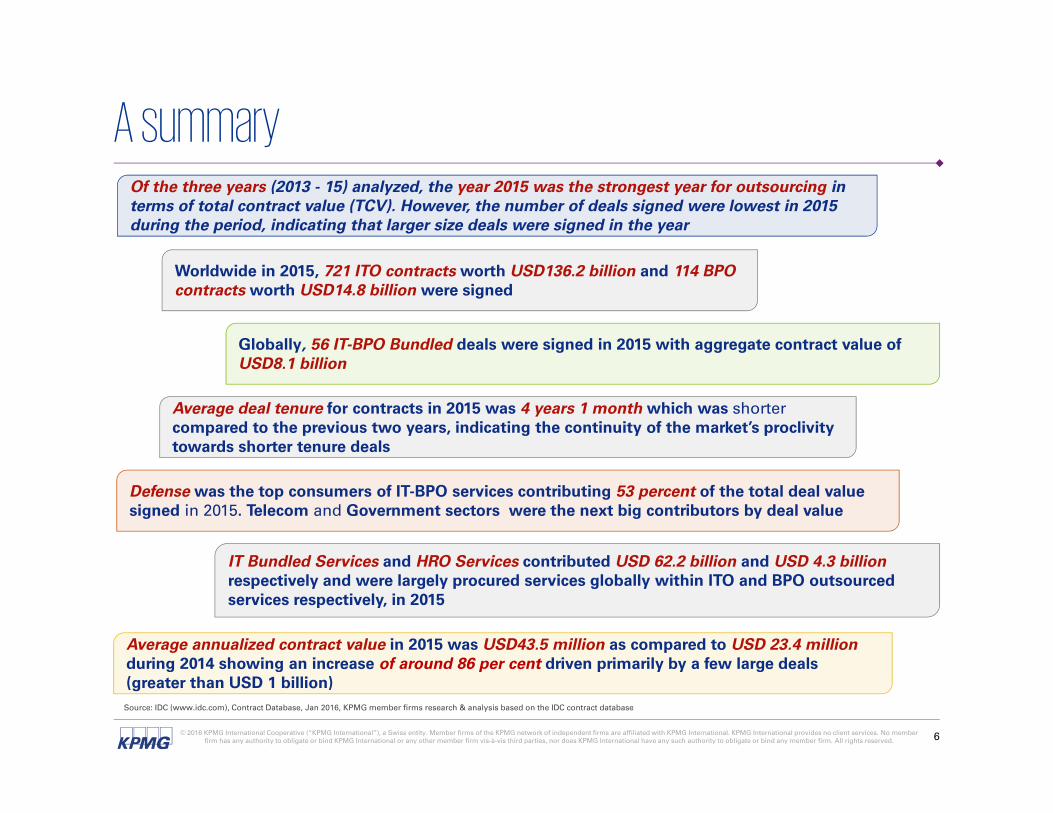
A summaryOf the three years (2013 - 15) analyzed, the year 2015 was the strongest year for outsourcing in terms of total contract value (TCV). However, the number of deals signed were lowest in 2015 during the period, indicating that larger size deals were signed in the year
IT Bundled Services and HRO Services contributed USD 62.2 billion and USD 4.3 billionrespectively and were largely procured services globally within ITO and BPO outsourced services respectively, in 2015
Worldwide in 2015, 721 ITO contracts worth USD136.2 billion and 114 BPO contracts worth USD14.8 billion were signed
Globally, 56 IT-BPO Bundled deals were signed in 2015 with aggregate contract value of USD8.1 billion
Defense was the top consumers of IT-BPO services contributing 53 percent of the total deal value signed in 2015. Telecom and Government sectors were the next big contributors by deal value
Average deal tenure for contracts in 2015 was 4 years 1 month which was shorter compared to the previous two years, indicating the continuity of the market’s proclivity towards shorter tenure deals
Source: IDC (www.idc.com), Contract Database, Jan 2016, KPMG member firms research & analysis based on the IDC contract database
Average annualized contract value in 2015 was USD43.5 million as compared to USD 23.4 millionduring 2014 showing an increase of around 86 per cent driven primarily by a few large deals (greater than USD 1 billion)

© 2016 KPMG International Cooperative (“KPMG International”), a Swiss entity. Member firms of the KPMG network of independent firms are affiliated with KPMG International. KPMG International provides no client services. No member firm has any authority to obligate or bind KPMG International or any other member firm vis-à-vis third parties, nor does KPMG International have any such authority to obligate or bind any member firm. All rights reserved. 7
Quarterly movements of global IT-BPO deals*
• 2015 showed an upturn in the deal activity in terms of value with a 32 percent increase though the total number of deals decreased
• As in previous quarters, 4Q15 also witnessed a downfall in deal movements as compared to the third quarter with total deal value down by nearly 41 percent and total number of deals decreasing by almost 56 percent as compared to 3Q15
• The average deal value increased by 33 percent as compared to 3Q15
20.3
43.9 53.3
28.0 25.2 29.139.8
26.421.8
75.9
38.822.8
299
426 422
326
259
316 324
245
192
334
253
112
Q1 Q2 Q3 Q4 Q1 Q2 Q3 Q4 Q1 Q2 Q3 Q4
2013 2014 2015
Value (USD billion) No. of deals* The term deals is interchangeably used with contracts throughout the analysis unless otherwise specified. Deals analyzed are global sourcing contracts of size USD 5.0 million and above only.
Source: IDC (www.idc.com), Contract Database, Jan 2016, KPMG member firms research & analysis based on the IDC contract database
Total deal value
USD 145.5 billion
Number of deals
1,473
Total deal value
USD120.4 billion -17%
Number of deals
1,144-22%
Total deal value
USD 159.1 billion
Number of deals
891
32%
-22%
Deal Value
4Q15
4Q14-14%
No. of deals4Q14
4Q15
-54%
Global quarterly deal movements- Snapshot

© 2016 KPMG International Cooperative (“KPMG International”), a Swiss entity. Member firms of the KPMG network of independent firms are affiliated with KPMG International. KPMG International provides no client services. No member firm has any authority to obligate or bind KPMG International or any other member firm vis-à-vis third parties, nor does KPMG International have any such authority to obligate or bind any member firm. All rights reserved. 8
Annualized contract value (ACV)- Y-o-Y comparison
Annualized* contract value comparison, 2013-15
• There was a 45 per cent increase in total annualized contract value in 2015 as compared to 2014
• There was an 86 per cent increase in average annualized contract value in 2015 as against 2014, while the average deal tenure decreased to 4 years 1 month from 4 years 4 months
* Annualized contract value = ( total value of a contract / tenure in months ) x 12
Contract value for contracts having tenure less than 1 year is considered as annualized value for the analysis. Graph is not to scale and only represents the division across different parameters
Source: IDC (www.idc.com), Contract Database, Jan 2016, KPMG member firms research & analysis based on the IDC contract database
32,000
26,796
38,723
2013
2014
2015
Total Annualized Contract Value (USD million)
Average annualized contract value (USD million)
Average tenure per contract
Note: All values in USD million unless otherwise specified
Minimum annualized contract
value
Maximum annualized contract
value
86% increase
1,211
1,724
0.40
0.86
4 years 4 months
23.42
21.72
2014
2013
5,2710.78
2015
43.46
4 years 1 months
4 years 7 months
16% decrease
45% increase
© 2016 KPMG International Cooperative (“KPMG International”), a Swiss entity. Member firms of the KPMG network of independent firms are affiliated with KPMG International. KPMG International provides no client services. No member firm has any authority to obligate or bind KPMG International or any other member firm vis-à-vis third parties, nor does KPMG International have any such authority to obligate or bind any member firm. All rights reserved. 9
Sector analysis- Y-o-Y comparison
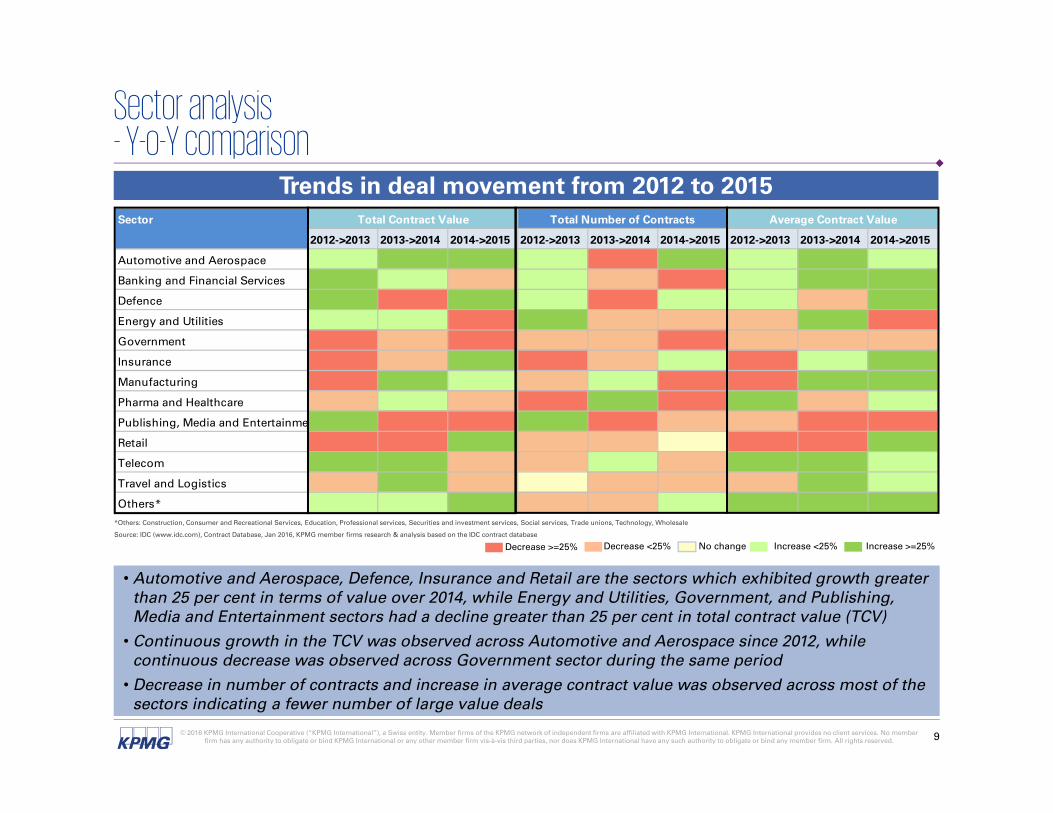
Trends in deal movement from 2012 to 2015
• Automotive and Aerospace, Defence, Insurance and Retail are the sectors which exhibited growth greater than 25 per cent in terms of value over 2014, while Energy and Utilities, Government, and Publishing, Media and Entertainment sectors had a decline greater than 25 per cent in total contract value (TCV)
• Continuous growth in the TCV was observed across Automotive and Aerospace since 2012, while continuous decrease was observed across Government sector during the same period
• Decrease in number of contracts and increase in average contract value was observed across most of the sectors indicating a fewer number of large value deals
Sector
2012->2013 2013->2014 2014->2015 2012->2013 2013->2014 2014->2015 2012->2013 2013->2014 2014->2015
Automotive and Aerospace 5% 183% 86% 5% -39% 50% 1% 365% 24%
Banking and Financial Services 40% 25% -18% 24% -21% -45% 13% 58% 48%
Defence 31% -53% 192% 10% -49% 17% 19% -8% 150%
Energy and Utilities 10% 21% -46% 29% -24% -24% -15% 60% -29%
Government -33% -15% -58% -22% -11% -55% -14% -5% -8%
Insurance -72% -6% 173% -41% -19% 5% -52% 16% 161%
Manufacturing -48% 42% 5% -5% 11% -33% -45% 27% 57%
Pharma and Healthcare -3% 15% -8% -51% 35% -26% 99% -15% 24%
Publishing, Media and Entertainme 105% -63% -52% 109% -35% -13% -2% -43% -44%
Retail -40% -46% 197% -18% -15% 0% -27% -36% 197%
Telecom 26% 28% -18% -23% 2% -23% 63% 26% 6%
Travel and Logistics -15% 65% -4% 0% -14% -16% -15% 91% 15%
Others* 22% 10% 62% -12% -13% 10% 39% 27% 47%
Total Contract Value Total Number of Contracts Average Contract Value
*Others: Construction, Consumer and Recreational Services, Education, Professional services, Securities and investment services, Social services, Trade unions, Technology, Wholesale
Source: IDC (www.idc.com), Contract Database, Jan 2016, KPMG member firms research & analysis based on the IDC contract database
Decrease >=25% Decrease <25% Increase <25% Increase >=25%No change
© 2016 KPMG International Cooperative (“KPMG International”), a Swiss entity. Member firms of the KPMG network of independent firms are affiliated with KPMG International. KPMG International provides no client services. No member firm has any authority to obligate or bind KPMG International or any other member firm vis-à-vis third parties, nor does KPMG International have any such authority to obligate or bind any member firm. All rights reserved. 10
Deal analysis - Y-o-Y comparison
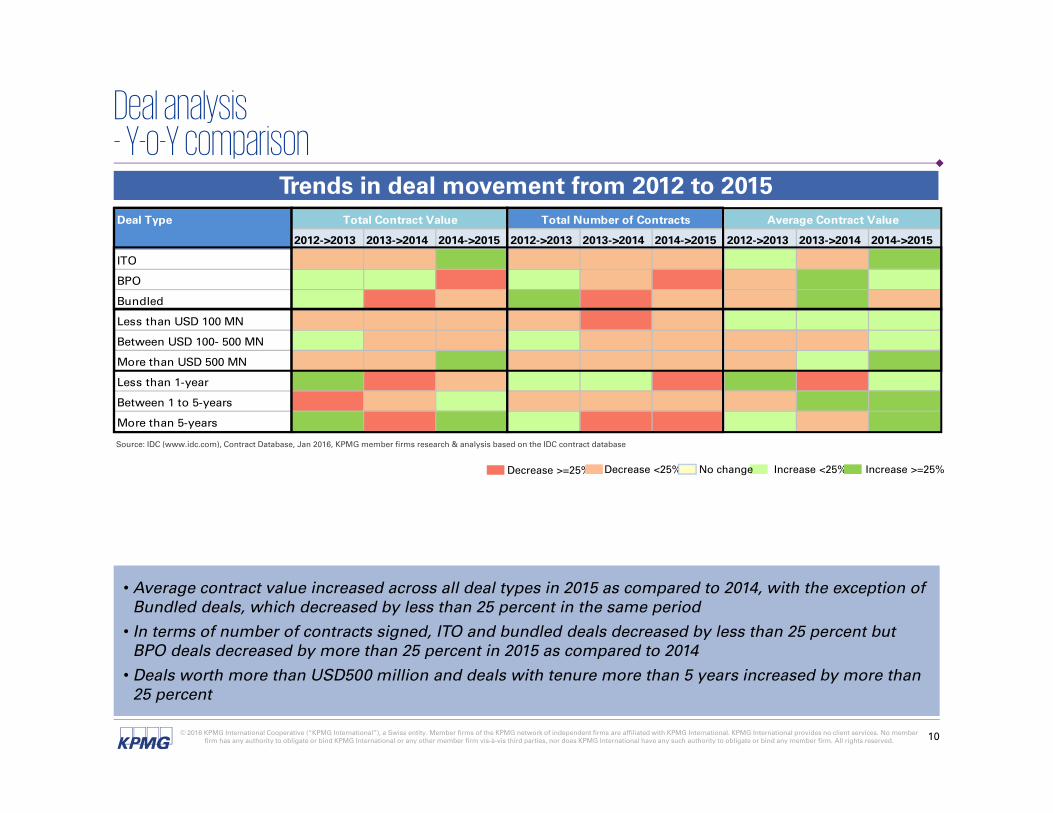
Trends in deal movement from 2012 to 2015
• Average contract value increased across all deal types in 2015 as compared to 2014, with the exception of Bundled deals, which decreased by less than 25 percent in the same period
• In terms of number of contracts signed, ITO and bundled deals decreased by less than 25 percent but BPO deals decreased by more than 25 percent in 2015 as compared to 2014
• Deals worth more than USD500 million and deals with tenure more than 5 years increased by more than 25 percent
Deal Type
2012->2013 2013->2014 2014->2015 2012->2013 2013->2014 2014->2015 2012->2013 2013->2014 2014->2015
ITO -6% -22% 57% -14% -17% -19% 9% -6% 94%
BPO 4% 17% -37% 9% -23% -40% -4% 52% 4%
Bundled 8% -27% -19% 27% -57% -15% -15% 67% -4%
Less than USD 100 MN -7% -25% -20% -10% -25% -23% 3% 0% 4%
Between USD 100- 500 MN 2% -23% -4% 5% -11% -22% -3% -13% 22%
More than USD 500 MN -7% -3% 103% -2% -20% -5% -6% 21% 113%
Less than 1-year 123% -27% -13% 11% 15% -28% 102% -36% 21%
Between 1 to 5-years -29% -1% 6% -14% -24% -19% -17% 31% 31%
More than 5-years 40% -32% 71% 15% -27% -28% 22% -6% 137%
Total Contract Value Total Number of Contracts Average Contract Value
Source: IDC (www.idc.com), Contract Database, Jan 2016, KPMG member firms research & analysis based on the IDC contract database
Decrease >=25% Decrease <25% Increase <25% Increase >=25%No change

Section 2Deal analysis: 2015

© 2016 KPMG International Cooperative (“KPMG International”), a Swiss entity. Member firms of the KPMG network of independent firms are affiliated with KPMG International. KPMG International provides no client services. No member firm has any authority to obligate or bind KPMG International or any other member firm vis-à-vis third parties, nor does KPMG International have any such authority to obligate or bind any member firm. All rights reserved. 12
Deal value - Global sourcing snapshot: 2015
IT-BPO deals* signed in 2015 (Total contract value: USD159.1 billion)
• ITO deals contributed 86 per cent of the total deal value in 2015, a 14 percentage point increase from contribution in 2014
• While ITO deals grew by 57 per cent, BPO deals and Bundled deals decreased by 37 per cent and 19 per cent respectively in 2015 as compared to 2014 in terms of total deal value
• Organizations from the AMERICAS region continue to contribute to majority of the deals, followed by EMA. Contribution by ASPAC has continued to increase over the years – from 7 per cent in 2014 to 10 per cent in 2015
ITO136.2
BPO14.8
Bundled8.1
Americas97.5
EMA45.1
ASPAC16.5
Less than USD 100 MN19.7
Between USD 100- 500 MN48.7
More than USD 500 MN90.7
Less than 1-year2.1
Between 1 to 5-years72.2
More than 5-years84.8
Fixed Price115.6
Hybrid40.2
2.8 0.5
Services Region Contract Value Tenure Pricing
* Deals analyzed are USD5.0 million and above only, throughout the analysis. Graph is not to scale and only represents the division across different parameters. Figures may not add up to 100 per cent due to rounding off
# Hybrid pricing includes a combination of various pricing mechanisms
Source: IDC (www.idc.com), Contract Database, Jan 2016, KPMG member firms research & analysis based on the IDC contract database
Total contract
value
USD159.1 billion
0%
10%
20%
30%
40%
50%
60%
70%
80%
90%
100% OthersTime & Material
#

© 2016 KPMG International Cooperative (“KPMG International”), a Swiss entity. Member firms of the KPMG network of independent firms are affiliated with KPMG International. KPMG International provides no client services. No member firm has any authority to obligate or bind KPMG International or any other member firm vis-à-vis third parties, nor does KPMG International have any such authority to obligate or bind any member firm. All rights reserved. 13
Number of deals - Global sourcing snapshot: 2015
IT-BPO deals* signed in 2015 (Total number of contracts: 891)
• Though the contracts under USD100 million in TCV continue to contribute to the majority of the deals, their volume or count has decreased by 23 per cent in 2015 over 2014
• The distribution of number of contracts across different tenure buckets displayed similar trend in 2015 as in 2014, with long tenure deals (more than 5-years) contributing 19 per cent and shorter tenure deals (less than 1-year) contributing 9 per cent
• 93 per cent share by volume was contributed by deals having either Hybrid or Fixed price model in 2015
ITO721
BPO114
Bundled56
Americas453
EMA316
ASPAC122
Less than USD 100 MN651
Between USD 100- 500 MN202
More than USD 500 MN38
Less than 1-year84
Between 1 to 5-years638
More than 5-years169
Fixed Price725
Hybrid101
596
Services Region Contract Value Tenure Pricing
Total contracts
891
0%
10%
20%
30%
40%
50%
60%
70%
80%
90%
100%
* Deals analyzed are USD5.0 million and above only, throughout the analysis. Graph is not to scale and only represents the division across different parameters. Figures may not add up to 100 per cent due to rounding off # Hybrid pricing includes a combination of various pricing mechanismsSource: IDC (www.idc.com), Contract Database, Jan 2016, KPMG member firms research & analysis based on the IDC contract database
#
OthersTime & Material

© 2016 KPMG International Cooperative (“KPMG International”), a Swiss entity. Member firms of the KPMG network of independent firms are affiliated with KPMG International. KPMG International provides no client services. No member firm has any authority to obligate or bind KPMG International or any other member firm vis-à-vis third parties, nor does KPMG International have any such authority to obligate or bind any member firm. All rights reserved. 14
Sector analysis- IT-BPO deals across sectors by value and numbers
Sector-wise break-up of deals in 2015
• Automotive and Aerospace and Telecom sectors became major contributors with total contribution of 54 per cent to total deal value in 4Q14, replacing Defence and Government sectors which had a total contribution of 15 per cent
• Insurance, Automotive and Aerospace and Travel and Logistics have exhibited multi-fold growth in terms of TCV and average contract value in 4Q15 as compared to 3Q15
5.3
1.2
0.9
1.6
0.8 1.0
0.2 0.05 0.1
1.6 1.1
7.0
1.1
0.5
0.1 0.1 0.1
2.2
0.9
1.9
0.2 0.4
2.9
4.3 56.3
5.7
2.5
1.1 0.2
0.7
2.2
1.1
0.0 0.1 0.6
6.0
0.8
20.7
2.8
1.2
2.3
6.6
1.40.7
0.1 0.10.0
0.7
5.7
0.7
0.0
3.3
Banking and
Financial Services
Insurance Automotive and
Aerospace
Travel and Logistics
Manufacturing Energy and
Utilities
Pharma and
Healthcare
Publishing, Media and
Entertainment
Retail Telecom Others * Defence Government
No. of contracts* Others: Construction, Consumer and Recreational Services, Education, Professional services, Securities and investment services, Social services, Trade unions, Technology, WholesaleGraph is not to scale and only represents the division across different parameters. Figures may not add up to 100 per cent due to rounding offSource: IDC (www.idc.com), Contract Database, Jan 2016, KPMG member firms research & analysis based on the IDC contract database
Q1-2015 Q2-2015 Q3-2015 Q4-2015
1177
657
9
3 2
17
30
10
22
12
2 2
9
31
21
12
22
65 6650
139
30
2
13
76
10
16
10 11 9 10
32
41
15Dea
l Val
ue
(US
D b
illio
n)
7
24
10 7 74
7
20
10
32
2

Section 3Deals by geography

© 2016 KPMG International Cooperative (“KPMG International”), a Swiss entity. Member firms of the KPMG network of independent firms are affiliated with KPMG International. KPMG International provides no client services. No member firm has any authority to obligate or bind KPMG International or any other member firm vis-à-vis third parties, nor does KPMG International have any such authority to obligate or bind any member firm. All rights reserved. 16
Geography Analysis- IT-BPO deals across geographies: Y-o-Y Comparison
Geography-wise break-up of deals*
• AMERICAS continues to be the major outsourcer of IT-BPO services, its contribution in terms of total deal value has increased in 2015 (61 percent) as compared to 2014 (54 percent)
• Deal values in EMA declined in 2015 contributing around 28 percent to the total deal value globally as compared to 39 percent in 2014
• ASPAC contribution is still the lowest (10 percent) of geographies in terms of the total deal value but has shown more than 100 percent increase over 2014
AMERICAS EMA
ASPAC
Total Contract Value (USD billion) No. of ContractsDeals analyzed are global sourcing contracts of size USD 5.0 million and above only. Source: IDC (www.idc.com), Contract Database, Jan 2016, KPMG member firms research & analysis based on the IDC contract database
97.6
64.9
97.5
887
649
453
2013 2014 20158.8 8.0
16.5
134 97
122
2013 2014 2015
39.1 47.5 45.1
452 398
316
2013 2014 2015

AMERICAS

© 2016 KPMG International Cooperative (“KPMG International”), a Swiss entity. Member firms of the KPMG network of independent firms are affiliated with KPMG International. KPMG International provides no client services. No member firm has any authority to obligate or bind KPMG International or any other member firm vis-à-vis third parties, nor does KPMG International have any such authority to obligate or bind any member firm. All rights reserved. 18
Geography analysis- IT-BPO deals in AMERICAS: Value and number of deals
Geography-wise break-up of deals*
• Total deal value of AMERICAS has increased by 50 per cent in 2015 as compared to 2014, due to a large number of deals signed in 2Q15
• After strong market activity in 2Q15, total deal value had a sharp drop in the next two quarters for AMERICAS
• In terms of volume of deals signed, 2015 displayed similar quarterly movement as previous years
• ITO deal comprised 79 per cent of the deals signed by volume in the year 2015
6.2
28.0 33.0
10.2 4.8
15.1 11.6 7.3 4.1
59.4
22.7
2.3
3.5
2.5
3.2
4.6
0.4
1.1 16.9
0.9 1.0
2.7
1.6
0.1
2.5
2.1
0.6
1.2
0.2
1.2
2.9
2.6 2.0
1.2
0.4
0.0
Q1 Q2 Q3 Q4 Q1 Q2 Q3 Q4 Q1 Q2 Q3 Q4
2013 2014 2015
ITO BPO Bundled
121
202 191
132
89
169
108 95
72
147
109
2937 35 56
30
6 26
93
21 5
53
8 217 53 6 7 6 11 10 15 22 4 11
Q1 Q2 Q3 Q4 Q1 Q2 Q3 Q4 Q1 Q2 Q3 Q4
2013 2014 2015
ITO BPO Bundled* Deals originating from the geographySource: IDC (www.idc.com), Contract Database, Jan 2016, KPMG member firms research & analysis based on the IDC contract database

© 2016 KPMG International Cooperative (“KPMG International”), a Swiss entity. Member firms of the KPMG network of independent firms are affiliated with KPMG International. KPMG International provides no client services. No member firm has any authority to obligate or bind KPMG International or any other member firm vis-à-vis third parties, nor does KPMG International have any such authority to obligate or bind any member firm. All rights reserved. 19
Geography analysis- IT-BPO deals in AMERICAS
Sector-wise break-up of deals
• Government and Defence sector of AMERICAS region remain the strongest users of outsourcing in 2015 with total contribution of 90 per cent to deal value
• Defence and Insurance were the only sectors which displayed significant increase in the deal value in 2015 over 2014, though Insurance was coming off of a very low 2014 base
* Others: Consumer and recreational services, Construction, Education, Professional services, Securities and investment services, Technology, Wholesale
Graph is not to scale and only represents the division across different parameters. Figures may not add up to 100 per cent due to rounding offSource: IDC (www.idc.com), Contract Database, Jan 2016, KPMG member firms research & analysis based on the IDC contract database No. of deals
All figures in USD billion
2013 2014 2015
2.2
0.3 0.1 0.2 0.9
1.9
0.7
1.3 0.5
1.7
1.5
60.5
25.8
2.3
0.2 0.2 0.4
2.9
1.8
0.3 0.4 0.2
2.6
0.9
28.1 24.5
1.4
0.4 0.1 0.1
1.8 1.7
0.2 0.2 0.3
2.3
0.9
80.5
7.6
Bankingand
Financial Services
Insurance Automotive and
Aerospace
Travel and Logistics
Manufacturing Energy and
Utilities
Pharma and
Healthcare
Publishing, Media and
Entertainment
Retail Telecom Others* Defence Government
444
243
31
8
23 22
11
18
29
7
10
6
35
225222
29
62
16
37
16
8 6
17
36
29
14
7
4
9
22 18
6
9
1115
24
259
55

© 2016 KPMG International Cooperative (“KPMG International”), a Swiss entity. Member firms of the KPMG network of independent firms are affiliated with KPMG International. KPMG International provides no client services. No member firm has any authority to obligate or bind KPMG International or any other member firm vis-à-vis third parties, nor does KPMG International have any such authority to obligate or bind any member firm. All rights reserved. 20
Geography analysis- IT-BPO deals country comparison: AMERICAS
Top five countries by TCV (USD million) in 2015
1. USA
4. Canada
3. Brazil5. Peru
2. Mexico
7
60
3
10
8
41,188
452
5,0912,396
82,181
23
273
120
2,400 31
955
1
70
2,234
2
44
* Deals originating from the geographySource: IDC (www.idc.com), Contract Database, Jan 2016, KPMG member firms research & analysis based on the IDC contract database
No. of deals
ITOBPO Bundled

EMA

© 2016 KPMG International Cooperative (“KPMG International”), a Swiss entity. Member firms of the KPMG network of independent firms are affiliated with KPMG International. KPMG International provides no client services. No member firm has any authority to obligate or bind KPMG International or any other member firm vis-à-vis third parties, nor does KPMG International have any such authority to obligate or bind any member firm. All rights reserved. 22
Geography analysis- IT-BPO deals in EMA: Value and number of deals
Geography-wise break-up of deals*
• EMA replaced AMERICAS as the major outsourcing region for 4Q15, contributing 71 per cent to the total deal value
• 84 per cent of the IT-BPO Bundled deals signed in 4Q15 originated from EMA region
• Number of deals signed in EMA region decreased by 21 per cent in 2015 as compared to 2014
• Contribution of EMA to total volume of deals signed has been almost consistent varying from 31 – 35 per cent during 2013 to 2015
1.9 4.4
12.4
7.3
15.3
8.4
3.6
13.1
9.6
5.1 4.8
13.0
0.4
2.7
1.4
1.8
1.4
1.1
0.9
0.9
0.8
4.8 2.8
1.0
3.2
2.4
0.5
0.6
0.7
0.0
1.7
0.2
0.2 0.5
0.3
2.2
Q1 Q2 Q3 Q4 Q1 Q2 Q3 Q4 Q1 Q2 Q3 Q4
2013 2014 2015
ITO BPO Bundled
51
65
107
89
121
64
77 83
62 72
67
47
16 20 28 15
10 15
4 6 4 18 14 8
32
18 2 9
1 2 12
3 12 3 6
3Q1 Q2 Q3 Q4 Q1 Q2 Q3 Q4 Q1 Q2 Q3 Q4
2013 2014 2015
ITO BPO Bundled* Deals originating from the geographySource: IDC (www.idc.com), Contract Database, Jan 2016, KPMG member firms research & analysis based on the IDC contract database

© 2016 KPMG International Cooperative (“KPMG International”), a Swiss entity. Member firms of the KPMG network of independent firms are affiliated with KPMG International. KPMG International provides no client services. No member firm has any authority to obligate or bind KPMG International or any other member firm vis-à-vis third parties, nor does KPMG International have any such authority to obligate or bind any member firm. All rights reserved. 23
Geography analysis- IT-BPO deals in EMA
Sector-wise break-up of deals
• Telecom and Banking sectors continue to be the dominant consumer of IT-BPO services in the EMA region, however, 2015 saw strong growth in Automotive and Aerospace, and Insurance sectors
• After a strong year in 2013, Government sector in EMA witnessed continuous decrease in deal activity with a decrease of 30 per cent in 2015 over 2014
6.5
1.4 1.2 1.7 2.7 2.9
1.4 0.3 0.6
8.6
2.1 0.2
9.48.3
1.5
4.0
3.3 2.5
4.0
1.6 0.2 0.4
12.7
3.2
0.0
5.9
7.6
3.5
7.7
3.5 3.6
0.2 1.9
0.1 1.4
5.0 5.6
0.9
4.1
* Others: Consumer and recreational services, Construction, Education, Professional services, Securities and investment services, Technology, Wholesale
Graph is not to scale and only represents the division across different parameters. Figures may not add up to 100 per cent due to rounding off
Source: IDC (www.idc.com), Contract Database, Jan 2016, KPMG member firms research & analysis based on the IDC contract database No. of dealsAll figures in USD billion
2013 2014 2015
Banking and
Financial Services
Insurance Automotive and
Aerospace
Travel and Logistics
Manufacturing Energy and
Utilities
Pharma and
Healthcare
Publishing, Media and
Entertainment
Retail Telecom Others* Defence Government
13 14
55
67
18
13
33
4038
8
43
108
38
16
10
26
3732
15
9 10
61
40
102
26
13
17
2426
8
11
4
14
4752
3
71
22

© 2016 KPMG International Cooperative (“KPMG International”), a Swiss entity. Member firms of the KPMG network of independent firms are affiliated with KPMG International. KPMG International provides no client services. No member firm has any authority to obligate or bind KPMG International or any other member firm vis-à-vis third parties, nor does KPMG International have any such authority to obligate or bind any member firm. All rights reserved. 24
Geography analysis- IT-BPO deals country comparison: EMA
Top five countries by TCV (USD million) in 2015
* Deals originating from the geographySource: IDC (www.idc.com), Contract Database, Jan 2016, KPMG member firms research & analysis based on the IDC contract database
1. United Kingdom
2. Sweden
5. Switzerland
3. Germany
54
9
66673
5,449
16
1
4
19
6,693
718
4,643
7
29
8,000
2,653
2,252 2,269 4. Norway
13
2
No. of deals
ITOBPO Bundled

ASPAC

© 2016 KPMG International Cooperative (“KPMG International”), a Swiss entity. Member firms of the KPMG network of independent firms are affiliated with KPMG International. KPMG International provides no client services. No member firm has any authority to obligate or bind KPMG International or any other member firm vis-à-vis third parties, nor does KPMG International have any such authority to obligate or bind any member firm. All rights reserved. 26
Geography analysis- IT-BPO deals in ASPAC: Value and number of deals
Geography-wise break-up of deals*
• The outsourcing market in ASPAC continues to grow with an increase of over 100 per cent in total deal value over 2014
• Contribution by ASPAC has been continuously increasing to 10 per cent in 2015 from 7 per cent in 2014 and 6 per cent in 2013
• 95 per cent of the deals signed by volume in ASPAC region in the year 2015 are ITO deals
• Both the BPO market and the bundled deals market have been stagnant in terms of number of deals signed in ASPAC
* Deals originating from the geographySource: IDC (www.idc.com), Contract Database, Jan 2016, KPMG member firms research & analysis based on the IDC contract database
2.5
1.4 2.1 2.2 2.2 2.1 1.9
1.3
4.1
2.2
5.3
3.6
0.01
0.1
0.03 0.02 0.01 - 0.1
0.01
-
0.0
0.0
-0.18
0.3 0.02 0.01
0.08 - 0.2
0.07
0.02
0.0
0.8
0.42
Q1 Q2 Q3 Q4 Q1 Q2 Q3 Q4 Q1 Q2 Q3 Q4
2013 2014 2015
ITO BPO Bundled
18
30 29
40
23 29
12
19 14
35
46
21
2 2 2
3 1 0
6
1 1 1 5 1
1 1 2 0 2 2 1 1 1
1
Q1 Q2 Q3 Q4 Q1 Q2 Q3 Q4 Q1 Q2 Q3 Q4
2013 2014 2015
ITO BPO Bundled

© 2016 KPMG International Cooperative (“KPMG International”), a Swiss entity. Member firms of the KPMG network of independent firms are affiliated with KPMG International. KPMG International provides no client services. No member firm has any authority to obligate or bind KPMG International or any other member firm vis-à-vis third parties, nor does KPMG International have any such authority to obligate or bind any member firm. All rights reserved. 27
Geography analysis- IT-BPO deals in ASPAC
Sector-wise break-up of deals
• Telecom and Defence are the top outsourcing sectors in the ASPAC region for 2015. Together, these sectors contributed 70 per cent of the TCV
• Several sectors like Energy and Utilities, Defence, Insurance, Government and Manufacturing demonstrated multifold increase in TCV in 2015 over 2014
* Others: Consumer and recreational services, Construction, Education, Professional services, Securities and investment services, Technology, Wholesale
Graph is not to scale and only represents the division across different parameters. Figures may not add up to 100 per cent due to rounding offSource: IDC (www.idc.com), Contract Database, Jan 2016, KPMG member firms research & analysis based on the IDC contract database No. of deals
All figures in USD million
2013 2014 2015
580
7 169
590
305 55 10 59 21
5,115
341 341
1,2371,128
- 28 304
172 53
432
- 6
4,436
241
648 542 536
723
- 196 480
1,245
57 - 171
8,820
458
2,693
1,098
7
1
15
7 6
1
4
1
41
3
118
29
Banking and
Financial Services
Insurance Automotive and
Aerospace
Travel and Logistics
Manufacturing Energy and
Utilities
Pharma and
Healthcare
Publishing, Media and
Entertainment
Retail Telecom Others* Defence Government
16
0
2
8
4
2
4
0
1
30
89
13
6
3
0
9
4
12
3
0
3
36
910
27

© 2016 KPMG International Cooperative (“KPMG International”), a Swiss entity. Member firms of the KPMG network of independent firms are affiliated with KPMG International. KPMG International provides no client services. No member firm has any authority to obligate or bind KPMG International or any other member firm vis-à-vis third parties, nor does KPMG International have any such authority to obligate or bind any member firm. All rights reserved. 28
Geography analysis- IT-BPO deals country comparison: ASPAC
Top five countries by TCV (USD million) in 2015
* Deals originating from the geographySource: IDC (www.idc.com), Contract Database, Jan 2016, KPMG member firms research & analysis based on the IDC contract database
1. India
416
3. Australia
2. China
4. Hong Kong
4. Russia
2
4 52
21
19
1
5
661
2
16 450
5,764
25
4,098
770
2,366
No. of deals
ITOBPO Bundled

Section 44Q15 deal analysis

© 2016 KPMG International Cooperative (“KPMG International”), a Swiss entity. Member firms of the KPMG network of independent firms are affiliated with KPMG International. KPMG International provides no client services. No member firm has any authority to obligate or bind KPMG International or any other member firm vis-à-vis third parties, nor does KPMG International have any such authority to obligate or bind any member firm. All rights reserved. 30
Deal value - Global sourcing snapshot: October to December 2015
IT-BPO deals* signed in 4Q15 (Total contract value: USD22.8 billion)
• ITO deals continue to dominate the outsourcing space with a contribution of 83 per cent to total deal value signed in 4Q15
• EMA emerged as the major outsourcing region contributing 71 per cent to the total deal value in 4Q15, followed by ASPAC with 18 per cent and AMERICAS with 11 per cent contribution respectively
• 4Q15 saw the continued dominance of Fixed Price contracting model, contributing 57 per cent of the deal value, followed by Hybrid model contributing 38 per cent.
* Deals analyzed are USD5.0 million and above only, throughout the analysis. Graph is not to scale and only represents the division across different parameters. Figures may not add up to 100 per cent due to rounding off
# Hybrid pricing includes a combination of various pricing mechanisms
Source: IDC (www.idc.com), Contract Database, Jan 2016, KPMG member firms research & analysis based on the IDC contract database
Total contract
value
USD22.8 billion
ITO19.0
BPO1.1
Bundled2.7
Americas2.4
EMA16.3
ASPAC4.1
Less than USD 100 MN2.1
Between USD 100- 500 MN5.3
More than USD 500 MN15.3
Less than 1-year0.4
Between 1 to 5-years17.9
More than 5-years4.5
Fixed Price13.0
Hybrid8.7
1.0
Services Region Contract Value Tenure Pricing0%
10%
20%
30%
40%
50%
60%
70%
80%
90%
100%Time & Material
#

© 2016 KPMG International Cooperative (“KPMG International”), a Swiss entity. Member firms of the KPMG network of independent firms are affiliated with KPMG International. KPMG International provides no client services. No member firm has any authority to obligate or bind KPMG International or any other member firm vis-à-vis third parties, nor does KPMG International have any such authority to obligate or bind any member firm. All rights reserved. 31
Number of deals - Global sourcing snapshot: October to December 2015
IT-BPO deals* signed in 4Q15 (Total number of contracts: 112)
• Though ITO deals contributed to 87 per cent of the volume of outsourcing deals signed in 4Q15, their count has decreased by 56 per cent in 4Q15 over 3Q15
• 71 per cent of the deals, in terms of number of deals signed in 4Q15, were of value less than USD100 million
• Deals with tenure between 1 to 5 years were largest in number, comprising 79 per cent to the deals signed in 4Q15. Long tenure deals with tenure more than 5 years made 9 per cent of the total number of deals
* Deals analyzed are USD5.0 million and above only, throughout the analysis. Graph is not to scale and only represents the division across different parameters. Figures may not add up to 100 per cent due to rounding off
# Hybrid pricing includes a combination of various pricing mechanisms
Source: IDC (www.idc.com), Contract Database, Jan 2016, KPMG member firms research & analysis based on the IDC contract database
ITO97
BPO10
Bundled5
Americas32
EMA58
ASPAC22
Less than USD 100 MN79
Between USD 100- 500 MN25
More than USD 500 MN8
Less than 1-year14
Between 1 to 5-years88
More than 5-years10
Fixed Price101
Hybrid3
8
Services Region Contract Value Tenure Pricing
Total contracts
112
0%
10%
20%
30%
40%
50%
60%
70%
80%
90%
100%
#
Time & Material

© 2016 KPMG International Cooperative (“KPMG International”), a Swiss entity. Member firms of the KPMG network of independent firms are affiliated with KPMG International. KPMG International provides no client services. No member firm has any authority to obligate or bind KPMG International or any other member firm vis-à-vis third parties, nor does KPMG International have any such authority to obligate or bind any member firm. All rights reserved. 32
Services segmentation - ITO services
Analysis of ITO deals 4Q15
• ICT Services and IT Bundled together contributed to 56 per cent of all ITO deals in terms of value and 41 per cent in terms of number of deals during 4Q15
• IT Consulting and IT Infrastructure services have displayed multifold growth in terms of total contract value in 4Q15 as compared to 3Q15
Number of dealsNote: Size of bubble indicates percentage share of the total number of ITO deals
SI – System Integration, Other IT services – Software testing, IT Education and Training, SaaS
Source: IDC (www.idc.com), Contract Database, Jan 2016, KPMG member firms research & analysis based on the IDC contract database
Value of contracts (USD Billion)Note: All values in USD billion. Scale of graph is just representative to illustrate the division across different parameters. Figures may not add up to 100 per cent due to rounding off. Refer L.H.S. figure for legend
Source: IDC (www.idc.com), Contract Database, Jan 2016, KPMG member firms research & analysis based on the IDC contract database
2.30.0
3.4
7.2
1.39
2.7
0.2 0.11.1
0.6
ADM10%
ERP1%
ICT Services22%
IT Bundled services
19%
IT Consulting11%
IT Infrastructure6%
IT Products9%
Other IT Services, 3%
SI8%
SMAC10%
0
1
2
3
4
5
6
7
8
0 10 20 30
To
tal v
alu
e o
f co
ntr
acts
(U
SD
Bill
ion
)
19.0
ADM ERP TotalITO
ICT IT Bundled
ITInfra.
ITProducts
SMACSIIT Conslt.
Other ITServices

© 2016 KPMG International Cooperative (“KPMG International”), a Swiss entity. Member firms of the KPMG network of independent firms are affiliated with KPMG International. KPMG International provides no client services. No member firm has any authority to obligate or bind KPMG International or any other member firm vis-à-vis third parties, nor does KPMG International have any such authority to obligate or bind any member firm. All rights reserved. 33
Services segmentation - BPO services
Analysis of BPO deals 4Q15
• SCM contributed to 62 per cent of all BPO deals in terms of value and 70 per cent in terms of number of deals during 4Q15
• Content Management contributed 27 per cent and KPO services contributed 8 per cent to total deal value of BPO deals signed in 4Q15
-
300
0 095
31
701
Content Management
10%
KPO10%
Other BPO Services
10%
SCM70%
0
100
200
300
400
500
600
700
800
0 4 8
1,126
BPOBundledServices
Content Mgmt.
CRM TotalBPO
HRO KPO OtherBPO
Services
To
tal v
alu
e o
f co
ntr
acts
(US
D
Mill
ion
)
SCM
Number of deals Value of contracts (USD Million)Note: Size of bubble indicates percentage share of the total number of BPO deals
Other BPO services – Data management, logistics etc.
Source: IDC (www.idc.com), Contract Database, Jan 2016, KPMG member firms research & analysis based on the IDC contract database
Note: All values in USD million. Scale of graph is just representative to illustrate the division across different parameters. Figures may not add up to 100 per cent due to rounding off. Refer L.H.S. figure for legend
Source: IDC (www.idc.com), Contract Database, Jan 2016, KPMG member firms research & analysis based on the IDC contract database

Section 5IT-BPO outsourcing outlook

© 2016 KPMG International Cooperative (“KPMG International”), a Swiss entity. Member firms of the KPMG network of independent firms are affiliated with KPMG International. KPMG International provides no client services. No member firm has any authority to obligate or bind KPMG International or any other member firm vis-à-vis third parties, nor does KPMG International have any such authority to obligate or bind any member firm. All rights reserved. 35
Outlook- Global outsourcing industry■ The number of BPO deals has been decreasing since 2013 with organizations typically looking for
alternative options for cost reduction, such as greater use of shared services, it remains to be seen as to whether this is portent of a shrinking business process offshoring pie.
■ Longer term, BPO deals and providers will likely be heavily impacted by the maturation of cognitive computing and robotics process automation, as will likely the ITO market to a lesser degree. Clients can benefit from both an efficiency and effectiveness standpoint, but many providers will likely struggle to evolve away from a reliance on large workforces and labor arbitrage
■ 2015 ended on a similar note like previous years - with strong second and third quarters against weak first and fourth quarters. However the average deal value increased by 70 per cent in 2015 vis-à-vis 2014, indicating that larger size deals were signed in the year
■ Buyers seem cautious about models that include outcome-based pricing while hybrid and fixed pricing model are preferred, contributing to more than 95 per cent of the deal value over the last three years. The same trend is most likely to continue in 2016
■ AMERICAS appear to show a reduced dominance in the global buyer market for outsourcing services although it continues to be the major outsourcing region contributing 61 per cent of the total deal value in 2015. EMA is gaining momentum gradually with ASPAC fast catching up
■ Organizations seem to be moving from a traditional silo-based and transactional outsourcing services, to more of a holistic end-to-end approach through bundled deals
■ Leading GBS organizations will likely focus on moving beyond a narrow cost savings focus to delivering more value-added business services, for example, via data and analytics to support business initiatives such as market expansion, product management and M&A efforts1
■ IT infrastructure outsourcing continues to be impacted by the fundamental transition in procuring outsourced services using traditional methods (e.g., more labor oriented) to using more automated methods in the form of cloud-based outsourced services2
1 KPMG LLP and Horses for Sources published report- ‘2016 predictions for outsourcing and GBS’, December 16, 2015
2 IDC Worldwide and U.S. IS Outsourcing Services 2015–2019 Forecast
Source: IDC (www.idc.com), Contract Database, Jan 2016, KPMG member firms research & analysis based on the IDC contract database

© 2016 KPMG International Cooperative (“KPMG International”), a Swiss entity. Member firms of the KPMG network of independent firms are affiliated with KPMG International. KPMG International provides no client services. No member firm has any authority to obligate or bind KPMG International or any other member firm vis-à-vis third parties, nor does KPMG International have any such authority to obligate or bind any member firm. All rights reserved. 36
KPMG Shared Services and Outsourcing Advisory (SSOA) research
To learn more, log on to https://institutes.kpmg.us/institutes/shared-services-outsourcing-institute.html/Advice Worth Keeping Blog: http://blog.equaterra.com/Advice Worth Keeping podcast series: http://www.kpmginstitutes.com/shared-services-outsourcing-institute/events/podcast_series/advice-worth-keeping-podcast-series.aspxGlobal IT-BPO Outsourcing Deals Analysis: http://www.kpmg.com/IN/en/IssuesAndInsights/ArticlesPublications/KPMG-Deal-Tracker/Pages/Default.aspx
Latest from the KPMG Shared Services and Outsourcing Institute
•How Cloud, Application Programming Interfaces (APIs) Are Transforming Outsourcing
•Strategic Visions on the Sourcing Market 2016
•Top Trend Predictions in 2016
About KPMG InstitutesKPMG Institutes is dedicated to helping organizations and their stakeholders identify and understand emerging trends, risks and opportunities. We do this by creating an open forum where peers can exchange insights, share leading practices, and access the latest thought leadership publications.As a result, corporate executives, business managers, industry leaders, government officials, academics, and others have access to the thought leadership documents and knowledge which they can use to make better informed decisions and meet their marketplace challenges.

© 2016 KPMG International Cooperative (“KPMG International”), a Swiss entity. Member firms of the KPMG network of independent firms are affiliated with KPMG International. KPMG International provides no client services. No member firm has any authority to obligate or bind KPMG International or any other member firm vis-à-vis third parties, nor does KPMG International have any such authority to obligate or bind any member firm. All rights reserved. 37
Glossary (1/2)Terms Definition
ACV annualized contract value = ( total value of a contract/tenure in months ) x 12
AMERICAS North America and South America
ASPAC Asia and Oceania
BPO Business Process Outsourcing
EMA Europe, Middle East and Africa
ITO Information Technology Outsourcing
TCV Total contract value

© 2016 KPMG International Cooperative (“KPMG International”), a Swiss entity. Member firms of the KPMG network of independent firms are affiliated with KPMG International. KPMG International provides no client services. No member firm has any authority to obligate or bind KPMG International or any other member firm vis-à-vis third parties, nor does KPMG International have any such authority to obligate or bind any member firm. All rights reserved. 38
Glossary (2/2)Terms DefinitionITO ServicesADM Application development and maintenanceERP Enterprise resource planning implementation and support services
ICT Services Information and communication technology services (e.g. contact center technology, telecommunication, and related services)
IT Bundled Services Any combination of two or more IT services mentioned aboveIT Consulting Information technology consulting services
IT Infrastructure IT hardware deployment (e.g. data center outsourcing, network management, hardware deploy and support, hosting services, etc.)
IT Products Software products typically developed and branded by IT companies and sold as own Intellectual Property
Other IT Services Typically services that do not fall in other buckets (e.g. Software testing, IT helpdesk support services, Cyber security)
SMAC Social, Mobile, Analytics and Cloud services (i.e. Social Media, Mobility, Analytics and Cloud computing)
System Integration IT system integration services (application or enterprise system integration services)BPO ServicesBPO Bundled Services Any combination of two or more BPO services mentioned aboveContent Management Data management services (e.g. document management, print management, etc.)CRM Customer Relationship Management solutions and servicesF&A Finance and Accounting servicesHRO Human Resource outsourcing servicesKPO Knowledge process outsourcing services
Other BPO Services Typically services that do not fall in other buckets (e.g. Industry specific processes, Facilities Management)
SCM Supply Chain Management services (including procurement, logistics etc.)

© 2016 KPMG International Cooperative (“KPMG International”), a Swiss entity. Member firms of the KPMG network of independent firms are affiliated with KPMG International. KPMG International provides no client services. No member firm has any authority to obligate or bind KPMG International or any other member firm vis-à-vis third parties, nor does KPMG International have any such authority to obligate or bind any member firm. All rights reserved. 39
KPMG contacts:
Jehil ThakkarPartner – Advisory
ServicesKPMG in India
+91 22 3090 [email protected]
Viral ThakkerPartner – Advisory
ServicesKPMG in India
+91 22 3090 [email protected]
Stan Lepeak Director – Global
Research, Management
ConsultingKPMG in the US+1 203 458 0677
KPMG.com
Thank youAnalyst Team Contact:Shailesh Narwaiye KPMG in India+91 20 3050 [email protected]
Analysts (KPMG in India): Esther JaydeviSwati KumariAishwaryaa Ghumre
The information contained herein is of a general nature and is not intended to address the circumstances of any particular individual or entity. Although we endeavour to provide accurate and timely information, there can be no guarantee that such information is accurate as of the date it is received or that it will continue to be accurate in the future. No one should act on such information without appropriate professional advice after a thorough examination of the particular situation.© 2016 KPMG International Cooperative (“KPMG International”), a Swiss entity. Member firms of the KPMG network of independent firms are affiliated with KPMG International. KPMG International provides no client services. No member firm has any authority to obligate or bind KPMG International or any other member firm vis-à-vis third parties, nor does KPMG International have any such authority to obligate or bind any member firm. All rights reserved.


