International Aluminium Institute 10 Charles II Street, London, SW1Y 4AA, UK | + 44 20 7930 0528 | www.world-aluminium.org | Company Reg: 1052007 GLOBAL LIFE CYCLE INVENTORY DATA FOR THE PRIMARY ALUMINIUM INDUSTRY 2010 DATA FINAL AUGUST 2013
Transcript
International Aluminium Institute 10 Charles II Street, London, SW1Y 4AA, UK | + 44 20 7930 0528 | www.world-aluminium.org | Company Reg: 1052007
The collection of global aluminium industry data for use in life cycle assessments was
initiated by the International Aluminium Institute (IAI) Board in 1998 with the following
resolution:
“The Board of Directors of the International Aluminium Institute desires that the
Institute develop as complete an understanding as possible of the positive
contributions that the aluminium makes to the environmental and economic well-
being of the world’s population; of any negative economic or environmental
impacts that its production may cause; and of the balance between these
positives and negatives during the entire “life cycle” of the material.”
This Global Life Cycle Inventory Data for the Primary Aluminium Industry report is an update
for data year 2010, following similar reports for 2000 and 2005. It has been prepared with
an objective to collect all significant life cycle inventory (LCI) data (raw materials and energy
use, emissions to air and water, solid waste generated) on primary aluminium ingot
production from bauxite ore, at the global level.
This report demonstrates the global aluminium industry’s dedication to report openly its
environmental impacts and to publish regularly the latest and most representative LCI data
possible. As such, this 2010 report is the reference material for aluminium environmental
assessments and its use is to be considered as mandatory for life cycle practitioners. Some
data are collected more regularly and this report will be updated on an annual basis with
such data as they become available.
From 2005 to 2010 world primary aluminium production increased by almost 30%, and
environmental performance improvements took place through strong investments in new
large-scale production capacities and phasing out of old plants. Achievements included
reduction of perfluorocarbon (PFC) air emissions (by 40% per tonne Al), polycyclic aromatic
hydrocarbon (PAH) air emissions (by 50% per tonne Al) and of spent pot lining (SPL) solid
waste landfilled (by 45% per tonne Al).
4
4
4
1. Goal and scope
The purpose of this inventory report is to characterize accurately and at the global level resource inputs and
significant environmental releases associated with the production of primary aluminium.
The collected data serves as a credible basis for subsequent life cycle assessments (LCA) of aluminium
products.
1.1 Process description and system boundaries
Primary aluminium production includes the following unit processes:
bauxite mining;
alumina production (from bauxite);
anode production (including production of Prebake anodes and Søderberg paste);
electrolysis (including Prebake and Søderberg technologies);
ingot casting.
Unit process descriptions are reported in Appendix A.
The inter-relationship of these unit processes is shown in the flow diagram in Appendix A, which provides an
overview of material input flows. The primary aluminium production process can be summarized as follows:
aluminium is extracted from bauxite as aluminium oxide (alumina); this oxide is then broken down through an
electrolysis process into oxygen, emitted as CO2 by reaction with a carbon anode, and aluminium as liquid
metal; this molten aluminium is cast into ingots, the usual form suitable for further fabrication of semi-finished
aluminium products.
Relevant background processes not documented in the present work are specified in the flow diagram in
Appendix A, outside of the dotted line which indicates the scope of this study.
Such additional unit processes (in particular energy carrier production and production of raw materials such
as petrol coke, pitch and caustic soda) have not been added to the in-scope processes in order to avoid non-
elementary flows. Life cycle practitioners who will use the data of this report may include such additional unit
processes from alternative databases1.
1 Care should be exercised when using data in this report on air emissions from fuel combustion, namely particulates, SO2 and NOx emissions. Facilities surveyed for this report delivered data on fuel combustion emissions for improved reliability, in particular to reflect the impact on SO2 emissions of actual sulfur content in combusted fuel oil. Accordingly life cycle practitioners are recommended to remove their data on particulates, SO2 and NOx emissions, in order to avoid double counting. This applies only to fuel combustion and not to “pre-combustion” data.
5
5
5
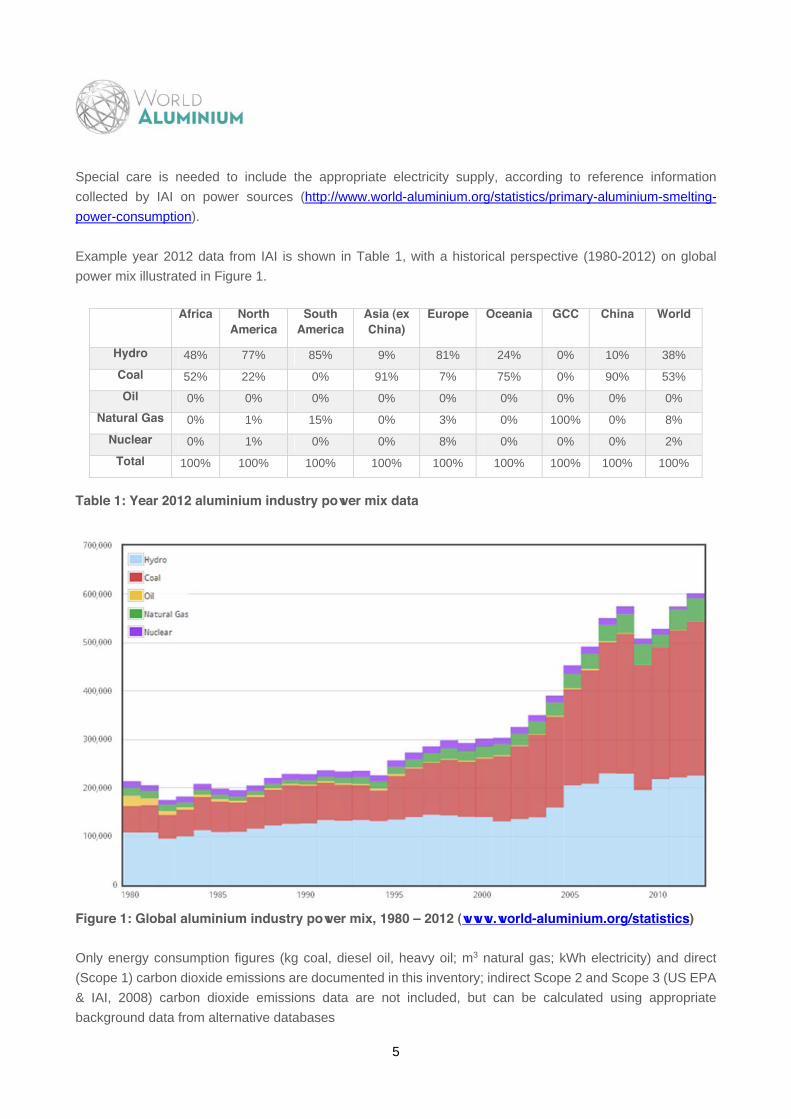
Special care is needed to include the appropriate electricity supply, according to reference information
collected by IAI on power sources (http://www.world-aluminium.org/statistics/primary-aluminium-smelting-
power-consumption).
Example year 2012 data from IAI is shown in Table 1, with a historical perspective (1980-2012) on global
power mix illustrated in Figure 1.
Africa North
America
South
America
Asia (ex
China)
Europe Oceania GCC China World
Hydro 48% 77% 85% 9% 81% 24% 0% 10% 38%
Coal 52% 22% 0% 91% 7% 75% 0% 90% 53%
Oil 0% 0% 0% 0% 0% 0% 0% 0% 0%
Natural Gas 0% 1% 15% 0% 3% 0% 100% 0% 8%
Nuclear 0% 1% 0% 0% 8% 0% 0% 0% 2%
Total 100% 100% 100% 100% 100% 100% 100% 100% 100%
Table 1: Year 2012 aluminium industry power mix data
Figure 1: Global aluminium industry power mix, 1980 – 2012 (www.world-aluminium.org/statistics)
Only energy consumption figures (kg coal, diesel oil, heavy oil; m3 natural gas; kWh electricity) and direct
(Scope 1) carbon dioxide emissions are documented in this inventory; indirect Scope 2 and Scope 3 (US EPA
& IAI, 2008) carbon dioxide emissions data are not included, but can be calculated using appropriate
background data from alternative databases
6
6
6
Data related to the transport of materials are covered for the first time in this report. They are recorded as
bauxite and alumina transport distances per 1,000 kg of product (tkm).
1.2 Data selection
This report contains only as-collected data for the calendar year 2010. Selection of data categories for this
inventory was based on their environmental relevance, either specific to primary aluminium production or as
generally acknowledged environmental issues. These data are listed along with explanatory notes in Appendix
A.
1.3 Reference flow and allocation
For each unit process the reference flow is 1,000 kg of product. For the whole primary aluminium process as
shown above, the reference flow is 1,000 kg of primary aluminium ingot.
For the ingot casting unit process, the reference flow has been specified to exclude the contribution of remelt
or recycled aluminium, which is considered outside the scope of the present work.
Thus, the overall average from the survey results for the ingot casting process yields a higher mass output
(1,062 kg) than the corresponding electrolysis metal input (971 kg), due to a “cold metal” contribution from
remelt (50 kg remelt ingot) and recycled (23 kg external scrap) aluminium. This cold metal contribution is
excluded by adjusting all inputs and outputs from the survey average by a factor of 0.94, calculated as follows:
(electrolysis metal + alloy additives = 990 kg)/(total metal input – scrap output sold = 1,062 kg – 5 kg) = 0.94
According to the ISO standards (14040 and 14044) on LCA, this can be described as a situation of joint
processes where a mass allocation approach is applied.
Further allocation is not relevant as there are no co-products resulting from the unit processes described in
this study.
1.4 Primary aluminium production mass balance
This section describes the main component distribution of the mass flow to 1,000 kg primary aluminium output
from 5,571 kg of bauxite input.
5,571 kg of bauxite is the average input mass for production of alumina (aluminium oxide). However there is
always a significant water component in the bauxite, typically around 20 % (c. 1,000 kg). The non aluminium-
containing part of the bauxite is disposed of as bauxite residue (2,614 kg) or recycled (5 kg). The mass of
7
7
7
material output from the alumina production process is thus around 2,000 kg, after deduction of water and
bauxite residue.
Aluminium oxide (alumina) is chemically reduced in the electrolysis process as follows, with a stoichiometric
minimum requirement of 1,889 kg Al2O3 per 1,000 kg of primary aluminium.
2 Al2O3 + 3C = 4 Al + 3CO2
While the majority of the oxygen in alumina fully reacts with the carbon anode to form carbon dioxide, some
forms carbon monoxide (which subsequently forms CO2 with oxygen from the atmosphere). Thus average net
anode consumption (439 kg) is higher than the theoretical mass predicted by stoichiometric analysis (333 kg).
1.5 Geographic system boundary
The scope of this report is global and as such wherever reporting production percentages are shown these
refer to global production numbers. Unfortunately data of sufficient quality was not available from the Chinese
aluminium industry, which represents around 40% of global production. The geographical survey coverage is
discussed further in section 2.
8
8
8
2. Data collection
Data was collected through a number of surveys of IAI member and reporting companies, which together
covered the entire scope of the inventory:
the 2010 Life Cycle Survey, where survey forms were designed in order to collect all required LCI data
except those already collected through established annual IAI surveys:
o http://world-aluminium.org/media/filer_public/2013/01/15/2010_lci_survey_questionnaire.xls
the 2010 Energy Surveys:
o http://world-aluminium.org/media/filer_public/2013/01/15/iai_form_es011.pdf
o http://world-aluminium.org/media/filer_public/2013/01/15/iai_form_es001.pdf
o http://world-aluminium.org/media/filer_public/2013/01/15/iai_form_es001a.pdf
o http://world-aluminium.org/media/filer_public/2013/01/15/iai_form_es001d.pdf
the 2010 Anode Effect (PFC) Survey:
o http://world-aluminium.org/media/filer_public/2013/01/15/pfc001.pdf
Survey forms were sent out to statistical correspondents of all IAI members and reporting companies in early
2011 requesting data for the 2010 period. The values reported were assessed alongside previously reported
values (standardised to per tonne of relevant product) to identify anomalous figures, either as a function of
deviation from the 2010 data distribution or substantial change within facilities over time from 2000 or 2005.
Plants were queried on these figures, which were then confirmed or amended. This data collection and
processing was monitored by a dedicated life cycle data review group, itself reporting to the IAI Environment
& Energy Committee.
All averages, unless otherwise identified are production weighted mean values per tonne of relevant production
output (i.e. excluding production of those plants that do not report for a particular question). In some
circumstances this methodology does not accurately reflect specific process features and so alternative
approaches have been applied – these are clearly identified as such and are fully explained in Section 3.
Data reporting, trends and issues are further discussed in Section 4. Detailed results of the inventory analysis
by process are reported in Appendix A.
9
9
9
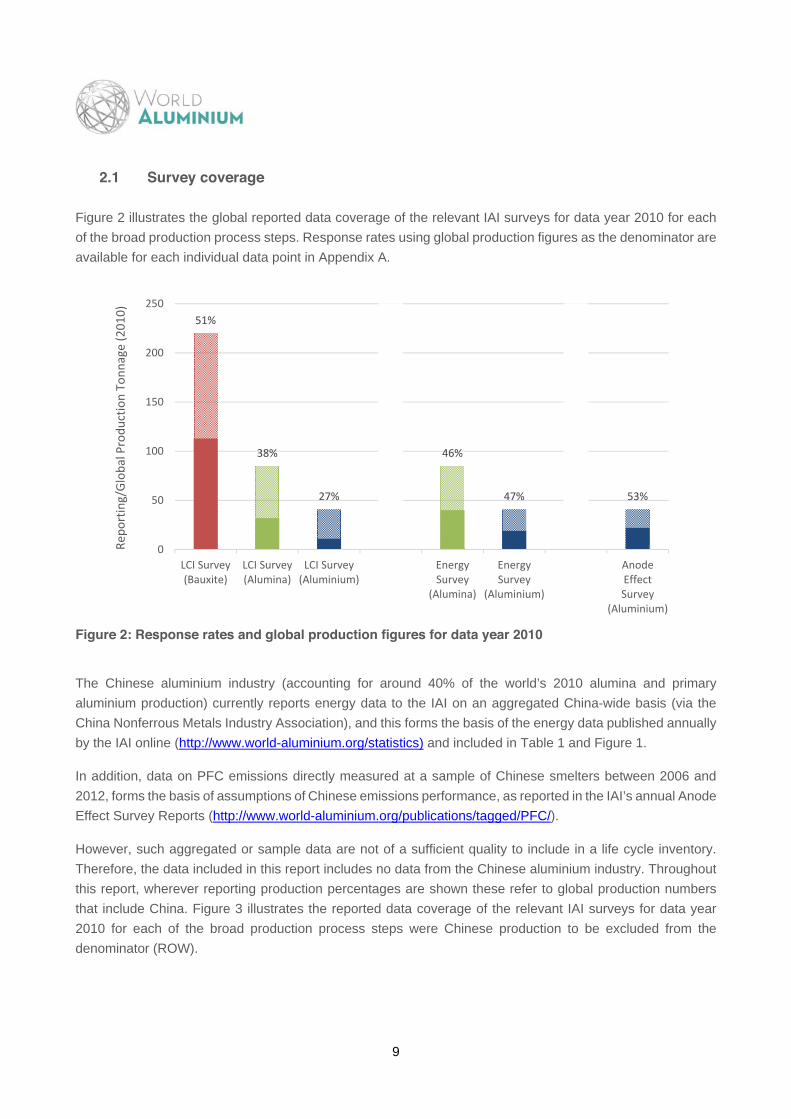
2.1 Survey coverage
Figure 2 illustrates the global reported data coverage of the relevant IAI surveys for data year 2010 for each
of the broad production process steps. Response rates using global production figures as the denominator are
available for each individual data point in Appendix A.
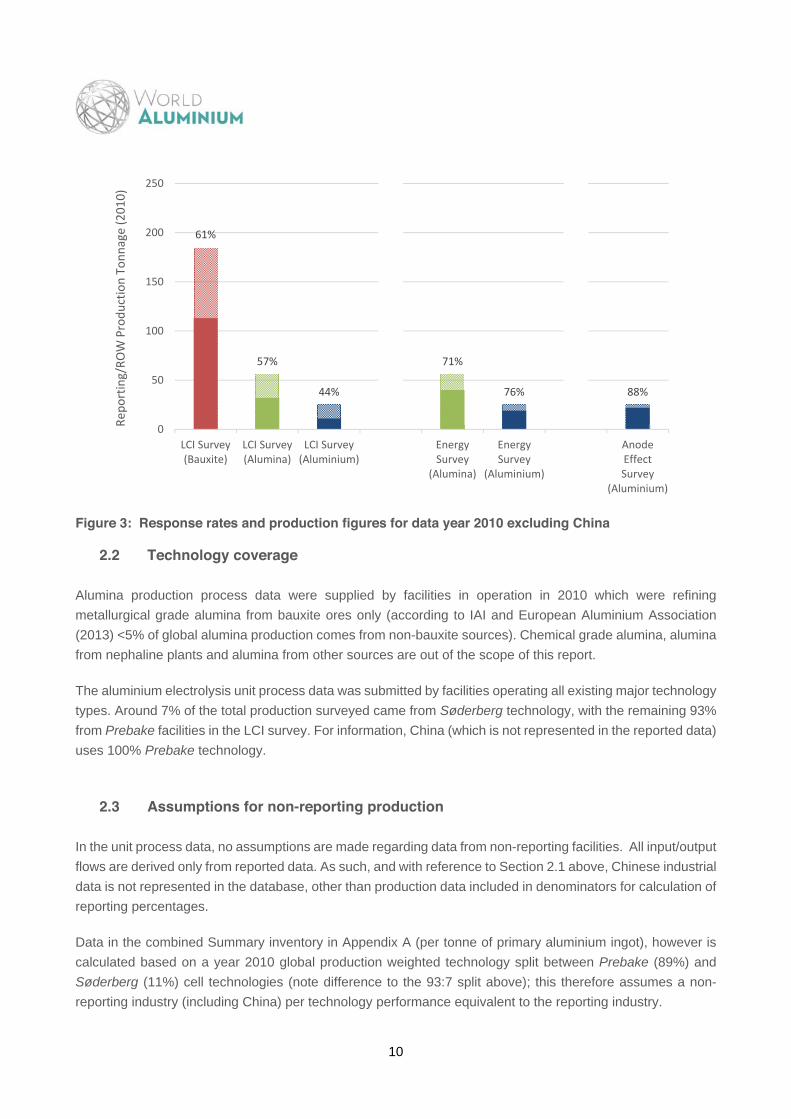
Figure 2: Response rates and global production figures for data year 2010
The Chinese aluminium industry (accounting for around 40% of the world’s 2010 alumina and primary
aluminium production) currently reports energy data to the IAI on an aggregated China-wide basis (via the
China Nonferrous Metals Industry Association), and this forms the basis of the energy data published annually
by the IAI online (http://www.world-aluminium.org/statistics) and included in Table 1 and Figure 1.
In addition, data on PFC emissions directly measured at a sample of Chinese smelters between 2006 and
2012, forms the basis of assumptions of Chinese emissions performance, as reported in the IAI’s annual Anode
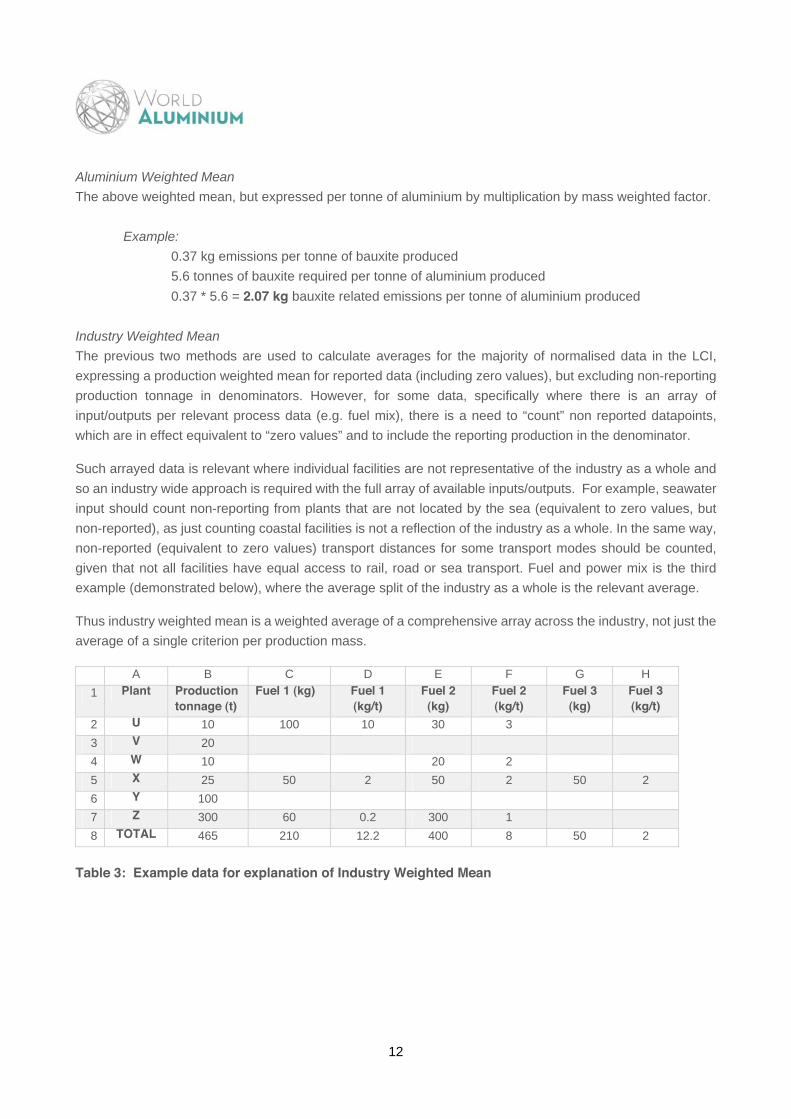
As in the example above, aluminium industry weighted mean is the industry weighted mean expressed per
tonne aluminium.
Industry Weighted Means have been used for the following situations:
Sea water use by a limited number of respondents for wet scrubbing2. Non-reporting (equivalent to
zero values) from plants that are not located by the sea are included;
Transport: non-reported (equivalent to zero values) should be counted, given that not all facilities have
equal access to rail, road or sea transport;
Fuel and power mix: where the average split of the industry as a whole is the relevant average.
2 Sea water use for wet scrubbing (smelter exhaust fume cleaning systems) is relevant to a limited number of companies. However, as the process dilutes smelter air emissions into sea water to harmless concentrations; it includes significant quantities of input and discharged sea water.
14
14
14
4. Data trends and statistical differences from 2005 to 2010
Changes (and lack of change) in inventory data between the 2005 and 2010 datasets can reflect:
Differences in the composition of reporting groups, quality of survey questionnaire(s) or reported
data;
Real changes in global and/or reporting industry performance over the same period.
In this section, some differences between the 2005 and 2010 inventories are explored, with respect to these
functions.
4.1 Changes in composition of industry reporting and/or data quality
A change in reporting group and low completeness (low response rates) in either the 2005 or 2010 survey,
mean that apparent trends over this period can sometimes be considered unreliable. Comments in this section
explore data-driven differences (as opposed to performance-driven differences) organised by process and
compare 2010 data to 2005 data (IAI, 2007).
For all processes, freshwater consumption/use data received particular attention during the 2010 survey
development, reporting quality control and analysis stages, due to uncertainties identified in previous surveys.
As a result, the freshwater data presented in the 2010 inventory can be considered to have a substantially
higher reliability than previous inventories.
4.1.1 Bauxite Mining
Sea water input and output (without consumption. i.e. output equals input) is an order of magnitude higher
in 2010 compared to 2005, but this should not be interpreted as a significant trend as only one facility reported
in 2010, which is different to the single respondent in 2005 (who did not complete a survey, rather than did not
report sea water use). Only mines located at the coast use sea water for washing bauxite and the quantity
used varies considerably at each location.
Fuels and electricity consumption appear quite different from 2005, a function of a different reporting group.
Such consumption is very small compared to subsequent thermal and electrochemical processes.
Particulates air emissions appear to be down by 80%. The 2005 data was high due to an erroneous response
from a mine (reporting a figure an order of magnitude higher than other respondents), which did not participate
in the 2010 survey. The 2010 data can be considered more reliable.
15
15
15
4.1.2 Alumina Production
Fresh water input is 70% lower than 2005. The 2005 data was exceedingly high due to erroneous responses
from three refineries, which did not participate in the 2010 survey. The 2010 data can be considered more
reliable.
Sea water input and output (without consumption. i.e. output equals input) appears to have increased five-
fold. A significantly higher response rate in 2010 compared to 2005 means that this value can be considered
more reliable than previous data.
Other by-products recycled is reported as 2005 data as the 2010 survey for this data point contained an
error, leading to incorrect values being reported.
Uncertainties were identified in 2005 with reported values for fresh water input and output, reflecting
differences in facilities’ measurement of freshwater use and consumption that varied between reporters,
reflecting water availability at given locations (with those facilities that are water constrained having more
developed systems for measurement) and also variability in understanding among reporters on definitions of
water use, consumption etc.
Accordingly this subject was given special attention for the 2010 survey and a consistent description of water
use was codified in the survey. Reporters were asked to report freshwater input and output for each of the unit
processes anode production, electrolysis and ingot casting. Many companies only record water use for the
location as a whole and so responded with figures for their entire plant, (i.e. for the 3 processes together).
Accordingly, indicative split water figures specific to unit processes and developed from those reporters that
submitted separate process data, are for information only.
Water is commonly used throughout the aluminium industry for cooling purposes. Such usage can be singular
(input-cooling-output), which tends to output a similar volume to input or multiple (through water recycling
systems), which again results in an output similar to input, but also reduces the net water input. Cooling water
is discharged after use, with constant monitoring of the quality of water effluents.
Cooling uses account for 88% of discharged water quantities (6.5 m3 H2O/t Al)3.
Other uses account for 12% of discharged water quantities (1 m3 H2O/t Al). Likely uses include wet
scrubbing and other limited, site specific processes.
Water consumption, that is water that is input to the system but not output, is derived from data
reported from a limited number of plants that use water for direct cast-house cooling (and thus lose
water through evaporation), incomplete water monitoring (particularly of output water) and some of
the “other uses” mentioned above. It accounts for 0.5 m3 H2O/t Al.
3 Sanitary uses, reported under “other uses” below and not precisely measured, involve negligible quantities of less than 0.1 m3/t.
16
16
16
Other data
Sea water input and output (without consumption. i.e. output equals input) of 6.5 m3/t Al, arises from the
practice of wet scrubbing. This is undertaken by a limited number of smelters and entails diluting smelter air
emissions (which are included in this study) into sea water to harmless concentrations, therefore involving
significant quantities of input and discharged sea water4.
Issues were identified in 2005 with polycyclic aromatic hydrocarbon and benzo-a-pyrene air emissions as
figures were not consistent with industry experience and had been obtained under low (<20%) response rates.
The improved 2010 response rate (50% for PAH, 35% for BaP) means that latest data, which demonstrate
emissions 50% lower than the 2000-2005 level, can be considered more reliable. This reduction can also be
partly ascribed to improvement in industry performance, primarily through a shift in the technology mix in the
global and reporting industry towards increasing share of Prebake smelters (see next Section).
4.2 Changes reflecting “real” shifts
Comments in this section explore performance-driven differences between 2005 and 2010, organised by
process. They tend to be driven by incremental improvements in process management, the addition of new
capacity, retrofitting of existing capacity and/or closure of older facilities as well as changes in raw material
quality.
4.2.1 Alumina Production
Bauxite consumption increased by around 6% in reported data between 2005 and 2010, reflecting a general
and real trend of increasing demand being met by decreasing quality of ores.
Bauxite residue recycled fell by 70% over the same period, which is partly a function of demand increasing
and ore quality declining faster than technologies to economically recycle bauxite residue are developing. One
of the main users of recycled bauxite is the construction industry, which due to the recession has been in
decline since 2008 and as such have been purchasing less bauxite. Bauxite residue recycled makes up less
than 1% of the total residue that is produced, so although a 70% decrease seems large, the volumes involved
are relatively small.
Bauxite residue deposited increased by 20%, a trend in line with the increased bauxite consumption noted
above. As ore quality decreases there is a higher percentage of ore mass that remains post-extraction.
Differences in fuel mix between 2005 and 2010 data are summarised in the Table 4, which indicates a shift
from oil and coal to natural gas in the reporting group. However, data from China, where coal predominates
the fuel mix (>70% on a GJ/t Al2O3 basis), is not included in either the 2005 or 2010 datasets. Global IAI data,
4 Seawater consumption (0.4 m3/t Al) arises from only one reported smelter desalination operation, which includes a proportion of local uses outside aluminium production.
17
17
17
which includes Chinese alumina industry fuel mix can be found at http://www.world-
aluminium.org/statistics/metallurgical-alumina-refining-fuel-consumption/ and is illustrated in Figure 4.
2010 2005
Heavy oil kg/t Al2O3 83 101
Diesel oil kg/t Al2O3 0.1 0.7
Natural Gas m3/t Al2O3 139 116
Coal kg/t Al2O3 74 89
Electricity kWh/t Al2O3 79 126
Table 4: Life cycle inventory alumina industry fuel mix data for years 2005 and 2010
Figure 4: Global alumina industry fuel mix, 1998 – 2012 (www.world-aluminium.org/statistics)
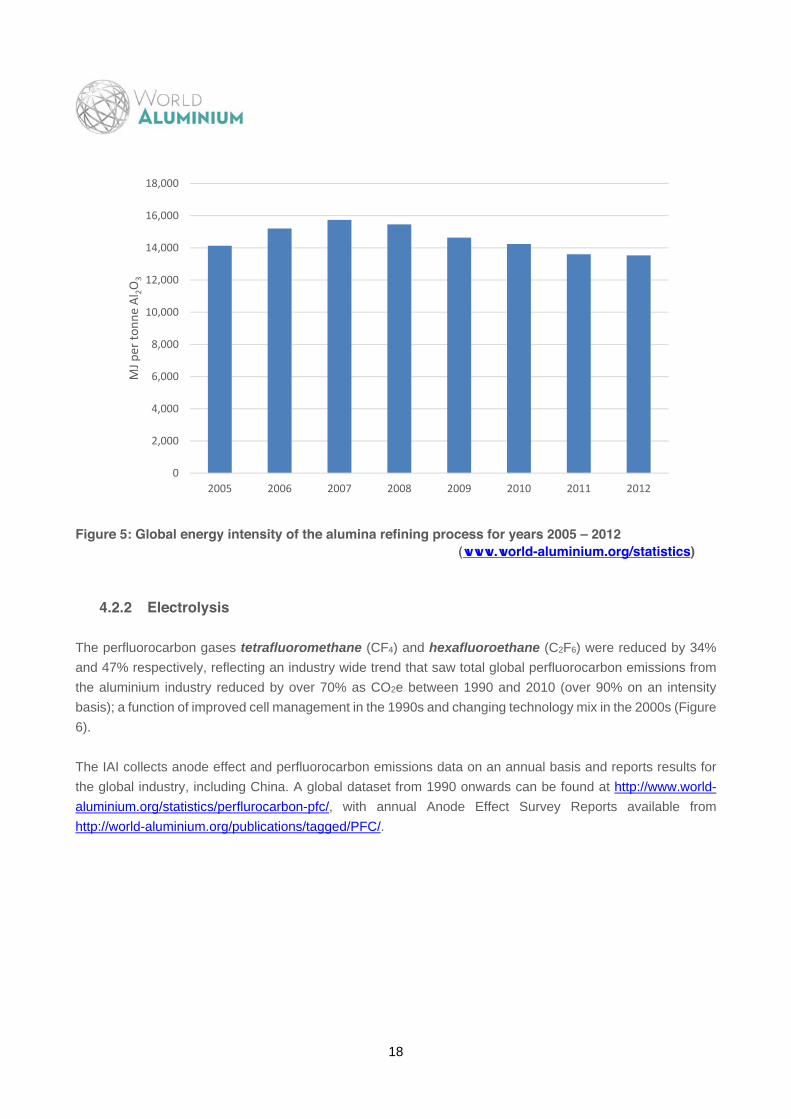
Over the period 2005 to 2010, the global energy intensity of the alumina refining process (including China) has
remained stable at around 14 GJ/t Al2O3, even as ore quality has been decreasing (Figure 5). This is due to
significant technological efficiency improvements in newly installed capacity as well as the use of sweetening
processes, wherein small quantities of higher quality bauxites are added to lower quality feed-stocks during
high temperature digestion, boosting yield and lowering energy consumption.
18
18
18
Figure 5: Global energy intensity of the alumina refining process for years 2005 – 2012
(www.world-aluminium.org/statistics)
4.2.2 Electrolysis
The perfluorocarbon gases tetrafluoromethane (CF4) and hexafluoroethane (C2F6) were reduced by 34%
and 47% respectively, reflecting an industry wide trend that saw total global perfluorocarbon emissions from
the aluminium industry reduced by over 70% as CO2e between 1990 and 2010 (over 90% on an intensity
basis); a function of improved cell management in the 1990s and changing technology mix in the 2000s (Figure
6).
The IAI collects anode effect and perfluorocarbon emissions data on an annual basis and reports results for
the global industry, including China. A global dataset from 1990 onwards can be found at http://www.world-
aluminium.org/statistics/perflurocarbon-pfc/, with annual Anode Effect Survey Reports available from
Figure 6: Total global aluminium industry perfluorocarbon emissions against global production
Reported particulate fluoride and gaseous fluoride remained relatively stable between 2005 and 2010.
Fluorides emissions intensity was reduced by 50% between 1990 and 2010, again a function of technology
changes and improvement in emissions management practices. A fluoride emissions dataset from 1990 for
the global industry can be found at http://www.world-aluminium.org/statistics/smelter-fluoride-emissions/.
Spent Pot Lining (SPL) solid waste landfilled was reduced by 45% through improved recycling of the
respective SPL-carbon and SPL-refractory fractions.
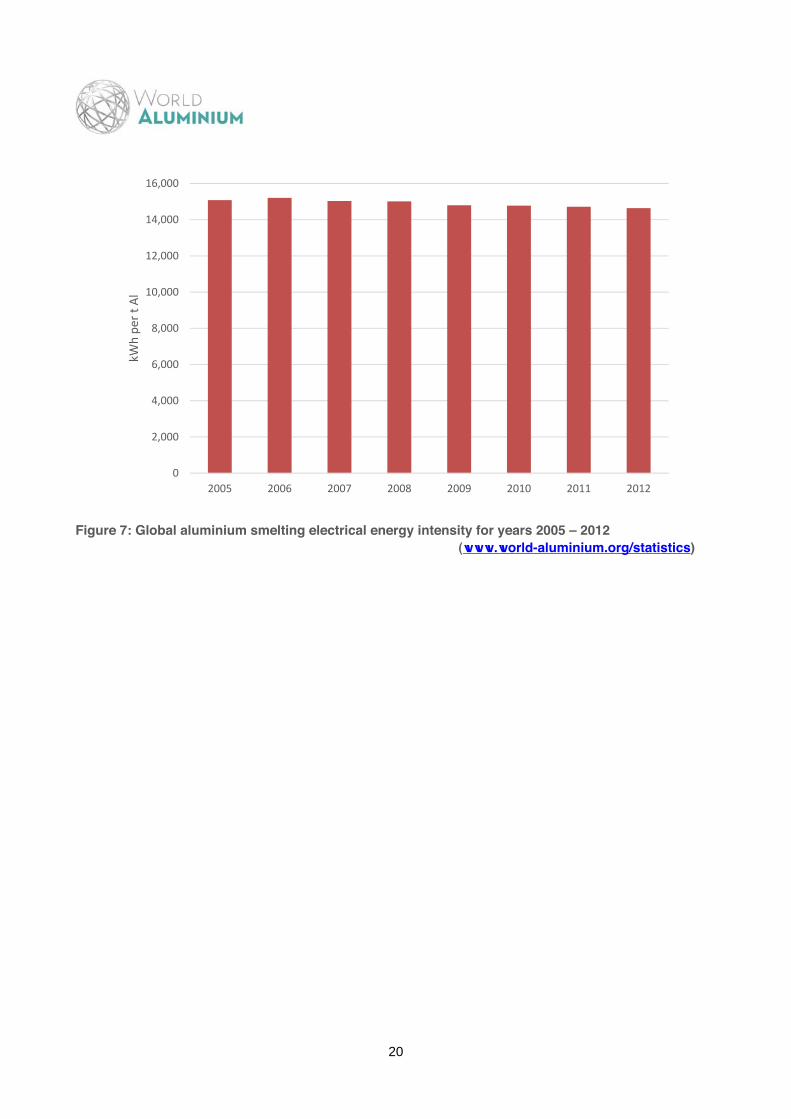
Stability in electricity consumption (15,289 kWh/t Al in 2005, 15,275 kWh/t Al in 2010) does not fully reflect
the global industry, as neither dataset includes China. The majority of new production capacity installed over
this period is located in China (a country acutely aware of energy constraints and focused on technology to
improve energy efficiency), it is generally best available technology (and therefore more energy efficient than
the average) and is found in larger facilities (which has a greater impact on production weighted averages).
Annual global data published by the IAI, which includes Chinese industry values, indicates a 2% reduction in
smelting electrical energy intensity between 2005 and 2010, with a lower baseline (15,080 kWh/t Al) and final
value (14,777 kWh/t Al). Such data can be found at http://world-aluminium.org/statistics/primary-aluminium-
smelting-energy-intensity/ and is illustrated in Figure 7.
0
10
20
30
40
50
60
70
80
90
100
0
5
10
15
20
25
30
35
40
45
50
1990
1995
1998
1999
2000
2001
2002
2003
2004
2005
2006
2007
2008
2009
2010
Annual PFC
Emissions
(million tonnes CO2e)
Annual Primary Aluminium Production (million
tonnes Al)
Point Fed Prebake (PFPB)Production
Centre Work Prebake (CWPB)Production
Side Work Prebake (SWPB)Production
Vertical Stud Søderberg (VSS)Production
Horizontal Stud Søderberg(HSS) Production
Total PFC Emissions (t CO2e)
20
20
20
Figure 7: Global aluminium smelting electrical energy intensity for years 2005 – 2012
(www.world-aluminium.org/statistics)
0
2,000
4,000
6,000
8,000
10,000
12,000
14,000
16,000
2005 2006 2007 2008 2009 2010 2011 2012
kWh per t Al
21
21
21
5. Interpretation
This 2010 inventory can be considered the most accurate and up-to-date of any published global LCI on
primary aluminium production.
With an increased focus on water use and on transport of materials the coverage of relevant inputs/outputs
can be seen to have improved on the 2005 inventory. Third party review of the report has revealed areas for
further exploration in the next iteration of LCI survey (2015), namely land use at each stage in the production
process, but specifically in mining and refining and bauxite residue management and disposal.
Reported data (with industry responses to individual questions ranging from between 10 and 50% of the global
industry) reveal relatively little change in the resource inputs and environmental outputs between the 2005 and
2010 surveys, the most significant being:
an increase in bauxite consumption per tonne of product (a function of declining ore quality) and
associated increase in bauxite residue volumes per tonne;
further reduction in PFC emissions;
shifts in fuel mix for alumina production towards gas from coal.
With respect to the inventory’s characterization of the global industry’s inputs and outputs, the greatest
obstacle to achievement of this goal is the lack of Chinese industry data reported in a quality high enough for
inclusion in the database.
The inventory includes no Chinese industry data, while the Chinese industry represents (in 2010) over 40% of
global alumina and primary aluminium production. However, input-output data on the aluminium industry’s
processes tends to be more a function of technology in use than location (albeit that the background data,
which in any case is out of the scope of this report, can be impacted significantly by the inclusion or exclusion
of specific regions). Given that China employs 100% point fed prebake smelters and that its alumina refining
technology is relatively similar in mix to the rest of the world, one could say that the data included herein is a
reasonable approximation of the Chinese industry’s inputs/outputs.
IAI published data indicates that Chinese smelting energy intensity is 5% lower on average than the rest of the
world and refining energy 30% higher (in 2010).
Having said that, China’s power mix is more heavily coal based than the rest of the aluminium producing world
– although such background data is outside the scope of this report. In this regard, users of this inventory data
should ensure that they utilise aluminium industry specific power mix data, available from the IAI, rather than
regional grid mixes. Alumina fuel mix is within the scope of this inventory however (although it is published by
the IAI elsewhere) and here China does differ from the rest of the world; therefore one might say that this
Goal & Scope
The purpose of this inventory report is to characterize accurately and at the global level resource
inputs and significant environmental releases associated with the production of primary aluminium.
22
22
22
inventory more accurately characterises the Chinese aluminium industry (and thence global industry) than it
does its alumina industry.
With China making up an increasing share of global production since 2010, future surveys will need to focus
on obtaining more and better quality data from the Chinese industry, if future inventories are to continue to
characterise accurately and at the global level resource inputs and significant environmental releases
associated with the production of primary aluminium.
23
23
23
Appendix A: Unit process descriptions and inventory data
Excel versions of the inventory data can be downloaded from the World Aluminium website at the following link:http://www.world-aluminium.org/publications/tagged/life%20cycle/
Unit Process Flow Chart
* Process outside scope of this report** Global prebake/Søderberg technology ratio (production weighted)
*** Prebake anode mass balance comprises recycled anode butts from prebake electrolysis process**** Electricity production is partially covered by the scope of the report (power mix data is collected)
Foreground data
78
89% 11%
NB: For a full cradle to gate inventory, the background data for processes outside of the dotted line should be connected to the foreground data from this study. 1 tonne aluminium
Anode butts ***79 kg Anode Butts
Aluminium ingot casting1,000 kg Ingots
527 kg AnodesPitch production * Pitch production *
64 kg Pitch 157 kg Pitch
Anode production Aluminium electrolysis (prebake) ** Aluminium electrolysis (Søderberg) ** Anode production429 kg Anodes 1,000 kg Aluminium 1,000 kg Aluminium
Petrol coke production * Petrol coke production *286 kg Petrol Coke 374 kg Petrol Coke
Aluminium fluoride production * Aluminium fluoride production *16 kg AlF3 21 kg AlF3
kWh
Cathode carbon production * Cathode carbon production *6 kg Carbon 6 kg Carbon
17,209Electricity production **** Alumina transport (bulk vessel) Electricity production ****
15,044 kWh 13,516 tkm
Calcined lime production * Alumina production NaOH production *kg Lime 1,934 kg Alumina 152 kg NaOH (100%)
of which landfill waste kg/t 8.53of which hazardous waste kg/t 9.30 2.75 1.36
Calculated air emissions from fuel combustionMethane from fuels kg/t 0.000055 0.034 0.0061 0.00092 0.0014
Nitrous oxide from fuels kg/t 0.000011 0.0053 0.0011 0.00018 0.00020Carbon dioxide from fuels kg/t 1.38 695.60 208.00 25.14 54.03
25
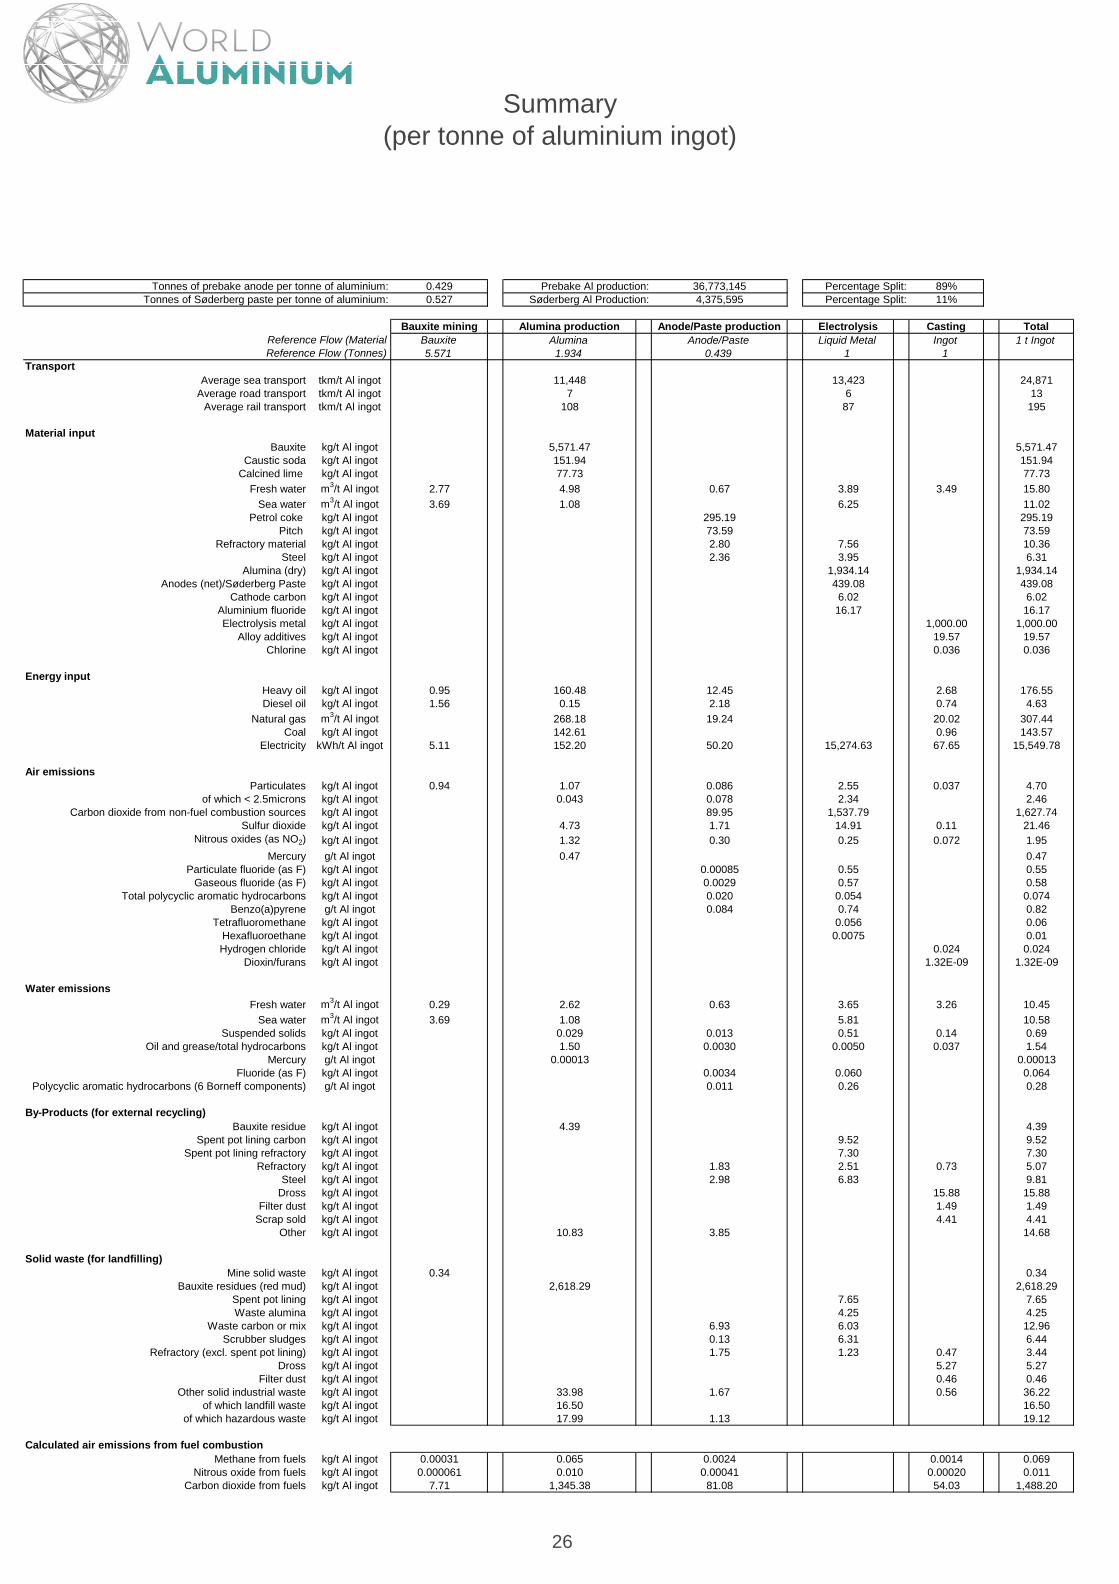
Summary(per tonne of aluminium ingot)
Tonnes of prebake anode per tonne of aluminium: 0.429 Prebake Al production: 36,773,145 Percentage Split: 89%Tonnes of Søderberg paste per tonne of aluminium: 0.527 Søderberg Al Production: 4,375,595 Percentage Split: 11%
Bauxite mining Alumina production Anode/Paste production Electrolysis Casting TotalReference Flow (Material Bauxite Alumina Anode/Paste Liquid Metal Ingot 1 t IngotReference Flow (Tonnes) 5.571 1.934 0.439 1 1
TransportAverage sea transport tkm/t Al ingot 11,448 13,423 24,871
Average road transport tkm/t Al ingot 7 6 13Average rail transport tkm/t Al ingot 108 87 195
Material inputBauxite kg/t Al ingot 5,571.47 5,571.47
Caustic soda kg/t Al ingot 151.94 151.94Calcined lime kg/t Al ingot 77.73 77.73
Fresh water m3/t Al ingot 2.77 4.98 0.67 3.89 3.49 15.80
Sea water m3/t Al ingot 3.69 1.08 6.25 11.02Petrol coke kg/t Al ingot 295.19 295.19
Pitch kg/t Al ingot 73.59 73.59Refractory material kg/t Al ingot 2.80 7.56 10.36
Steel kg/t Al ingot 2.36 3.95 6.31Alumina (dry) kg/t Al ingot 1,934.14 1,934.14
Anodes (net)/Søderberg Paste kg/t Al ingot 439.08 439.08Cathode carbon kg/t Al ingot 6.02 6.02
Aluminium fluoride kg/t Al ingot 16.17 16.17Electrolysis metal kg/t Al ingot 1,000.00 1,000.00
Alloy additives kg/t Al ingot 19.57 19.57Chlorine kg/t Al ingot 0.036 0.036
Energy inputHeavy oil kg/t Al ingot 0.95 160.48 12.45 2.68 176.55Diesel oil kg/t Al ingot 1.56 0.15 2.18 0.74 4.63
Natural gas m3/t Al ingot 268.18 19.24 20.02 307.44Coal kg/t Al ingot 142.61 0.96 143.57
Electricity kWh/t Al ingot 5.11 152.20 50.20 15,274.63 67.65 15,549.78
Air emissionsParticulates kg/t Al ingot 0.94 1.07 0.086 2.55 0.037 4.70
of which < 2.5microns kg/t Al ingot 0.043 0.078 2.34 2.46Carbon dioxide from non-fuel combustion sources kg/t Al ingot 89.95 1,537.79 1,627.74
This unit process begins with unloading of process materials to their storage areas on site.
The operations associated with this unit process include:
bauxite grinding, digestion and processing of liquors;
alumina precipitation and calcination;
maintenance and repair of plant and equipment; and
treatment of process air, liquids and solids.
The output of this unit process is smelter grade alumina transported to an electrolysis plant (primary
aluminium smelter).
In alumina production, also commonly named alumina refining, bauxite is converted to alumina (aluminium
oxide) using the Bayer Process, which uses caustic soda and calcined lime (limestone) as input reactants.
Bauxite is ground and blended into a liquor containing sodium carbonate and sodium hydroxide. The slurry is
heated and pumped to digesters, which are heated pressure tanks. In digestion, iron and silicon impurities form
insoluble oxides called bauxite residue. The bauxite residue settles out and a rich concentration of sodium
aluminate is filtered and seeded to form hydrate alumina crystals in precipitators. These crystals are then heated
in a calcining process. The heat in the calciners drive off combined water, leaving alumina. Fresh water (surface
and groundwater) or sea water is used as cooling agent.
The major differences in processing are at the calcination stage. Two types of kilns are used: rotary and fluid
bed. The fluid bed or stationary kiln is newer and significantly more energy efficient. Energy requirements (coal,
diesel oil, heavy oil, natural gas, electricity) have been halved over the last two decades with the introduction
of higher pressure digesters and fluid flash calciners.
Air emissions mostly arise from the calcination stage (particulates; nitrous oxides (as NO2) and sulfur
dioxide from fuel combustion; mercury from the ore), while water emissions come from cooling use (fresh
water, sea water, oil and grease/total hydrocarbons) or are linked with the digestion stage (suspended
solids, mercury from the ore). Most of the bauxite residue (red mud) is currently deposited as solid waste,
while a small but growing fraction is reused. Other (by-products for external recycling) are reaction chemicals.
Other landfill wastes are typically inert components from bauxite such as sand, or waste chemicals.
For further information on alumina refining processes refer to http://bauxite.world-aluminium.org/. For further information on the management of bauxite residue, please refer to http://www.world-aluminium.org/media/filer_public/2013/06/11/bauxite_residue_management_-_best_practice_1.pdf.
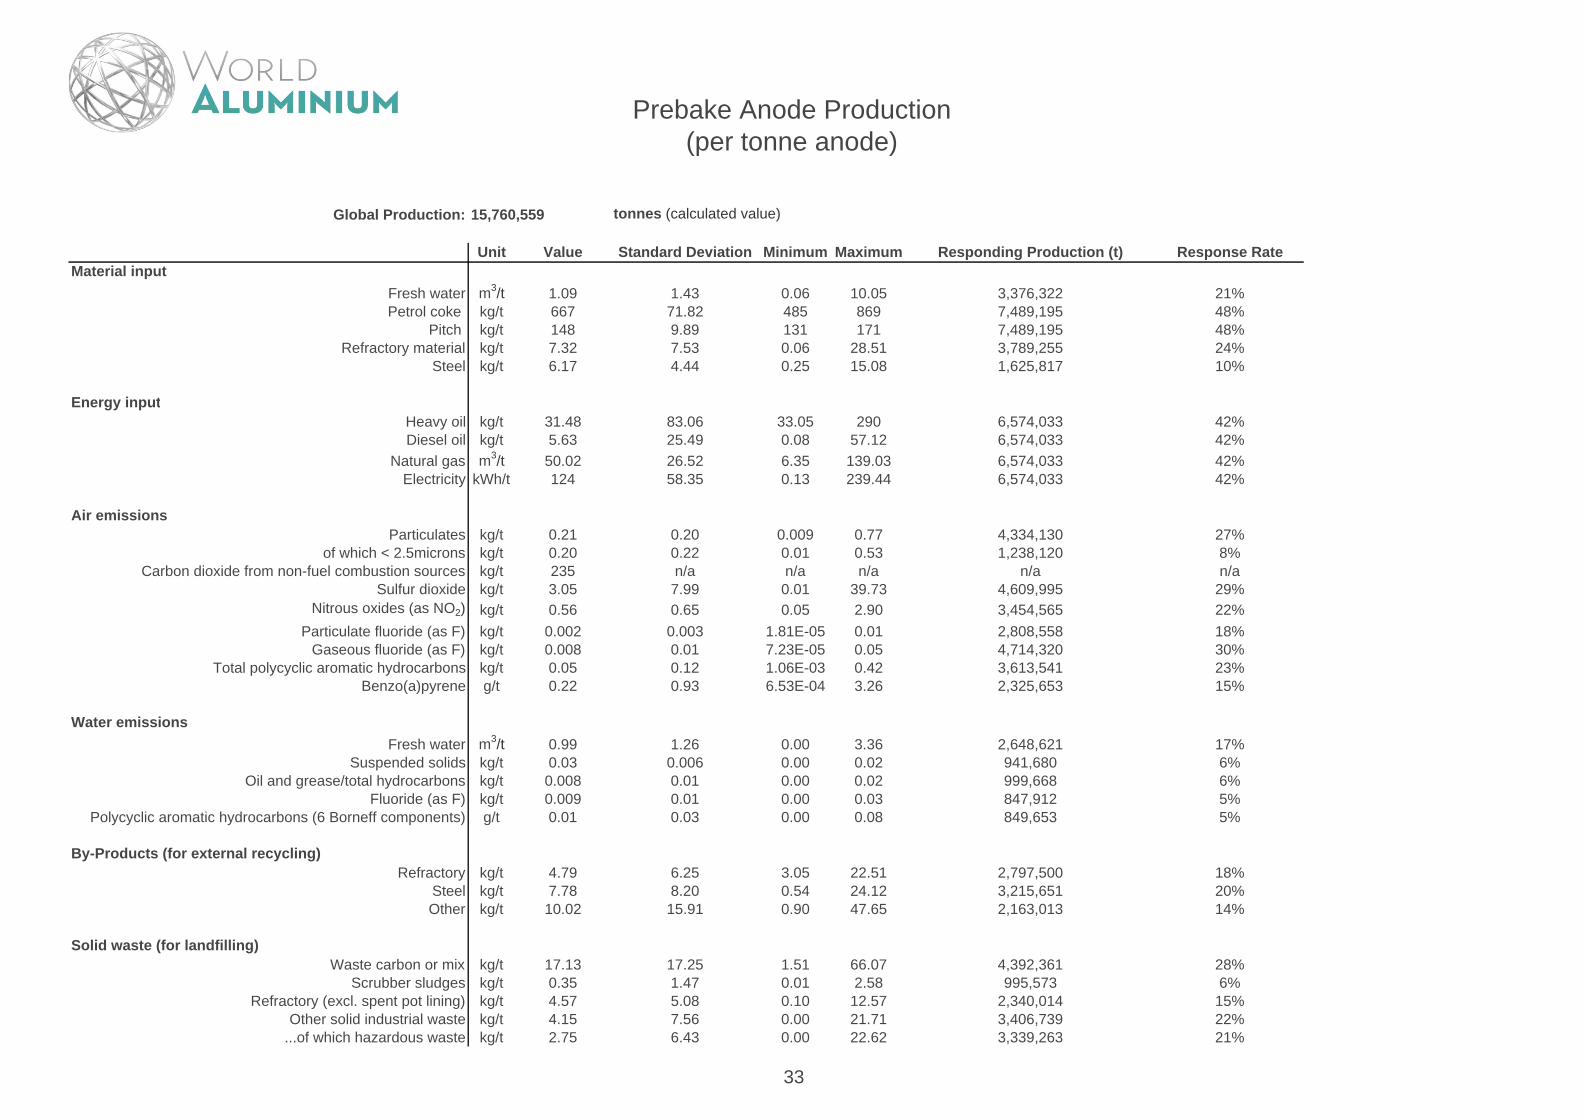
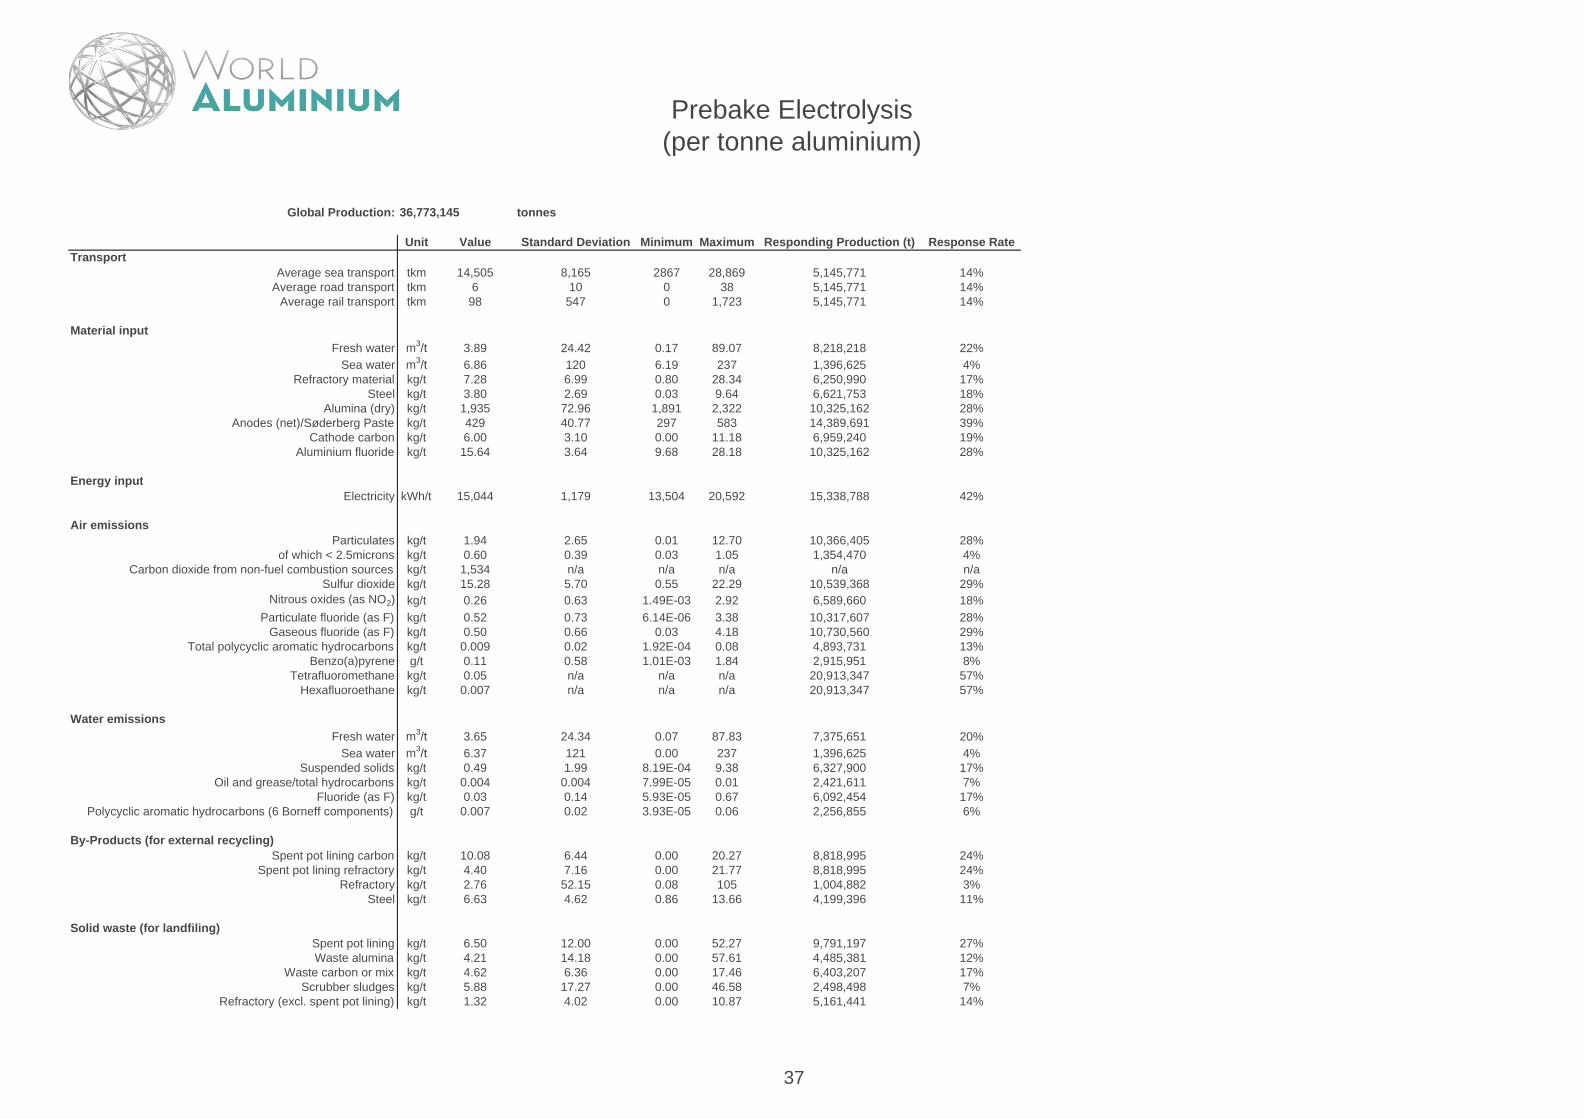
Alumina Production(per tonne alumina)
Global Production: tonnes
Unit Value Standard Deviation Minimum Maximum Responding Production (t) Response RateTransport
Average sea transport tkm 5,919 4,968 0 14,969 17,062,824 20%Average road transport tkm 4 18 0 50 17,062,824 20%
Average rail transport tkm 56 106 0 319 17,062,824 20%
Material inputBauxite kg/t 2,881 598 1,874 3,587 25,010,877 29%
Life Cycle Assessment of Aluminium: Inventory Data for the Primary Aluminium Industry – Year 2010 Update
Critical Review by Walter Klöpffer and Rolf Frischknecht p. 1 of 9
Global Life Cycle Assessment Inventory Data for the
primary Aluminium Industry 2010 Data
Final Report
August 2013
Critical Review Report by
Walter Klöpffer Frankfurt/M
and Rolf Frischknecht
Zürich
August 2013
Life Cycle Assessment of Aluminium: Inventory Data for the Primary Aluminium Industry – Year 2010 Update
Critical Review by Walter Klöpffer and Rolf Frischknecht p. 2 of 9
Preface
This critical review report is the final step of a review process which started 1st May
2012 after some preliminary discussions, confidentiality agreement and offer. The
first critical review report (June 2012) was based on Draft 2 by IAI (March 2012),
written by Bernard de Gélas (Paris) in the format used by previous data reports, the
most recent one dealing with year 2005 update. The critical review requested major
revisions both in the structure of the text and the data quality and presentation. The
writing of the year 2010 report was now taken over by the IAI headquarter in London.
The format was improved to give a better readability for the global audience. This
needed some time. Data approved by the critical review – before the final report was
ready – could be delivered to the European Aluminium Association (EAA, Brussels)
in March/April 2013. This data was needed for the 2010 update of the European
Aluminium LCA report [EAA 2013]. As in the case of the global reports by IAI, the
European reports are updated every five years [Leroy 2009].
This critical review is based on the “Final 2010 Data report” (August 2013). The final
report was preceded by Draft 6 (May 2013, received 06.06.2013), and has been
discussed in detail in written form and during a face-to-face meeting July 24 in
London. The present critical review report consists of two parts:
Part 1, written by Walter Klöpffer, deals with the ISO-aspects of the Life Cycle
Inventory report [ISO 2006a,b]. Since the data will be used for Life Cycle Assessment
(LCA) and similar studies, the reporting should follow the rules given by the
international standards cited.
Part 2, written by Rolf Frischknecht, deals with the important questions related to the
data: coverage, averaging, collecting and other quality-related items. Of course, the
two parts cannot and should not be fully separated.
Life Cycle Assessment of Aluminium: Inventory Data for the Primary Aluminium Industry – Year 2010 Update
Critical Review by Walter Klöpffer and Rolf Frischknecht p. 3 of 9
Part 1: The Life Cycle Inventory study according to ISO 14040 + 14044
1 Formal criteria From a formal (ISO 14040+44) point of view, this report constitutes an LCI study
report which should cover the phases
• Goal and Scope definition (G&S)
• Life Cycle Inventory analysis (LCI), and
• Interpretation
In contrast to a full LCA report, the phase Life Cycle Impact Assessment (LCIA) is
excluded. Therefore, no conclusions about environmental impacts can be drawn from
an LCI study; the report of the phase “Interpretation” can be shorter than in a full LCA
study. For the same reason, no results “intended to be used to support a comparative
assertion intended to be disclosed to the public” [ISO 2006b] can be obtained from
such a study. Furthermore, the critical review can be performed by one or more
independent experts, no “review by interested parties” is necessary.
2 Requirements to be met by a LCA/LCI study For the critical review of a full LCA study, the international standard states the
following requirements.
"The critical review process shall ensure that:
• the methods used to carry out the LCA are consistent with this International
Standard;
• the methods used to carry out the LCA are scientifically and technically valid;
• the data used are appropriate and reasonable in relation to the goal of the
study;
• the interpretations reflect the limitations identified and the goal of the study;
and
• the study report is transparent and consistent."
This list can also be used for an LCI study, although not all items have the same
weight due to the absence of the Life Cycle Impact Assessment phase.
Life Cycle Assessment of Aluminium: Inventory Data for the Primary Aluminium Industry – Year 2010 Update
Critical Review by Walter Klöpffer and Rolf Frischknecht p. 4 of 9
2.1 Consistency with the standard A first impression about the consistency is given by the structure of the report. In this
regard, a clear chapter 1 on Goal & Scope describes the system boundaries (the
graphical presentation is found in appendix A) and presents other important
information about the system studied. Chapters 2 to 4 deal with data collection,
analysis and trends and differences compared with 2005. These chapters together
can be accepted as “Life Cycle Inventory analysis”, the second phase of an LCI
study. A short chapter 5 (Interpretation) is rounding up the structure,
More important than the purely formal coincidence, there seem to be no major
deviations from life cycle assessment, as defined by the international standards. The
coincidence with the standards is therefore given.
2.2 Scientific and technical validity of the methods used The methods used correspond to the present state of the art. The problems surfacing
here and there in this study are due to missing data (see below), not to the inability to
handle them. Given the enormous scope of the study (theoretically the whole
industrialised world!) the methodological frame is excellent. The processes are well
described and the science and technology behind are presented in a concise way.
2.3 Data in relation to the goal of the study For details on data see Part 2.
Here, only two groups of missing data should be mentioned:
• The existing data for China have not the necessary quality to be used in this
report. Since China produces 40% of the primary aluminium worldwide, the
data could be much more representative.
• The processes near the “cradle” – bauxite mining and alumina production –
are incomplete with regard to land use. This includes the handling of the
bauxite residues (“red mud”). Since the impact category Land use is gaining
importance within the phase LCIA (in full LCA studies), aluminium cannot be
treated adequately. This deficiency has already been criticized with regard to
the European 2005 data report [Klöpffer 2009], depending on the global data
for bauxite and alumina.
Life Cycle Assessment of Aluminium: Inventory Data for the Primary Aluminium Industry – Year 2010 Update
Critical Review by Walter Klöpffer and Rolf Frischknecht p. 5 of 9
2.4 Interpretation of limitations with regard to the goal of the study The limitations of the study are discussed at many occasions, also with regard to
processes outside the system boundaries (to be included by the users of the study
from other data sources). There is also a short chapter 5 “Interpretation” in which also
the deficiencies mentioned in section 2.3 are added as points to be improved in the
next update (2015 data).
2.5 Transparency and consistency of the Report The report is well written and transparent. The style is concise, the illustrations in
colour. No major inconsistencies have been detected.
With regard to data presentation see Part 2.
The (environmental) image of aluminium has been much improved by using life cycle
thinking and assessment in recent years. The provision and frequent update of
reliable data plays a major role in this process and should be continued.
References
EAA 2013: Environmental Profile Report for the European Aluminium Industry April
2013-Data for the year 2010. Life Cycle Inventory data for aluminium production and
transformation processes in Europe
ISO 2006a: International Standard Organization TC 207/SC 5: Environmental management – Life cycle assessment – Principles and framework. ISO 14040:2006 ISO 2006b: International Standard Organization TC 207/SC 5: Environmental management – Life cycle assessment – Requirements and guidelines. ISO 14044:2006 Klöpffer, W. 2009: Experiences with the Critical Review Process of Aluminium LCI Data. Int. J. Life Cycle Assess 14, (Supplement 1) 45-51 Leroy, C. 2009: Provision of LCI data in the European aluminium industry. Methods and examples. Int. J. Life Cycle Asess. 14 (Supplement 1) 10-44
Life Cycle Assessment of Aluminium: Inventory Data for the Primary Aluminium Industry – Year 2010 Update
Critical Review by Walter Klöpffer and Rolf Frischknecht p. 6 of 9
Part 2: The Life Cycle Inventory data according to ISO 14040 + 14044
1 Introduction This Part 2 focuses on the review of the LCI data and the assessment of their quality
and their appropriateness in relation to the goal of the study.
The life cycle inventory of primary aluminium (2010 update) is the result of a large
task of collecting information from numerous production sites all over the world. The
resulting inventories based on this huge task are acknowledged and appreciated.
2 Scope of the LCI and of the elementary flows The life cycle inventory data comprise relevant information on energy, water and
working materials consumption, air and water pollutant emissions, and wastes
generated. A special emphasis is put on the water balance by reporting water
abstraction and water discharge separately. This helps distinguishing between water
withdrawal and water consumption and thus water use data are suitable for different
water footprint assessment methods currently available. However, a regionalised
assessment of water use is not yet possible because of lacking geographical
information.
Particulate matter emissions are reported by specifying the share of particulates with
diameters below 2.5 µm. This is of high value with regard to environmental impact
assessment because smaller sized particular matter tends to cause more damage to
human health than the same mass of larger sized particulate matter.
Special attention is given to the PFC emissions. The global average emission factors
of CF4 and C2F6 are based on a large sample of measurements. The specific
emissions (per ton of primary aluminium) continued to decrease since the last
update.
Land use impacts get more and more attention in the LCA community. Several im-
pact assessment approaches covering either impacts on biodiversity or impacts on
ecosystem services are now available. According to the outcome of an international
workshop on life cycle impact assessment held recently in Glasgow (Jolliet &
Frischknecht 2013), land use is considered to be one of the impact categories, which
are relevant and bear the potential for global harmonisation. It is recommended to
include land use information in the next data survey related to the value chain of
primary aluminium, in particular related to bauxite mining and alumina production.
Life Cycle Assessment of Aluminium: Inventory Data for the Primary Aluminium Industry – Year 2010 Update
Critical Review by Walter Klöpffer and Rolf Frischknecht p. 7 of 9
Bauxite residues (red mud) from alumina production are quantified as “solid waste”.
These residues are stored in large ponds or are stacked. Emissions from these so
called bauxite residue storage areas (e.g. heavy metals in leachate) are not
quantified. It is recommended to provide information about the environmental impacts
of bauxite residue treatment with the next update.
3 Geographical and temporal scope The survey coverage is reported individually for the different production processes
and for each input and output. This information is very valuable and gives a detailed
picture about the representativeness of the data. The survey coverage of bauxite mi-
ning, of energy in alumina and aluminium production and of anode effect is about
50 % (plus/minus 5 % points). It is lower for the LCI survey of alumina and aluminium
production (38 % and 27 %, respectively). Not all responding sites report data on all
transport services, energy, material and water inputs, pollutants emissions or wastes.
In few cases of minor importance the coverage of reported figures is below 10 % of
global production. Hence, the representativeness of the data is good regarding ener-
gy and PFC emissions and fair with regard to the remaining inputs and outputs.
Chinese production is approximated with average global data represen¬ting the
same technology. The global electricity mix used in primary aluminium smelters
includes the Chinese production share and thus includes the Chinese electricity mix
(mainly coal based) accordingly. It remains unclear whether these approximations
are appro¬priate or lead to a significant bias in the final results as energy efficiencies
and emission factors per ton of aluminium produced in China might differ
substantially from the rest of the world average.
While the huge effort of data collection along the supply chain is acknowledged, it is
recommended to include Chinese facilities in the next survey and to generally try to
increase the response rate.
3 Data handling and processing Data averaging is done in a professional, sophisticated and solid manner. The rele-
vant production volumes are considered. Zero values and “not reported” values are
distinguished. Zero values are included in the averaging where appropriate and
missing values are excluded.
Life Cycle Assessment of Aluminium: Inventory Data for the Primary Aluminium Industry – Year 2010 Update
Critical Review by Walter Klöpffer and Rolf Frischknecht p. 8 of 9
5 Data uncertainty and data errors All data are provided with uncertainty information (standard deviation, minium and
maximum values) based on data and theoretical considerations. This information is
very helpful in assessing the reliability of the LCI data.
Random checks of data revealed only a few and minor errors or inconsistencies
which were verified and corrected for the final version of the LCI report.
6 Overall assessment of primary Aluminium LCI data The life cycle inventory data of global primary aluminium production in 2010 are
consistent, transparent, and of high quality. It provides the LCA practitioner with
reliable life cycle inventory data of global primary aluminium. The lack of information
about the Chinese primary aluminium production is addressed as good as possible.
The publication of unit process data allows for a consistent implementation of the da-
ta into LCA databases worldwide. The data are thus suitable for LCA studies com-
pliant with ISO 14040 and ISO 14044 (ISO 2006a & b) and for implementation in LCI
databases which are in line with the UNEP SETAC Global Guidance Principles for
Life Cycle Assessment Databases (Sonnemann & Vigon 2011).
For future updates it is recommended to including Chinese production in the survey,
extending the inventory to cover land use and transformation and heavy metals
leaching from red mud dumps, and regionalising the water use data.
References ISO 2006a: International Standard Organization TC 207/SC 5: Environmental management – Life cycle assessment – Principles and framework. ISO 14040:2006 ISO 2006b: International Standard Organization TC 207/SC 5: Environmental management – Life cycle assessment – Requirements and guidelines. ISO 14044:2006 Jolliet O., Frischknecht R., (2013) Global guidance on environmental life cycle impact assessment indicators, Flagship project of the 3rd phase of the UNEP-SETAC Life Cycle Initiative, Presentation of the main findings of the LCIA workshop held in Glasgow, UK, May 16-17, 2013. Sonnemann G. and Vigon B. (ed.) (2011) Global guidance principles for life cycle assessment databases; A basis for greener processes and products. United Nations Environment Programme, UNEP, Paris.
Life Cycle Assessment of Aluminium: Inventory Data for the Primary Aluminium Industry – Year 2010 Update
Critical Review by Walter Klöpffer and Rolf Frischknecht p. 9 of 9
Frankfurt am Main, August 31 2013 Uster, August 31 2013
Prof. Dr. Walter Klöpffer Dr. Rolf Frischknecht Editor-in-chief, Int. Journal of treeze Ltd. Life Cycle Assessment fair life cycle thinking LCA CONSULT & REVIEW Am Dachsberg 56E Kanzleistrasse 4 DE-60435 Frankfurt/M CH-8610 Uster Germany Switzerland Tel.: (+49-(0)69) 54 80 19 35 (+41-(0)44) 940 61 91 E-Mail: [email protected][email protected] Internet: http://www.kloepffer.de http://www.treeze.ch