September 20, 2010 Global Markets Institute The new geography of global innovation The new geography of global innovation While the United States and Japan remain leaders in innovation, increased competition from growth markets, notably China, suggests a changing landscape. Research and development spending in Asia surpassed EU levels in 2005, and is likely to overtake US levels in the next five years, thanks primarily to striking growth in R&D investment in China. Measures of R&D intensity, or R&D investment as a share of GDP, allow for cross-country comparisons of commitment to R&D. R&D intensity has remained flat across G7 markets during the last decade at 2.1%. In China it has impressively doubled as a share of GDP since 1999, reaching 1.5%, which remains low by international standards. R&D investment is driven largely by the corporate sector, which finances more than two-thirds of total R&D spending in many countries. Companies in a range of industries, from pharmaceuticals to technology hardware, have exposure to new hubs of global innovation. Pipeline concerns and the role of human capital The new geography of global innovation is critically dependent upon higher education in science and engineering (S&E) fields. Student interest in S&E is low in G7 countries, suggesting that these markets are likely to have difficulty replacing an aging cohort of native-born scientists and engineers. Reliance on foreign-born skilled labor is set to rise further as the world’s S&E skill base shifts toward Asia, notably China, where S&E fields represent 40% of all new university degrees awarded (more than two and a half times US levels). New geography demands a policy response Innovation-led productivity growth in the G7 will increasingly require public policies which attract and retain skilled foreign students and workers. In the short term, a more flexible and talent-friendly immigration regime can help developed economies and companies to benefit from the globalization of S&E skills. Longer-term investments in R&D and science education can further enable G7 countries to remain competitive by rebuilding student interest in S&E fields and by expanding the domestic supply of skilled S&E labor. Douglas Gilman (212) 902-3132 [email protected]Goldman Sachs & Co. The Global Markets Institute is the public policy research unit of Goldman Sachs Global Investment Research. Its mission is to provide research and high-level advisory services to policymakers, regulators and investors around the world. The Institute leverages the expertise of Research and other Goldman Sachs professionals, as well as highly-regarded thought leaders outside the firm, to offer written analyses and host discussion forums. The Goldman Sachs Group, Inc. Global Investment Research
Transcript
September 20, 2010
Global Markets Institute
The new geography of
global innovation
The new geography of global innovation While the United States and Japan remain leaders in innovation,
increased competition from growth markets, notably China, suggests a
changing landscape. Research and development spending in Asia
surpassed EU levels in 2005, and is likely to overtake US levels in the
next five years, thanks primarily to striking growth in R&D investment
in China.
Measures of R&D intensity, or R&D investment as a share of GDP,
allow for cross-country comparisons of commitment to R&D. R&D
intensity has remained flat across G7 markets during the last decade at
2.1%. In China it has impressively doubled as a share of GDP since
1999, reaching 1.5%, which remains low by international standards.
R&D investment is driven largely by the corporate sector, which
finances more than two-thirds of total R&D spending in many
countries. Companies in a range of industries, from pharmaceuticals to
technology hardware, have exposure to new hubs of global innovation.
Pipeline concerns and the role of human capital The new geography of global innovation is critically dependent upon
higher education in science and engineering (S&E) fields. Student
interest in S&E is low in G7 countries, suggesting that these markets
are likely to have difficulty replacing an aging cohort of native-born
scientists and engineers. Reliance on foreign-born skilled labor is set to
rise further as the world’s S&E skill base shifts toward Asia, notably
China, where S&E fields represent 40% of all new university degrees
awarded (more than two and a half times US levels).
New geography demands a policy response Innovation-led productivity growth in the G7 will increasingly require
public policies which attract and retain skilled foreign students and
workers. In the short term, a more flexible and talent-friendly
immigration regime can help developed economies and companies to
benefit from the globalization of S&E skills. Longer-term investments in
R&D and science education can further enable G7 countries to remain
competitive by rebuilding student interest in S&E fields and by
expanding the domestic supply of skilled S&E labor.
The Global Markets Institute is the public policy research unit of Goldman Sachs Global Investment Research. Its mission is to provide research and high-level advisory services to policymakers, regulators and investors around the world. The Institute leverages the expertise of Research and other Goldman Sachs professionals, as well as highly-regarded thought leaders outside the firm, to offer written analyses and host discussion forums.
The Goldman Sachs Group, Inc. Global Investment Research
September 20, 2010 Global Markets Institute
The Goldman Sachs Group, Inc. 2
Table of Contents
Introduction 3
The new geography of global innovation 3
Pipeline concerns and the role of human capital 4
New geography demands a policy response 4
The new geography of global innovation 4
Shifting patterns of R&D investment 4
The corporate sector drives the increase in spending 5
Employment by US multinationals is shifting toward growth markets. 8
Shifting patterns of innovative activity 9
Pipeline concerns and the role of human capital 11
More students are studying outside the G7 … 11
… and more of them are studying science and engineering 11
Educational pipeline feeds a rapidly aging skilled labor force 14
New geography demands a policy response 15
Immigration policy 15
Innovation policy 16
Education policy 17
Conclusion 19
Bibliography 21
The author would like to thank Abby Joseph Cohen, Sandra Lawson, Sarah Friar and Julio Quinteros for helpful
comments.
September 20, 2010 Global Markets Institute
The Goldman Sachs Group, Inc. 3
Introduction
Much of the focus on the rise of the BRICs (Brazil, Russia, India, and China) has
centered on their role as engines of global manufacturing. Low unit labor costs, large
populations and favorable demographics mean that this trend has additional room to
run in many emerging countries, including the N-11 countries. Beyond
manufacturing, however, the growth markets story is increasingly about innovation.
This paper discusses the globalization of innovative activity and implications for
economic competitiveness and public policy in developed countries.
The United States and Japan remain leaders in global innovation, but a range of
measures suggests that new hubs of global innovation are emerging, notably China.
This shift is supported by a number of drivers, including: (1) strong R&D investment
growth in Asia, which is increasingly financed by the private sector; and (2) the
globalization of higher education, particularly in science and engineering.
The emergence of new centers of science education and global R&D enables firms in
a range of sectors to rethink where they operate and invest. Policy initiatives,
particularly concerning immigration and skills, can support the future
competitiveness of G7 countries. Efforts to deepen innovation within these countries
may also help address rising challenges to sustainable growth, including healthcare
cost inflation, energy security and climate change.
The new geography of global innovation
A range of measures suggests a changing and more global innovation landscape. While
the United States and Japan remain leaders in science and technology innovation, they
face increased competition from leading growth markets, notably China. R&D spending in
Asia exceeds EU levels and is likely to overtake US levels in the next five years. This
principally reflects strong growth in China, now the world’s third leading R&D investor (at
$100 billion), behind the United States (at $325 billion) and Japan (at $123 billion). The
government’s target of spending 2.5% of GDP on R&D by 2020 would translate into a
tripling of China’s R&D investment over the next decade, to $300 billion.
While ambitious government goals for R&D intensity suggest continued growth in R&D
spending in China and a relative reweighting of the global total, broader changes in R&D
investment are largely driven by the corporate sector in many markets. Industry finances
the majority of R&D investment spending both in the United States and Japan as well as
across many growth markets. Industry finances more than 65% of total R&D spending in
the United States, 70% of total R&D spending in China, and approximately 75% of total
R&D spending in Korea and Japan. Companies driving this shift are those in
pharmaceuticals, computer and electronic products, and transportation equipment, as well
as those in some professional, scientific, and technical services fields.
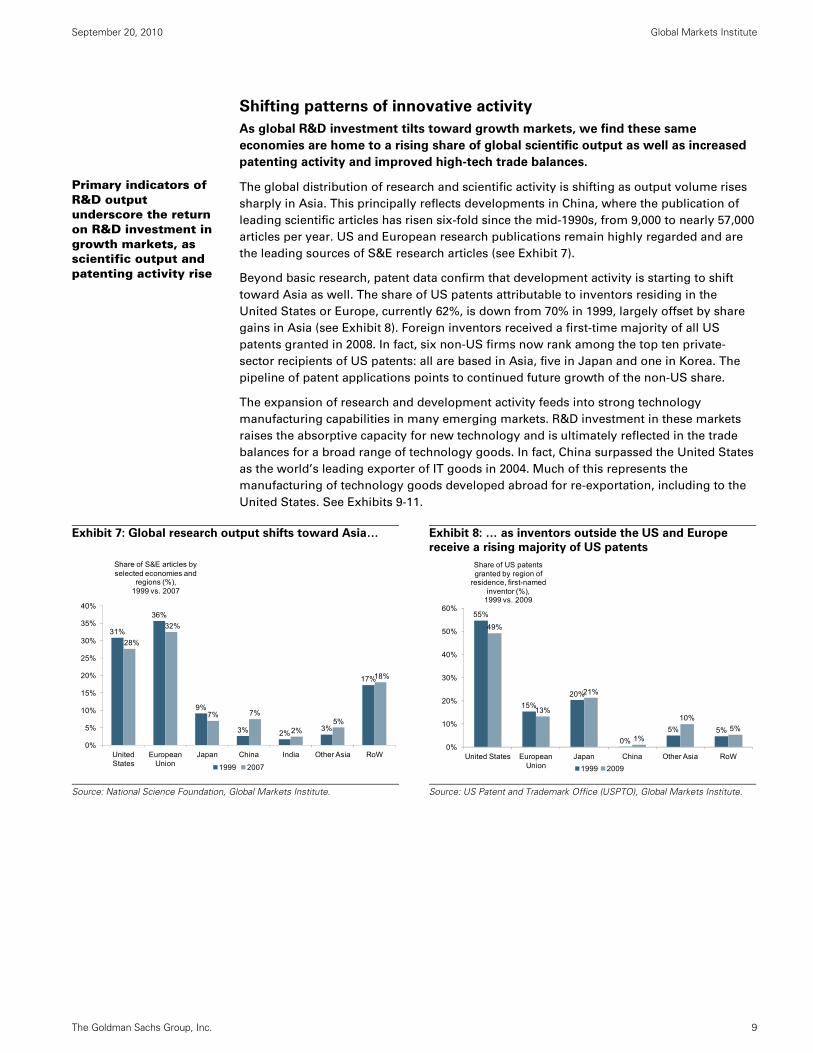
Along with a shift in R&D investment we find that emerging markets are home to a rising
share of global patenting activity, improved high-tech trade balances and strong labor
productivity growth, which further affects incentives for R&D investment and employment.
The global dispersion of innovative activity enables companies across a range of sectors to
rethink where they operate and invest, making several markets, including China and India,
increasingly attractive to corporate R&D investment and employment.
Changing global R&D flows suggest continued shifts in scientific output
New centers of global science suggest opportunities for R&D investment and employment across a range of sectors
September 20, 2010 Global Markets Institute
The Goldman Sachs Group, Inc. 4
Pipeline concerns and the role of human capital
The new geography of global innovation is critically dependent upon higher education in
S&E fields. Local students in G7 countries show little interest in science and engineering
education today. These fields represent less than 25% of all new university degrees
awarded in G7 countries, and just 15% of all new degrees awarded in the United States.
Against the backdrop of an aging supply of local scientists and engineers, this suggests
that G7 countries will increasingly need to turn elsewhere for skilled labor. Reliance on
foreign-born skilled labor is set to rise further as the world’s S&E skill base shifts toward
Asia, notably China, where S&E fields represent 40% of all new university degrees awarded
(more than two and a half times US levels). As noted below, however, there are questions
regarding the comparability of degree standards across countries.
New geography demands a policy response
Public policies that attract and retain skilled foreign nationals are essential to innovation-
led productivity growth in G7 countries. In the short term, a more flexible and talent-
friendly immigration regime can help developed economies (and companies) to benefit
from the globalization of S&E skills and the heightened mobility of highly-skilled workers.
Longer-term investments in innovation, including R&D, and science and math education,
can support G7 competitiveness by rebuilding student interest in S&E fields and by
expanding the domestic supply of skilled S&E labor. Well-positioned companies in the
technology and healthcare sectors, including technology hardware, healthcare services
and medical technology, could be notable beneficiaries of effective policy action, as could
those in educational services.
The new geography of global innovation
A range of measures suggests a changing and more global innovation landscape.
While the United States and Japan remain leaders in science and technology
innovation, they face increased competition from leading growth markets, notably
China.
Shifting patterns of R&D investment
R&D spending in Asia exceeds EU levels and is likely to overtake US levels in the next
five years. Rapid growth in China, now the world’s third leading R&D investor at $100
billion per year, is a major factor.
The shifting geography of R&D is most evident in terms of investment. In absolute terms,
global R&D spending has nearly doubled over the past decade, reaching $1 trillion. G7
markets account for more than $615 billion of this investment (with $325 billion coming
from the United States and $123 billion coming from Japan), but their shares have declined
since the late-1990s, offset by large share gains in China and, to a lesser extent, other
growth markets in Asia.
The current pace of R&D investment growth in Asian markets, most notably China and
Korea, is considerably higher than the pace of growth in G7 markets, suggesting continued
convergence. R&D spending in China has grown by more than 20% per year, on average,
during the last decade, and by 8% per year in Korea. Average R&D investment in G7
markets, by comparison, has grown by 3.2% annually during the same period.
The globalization of S&E education is reshaping the world’s S&E skill base
Policy action on immigration, innovation, and education remains “top of mind” in G7 countries
The United States remains the world’s leading R&D investor
September 20, 2010 Global Markets Institute
The Goldman Sachs Group, Inc. 5
Measuring R&D investment as a share of GDP allows for cross-country comparisons of
commitment to R&D. R&D intensity has remained flat across G7 markets during the last
decade at 2.1%. In China it has doubled as a share of GDP since 1999, reaching 1.5%, which
remains low by international standards. R&D intensity in Japan and Korea is meaningfully
higher at approximately 3.5%.
Ambitious policy goals in China suggest that future investment in research and innovation
will remain strong. The government’s spending target of spending 2.5% of GDP on R&D by
2020 would translate into a tripling over the next decade, to $300 billion. This investment is
likely to be accompanied by a sharply rising number of researchers, many of whom are
ultimately responsible for deploying incremental R&D investment. Elsewhere, R&D
intensities in Korea and Japan already significantly exceed US levels. See Exhibits 1-2.
Exhibit 1: Steady rise in global R&D investment Asia outspends Europe, continues to converge to US levels
Exhibit 2: Greatest R&D intensity gains are in Asia China’s investment has doubled as a share of GDP since ‘99
Source: Global Markets Institute, OECD.
Source: OECD.
The corporate sector drives the increase in spending
The corporate sector finances the majority of R&D investment spending, both in the United
States and Japan as well as across many growth markets. Industry finances 70% of total
R&D spending in China, up sharply from 58% in 2000. Industry finances more than 65% of
total R&D spending in the United States and approximately 75% of total R&D spending in
Korea and Japan (see Exhibit 3). India is a notable exception, with government sources
financing more than 80% of total R&D expenditure. Globally, fifteen of the top 25 public
companies by reported R&D investment, collectively responsible for nearly $84 billion in
R&D investment, are headquartered outside of the United States, primarily in Japan and
Europe. These companies fall primarily in the pharmaceutical, technology hardware, and
automotive industries.
United States
Japan
China
Korea
EU-27
Asia-3
$0
$50
$100
$150
$200
$250
$300
$350
$400
1996 1998 2000 2002 2004 2006 2008 2010 2012
Asia-3: Japan, China, Korea
Estimates for 2009-2012 based on trailing average annual growth rate, 2002-2008.
Gross expenditure on R&D (constant 2000
US$billions), 1996-2012E
0.0%
0.5%
1.0%
1.5%
2.0%
2.5%
3.0%
3.5%
4.0%
G7 France OECD Germany United States
India China Japan Korea
1997 2002 2007
R&D expenditure in China doubled as a share of GDP during the decade 1998-2007.
flat or limited growth in R&D intensity strong growth in R&D intensity
R&D intensity (gross expenditures on R&D as
share of GDP), 1997-2007
R&D investment remains a key policy priority in China; spending is likely to reach $300 billion by 2020
September 20, 2010 Global Markets Institute
The Goldman Sachs Group, Inc. 6
Exhibit 3: Increasing percentage of R&D investment financed by the private sector Approximately 75% of R&D spending in China, Korea and Japan now driven by industry
Source: OECD.
The new geography of global innovation is also evident in private sector R&D
investment by US-based multinationals. As growth abroad outpaces growth within the
United States, a rising share of this industry R&D is deployed abroad (see Exhibits 4-6).
Total R&D investment by US-based multinationals nearly doubled over the decade to
2007, reaching $235 billion. While US parent companies are responsible for 85% of this
R&D investment, investment attributable to the majority-owned foreign affiliates
(MOFAs) of US firms has grown notably. This shift is increasingly important given that
the corporate sector now accounts for more than 65% – and rising – of total US R&D
investment.
Much of the R&D investment by foreign affiliates has been in research-intensive
industries such as pharmaceuticals and technology hardware, as firms in these fields
link up with local universities and establish dedicated research centers in emerging
markets. For example, Pfizer, the world’s second-leading corporate R&D investor (at
$7.4 billion), has both its own R&D Center in Shanghai and research partnerships with
leading Chinese universities.
69
%
64
%
55
%
48
%
33
%
55
% 58
%
72
%
72
%
66
%
64
%
55
%
47
%
29
%
60
%
70
% 74
% 78
%
0%
10%
20%
30%
40%
50%
60%
70%
80%
90%
100%
United States
OECD European Union
United Kingdom
Russia Singapore China Korea Japan
2000 2007
Percentage of gross domestic expenditure on R&D financed by industry
(%), 2000 vs. 2007
increasing percentage of R&D investmentfinanced by industry in key Asian markets
R&D investment by US multinationals continues to rise, with foreign affiliates playing an increasingly important role
September 20, 2010 Global Markets Institute
The Goldman Sachs Group, Inc. 7
Exhibit 4: The private sector finances a growing majority
of total US R&D investment …
Exhibit 5: … and foreign affiliates have gained share
Source: National Science Foundation.
Source: National Science Foundation, Global Markets Institute.
Exhibit 6: Non-US companies represent 15 of the top 25 public companies by reported
global R&D investment as of 2006 R&D intensity, or R&D as a percentage of sales, highest among pharmaceutical firms
Source: Standard & Poor’s, Global Markets Institute.
Age distribution of S&E doctorate holders in US labor
force (% of total, by age), 1993 and 2003
Continued aging of the native-born workforce points to pipeline concerns in G7 markets …
… suggesting that reliance on foreign-born labor will rise in highly-skilled occupations
September 20, 2010 Global Markets Institute
The Goldman Sachs Group, Inc. 15
New geography demands a policy response
Public policies that attract and retain skilled foreign nationals are essential to
innovation-led productivity growth in G7 countries. In the short term, a more flexible
and talent-friendly immigration regime can help developed economies to benefit from
the globalization of S&E skills and the heightened mobility of highly-skilled workers.
Over the long term, competitiveness will be strengthened by investments in
innovation, including support for R&D, and preparatory science and math education.
Immigration policy
Investments in education and innovation, while they represent important generational
commitments, take time to pay off. In the short term, a more flexible and talent-friendly
immigration regime can help developed economies to attract and retain skilled
foreign nationals, and benefit from the globalization of S&E skills.
The number of international students studying in OECD countries is rising in absolute
terms and as a share of total enrollment. Its continued rise is not inevitable, however. More
stringent student visa procedures in the wake of September 11, 2001, for example, led to a
three-year decline in the number of international students enrolled in US higher education
– the first decline in thirty years (see Exhibit 18). The “stay rates” of these students also
declined, though they generally remain quite high. For example, up to 90% of US S&E
doctorate recipients from China plan to stay in the United States after graduation,
according to the National Science Foundation. Policies in a number of countries are now
focused on encouraging the return of skilled nationals working abroad, suggesting that
stay rates, while driven by a number of considerations, could decline in the future.
For those international students who seek to work in the United States after graduation,
their ability to do so is often governed by the availability of H-1B temporary work visas.
This is particularly relevant to computer-related occupations, which accounted for half of
all H-1B visas granted in 2008. In practice, the fixed cap on H-1B visas bears little
resemblance to changing industry needs over the economic cycle, and political discussions
about the program are often unrelated to prevailing industry needs.
Revisiting skilled immigration policy is only one part of a broader approach to
comprehensive immigration reform. The US Senate’s recent introduction of the StartUp
Visa Act of 2010 outlines a new visa class for immigrant inventors, EB6, and suggests that
immigration reform is likely to remain a focus of attention in the coming months.
September 20, 2010 Global Markets Institute
The Goldman Sachs Group, Inc. 16
Exhibit 18: 3-year decline in the international student population following tighter visa
procedures post-9/11
Source: Institute for International Education, Global Markets Institute.
Innovation policy
In the medium term, government policy can also support innovation by investing in
basic research and digital infrastructure.
The financial crisis and subsequent fiscal concerns have led to a reduction in public
investment in research and development in several developed countries. In dollar terms,
this pullback has generally been offset by rising corporate R&D investment. Yet because
public and private R&D funding tend to support different stages of the innovation lifecycle,
the pullback in public investment may strain basic research, particularly in the physical
sciences and engineering. Renewing public investment in R&D can help stimulate
complementary co-investment in applied research by the private sector, particularly in
fields such as energy and health, where the public benefits of such investment are high.
Moreover, increased coordination of public and private research efforts can further
improve national innovation capacity – often at low cost – as can appropriate tax incentives.
There is broad agreement that effective use of robust R&D tax credits can effectively
stimulate private research spending. A temporary form of research credit has existed in the
United States in some form since 1981, but has frequently been allowed to expire. The
recent proposal to expand and make permanent the research tax credit in the United States,
currently under review, may be an important part of policy reform in this area.
0.0%
0.5%
1.0%
1.5%
2.0%
2.5%
3.0%
3.5%
4.0%
0
100,000
200,000
300,000
400,000
500,000
600,000
700,000
800,000
1948
1950
1952
1954
1956
1959
1963
1965
1967
1969
1971
1973
1975
1977
1979
1981
1983
1985
1987
1989
1991
1993
1995
1997
1999
2001
2003
2005
2007
International students
Number of international students enrolled in US
higher education, 1948-2009
International student share of total US higher education enrollment,
1948-2009
Declining federal support for R&D likely to strain basic research
September 20, 2010 Global Markets Institute
The Goldman Sachs Group, Inc. 17
Government policy is also central to the design and expansion of innovation infrastructure,
including high-speed wireless broadband. The United States remains the largest
broadband market in the OECD, with 75 million subscribers, but it ranks 15th among OECD
countries in terms of broadband penetration (see Exhibit 19). Recognizing the importance
of digital infrastructure, the US FCC recently proposed more extensive government
investment in broadband penetration. If enacted, the plan is likely to create opportunities
for companies in a number of sectors, including: wireless broadband service providers
and wireless infrastructure providers, electronic medical records and e-care providers,
online educational services, and integrated utility companies leveraging smart grid
technology. Importantly, enhanced broadband access is often viewed as an essential part
of broadening the delivery of S&E education.
Exhibit 19: The US remains the OECD’s largest broadband market, but penetration is low
Source: OECD, Global Markets Institute.
Education policy
The most effective way to support the long-term competitiveness of the labor market
is to invest in skills. High-quality schools and robust vocational training are essential
to the creation and retention of jobs in high value-added sectors. They can also help
address the domestic skills gap in highly specialized fields, particularly as a growing
cohort of skilled (and relatively young) workers comes online in growth markets.
The quality and flexibility of the highly-skilled labor market, and the system of higher
education on which it depends, are essential to economic recovery. Below-average and
declining performance on leading international indicators of educational quality raise
concerns about the US outlook. The average math literacy score among 15-year-olds is in
the bottom quartile of OECD countries for which comparable data are available (see Exhibit
20). US science literacy is better on a relative basis though it remains well below average
(see Exhibit 21). In both math and science, US students score below those in all but one G7
country: Italy. These results reinforce the need for investment in preparatory science,
38
37
35
34
33
33
32
31
30
30
29
29
29
28
27
27
25
24
23
23
22
21
21
20
18
17
17
17
13
119 8
0
5
10
15
20
25
30
35
40
45
Ne
the
rlan
dsD
en
ma
rkN
orw
ay
Sw
itze
rlan
dK
ore
aIc
ela
nd
Sw
ed
en
Lu
xem
bour
gF
inla
nd
Ca
na
da
Ge
rma
ny
Fra
nce
Un
ited
Kin
gd
om
Be
lgiu
mG
7 a
vera
ge
Un
ited
Sta
tes
Au
stra
liaJa
pa
nO
EC
DN
ew
Ze
ala
nd
Au
stria
Ire
lan
dS
pa
inIta
lyC
zech
Re
pu
blic
Po
rtu
ga
lG
ree
ceH
un
ga
ryS
lova
k R
ep
ubl
icP
ola
nd
Tu
rke
yM
exi
co
Broadband subscribers per 100
inhabitants, 2009
US policy focus is now on the research tax credit and broadband penetration, with implications for a range of sectors
Long-term investments in science, technology, engineering and math (STEM) education are critical to G7 competitiveness
September 20, 2010 Global Markets Institute
The Goldman Sachs Group, Inc. 18
technology, engineering and math (STEM) education as well as tax credits for continued
education and training.
US employment and income growth over the next decade will depend critically on
educational attainment in these fields. Total US employment is projected to grow by 15.3
million in the decade to 2018, led by growth in professional and related occupations,
according to the US Bureau of Labor Statistics. Employment growth is expected to be
relatively strongest in healthcare and computer-related occupations, and roughly half of
the 30 fastest growing occupations will require at least a bachelor’s level education. Young
adults in the United States (ages 25-34) are now less likely than their counterparts in many
other countries to have attained such an education.
The United States already spends notably more than other OECD countries on education,
with much of the investment made at the state and local level. Cumulative education
spending per student in the United States is more than 35% higher than the level of
spending in Japan, for example, despite the demonstrably lower science and math
outcomes noted above. While soaring fiscal deficits are likely to limit the ability of capacity-
constrained state and local governments to further increase funding, in many ways the
more important issues are the efficiency of spending and the quality of the standards. An
expansion of early-age STEM education can benefit from public-private partnerships and
new sources of discretionary education funding, including private foundations.1
Exhibit 20: US math literacy is well below G7 and OECD averages
US math literacy in the bottom quartile of OECD countries
Source: OECD, Global Markets Institute.
1 For example, earlier in 2010, twelve national foundations committed $500 million in 2010 funds to
leverage the US Department of Education’s $650 million Investing in Innovation Fund. These funds will
help to implement new national standards in math and other subjects.
406 42
445
946
246
647
448
0 490
490
491
492
495
495
496
497
498
501
502
504
505
506
510
513
520
520
522
523
527
530
531 54
754
8
350
400
450
500
550
600
Mex
ico
Turk
eyG
reec
eIt
aly
Por
tuga
lU
nite
d S
tate
sS
pain
Luxe
mbo
urg
Nor
way
Hun
gary
Slo
vak
Rep
ublic
Pol
and
Uni
ted
Kin
gdom
Fra
nce
G7
aver
age
OE
CD
ave
rage
Irel
and
Sw
eden
Ger
man
yA
ustr
iaIc
elan
dC
zech
Rep
ublic
Den
mar
kA
ustr
alia
Bel
gium
N
ew Z
eala
ndJa
pan
Can
ada
Sw
itzer
land
Net
herla
nds
Kor
eaF
inla
nd
OECD PISA scoring ranges from 0 to1,000 and is scaled to have an average of 500.
Average math literacy scores of 15-year-olds, by country, 2006
The United States led the world in its share of young adults with a college degree as recently as the 1980s; it now ranks 12th
September 20, 2010 Global Markets Institute
The Goldman Sachs Group, Inc. 19
Exhibit 21: … US science literacy is marginally better, though still below-average
US science literacy in the bottom third of OECD countries
Source: OECD, Global Markets Institute.
Conclusion
A range of measures suggests a changing and more global innovation landscape.
While the United States and Japan remain leaders in science and technology innovation,
they face increased competition from leading growth markets, notably China. R&D
spending in China has grown by more than 20% per year, on average, during the last
decade, and by 8% per year in Korea.
There has been a notable increase in R&D intensity in China, which has doubled since 1999
and continues to converge on the G7 average of 2.1% of GDP. The majority of this growth
has been driven by the corporate sector.
The new geography of global innovation is critically dependent upon higher
education in science and engineering fields – the pipeline to skilled labor. Current low
levels of native student interest in S&E fields suggest that G7 markets are likely to have
difficulty replacing an aging cohort of native-born scientists and engineers. Reliance on
foreign-born skilled labor is set to rise further as the world’s S&E skill base shifts toward
Asia, including China and Korea, where S&E fields represent 40% of all new university
degrees awarded (more than two and a half times US levels). The yawning gap is most
evident in engineering, the leading field of study for CEOs of S&P 500 companies, where
student interest in most countries is now higher than it is in the United States.
Public policies which attract and retain skilled foreign nationals are essential to
innovation-led productivity growth in G7 countries. In the short term, a more flexible
and talent-friendly immigration regime can help developed economies to benefit from the
globalization of S&E skills. Longer-term investments in R&D and preparatory science and
math education can further enable G7 countries to remain competitive by rebuilding
student interest in S&E fields and by expanding the domestic supply of skilled S&E labor.
410 42
447
347
447
5 486
487
488
488
489
491
495
496
498
500
503
504
508
508
510
511
512
513
515
516
522
525
527
530
531
534
563
350
400
450
500
550
600
Mex
ico
Turk
eyG
reec
eP
ortu
gal
Ital
yLu
xem
bour
gN
orw
ayS
lova
k R
epub
licS
pain
Uni
ted
Sta
tes
Icel
and
Fra
nce
Den
mar
kP
olan
dO
EC
D a
vera
geS
wed
enH
unga
ryG
7 av
erag
eIr
elan
dB
elgi
um
Aus
tria
Sw
itzer
land
Cze
ch R
epub
licU
nite
d K
ingd
omG
erm
any
Kor
eaN
ethe
rland
sA
ustr
alia
New
Zea
land
Japa
nC
anad
aF
inla
nd
OECD PISA scoring ranges from 0 to1,000 and is scaled to have an average of 500.
Average science literacy scores of 15-year-olds, by country, 2006
September 20, 2010 Global Markets Institute
The Goldman Sachs Group, Inc. 20
These policies are also critical to managing challenges to sustainable development,
including healthcare cost inflation, energy security and climate change, and to
meeting ambitious goals being set in these areas. This is particularly true in Asia,
where above-trend population growth and rapid urbanization will continue to fuel rising
demand for health services, transportation, energy and resources, heightening policy focus
on innovative solutions to a range of development challenges.
Even such well-funded areas as national defense require investment in innovation capacity
and skilled labor. For example, the National Research Council recently concluded its review
of nuclear forensics in the United States by stating, “At present, personnel skilled in
nuclear forensics at the national laboratories are too few and are spread too thinly.
Furthermore, a substantial fraction of the experienced personnel are retired, now eligible
for retirement, or nearing retirement age. The university pipeline produces too few people
in needed specialties and universities will not produce them without stable funding for
relevant R&D”. This one example is likely being repeated in many other technical fields.
September 20, 2010 Global Markets Institute
The Goldman Sachs Group, Inc. 21
Bibliography
American Energy Innovation Council. (June 2010). A Business Plan for America's Energy Future.
Borjas, G. J. (2004). Do Foreign Students Crowd Out Native Students from Graduate Programs?
National Bureau of Economic Research.
Bureau of Labor Statistics, US Department of Labor. (2009). Foreign-born Workers: Labor Force
Characteristics in 2008. US Department of Labor.
Committee on Nuclear Forensics. (2010). Nuclear Forensics: A Capability at Risk. Washington, DC:
National Research Council.
Council of Economic Advisers, Executive Office of the President. (2007). Immigration's Economic
Impact.
Division of Science Resource Statitics, National Science Foundation. (2007). Asia's Rising Science and
Technology Strength. National Science Foundation.
Fiegener, M. K. (2008). Survey of Earned Doctorates: Doctorate Recipients from US Universities,
Summary Report 2007-2008. Division of Science Resources Statistics, National Science Foundation.
Finn, M. G. (2007). Stay Rates of Foreign Doctorate Recipients from US Universities, 2005. Oak Ridge
Institute for Science and Education.
Foley, D. J. (2006). Characteristics of Doctoral Scientists and Engineers in the United States: Detailed
Statistical Tables, 2006. National Science Foundation.
Kannankutty, N., & Burrelli, J. (2007). InfoBrief: Why Did They come to the United States? A Profile of
Immigrant Scientists and Engineers. National Science Foundation.
Kolesnikova, N. A. (January/February 2010). Community Colleges and Economic Mobility. Federal
Reserve Bank of St. Louis Review, 92(1) , 27-53.
McGinnis, P., & Nora Johnson, S. (2006). Working in America: Transitioning in a Global Economy. The
Global Markets Institute, Goldman Sachs.
Ministry of Science and Technology for the People's Republic of China. (2006). National Guidelines for
Medium- and Long-term Plans for Science and Technology Development of China, 2006-2020.
National Research Council. (2010). The Dragon and the Elephant: Understanding the Development of
Innovation Capacity in China and India. Washington, DC: The National Academies.
National Science Board. (2010). Science and Engineering Indicators 2010. Arlington, VA: National
Science Foundation.
OECD. (2009). Education at a Glance 2009: OECD Indicators. Paris, France: OECD.
OECD. (2009). International Migration Outlook. Paris, France: OECD.
OECD. (2009). Measuring China's Innovation System: National Specificities and International
Comparisons. Paris, France: OECD.
OECD. (2008). OECD Science, Technology and Industry Outlook 2008. Paris, France: OECD.
OECD. (2010). The High Cost of Low Educational Performance: The Long-Run Economic Impact of
Improving PISA Outcomes. Paris, France: OECD.
The Task Force on the Future of American Innovation. (2005). The Knowledge Economy: Is the United
States Losing its Competitive Edge?
US Department Education. (2009). American Recovery and Reinvestment Act Report: Summary of
Programs and State-by-State Data. Washington, DC: US Department Education.
US Federal Communications Commission. (2010). Connecting America: The National Broadband Plan.
September 20, 2010 Global Markets Institute
The Goldman Sachs Group, Inc. 22
Disclosures
This report has been prepared by the Global Markets Institute, the public policy research unit of the Global Investment Research Division of The
Goldman Sachs Group, Inc. (“Goldman Sachs”). As public policy research, this report, while in preparation, may have been discussed with or
reviewed by persons outside of the Global Investment Research Division, both within and outside Goldman Sachs, and all or a portion of this report
may have been written by policy experts not employed by Goldman Sachs.
While this report may discuss implications of legislative, regulatory and economic policy developments for industry sectors, it does not attempt to
distinguish among the prospects or performance of, or provide analysis of, individual companies and does not recommend any individual security or
an investment in any individual company and should not be relied upon in making investment decisions with respect to individual companies or
securities.
Distributing entities
This research is disseminated in Australia by Goldman Sachs JBWere Pty Ltd (ABN 21 006 797 897) on behalf of Goldman Sachs; in Canada by
Goldman Sachs Canada Inc. regarding Canadian equities and by Goldman Sachs & Co. (all other research); in Germany by Goldman Sachs & Co.
oHG; in Hong Kong by Goldman Sachs (Asia) L.L.C.; in India by Goldman Sachs (India) Securities Private Ltd.; in Japan by Goldman Sachs Japan Co.,
Ltd.; in the Republic of Korea by Goldman Sachs (Asia) L.L.C., Seoul Branch; in New Zealand by Goldman Sachs JBWere (NZ) Limited on behalf of
Goldman Sachs; in Singapore by Goldman Sachs (Singapore) Pte. (Company Number: 198602165W); and in the United States of America by
Goldman, Sachs & Co. Goldman Sachs International has approved this research in connection with its distribution in the United Kingdom and
European Union.
European Union: Goldman Sachs International, authorised and regulated by the Financial Services Authority, has approved this research in
connection with its distribution in the European Union and United Kingdom; Goldman, Sachs & Co. oHG, regulated by the Bundesanstalt für
Finanzdienstleistungsaufsicht, may also be distributing research in Germany.
General disclosures in addition to specific disclosures required by certain jurisdictions
Goldman Sachs conducts a global full-service, integrated investment banking, investment management and brokerage business. It has investment
banking and other business relationships with governments and companies around the world, and publishes equity, fixed income, commodities and
economic research about, and with implications for, those governments and companies that may be inconsistent with the views expressed in this
report. In addition, its trading and investment businesses and asset management operations may take positions and make decisions without regard
to the views expressed in this report.
Copyright 2010 The Goldman Sachs Group, Inc.
No part of this material may be (i) copied, photocopied or duplicated in any form by any means or (ii) redistributed without the prior written
consent of The Goldman Sachs Group, Inc.
September 20, 2010 Global Markets Institute
The Goldman Sachs Group, Inc. 23
President
Abby Joseph Cohen, CFA + 1-212-902-4095 (US)
Chair
Esta E. Stecher + 1-212-902-3490 (US)
Sandra Lawson + 1-212-902-6821 (US) Michael A. Moran, CFA +1-212-357-3512 (US) Douglas B. Gilman + 1-212-902-3132 (US) Amy C. Semaya + 1-212-902-7009 (US) Rachel Siu + 1-212-357-0493 (US)
Recent Publications
Critical juncture in global accounting standard setting June 14, 2010
Pension review 2010: Pension palpitations refuse to dissipate for corporate plan sponsors June 11, 2010
Tax time: Plenty of charges from the health care bill, but changes in corporate behavior loom March 30, 2010
“First take”: Corporate pensions end 2009 with improved funding but face ongoing challenges March 25, 2010
Dynamic approach to investment policy for corporate pension plans March 16, 2010
SEC takes action on climate change disclosures January 28, 2010
2010 pension preview: Headwinds remain despite funded status improvement December 18, 2009
Effective Regulation: Part 5 - Ending "Too Big to Fail" December 15, 2009
Health Buys Wealth December 3, 2009
Goldman Sachs Research personnel may be contacted by electronic mail