While deal volume in the quarter was still largely driven by Asia and Oceania deals, deal value increased in other regions as a percentage of total activity, due to megadeals outside of China. If commodity prices continue to recover, metals assets outside of Asia and Oceania should become more attractive to potential investors. Executivesummary The global metals industry has been divided in terms of performance this quarter: While aluminum prices reached their highest prices in close to six years, iron ore has entered a bear market after facing price volatility throughout the first half of 2017. Companies continue to be wary of investing in high-cost projects under the current unstable environment. There were 16 deals announced in Q3 2017, with a total value of $5.4 billion. The Asia and Oceania region continues to drive M&A activity, as China’s supply-side reform program to reduce steel and aluminum overcapacity has led to restructuring, impacting demand and pricing. At the same time, Chinese demand has diversified into other industries as it reduces its dependency on national infrastructure. If commodity prices continue to rise under a low supply/high demand setting, we expect M&A activity to improve, which has steadily declined during the past year. US import restrictions could also come into effect under the current administration, further affecting production and demand. Industry players will continue to focus on organic growth while commodity pricing remains volatile. However, as the global metals market continues to evolve, industry restructuring is expected in the future. — Brian Kelly, US Metals Deals leader PwC Deals Global metals M&A deals insights Q3 2017 Optimize Deals Global Metals M&A Deals Insights Q3 2017 Update 1 Optimize deals Source: Thomson Reuters Value by the numbers Q3 2017 vs. Q2 2017 2017 YTD vs. 2016 YTD $5.4B 12% 106% 31% 35% Q3 2017 Volume by the numbers Q3 2017 vs. Q2 2017 2017 YTD vs. 2016 YTD 16 3% Q3 2017 0% • Deal value for the first nine months of 2017 was $17.4 billion, 35% lower than the first nine months of last year. • There were 56 deals in the first nine months of 2017, a 3% decrease from last year. • The average deal size in Q3 was 34% lower than the quarterly average (from Q4 2014 to Q3 2017) of $508 million, indicating a preference towards smaller transactions as companies focus on obtaining value from existing assets and projects. • Norwegian Hydro Aluminium’s $1.5 billion acquisition of Sapa AS was the largest transaction and only megadeal announced this quarter. • The Asia and Oceania region continues to drive M&A activity, accounting for 81% of volume this quarter. • Aluminum surpassed the Steel category as the most active category this quarter, accounting for 50% of deal value and 31% of deal volume. • Deal value and volume remain the highest within country borders, as cross-border activity in the metals sector is restricted due to the localized and commoditized nature of the industry. Key trends/highlights
Transcript
While deal volume in the quarter was still largely driven by Asia and Oceania deals, deal value increased in other regions as a percentage of total activity, due to megadeals outside of China. If commodity prices continue to recover, metals assets outside of Asia and Oceania should become more attractive to potential investors.
Executive summary
The global metals industry has been divided in terms of performance this quarter: While aluminum prices reached their highest prices in close to six years, iron ore has entered a bear market after facing price volatility throughout the first half of 2017. Companies continue to be wary of investing in high-cost projects under the current unstable environment.
There were 16 deals announced in Q3 2017, with a total value of $5.4 billion. The Asia and Oceania region continues to drive M&A activity, as China’s supply-side reform program to reduce steel and aluminum overcapacity has led to restructuring, impacting demand and pricing. At the same time, Chinese demand has diversified into other industries as it reduces its dependency on national infrastructure. If commodity prices continue to rise under a low supply/high demand setting, we expect M&A activity to improve, which has steadily declined during the past year. US import restrictions could also come into effect under the current administration, further affecting production and demand.
Industry players will continue to focus on organic growth while commodity pricing remains volatile. However, as the global metals market continues to evolve, industry restructuring is expected in the future.
Optimize deals
— Brian Kelly,US Metals Deals leader
PwC DealsGlobal metals M&Adeals insights Q3 2017
Optimize DealsGlobal Metals M&A
Deals InsightsQ3 2017 Update 1
Optimize deals
Source: Thomson Reuters
Value by the numbers
Q3 2017vs.
Q2 2017
2017 YTDvs.
2016 YTD
$5.4B 12%106% 31%35%Q3 2017
Volume by the numbers
Q3 2017vs.
Q2 2017
2017 YTDvs.
2016 YTD
16 3%Q3 2017
0%
• Deal value for the first nine months of 2017 was $17.4 billion, 35% lower than the first nine months of last year.
• There were 56 deals in the first nine months of 2017, a 3% decrease from last year.
• The average deal size in Q3 was 34% lower than the quarterly average (from Q4 2014 to Q3 2017) of $508 million, indicating a preference towards smaller transactions as companies focus on obtaining value from existing assets and projects.
• Norwegian Hydro Aluminium’s $1.5 billion acquisition of Sapa AS was the largest transaction and only megadeal announced this quarter.
• The Asia and Oceania region continues to drive M&A activity, accounting for 81% of volume this quarter.
• Aluminum surpassed the Steel category as the most active category this quarter, accounting for 50% of deal value and 31% of deal volume.
• Deal value and volume remain the highest within country borders, as cross-border activity in the metals sector is restricted due to the localized and commoditized nature of the industry.
Key trends/highlights
Optimize deals
0
5
10
15
20
Steel Aluminum Iron Ore Other Metals
0.0
0.1
1.0
10.0
100.0
Source: Thomson Reuters and other publicly available sources
Highlights of Q3 2017 deal activity
Source: Thomson Reuters and other publicly available sources
Source: Thomson Reuters and other publicly available sources
<$50 mn $50 mn to $250 mn$250 mn to $1,000 mn >$1,000 mnAverage deal size (R-axis)
Largest transactionIn July, Hydro Aluminium AS, a unit of Norsk Hydro ASA, acquired the remaining 50% interest in Sapa AS, an Oslo-based producer of primary aluminum for $1.5 billion. On completion, the new entity was renamed Extruded Solutions.
Deal activityTotal deal value this quarter was $5.4 billion, 31% higher than last quarter. Year to date, deal value is 35% lower than last year due to a more challenging environment for acquisitions.
There were 16 deals this quarter, the same as last quarter. Year to date, deal volume is 3% lower than last year. The average deal size fell well below the historical average of $508 million this quarter.
MegadealsThe transaction between Norwegian Hydro Aluminium and Sapa AS was the only megadeal this quarter. Over the past three years, the sector has had an average of two megadeals each quarter.
Sector category analysisInterest in the Steel category appears to be decreasing as global manufacturing shows a trend towards the use of lighter metals—a major channel of demand for aluminum products. Aluminum surpassed the Steel category as the most active category this quarter, accounting for 50% of deal value and 31% of deal volume.
4Q14
1Q15
2Q15
3Q15
4Q15
1Q16
2Q16
3Q16
4Q16
1Q17
2Q17
3Q17
4Q14
1Q15
2Q15
3Q15
4Q15
1Q16
2Q16
3Q16
4Q16
1Q17
2Q17
3Q17
4Q14
1Q15
2Q15
3Q15
4Q15
1Q16
2Q16
3Q16
4Q16
1Q17
2Q17
3Q17
Optimize deals
6.2
4.3
5.2
1.5
5.0
1.8
36
.9
8.9
4.1
1.6
5.6
2.7
3.2
3.6
7.4
4.1
8.0
8.1
6.2
1.7
1.6
2.5
3.3
2.0
Strategic investors Financial investors
0
5
10
15
20
25
30
35
40
15
13
13
514
11
17
12
16
85 10
15
712
916
13
14
10
11
59 7
0
10
20
Key trends and insights
Source: Thomson Reuters and other publicly available sources.
Source: Thomson Reuters and other publicly available sources
Optimize DealsGlobal Metals M&A
Deals InsightsQ3 2017 Update 3
38%
44%
0%
10%
20%
30%
40%
50%
60%
70%
4Q
14
1Q
15
2Q
15
3Q
15
4Q
15
1Q
16
2Q
16
3Q
16
4Q
16
1Q
17
2Q
17
3Q
17
Financial investor share of M&A activity
Financial buyer share of total value
Financial buyer share of total volume
51
%
42
%
55
%
94
%
18
%
66
%
10
0%
89
%
61
%
79
%
38
%
46
%
0%
10%
20%
30%
40%
50%
60%
70%
80%
90%
100%
4Q
14
1Q
15
2Q
15
3Q
15
4Q
15
1Q
16
2Q
16
3Q
16
4Q
16
1Q
17
2Q
17
3Q
17
Share of deal value by acquirer region
Asia and Oceania North America South America
UK and Eurozone Europe ex-UK and Eurozone Africa/Undisclosed
61
%
67
%
88
%
72
%
79
%
10
0%
82
%
71
%
72
%
71
%
81
%
81
%
0%
10%
20%
30%
40%
50%
60%
70%
80%
90%
100%
4Q
14
1Q
15
2Q
15
3Q
15
4Q
15
1Q
16
2Q
16
3Q
16
4Q
16
1Q
17
2Q
17
3Q
17
Share of deal volume by acquirer region
Asia and Oceania North America South America
UK and Eurozone Europe ex-UK and Eurozone Africa/Undisclosed
Deal value ($B)
Deal volume
Strategic vs. financial investorsStrategic investors continue to contribute to the largest share of deal activity in the sector. Sixty-two percent of value and 56% of volume was attributed to transactions between sector participants. This contribution is consistent with previous quarters, possibly due to high entry barriers for non-industry participants.
Regional analysisThe Asia and Oceania region remains the most active by volume, accounting for 81% of targets and acquirers in the sector this quarter. By value, the Asia and Oceania region accounts for 62% of targets and 49% of acquirers in 2017. The high activity in Asia and Oceania is likely due to the region’s sustained economic growth.
4Q
16
1Q
17
2Q
17
4Q
14
1Q
15
2Q
15
3Q
15
4Q
15
1Q
16
2Q
16
3Q
16
3Q
17
4Q
16
1Q
17
2Q
17
4Q
14
1Q
15
2Q
15
3Q
15
4Q
15
1Q
16
2Q
16
3Q
16
3Q
17
Optimize dealsKey trends and insights
Regional analysis (continued)
Source: Thomson Reuters and other publicly available sources
Europe ex-UK and EurozoneLocal: 1 deal, $1.5 billionInbound: 1 deal, $0.5 billionOutbound: 0 deals
Source: Thomson Reuters and other publicly available sources
Optimize DealsGlobal Metals M&A
Deals InsightsQ3 2017 Update 4
54
%
61
%
88
%
66
%
79
%
87
%
68
%
71
%
66
%
75
%
88
%
81
%
0%
20%
40%
60%
80%
100%
4Q
14
1Q
15
2Q
15
3Q
15
4Q
15
1Q
16
2Q
16
3Q
16
4Q
16
1Q
17
2Q
17
3Q
17
Share of disclosed deal volume by target region
Asia and Oceania North America South America
UK and Eurozone Europe ex-UK and Eurozone Africa/Undisclosed
42
%
55
%
93
%
16
%
55
%
90
%
86
%
61
%
64
%
72
%
46
%
61
%
0%
20%
40%
60%
80%
100%
4Q
14
1Q
15
2Q
15
3Q
15
4Q
15
1Q
16
2Q
16
3Q
16
4Q
16
1Q
17
2Q
17
3Q
17
Share of disclosed deal value by target region
Asia and Oceania North America South America
UK and Eurozone Europe ex-UK and Eurozone Africa/Undisclosed
Looking forward in 2017
While deal volume is still largely driven by Asia and Oceania deals, deal value increased in other regions as a percentage of total activity, due to megadeals outside of China. If commodity prices continue to recover, metals assets outside of Asia and Oceania should become more attractive to potential investors.
Overall, the third quarter 2017 was flat in terms of deal volume and remained down in value compared to year to date, third quarter 2016. This trend can be expected to sustain in the near term as uncertainty around commodity pricing continues. For example, further aluminum price increases may be on the horizon due to China’s supply-side reforms designed to cut down on polluting and smelting in excess of legal limits and due to a weaker US dollar, which typically drives higher commodity prices. However,
declining trends in steel scrap pricing may lead to buyers negotiating more competitive prices which could drive lower steel prices in the near term.
The continued low metals M&A activity in year to date 2017 may continue in the near term considering the following factors:
• Uncertainty on whether China’s supply-side reforms will cut down on overproduction, leading to higher demand and higher commodity prices.
• A likelihood that longer periods of sustained or increasing commodity prices will be necessary before companies take on significant M&A growth plans.
Metals deals by region (2017 YTD)
Optimize deals
Announced Target name Target nation Acquirer name Acquirer nation Status Deal value* Category
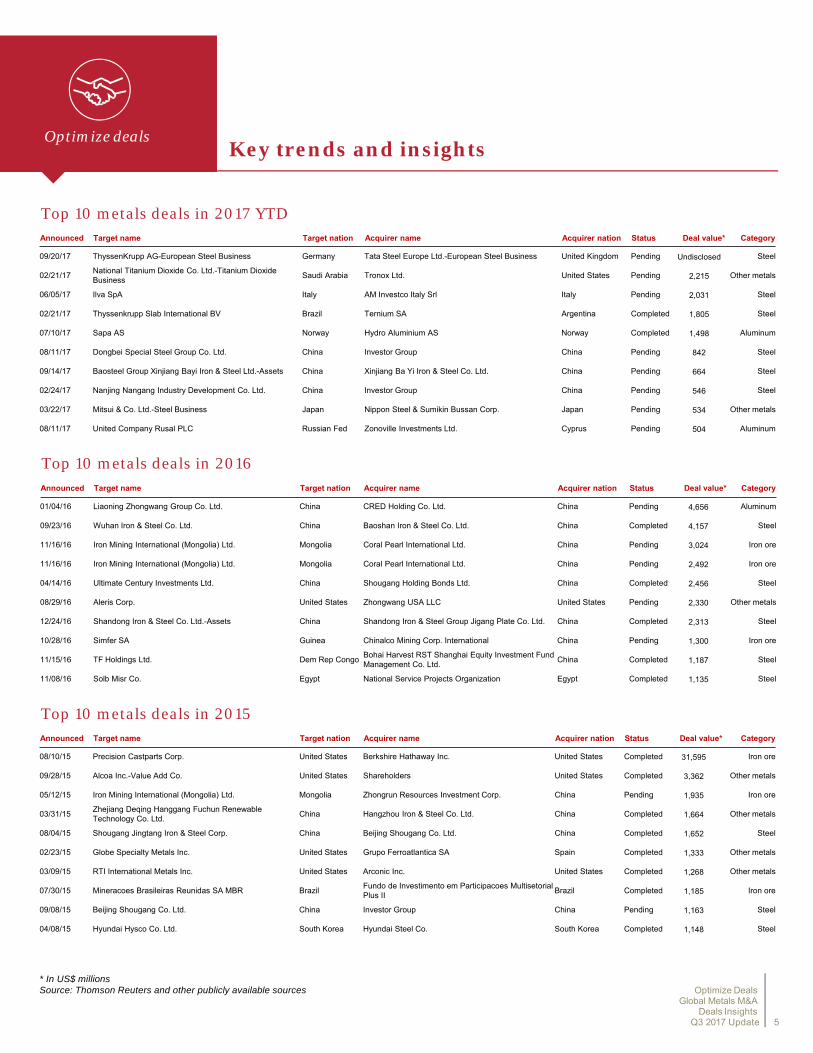
09/20/17 ThyssenKrupp AG-European Steel Business Germany Tata Steel Europe Ltd.-European Steel Business United Kingdom Pending Undisclosed Steel
02/21/17National Titanium Dioxide Co. Ltd.-Titanium Dioxide Business
Saudi Arabia Tronox Ltd. United States Pending 2,215 Other metals
About the dataThe information presented in this report is an analysis of deals in the global metals industry. Deal information was sourced from Thomson Reuters and includes deals for which targets have an SIC code that falls into one of the 30 metals industry groups. Certain adjustments have been made to the information to exclude transactions which are not specific to metals or incorporate relevant transactions that were omitted from the SIC industry codes.
This analysis includes all individual mergers, acquisitions, and divestitures for disclosed or undisclosed values, leveraged buyouts, privatizations, minority stake purchases, and acquisitions of remaining interest announced between October 1, 2014 and September 30, 2017, with a deal status of completed, partially completed, pending, pending regulatory and pending completion and excludes all rumors and seeking buyers. Additionally, transactions that are spin-offs through distribution to existing shareholders are included.
Percentages and values are rounded to the nearest whole number which may result in minor differences when summing totals.
Smart deal makers are perceptive enough to see value others have missed, flexible enough to adjust for the unexpected, aggressive enough to win favorable terms in a competitive environment, and circumspect enough to envision the challenges they will face from the moment the contract is signed. But in a business environment where information can quickly overwhelm, the smartest deal makers look to experienced advisors to help them fashion a deal that works.
PwC’s Deals group can advise metals companies and metals-focused private equity firms on key M&A decisions, from identifying acquisition or divestiture candidates and performing detailed buy-side diligence, to developing strategies for capturing post-deal profits and exiting a deal through a sale, carve-out, or IPO. With more than 9,800 deals professionals in 75 countries, we can deploy seasoned teams that combine metals industry skills with local market knowledge virtually anywhere and everywhere your company operates or executes transactions.
Although every deal is unique, most will benefit from the broad experience we bring to delivering strategic M&A advice, due diligence, transaction structuring, M&A tax, merger integration, valuation, and post-deal services.
In short, we offer integrated solutions, tailored to your particular deal situation and designed to help you extract peak value within your risk profile. Whether your focus is deploying capital through an acquisition or joint venture, raising capital through an IPO or private placement, or harvesting an investment through the divesture process, we can help.
For more information about M&A and related services in the global metals industry, please visit www.pwc.com/us/deals or www.pwc.com/us