25
TEAMSAI©2011 MRO Europe 2011 Conference The Global MRO Forecast 2011 - 2021 Presented by: Chris Doan President & CEO, TeamSAI A Delicate Recovery
| Date post: | 16-Apr-2017 |
| Category: |
Business |
| Upload: | reyyan-demir |
| View: | 754 times |
| Download: | 5 times |
TEAMSAI©2011 MRO Europe 2011 Conference
The Global MRO Forecast 2011 - 2021
Presented by:
Chris Doan President & CEO, TeamSAI
A Delicate Recovery
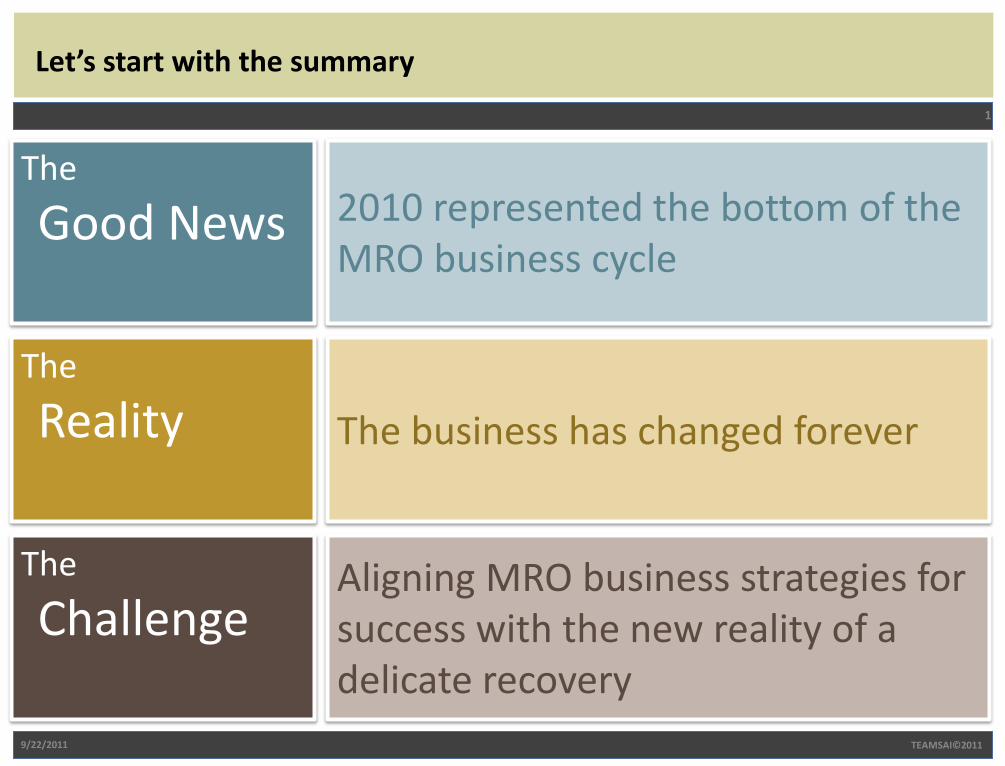
Let’s start with the summary
9/22/2011
1
TEAMSAI©2011
The
Good News 2010 represented the bottom of the MRO business cycle
The
Challenge Aligning MRO business strategies for success with the new reality of a delicate recovery
The
Reality The business has changed forever
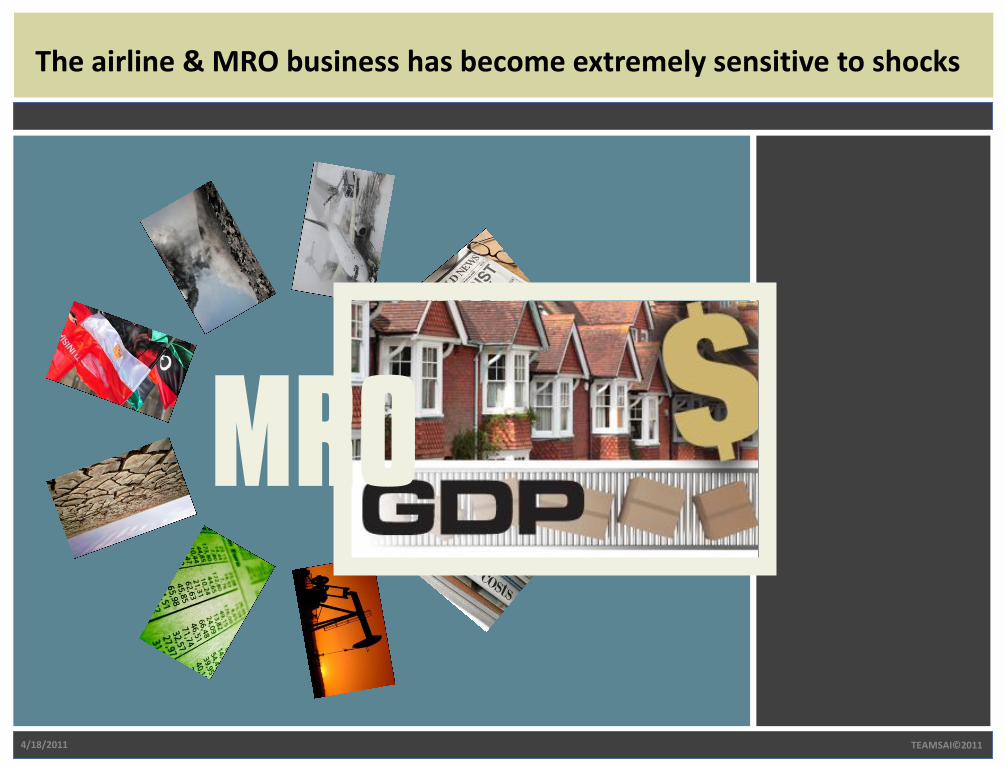
The airline & MRO business has become extremely sensitive to shocks
4/18/2011 TEAMSAI©2011
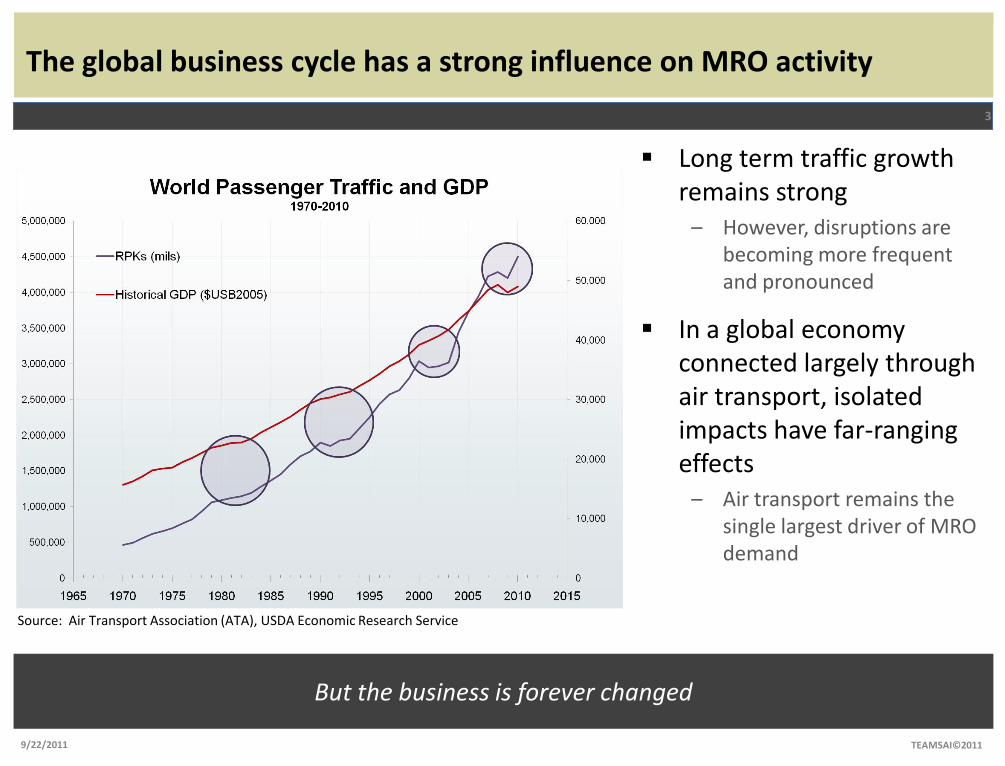
The global business cycle has a strong influence on MRO activity
Long term traffic growth remains strong
– However, disruptions are becoming more frequent and pronounced
In a global economy connected largely through air transport, isolated impacts have far-ranging effects
– Air transport remains the single largest driver of MRO demand
9/22/2011
3
TEAMSAI©2011
Source: Air Transport Association (ATA), USDA Economic Research Service
But the business is forever changed
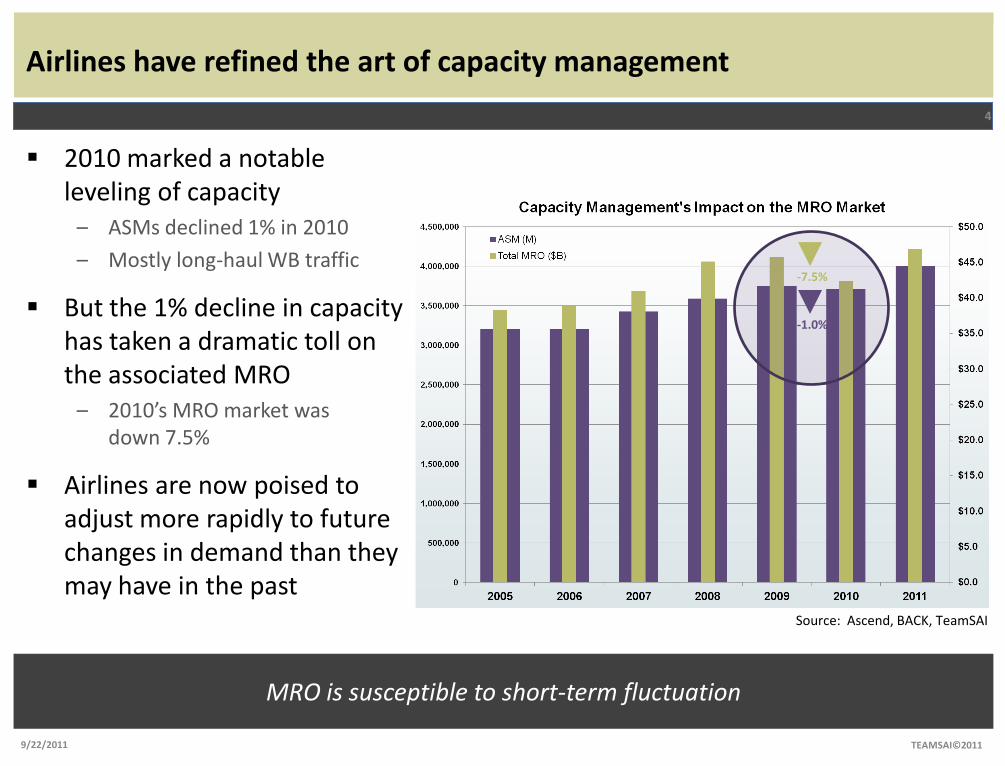
Airlines have refined the art of capacity management
2010 marked a notable leveling of capacity
– ASMs declined 1% in 2010
– Mostly long-haul WB traffic
But the 1% decline in capacity has taken a dramatic toll on the associated MRO
– 2010’s MRO market was down 7.5%
Airlines are now poised to adjust more rapidly to future changes in demand than they may have in the past
9/22/2011
4
TEAMSAI©2011
Source: Ascend, BACK, TeamSAI
MRO is susceptible to short-term fluctuation
-7.5%
-1.0%
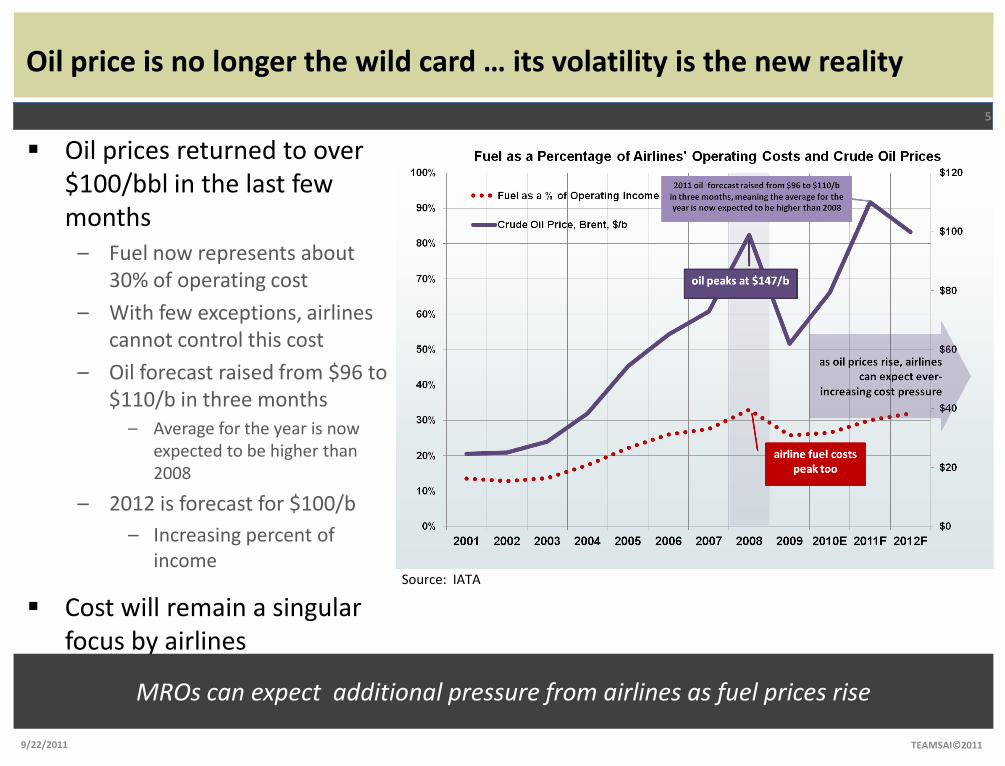
Oil price is no longer the wild card … its volatility is the new reality
Oil prices returned to over $100/bbl in the last few months
– Fuel now represents about 30% of operating cost
– With few exceptions, airlines cannot control this cost
– Oil forecast raised from $96 to $110/b in three months
– Average for the year is now expected to be higher than 2008
– 2012 is forecast for $100/b
– Increasing percent of income
Cost will remain a singular focus by airlines
9/22/2011
5
TEAMSAI©2011
Source: IATA
MROs can expect additional pressure from airlines as fuel prices rise
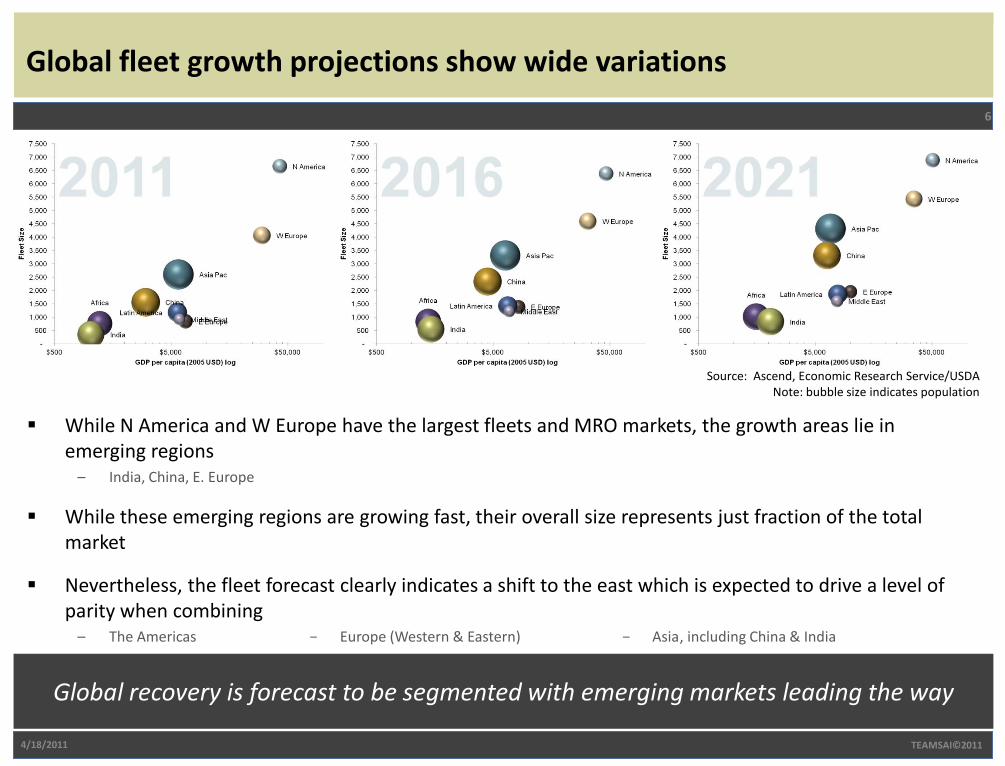
Global fleet growth projections show wide variations
While N America and W Europe have the largest fleets and MRO markets, the growth areas lie in emerging regions
– India, China, E. Europe
While these emerging regions are growing fast, their overall size represents just fraction of the total market
Nevertheless, the fleet forecast clearly indicates a shift to the east which is expected to drive a level of parity when combining
– The Americas − Europe (Western & Eastern) − Asia, including China & India
4/18/2011
6
TEAMSAI©2011
Global recovery is forecast to be segmented with emerging markets leading the way
Note: bubble size indicates populationSource: Ascend, Economic Research Service/USDA
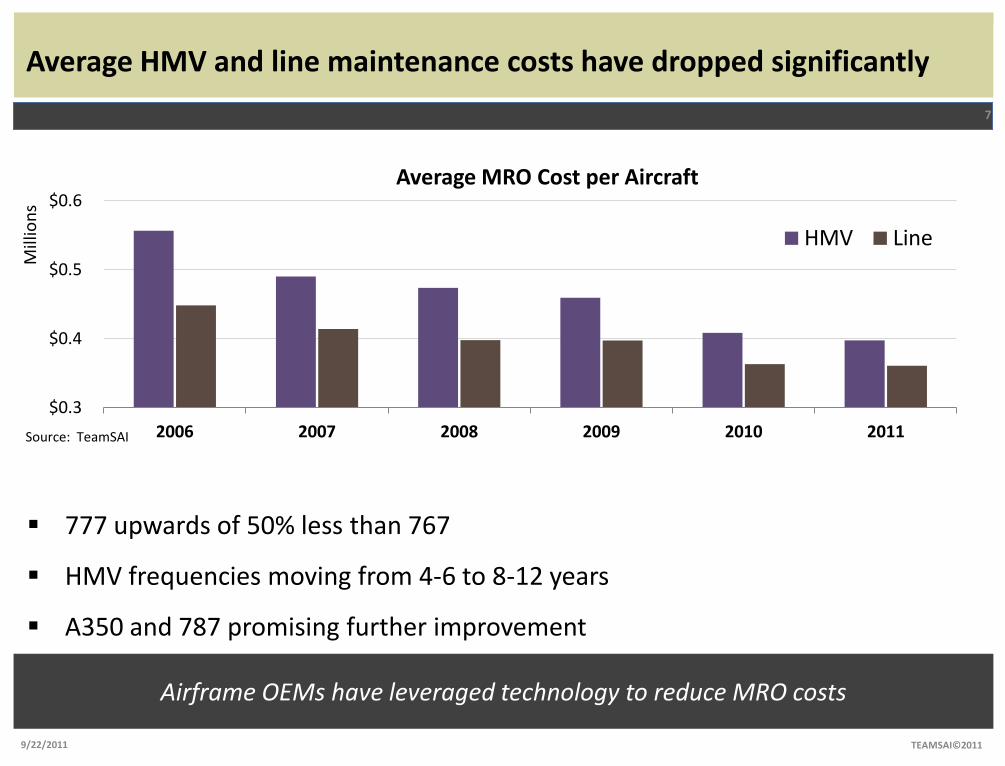
Average HMV and line maintenance costs have dropped significantly
$0.3
$0.4
$0.5
$0.6
2006 2007 2008 2009 2010 2011
Mill
ion
s
Average MRO Cost per Aircraft
HMV Line
777 upwards of 50% less than 767
HMV frequencies moving from 4-6 to 8-12 years
A350 and 787 promising further improvement
9/22/2011
7
TEAMSAI©2011
Source: TeamSAI
Airframe OEMs have leveraged technology to reduce MRO costs
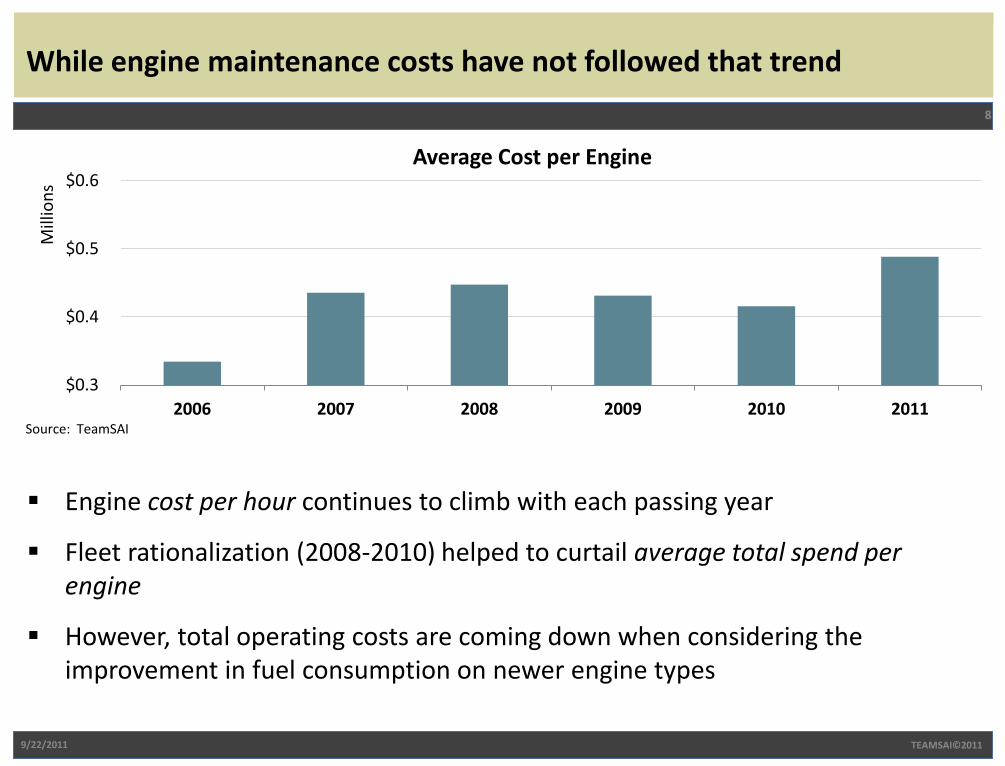
While engine maintenance costs have not followed that trend
$0.3
$0.4
$0.5
$0.6
2006 2007 2008 2009 2010 2011
Mill
ion
s
Average Cost per Engine
Engine cost per hour continues to climb with each passing year
Fleet rationalization (2008-2010) helped to curtail average total spend per engine
However, total operating costs are coming down when considering the improvement in fuel consumption on newer engine types
9/22/2011
8
TEAMSAI©2011
Source: TeamSAI
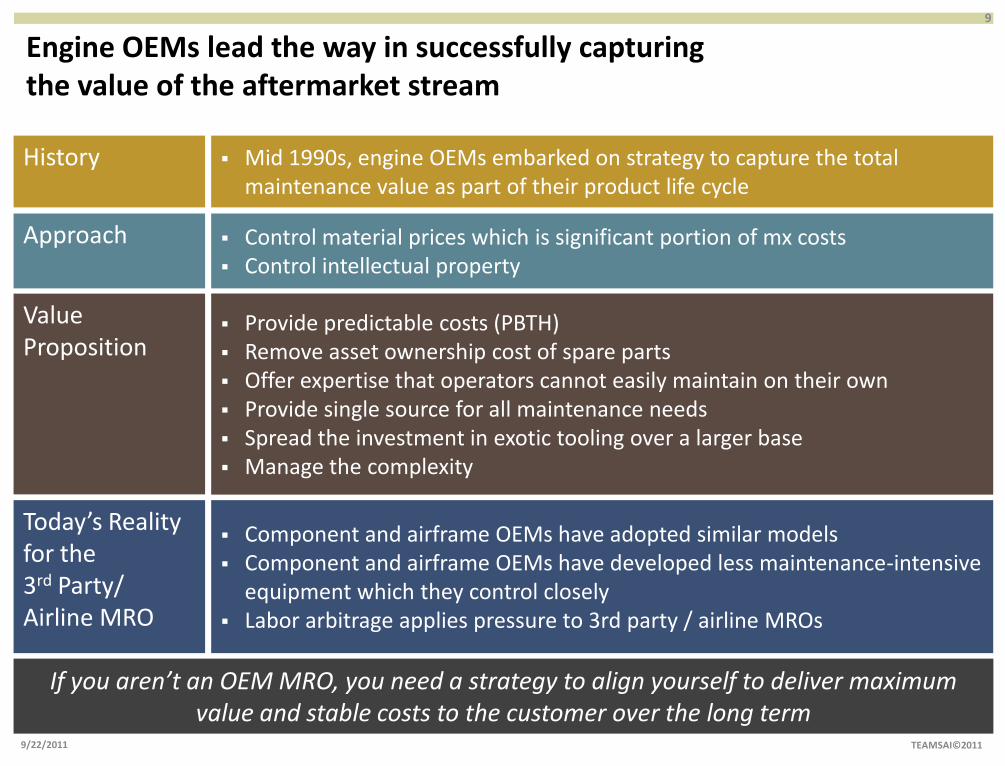
Engine OEMs lead the way in successfully capturing the value of the aftermarket stream
9/22/2011
9
TEAMSAI©2011
Mid 1990s, engine OEMs embarked on strategy to capture the total maintenance value as part of their product life cycle
History
Control material prices which is significant portion of mx costs Control intellectual property
Approach
Provide predictable costs (PBTH) Remove asset ownership cost of spare parts Offer expertise that operators cannot easily maintain on their own Provide single source for all maintenance needs Spread the investment in exotic tooling over a larger base Manage the complexity
Value Proposition
Component and airframe OEMs have adopted similar models Component and airframe OEMs have developed less maintenance-intensive
equipment which they control closely Labor arbitrage applies pressure to 3rd party / airline MROs
Today’s Reality for the 3rd Party/ Airline MRO
If you aren’t an OEM MRO, you need a strategy to align yourself to deliver maximum value and stable costs to the customer over the long term
© 2010 TeamSAI, Inc.
MRO Forecast by the Numbers
2011 - 2021
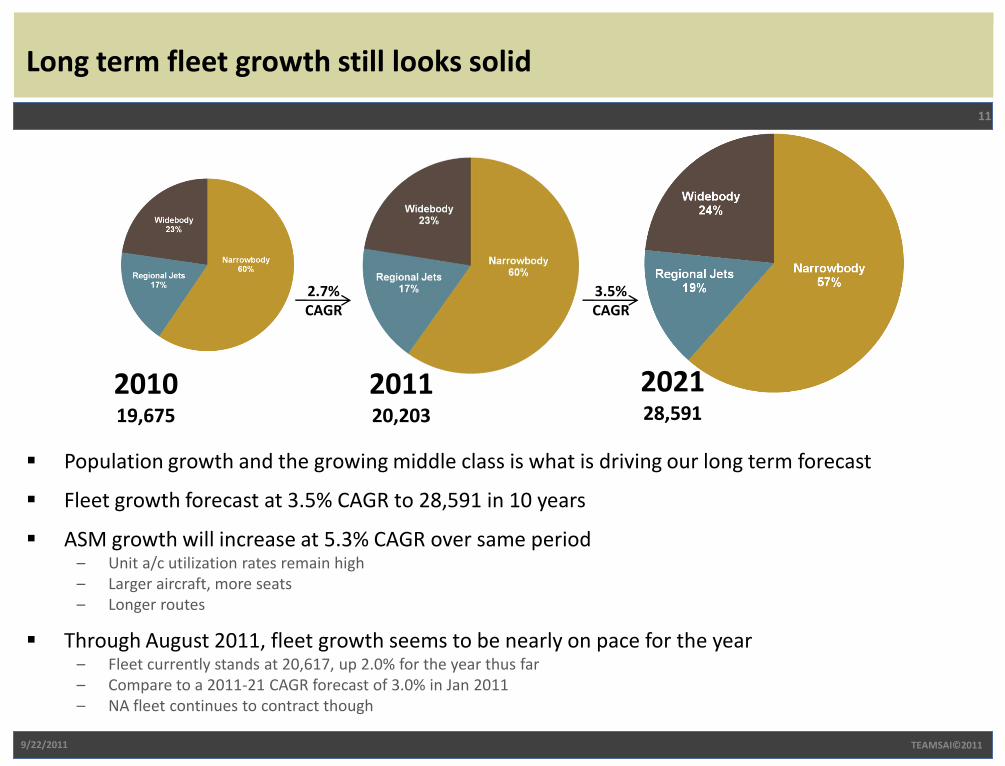
Long term fleet growth still looks solid
Population growth and the growing middle class is what is driving our long term forecast
Fleet growth forecast at 3.5% CAGR to 28,591 in 10 years
ASM growth will increase at 5.3% CAGR over same period – Unit a/c utilization rates remain high – Larger aircraft, more seats – Longer routes
Through August 2011, fleet growth seems to be nearly on pace for the year – Fleet currently stands at 20,617, up 2.0% for the year thus far – Compare to a 2011-21 CAGR forecast of 3.0% in Jan 2011 – NA fleet continues to contract though
2.7% CAGR
3.5% CAGR
2010 19,675
2011 20,203
2021 28,591
9/22/2011
11
TEAMSAI©2011
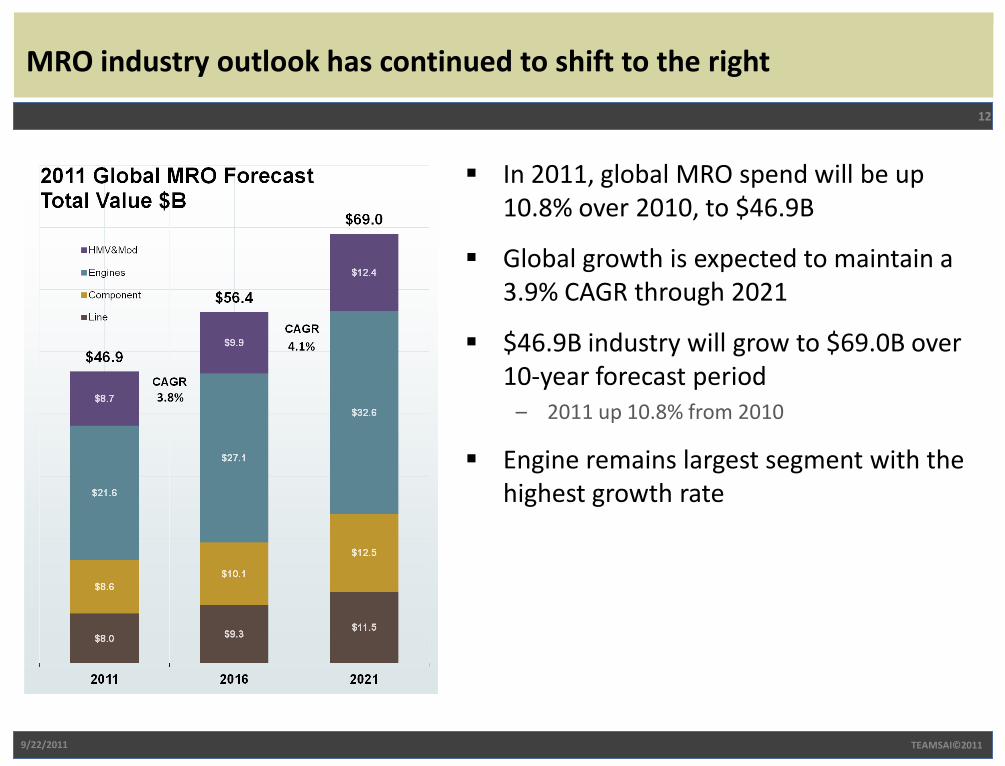
MRO industry outlook has continued to shift to the right
In 2011, global MRO spend will be up 10.8% over 2010, to $46.9B
Global growth is expected to maintain a 3.9% CAGR through 2021
$46.9B industry will grow to $69.0B over 10-year forecast period
– 2011 up 10.8% from 2010
Engine remains largest segment with the highest growth rate
9/22/2011
12
TEAMSAI©2011
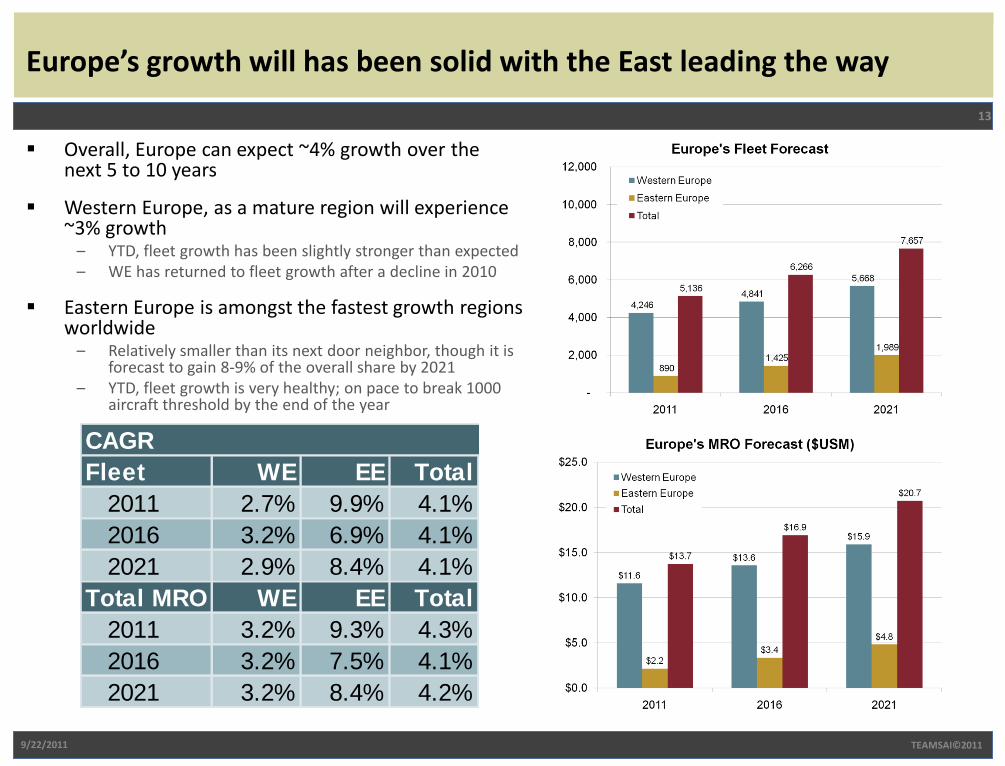
Europe’s growth will has been solid with the East leading the way
Overall, Europe can expect ~4% growth over the next 5 to 10 years
Western Europe, as a mature region will experience ~3% growth
– YTD, fleet growth has been slightly stronger than expected – WE has returned to fleet growth after a decline in 2010
Eastern Europe is amongst the fastest growth regions worldwide
– Relatively smaller than its next door neighbor, though it is forecast to gain 8-9% of the overall share by 2021
– YTD, fleet growth is very healthy; on pace to break 1000 aircraft threshold by the end of the year
13
TEAMSAI©2011
CAGR
Fleet WE EE Total
2011 2.7% 9.9% 4.1%
2016 3.2% 6.9% 4.1%
2021 2.9% 8.4% 4.1%
Total MRO ($M)WE EE Total
2011 3.2% 9.3% 4.3%
2016 3.2% 7.5% 4.1%
2021 3.2% 8.4% 4.2%
9/22/2011
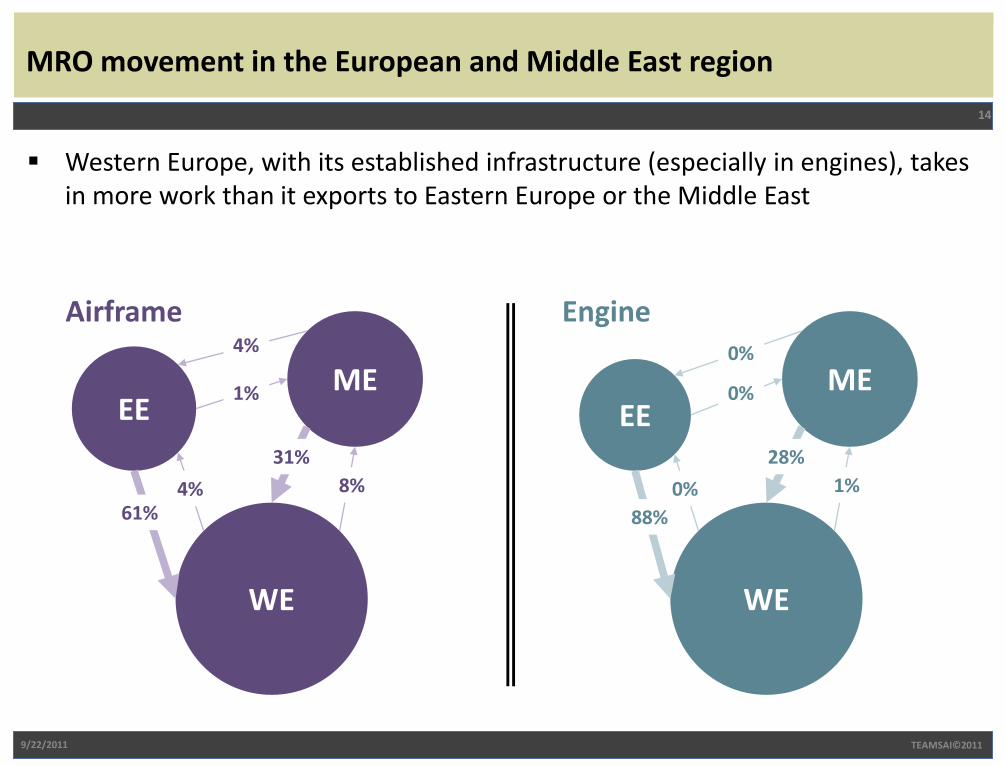
MRO movement in the European and Middle East region
Western Europe, with its established infrastructure (especially in engines), takes in more work than it exports to Eastern Europe or the Middle East
9/22/2011
14
TEAMSAI©2011
EE ME
WE
8%
31%
4% 61%
1%
4%
Airframe
EE ME
WE
1%
28%
0%
88%
0%
0%
Engine
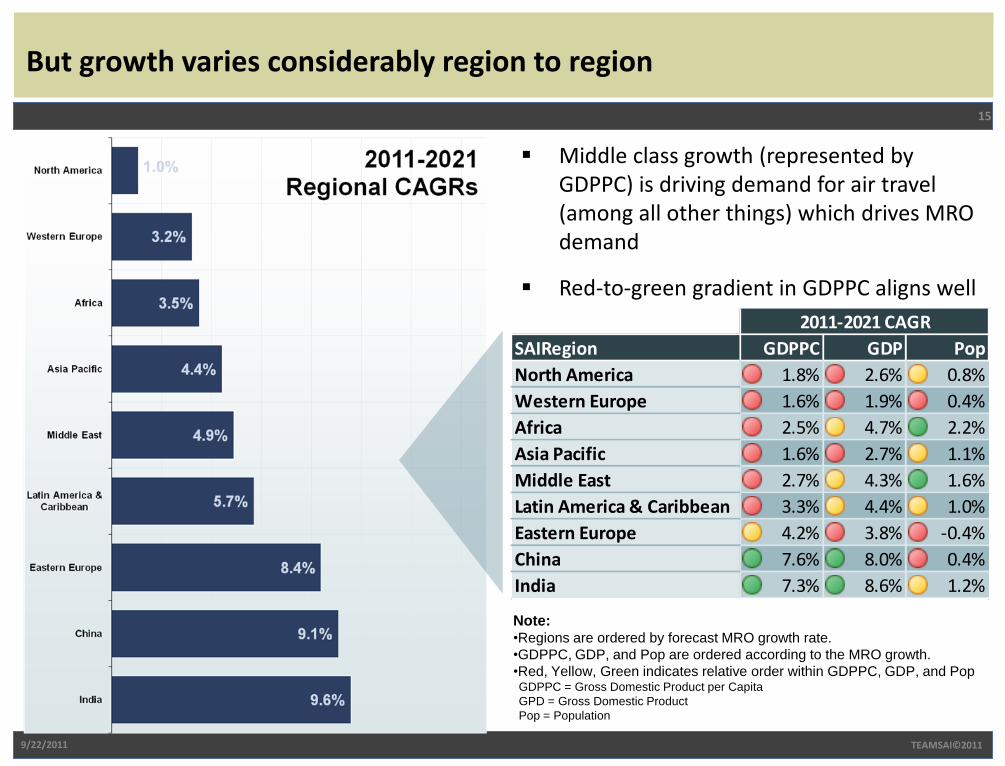
But growth varies considerably region to region
Middle class growth (represented by GDPPC) is driving demand for air travel (among all other things) which drives MRO demand
Red-to-green gradient in GDPPC aligns well with the forecast MRO growth
9/22/2011
15
TEAMSAI©2011
SAIRegion GDPPC GDP Pop
North America 1.8% 2.6% 0.8%
Western Europe 1.6% 1.9% 0.4%
Africa 2.5% 4.7% 2.2%
Asia Pacific 1.6% 2.7% 1.1%
Middle East 2.7% 4.3% 1.6%
Latin America & Caribbean 3.3% 4.4% 1.0%
Eastern Europe 4.2% 3.8% -0.4%
China 7.6% 8.0% 0.4%
India 7.3% 8.6% 1.2%
2011-2021 CAGR
Note: •Regions are ordered by forecast MRO growth rate.
•GDPPC, GDP, and Pop are ordered according to the MRO growth.
•Red, Yellow, Green indicates relative order within GDPPC, GDP, and Pop GDPPC = Gross Domestic Product per Capita
GPD = Gross Domestic Product
Pop = Population
TEAMSAI©2010 9/22/2011
16
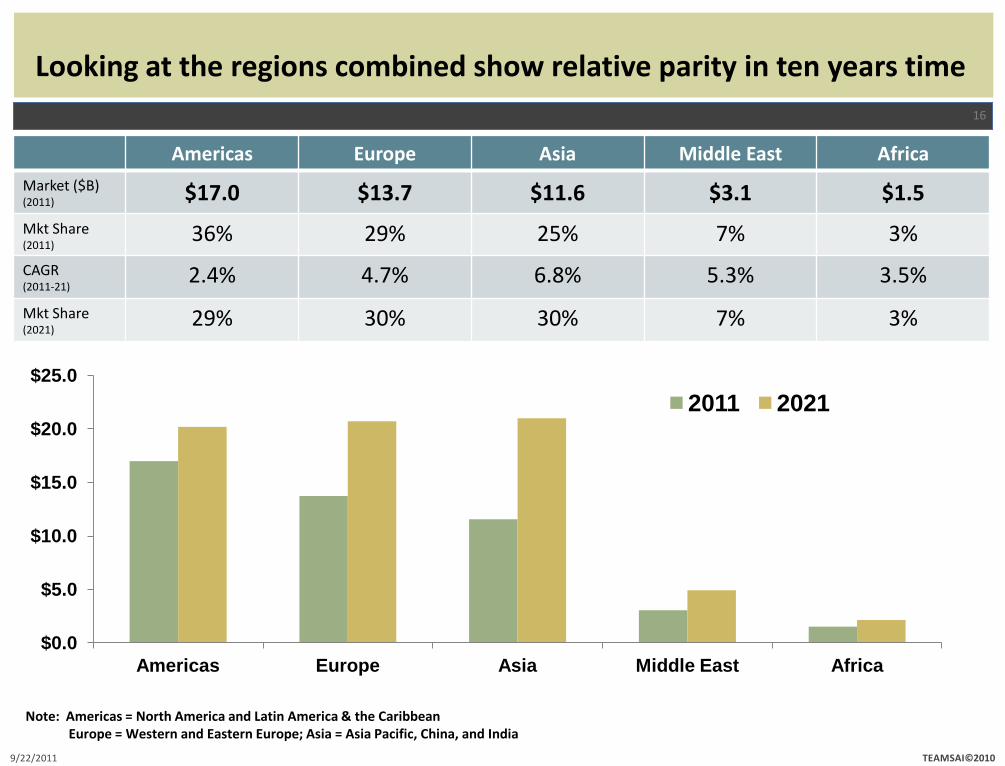
Looking at the regions combined show relative parity in ten years time
$0.0
$5.0
$10.0
$15.0
$20.0
$25.0
Americas Europe Asia Middle East Africa
2011 2021
Americas Europe Asia Middle East Africa
Market ($B) (2011) $17.0 $13.7 $11.6 $3.1 $1.5
Mkt Share (2011)
36% 29% 25% 7% 3%
Note: Americas = North America and Latin America & the Caribbean Europe = Western and Eastern Europe; Asia = Asia Pacific, China, and India
CAGR (2011-21)
2.4% 4.7% 6.8% 5.3% 3.5%
Mkt Share (2021)
29% 30% 30% 7% 3%

In Summary
TEAMSAI©2011
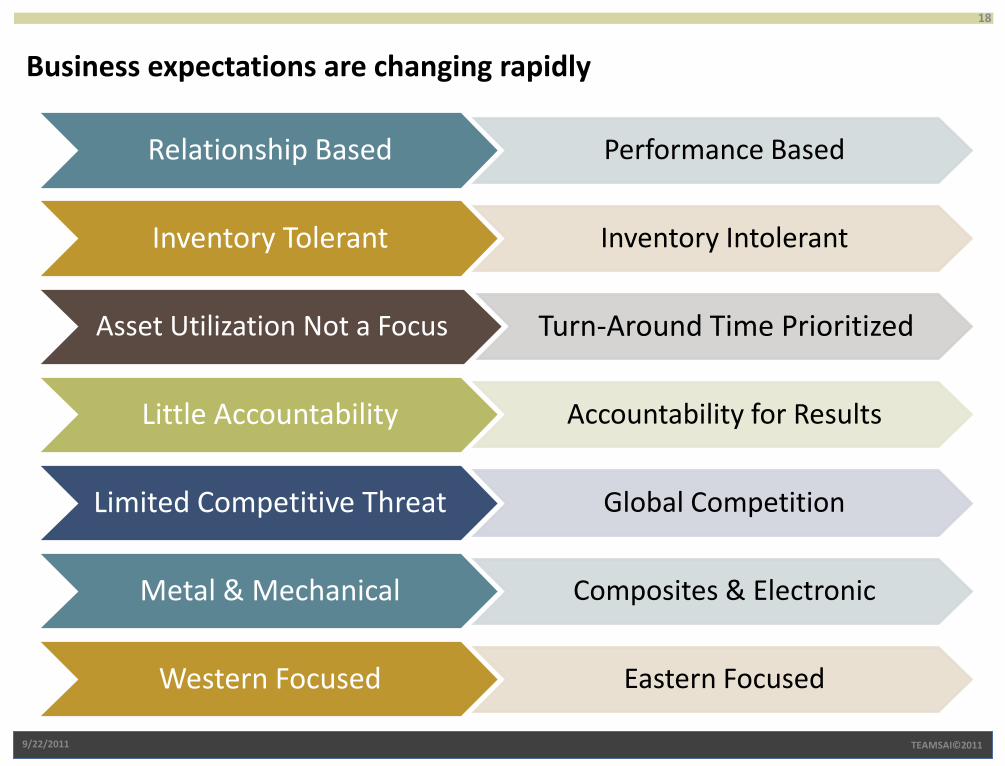
Business expectations are changing rapidly
Relationship Based Performance Based
Inventory Tolerant Inventory Intolerant
Asset Utilization Not a Focus Turn-Around Time Prioritized
Little Accountability Accountability for Results
Limited Competitive Threat Global Competition
Metal & Mechanical Composites & Electronic
Western Focused Eastern Focused
18
TEAMSAI©2011 9/22/2011
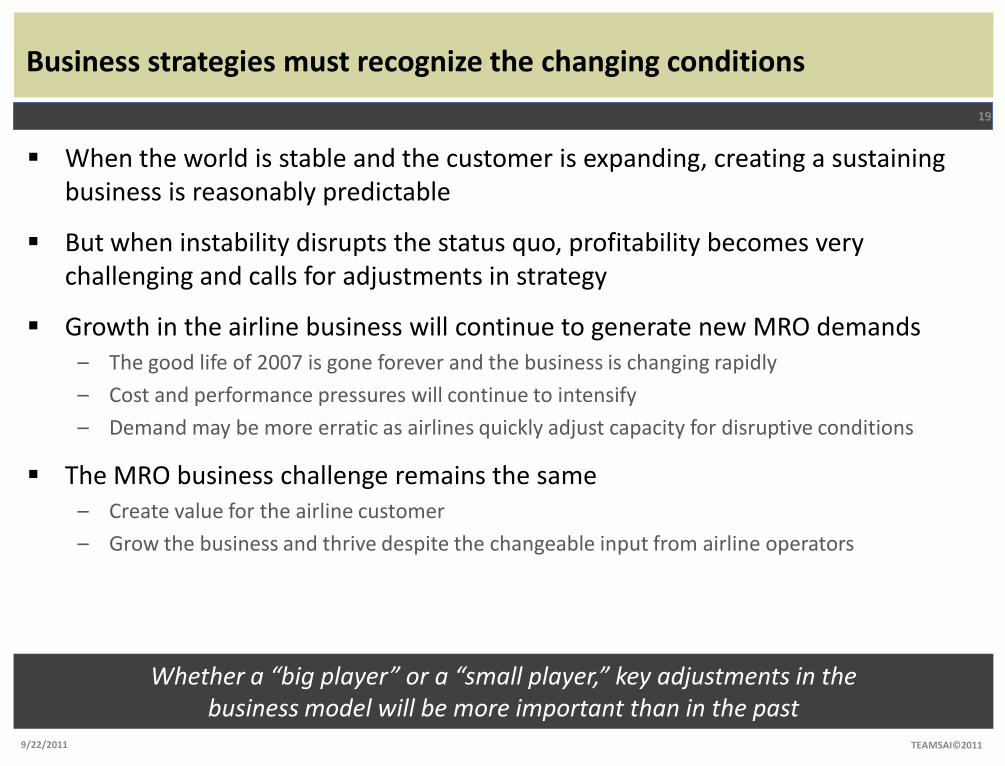
Business strategies must recognize the changing conditions
When the world is stable and the customer is expanding, creating a sustaining business is reasonably predictable
But when instability disrupts the status quo, profitability becomes very challenging and calls for adjustments in strategy
Growth in the airline business will continue to generate new MRO demands – The good life of 2007 is gone forever and the business is changing rapidly
– Cost and performance pressures will continue to intensify
– Demand may be more erratic as airlines quickly adjust capacity for disruptive conditions
The MRO business challenge remains the same – Create value for the airline customer
– Grow the business and thrive despite the changeable input from airline operators
9/22/2011
19
TEAMSAI©2011
Whether a “big player” or a “small player,” key adjustments in the business model will be more important than in the past
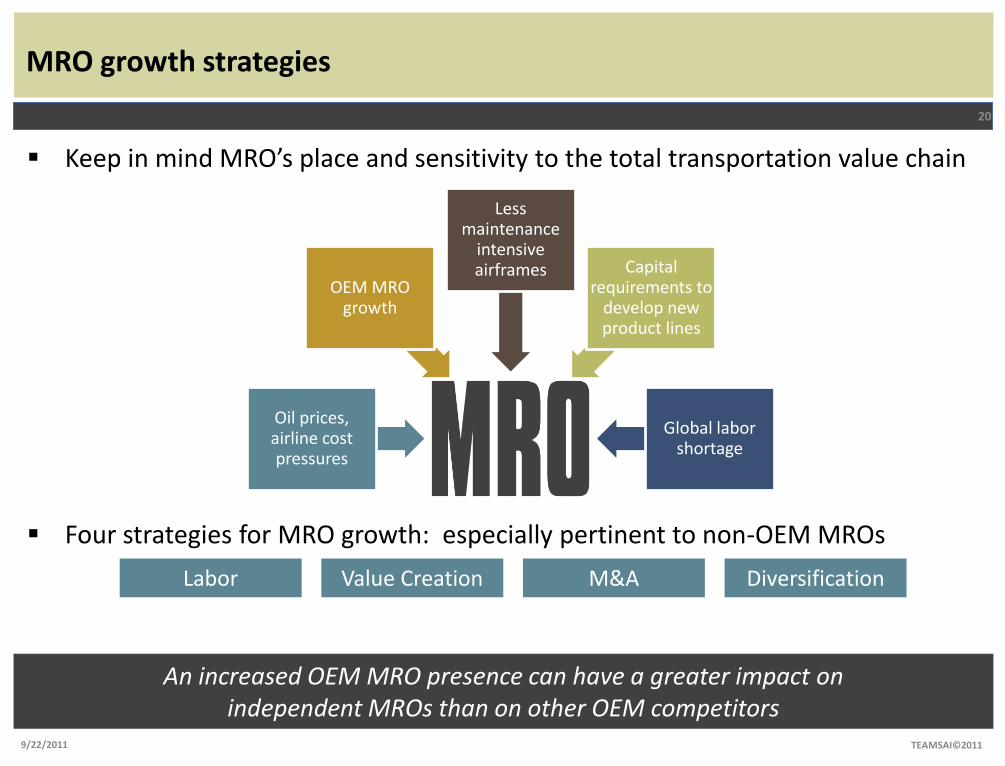
MRO growth strategies
Keep in mind MRO’s place and sensitivity to the total transportation value chain
Four strategies for MRO growth: especially pertinent to non-OEM MROs
9/22/2011
20
TEAMSAI©2011
Oil prices, airline cost pressures
OEM MRO growth
Less maintenance
intensive airframes Capital
requirements to develop new product lines
Global labor shortage
Labor Value Creation M&A Diversification
An increased OEM MRO presence can have a greater impact on independent MROs than on other OEM competitors
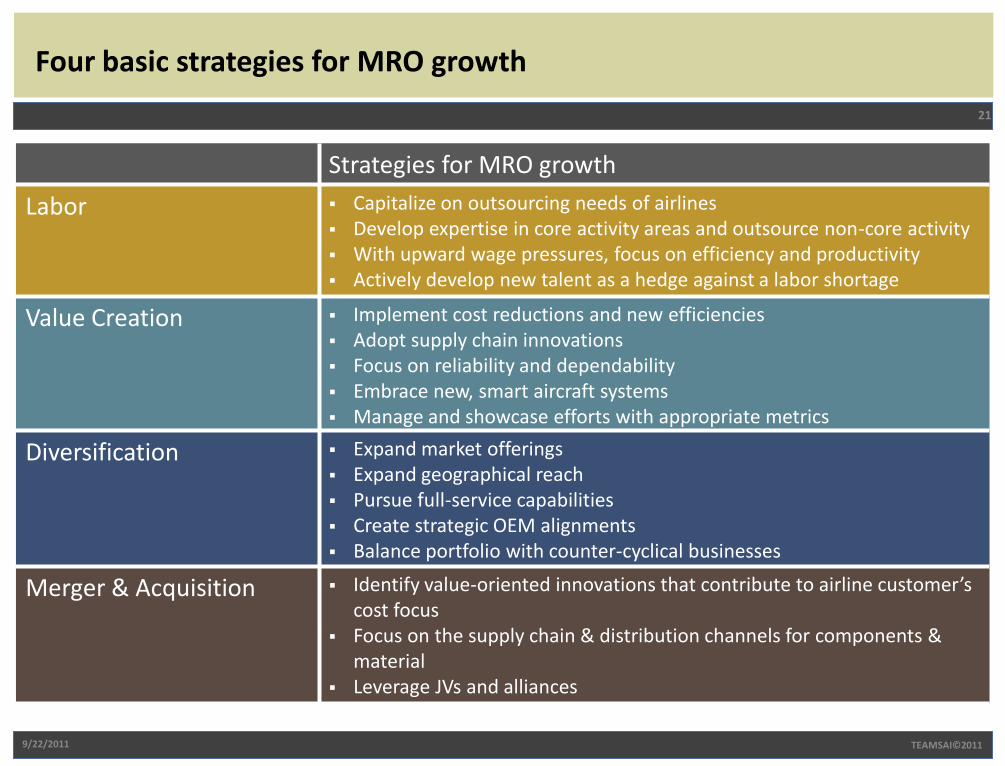
Four basic strategies for MRO growth
21
TEAMSAI©2011
Strategies for MRO growth
Labor Capitalize on outsourcing needs of airlines Develop expertise in core activity areas and outsource non-core activity With upward wage pressures, focus on efficiency and productivity Actively develop new talent as a hedge against a labor shortage
Value Creation Implement cost reductions and new efficiencies Adopt supply chain innovations Focus on reliability and dependability Embrace new, smart aircraft systems Manage and showcase efforts with appropriate metrics
Diversification Expand market offerings Expand geographical reach Pursue full-service capabilities Create strategic OEM alignments Balance portfolio with counter-cyclical businesses
Merger & Acquisition Identify value-oriented innovations that contribute to airline customer’s cost focus
Focus on the supply chain & distribution channels for components & material
Leverage JVs and alliances
9/22/2011
TEAMSAI©2010 9/22/2011
22
Transforming the MRO business model around value creation
Thank you to our partners
9/22/2011 TEAMSAI©2011

TEAMSAI©2010 9/22/2011
THANK YOU!
Chris Doan
Chairman & CEO
TeamSAI, Inc.
303-987-3454 Ext. 104


