28
Global Oil and Gas Market Outlook Guy Caruso, Senior Advisor Presented to AABE Annual Meeting April 18, 2012 Long Beach, CA

Global Oil and Gas Market Outlook
Guy Caruso, Senior Advisor
Presented to AABE Annual Meeting
April 18, 2012 Long Beach, CA

www.csis.org | 2
www.csis.org |
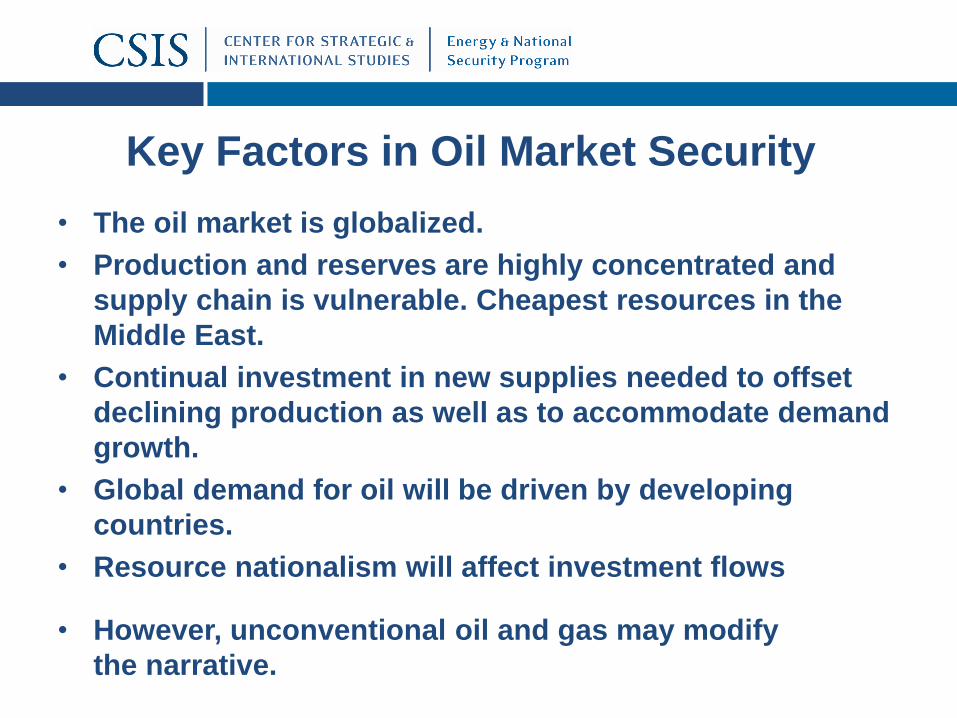
Key Factors in Oil Market Security
• The oil market is globalized.
• Production and reserves are highly concentrated and
supply chain is vulnerable. Cheapest resources in the
Middle East.
• Continual investment in new supplies needed to offset
declining production as well as to accommodate demand
growth.
• Global demand for oil will be driven by developing
countries.
• Resource nationalism will affect investment flows
• However, unconventional oil and gas may modify
the narrative.

80
90
100
110
120
130
140
Do
llars
/ B
arre
ll
OPEC agrees to maintain output level
Renewed concerns about Greece’s default risk
Riots in Egypt
Clashes in Iran and Bahrain
Unrest In Libya
Fukushima
Libyan Rebels Seize Oil Facilities
Protests in Syria Reports of
Eurozone and Chinese Manufacturing Contraction
Release of SPR
Greek Restructuring Announcement
Q1 US GDP revised down from 1.8% to 0.4%
Expiration Of QE2
US Debt Deal
US AAA Rating Downgrade
Libya Oil Resumption
Col. Gaddafi captured
Q4 US GDP revised up Down Jones at highest level since 2008
Iran Nuclear Development
Euro crisis
Iran Threatens to Close Straight of Hormuz
Chairman Bernanke testifies about the US economy and employment
IEF meeting
Saudi pledges to increase production
France hints
to SPR
release
New band?

www.csis.org | 5

www.csis.org | 6

www.csis.org | 7 World liquids production, 2010: 86.29 mmb/d
MENA 2010 Liquids Production, 2010: 30.24 mmb/d
MENA share of world liquids production, 2010: 35%
Middle East and North Africa Critical to Oil Supply Chain

www.csis.org |
Oil Market Uncertainty for 2012 What Will Happen with Iran?
Iranian Oil Exports • Pressure on Iran is increasing.
New US sanctions imposed.
• EU agreed to phase in ban on
Iranian oil imports.
• Korea and Japan in discussions
about the application of CBI
restrictions.
• How much additional volume will
China be willing to absorb?
• How will Saudi Arabia react?
• Iran reacting with continued saber
rattling mixed with possible
compromise.
• US military position clear – will not
tolerate interference with
international shipping.
Total exports 2.15 MMb/d
www.csis.org |
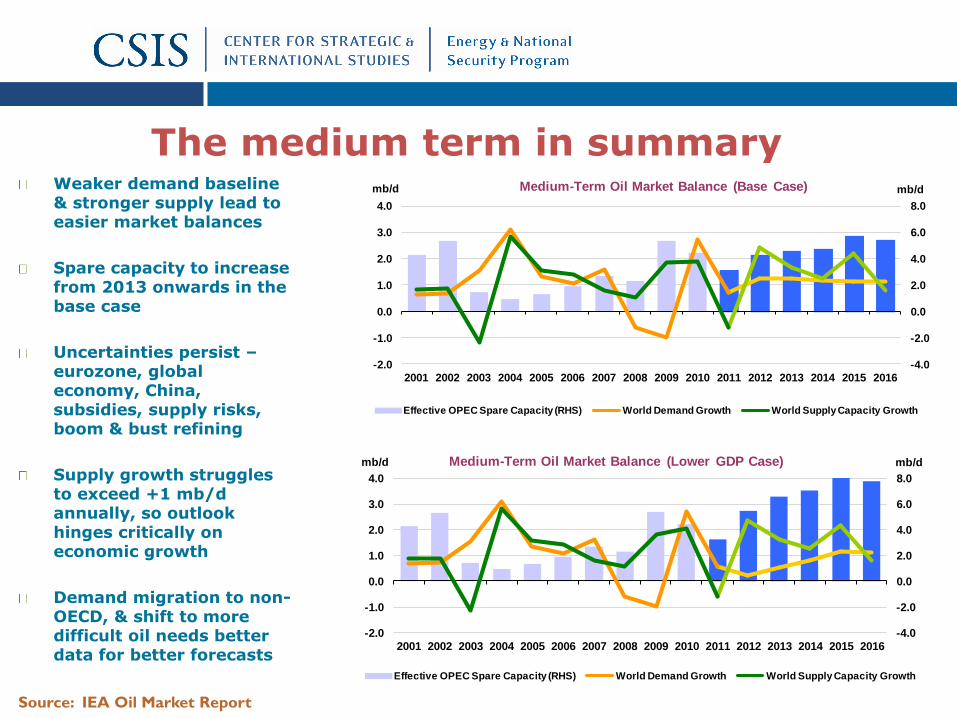
The medium term in summary Weaker demand baseline & stronger supply lead to easier market balances
Spare capacity to increase from 2013 onwards in the base case
Uncertainties persist – eurozone, global economy, China, subsidies, supply risks, boom & bust refining
Supply growth struggles to exceed +1 mb/d annually, so outlook hinges critically on economic growth
Demand migration to non-OECD, & shift to more difficult oil needs better data for better forecasts
-4.0
-2.0
0.0
2.0
4.0
6.0
8.0
-2.0
-1.0
0.0
1.0
2.0
3.0
4.0
2001 2002 2003 2004 2005 2006 2007 2008 2009 2010 2011 2012 2013 2014 2015 2016
mb/dmb/d Medium-Term Oil Market Balance (Base Case)
Effective OPEC Spare Capacity (RHS) World Demand Growth World Supply Capacity Growth
-4.0
-2.0
0.0
2.0
4.0
6.0
8.0
-2.0
-1.0
0.0
1.0
2.0
3.0
4.0
2001 2002 2003 2004 2005 2006 2007 2008 2009 2010 2011 2012 2013 2014 2015 2016
mb/dmb/d Medium-Term Oil Market Balance (Lower GDP Case)
Effective OPEC Spare Capacity (RHS) World Demand Growth World Supply Capacity Growth
Source: IEA Oil Market Report

The Shape Of The Economic Recovery Matters
-4
-2
0
2
4
6
8
10
2000 2001 2002 2003 2004 2005 2006 2007 2008 2009 2010 2011 2012 2013 2014 2015
An
nu
al
GD
P G
row
th (
%)
Emerging and Developing Economies
World
Advanced Economies
Source: IMF data, 2000-2009

www.csis.org |
Demand growth
is all about
non-OECD &
transport
Average Global Oil Demand Growth 1998-2004/2004-2010/2010-2016 Average Global Oil Demand Growth 2001-2006/2006-2011/2011-2016thousand barrels per day thousand barrels per day
(mb/d)
1998-2004 1.43 1.8%
2004-2010 0.81 1.0%
2010-2016 1.21 1.3%
Avg Global Demand Growth
19
-184-110
4213
66
202 176
23
391
-257-100
187
312 294
77 100 103
North America
Latin America Africa
Middle East
Europe FSU
722
576
801
Asia
OECD vs. Non-OECD Cumulative Oil Demand Growth
by Use, 1997-2015
(10)
(5)
-
5
10
15
20
25
30
1997 1999 2001 2003 2005 2007 2009 2011 2013 2015
mb/d
Non-OECD - Other
Non-OECD - Transportation
OECD - Other
OECD - TransportationOECD demand peaked in 2005
Demand growth now focused in 3 regions: Asia, Mid.East & L.America
Asia alone generates 55% of the total and China 35%
Premium & subsidised markets sustain growth, despite high prices
Understanding market trends requires better non-OECD data
Source: IEA Oil Market Report

www.csis.org |
Changing Supply Picture US Light Tight Oil Raises Non-OPEC Supply Estimates
Downward revisions in 2011-2013 due to unplanned outages, project delays, difficult
investment climate in some MENA countries.
Upward revisions due to uptick in E&P spending (rises by 22% in 2011, 10% in 2012), rosier
N. American outlook.
NGL supply revised up because producers are targeting liquids-rich tight oil plays.
12 Source: IEA Oil Market Report
380 620 870 1,140 1,320 1,530 1,7000
1,000
2,000
3,000
4,000
5,000
6,000
7,000
2010 2011 2012 2013 2014 2015 2016
US Crude and Condensate Output
Total Light Tight OilGulf of MexicoAlaskaOther L48 Crude and Condensate
kb/d
-100
-600 -490-150
170
520710
-800-600-400-200
0200400600800
1000
2010 2011 2012 2013 2014 2015 2016
kb/d Non-OPEC Supply - Revisions
North America ChinaMiddle East OECD EuropeOth Asia OECD PacificAfrica Latin AmericaFSU Total Non-OPEC
www.csis.org | 13

www.csis.org | 14
www.csis.org |
0
25
50
75
100
125
150
175
200
225
1980 1985 1990 1995 2000 2005 2010 2015 2020 2025 2030 2035
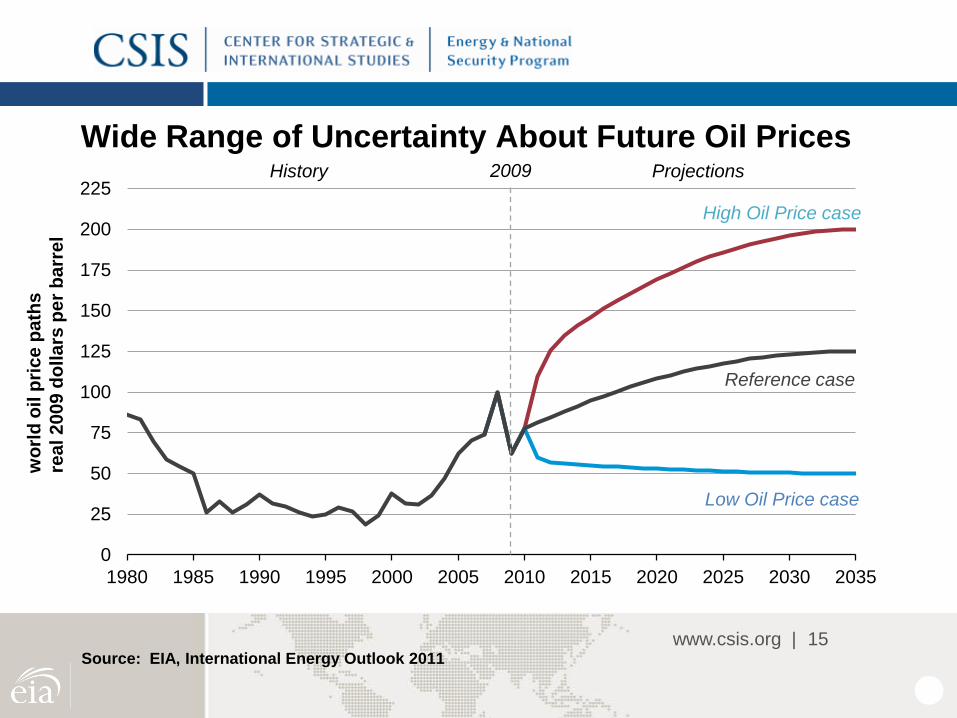
Wide Range of Uncertainty About Future Oil Prices
15
wo
rld
oil
pri
ce
pa
ths
rea
l 2
00
9 d
oll
ars
pe
r b
arr
el
Source: EIA, International Energy Outlook 2011
Projections History 2009
High Oil Price case
Low Oil Price case
Reference case

www.csis.org | 16

www.csis.org | 17
www.csis.org |
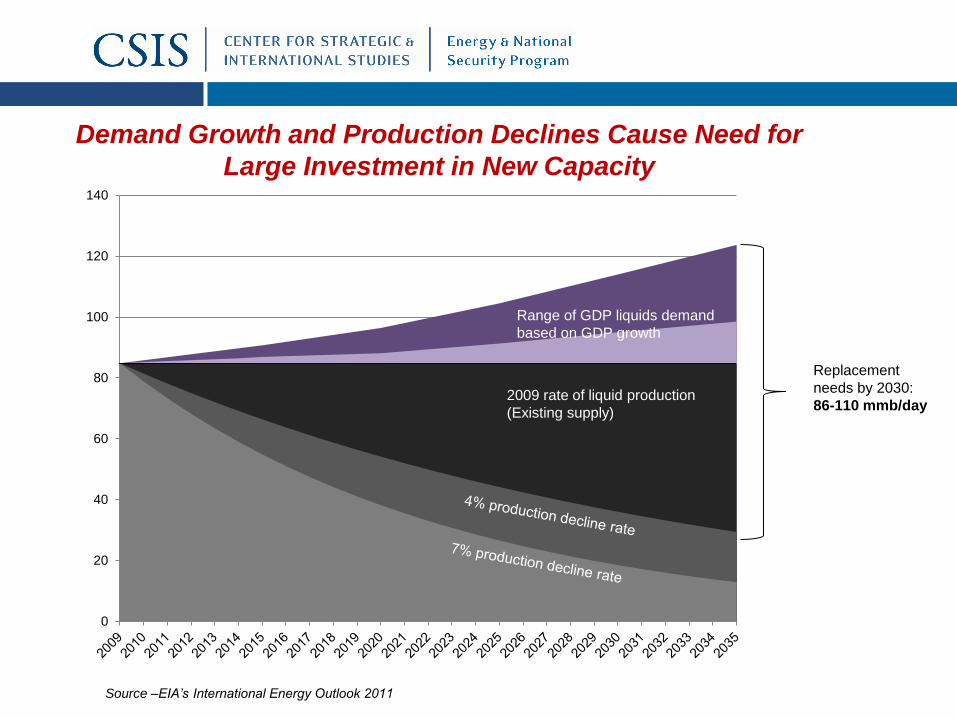
Source –EIA’s International Energy Outlook 2011
Demand Growth and Production Declines Cause Need for
Large Investment in New Capacity
Source –EIA’s International Energy Outlook 2011
0
20
40
60
80
100
120
140
Range of GDP liquids demand
based on GDP growth
2009 rate of liquid production
(Existing supply)
Replacement
needs by 2030:
86-110 mmb/day

www.csis.org | 19
Middle East and North Africa have World’s
Lowest Cost Petroleum Resources
Source: IEA World Energy Outlook 2009

www.csis.org |
Fiscal needs of key producing countries keep
pressure on oil prices
Breakeven costs, budget breakeven and commercially attractive
prices for current oil production for selected producers, mid-2011
Budget breakeven
Commercially attractive
Breakeven production cost
Qat
ar
Kuw
ait
Saudi Arabia
UA
E Liby
a
Russia
Vene
zuel
a
Ang
ola
Alg
eria
Iraq Nig
eria
Ec
uado
r
Iran
Super majors
0
20
40
60
80
100
120
0 5 10 15 20 25 30 35 40 45 0
Oil production (mb/d)
Do
llars
per
ba
rrel
5 10

www.csis.org |
N.A. Oil Supply Has Upside Potential But Risk of Decline
High production opportunities enabled by access frameworks

www.csis.org |
North American Shale Resources are Wide Spread

N.A.Gas Resources Have Potential to Supply the Market for Decades
High demand, advanced technology, moderate development cost
www.csis.org | 24
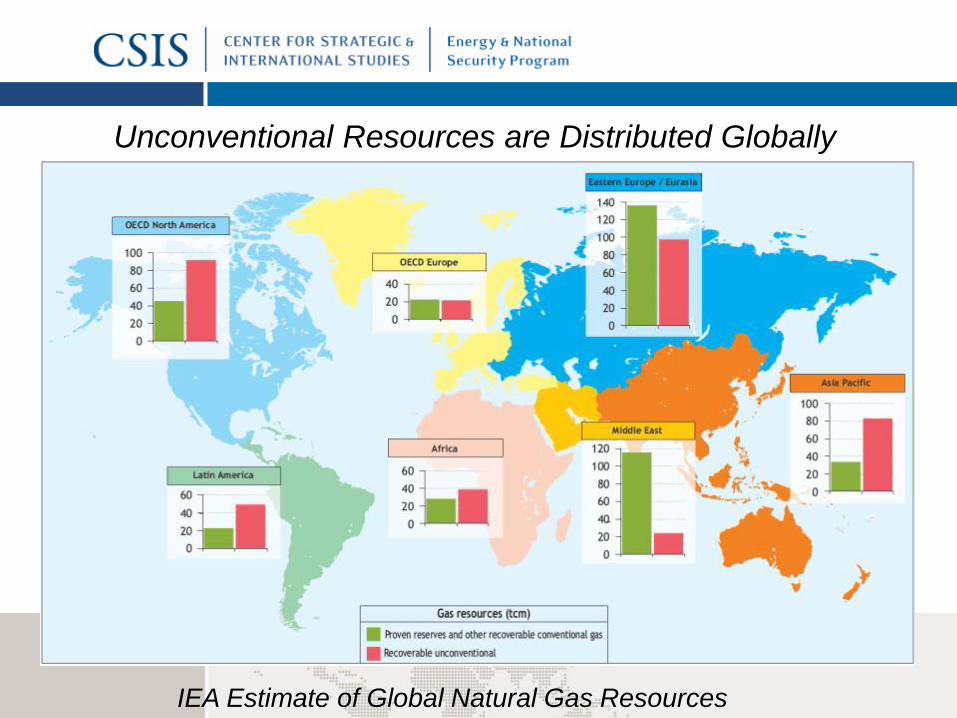
Unconventional Resources are Distributed Globally
IEA Estimate of Global Natural Gas Resources

Implications of Shale Gas “Revolution”
• Natural gas and oil prices have been delinked in the North American market.
• Natural gas will be the fuel of choice for power generation. Affects coal, nuclear and renewables.
• Petrochemical and gas based industries beginning to consider expanding operations in US.
• Gas may begin to make serious penetration as a transportation fuel.
• Natural gas exports from North America will being and may
grow. Alaska gas export option being considered.

BUT …realizing the full promise of shale resources is
not a certainty and US domestic policy is important!
Technical/Economic Challenges
• All shales are not alike; application of drilling/reservoir fracturing
technology & operational experience matters
• Steep decline rates require ongoing investment and drilling; and repeated
fracturing
• Cost escalation and low commodity prices limit prospects
Environmental/Regulatory/Societal Challenges
• Well design and management of surface chemicals/materials are the
best barriers to protecting water aquifers
• Disclosure of components of fracking fluids should/is happening
• Scale of water use, treatment & disposal are challenging
• Community Issues – infrastructure, land use, population density, noise,
haze, road congestion and repair are “real” and need to be addressed
• Regulation and enforcement are essential
www.csis.org |
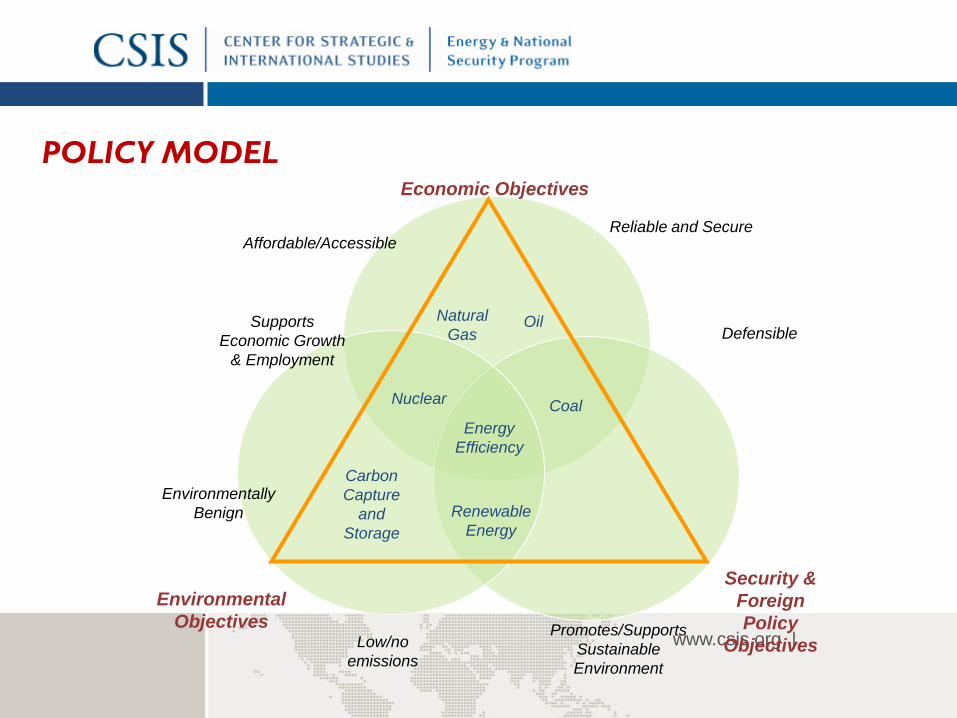
Security &
Foreign
Policy
Objectives Promotes/Supports
Sustainable
Environment
Defensible Natural
Gas Oil
Energy
Efficiency
Nuclear
Renewable
Energy
Coal
Economic Objectives
Environmental
Objectives
POLICY MODEL
Affordable/Accessible
Supports
Economic Growth
& Employment
Environmentally
Benign
Low/no
emissions
Reliable and Secure
Carbon
Capture
and
Storage

www.csis.org | 28
Thank You


