12
A UNIQUE PERSPECTIVE ON THE ISSUES AND OPPORTUNITIES FACING INVESTORS IN PRIVATE EQUITY WORLDWIDE Global Private Equity Barometer WINTER 2017-18

A UNIQUE PERSPECTIVE ON THE ISSUES AND OPPORTUNITIESFACING INVESTORS IN PRIVATE EQUITY WORLDWIDE
Global Private Equity Barometer WINTER 2017-18

2 W I N T E R 2 0 1 7 - 1 8
Coller Capital’s Global Private Equity BarometerColler Capital’s Global Private Equity Barometer is a unique
snapshot of worldwide trends in private equity – a twice-yearly
overview of the plans and opinions of institutional investors in
private equity (Limited Partners, or LPs, as they are known) based in
North America, Europe and Asia-Pacifi c (including the Middle East).
This 27th edition of the Global Private Equity Barometer captured
the views of 110 private equity investors from around the world.
The Barometer’s fi ndings are globally representative of the LP
population by:
Investor location
Type of investing organisation
Total assets under management
Length of experience of private equity investing
Contents
Topics in this edition of the Barometer include :
Returns from, and appetite for, PE
Specialist GPs vs multi-product platforms
Use of artifi cial intelligence in PE
Women in PE
Attractiveness of different PE strategies
Likely future sources of GP dea lfl ow
Venture capital markets
Marijuana as a PE investment opportunity
Debt fi nancing in buyout markets
Co-investments and direct investing
PE in China
PE vis-à-vis system ic risks to the fi nancial system

Too many weak GPs are being funded, LPs say
LPs are almost unanimous that the increase
in investor commitments to private equity is
resulting in too many weak GPs being funded.
LP views on whether too many weak GPs are being funded
LPs to support more managers – with bigger commitments
Two fi fths of LPs plan to increase the number of
managers in their private equity portfolios in the
next three years, compared with one fi fth who
plan to reduce it.
Moreover, half of investors plan to increase the
average size of their private equity commitment
to individual managers, compared with just one
in ten LPs that plan to reduce it.
LP expectations for their PE portfolios over the next 3 years
(Figure 1)
(Figure 2)
(Figure 3)
3W I N T E R 2 0 1 7 - 1 8
Single-product specialists predominate in LP portfolios
Investors’ private equity portfolios (measured
by value) are skewed towards single-product
specialists. This is true for just over half of LPs –
while another quarter have an even mix of single-
product specialists and multi-product platforms.
Just one in fi ve LPs say the majority of their
commitments are with multi-product platforms.
The preference for single-product specialists is
even more pronounced among North American
investors, two thirds of whom report such a skew.
Balance of LP commitment s to single-product specialists vs multi-product platforms – by number of LPs
No 11%
Yes89%
40%21%
50%9%
Overall number of managers
Average size of PE commitment to individual managers
% respondentsIncreaseReduce
Balance of commitments with single-
product specialists
52%
Balance of commitments with multi-product
platforms21%
Balance of commitments with an even mix of multi-product
platforms and single-product specialists
27%
4 W I N T E R 2 0 1 7 - 1 8
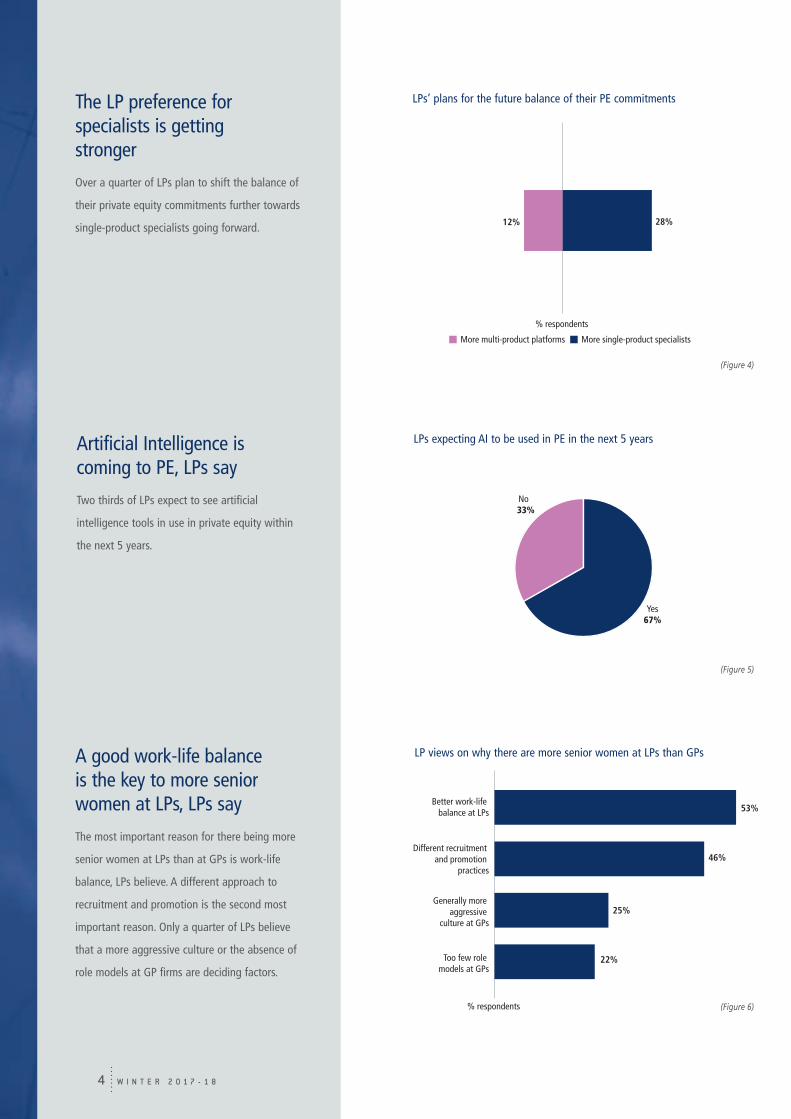
The LP preference for specialists is getting stronger
Over a quarter of LPs plan to shift the balance of
their private equity commitments further towards
single-product specialists going forward.
LPs’ plans for the future balance of their PE commitments
A good work-life balance is the key to more senior women at LPs, LPs say
The most important reason for there being more
senior women at LPs than at GPs is work -life
balance, LPs believe. A different approach to
recruitment and promotion is the second most
important reason. Only a quarter of LPs believe
that a more aggressive culture or the absence of
role models at GP fi rms are deciding factors.
LP views on why there are more senior women at LPs than GPs
Artificial Intelligence is coming to PE, LPs say
Two thirds of LPs expect to see artifi cial
intelligence tools in use in private equity within
the next 5 years.
LPs expecting AI to be used in PE in the next 5 years
28%12%
% respondents
More single-product specialistsMore multi-product platforms
No 33%
Yes67%
53%
46%
25%
22%
Better work-life balance at LPs
Different recruitment and promotion
practices
Generally more aggressive
culture at GPs
Too few role models at GPs
% respondents
(Figure 5)
(Figure 4)
(Figure 6)
5W I N T E R 2 0 1 7 - 1 8
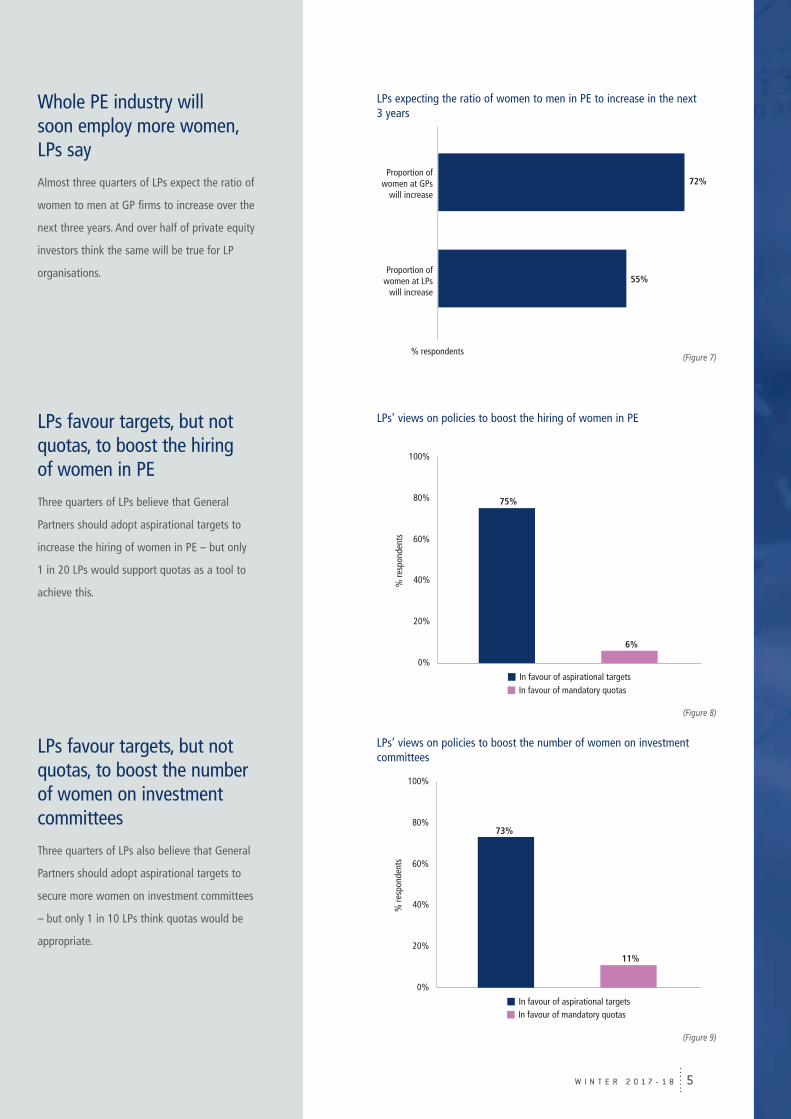
Whole PE industry will soon employ more women, LPs say
Almost three quarters of LPs expect the ratio of
women to men at GP fi rms to increase over the
next three years. And over half of private equity
investors think the same will be true for LP
organisations .
(Figure 7)
LPs expecting the ratio of women to men in PE to increase in the next 3 years
72%Proportion of
women at GPswill increase
55%Proportion of
women at LPswill increase
% respondents
LPs favour targets, but not quotas, to boost the hiring of women in PE
Three quarters of LPs believe that General
Partners should adopt aspirational targets to
increase the hiring of women in PE – but only
1 in 20 LPs would support quotas as a tool to
achieve th is.
LPs’ views on policies to boost the hiring of women in PE
(Figure 8)
0%
20%
40%
60%
80%
100%
75%
6%
% re
spon
dent
s
In favour of mandatory quotasIn favour of aspirational targets
LPs favour targets, but not quotas, to boost the number of women on investment committees
Three quarters of LPs also believe that General
Partners should adopt aspirational targets to
secure more women on investment committees
– but only 1 in 10 LPs think quotas would be
appropriate.
LPs’ views on policies to boost the number of women on investment committees
(Figure 9)
0%
20%
40%
60%
80%
100%
73%
11%
% re
spon
dent
s
In favour of mandatory quotasIn favour of aspirational targets
W I N T E R 2 0 1 7 - 1 86
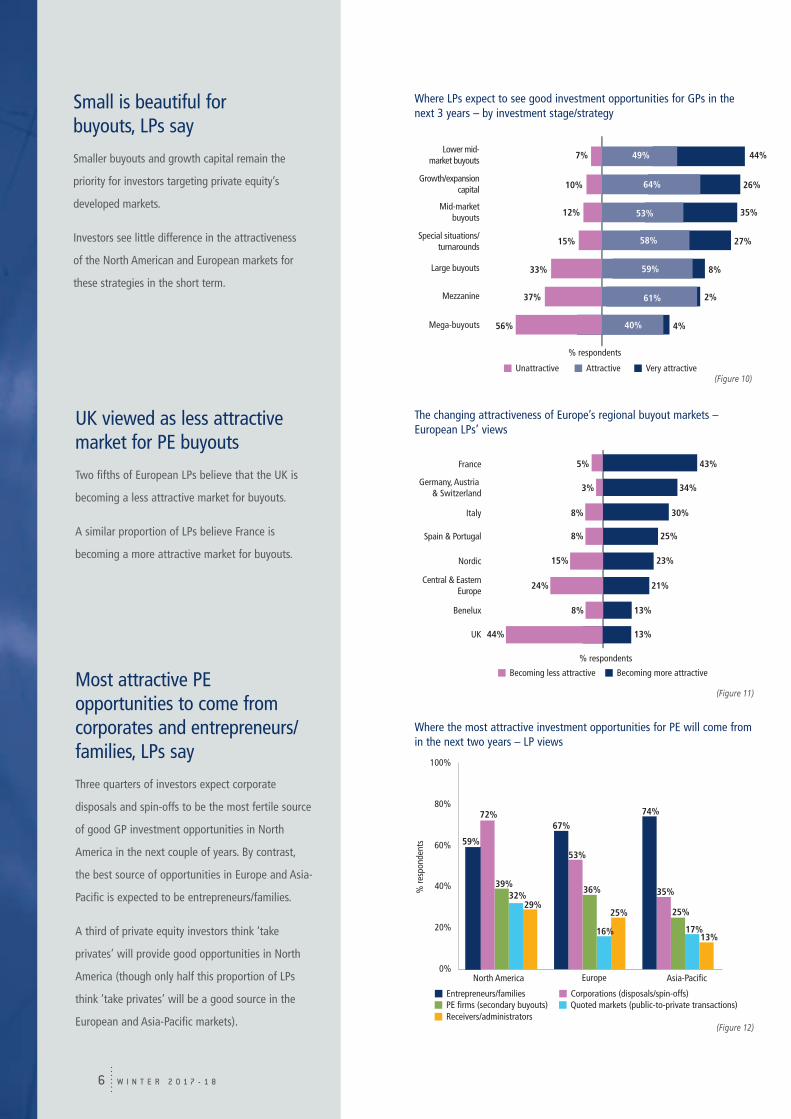
Where the most attractive investment opportunities for PE will come from in the next two years – LP views
Most attractive PE opportunities to come from corporates and entrepreneurs/families, LPs say
Three quarters of investors expect corporate
disposals and spin- offs to be the most fertile source
of good GP investment opportunities in North
America in the next couple of years. By contrast,
the best source of opportunities in Europe and Asia-
Pacifi c is expected to be entrepreneurs/ families.
A third of private equity investors think ‘take
privates’ will provide good opportunities in North
America (though only half this proportion of LP s
think ‘take privates’ will be a good source in the
European and Asia-Pacifi c markets). (Figure 1 2)
0%
20%
40%
60%
80%
100%
72%
39%32%
29%
59%53%
67%
36%
16%
25%
74%
35%
25%
17%13%
North America Europe Asia-Pacific
% re
spon
dent
s
PE firms (secondary buyouts)Receivers/administrators
Entrepreneurs/familiesQuoted markets (public-to-private transactions)Corporations (disposals/spin-offs)
The changing attractiveness of Europe’s regional buyout markets – European LPs’ views
UK viewed as less attractive market for PE buyouts
Two fi fths of European LPs believe that the UK is
becoming a less attractive market for buyouts .
A similar proportion of LPs believe France is
becoming a more attractive market for buyouts.
% respondents
Becoming less attractive Becoming more attractive
3% 34%
5% 43%
8% 30%
8% 25%
15% 23%
24% 21%
8% 13%
13%44%
France
Germany, Austria & Switzerland
Italy
Spain & Portugal
Nordic
Central & EasternEurope
Benelux
UK
(Figure 1 1)
Small is beautiful for buyouts, LPs say
Smaller buyouts and growth capital remain the
priority for investors targeting private equity’s
developed markets.
Investors see little difference in the attractiveness
of the North American and European markets for
these strategies in the short term.
Where LPs expect to see good investment opportunities for GPs in the next 3 years – by investment stage/strategy
(Figure 10)
% respondents
Attractive Very attractiveUnattractive
7% 44%49%
64%
53%
58%
59%
61%
40%
10% 26%
12% 35%
15% 27%
33% 8%
37% 2%
56% 4%
Lower mid-market buyouts
Growth/expansioncapital
Mid-marketbuyouts
Special situations/turnarounds
Large buyouts
Mezzanine
Mega-buyouts

W I N T E R 2 0 1 7 - 1 8 7
LPs convinced an over-supply of debt is financing poor buyouts and over -leveraging good ones in their domestic market
Western LPs see negative effects of ‘debt over-supply’ in their home markets
Half of North American LPs and two thirds of
European LPs believe that an over-supply of debt
is leading to the fi nancing of poor buyout deals
and the over-leveraging of high er quality deals in
their own regions .
(Figure 1 5)
0%
20%
40%
60%
80%
100%
51%
63%
21%
North American LPs European LPs Asia-Pacific LPs
% re
spon
dent
s
LP acceptance of marijuana businesses as PE investments Recreational marijuana businesses not suitable for PE, investors say
Most LPs would frown on their GPs investing
in a business focused on the recreational use
of marijuana – but a majority of investors
would now accept a business focu sed purely on
medicinal uses of the drug.
That is not to say that all LPs are against
investment in recreationally-focused marijuana
businesses – 30% of North American investors
say they would countenance GPs making such
investments.
0%
20%
40%
60%
80%
21%
57%
For recreational use For medicinal use
% re
spon
dent
s
(Figure 1 4)
0%
20%
40%
60%
80%
100%
54%
3%
68%
15%
60%
North American LPs European LPs Asia-Pacific LPs
Very attractive
5%
% re
spon
dent
s
Attractive
Attractiveness of the European VC market over the next five years – LP views
LPs think Europe will be attractive for VC investments over the next five years
Three quarters of Europe-based and Asia-Pacifi c-
based LPs think Europe will be an attractive market
for VC investments in the next fi ve years. Their
American counterparts are slightly more wary,
but even in North America a majority of Limited
Partners think Europe will be attractive for VC in the
next few years.
By way of contrast, 86% of investors think North
America will be attractive for VC, and 79% think
Asia-Pacifi c will be attractive, over the same period.
(Figure 1 3)
W I N T E R 2 0 1 7 - 1 88
0%
10%
20%
30%
40%
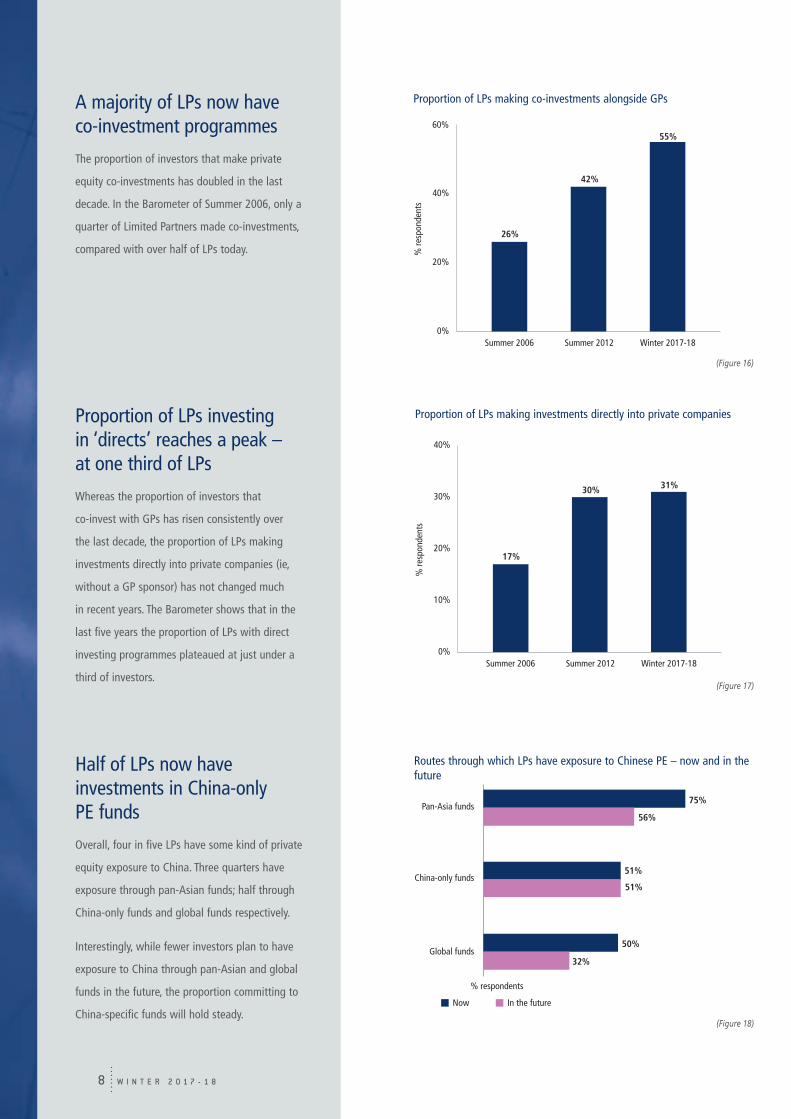
17%
30%
% re
spon
dent
s
31%
Summer 2006 Summer 2012 Winter 2017-18
Proportion of LPs investing in ‘directs’ reaches a peak – at one third of LPs
Whereas the proportion of investors that
co-invest with GPs has risen consistently over
the last decade, the proportion of LPs making
investments directly into private companies (ie,
without a GP sponsor) has not changed much
in recent years. The Barometer shows that in the
last fi ve years the proportion of LPs with direct
investing programmes plateaued at just under a
third of investors.
Proportion of LPs making investments directly into private companies
(Figure 1 7)
Half of LPs now have investments in China- only PE funds
Overall, four in fi ve LPs ha ve some kind of private
equity exposure to China. Three quarters have
exposure through pan-Asian funds; half through
China-only funds and global funds respectively.
Interestingly, while fewer investors plan to have
exposure to China through pan-Asian and global
funds in the future, the proportion committing to
China-specifi c funds will hold steady.
Routes through which LPs have exposure to Chinese PE – now and in the future
(Figure 1 8)
% respondents
In the futureNow
Pan-Asia funds
China-only funds
Global funds
75%
56%
51%
51%
50%
32%
A majority of LPs now have co-investment programmes
The proportion of investors that make private
equity co-investments has doubled in the last
decade. In the Barometer of Summer 2006, only a
quarter of Limited Partners made co-investments,
compared with over half of LPs today.
Proportion of LPs making co-investments alongside GPs
(Figure 1 6)
0%
20%
40%
60%
26%
42%
% re
spon
dent
s
55%
Summer 2006 Summer 2012 Winter 2017-18
W I N T E R 2 0 1 7 - 1 8 9
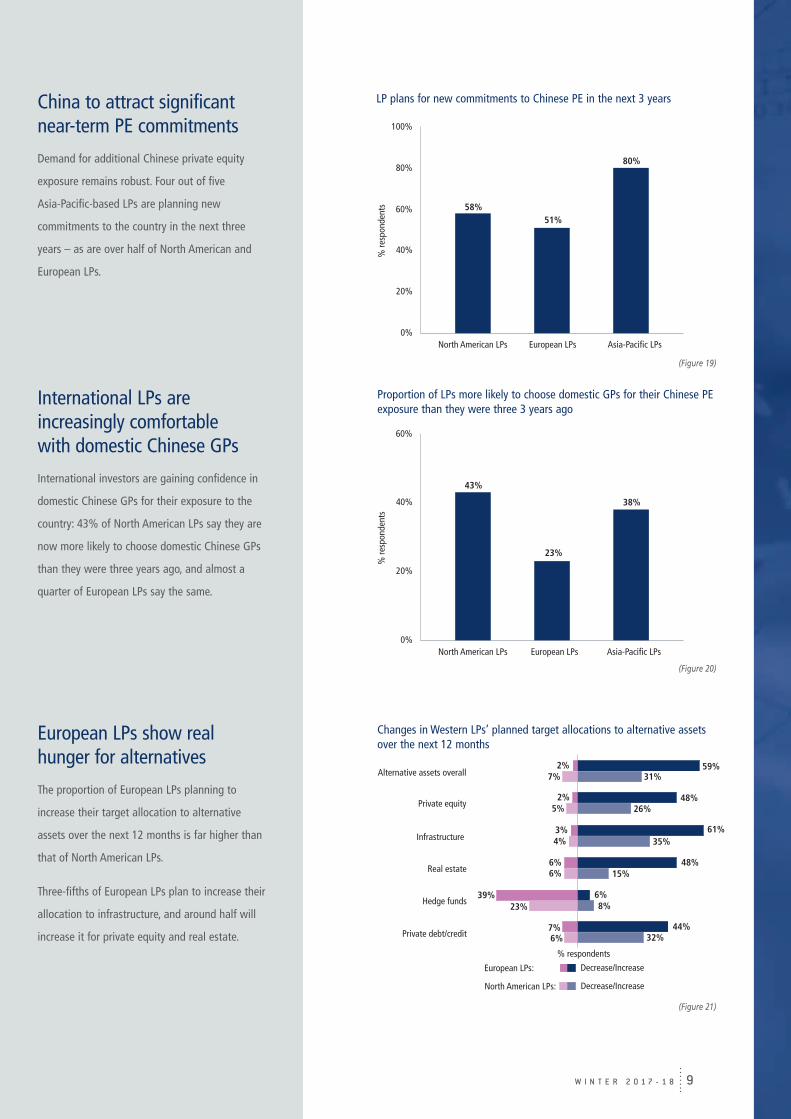
International LPs are increasingly comfortable with domestic Chinese GPs
International investors are gaining confi dence in
domestic Chinese GPs for their exposure to the
country: 43% of North American LPs say they are
now more likely to choose domestic Chinese GPs
than they were three years ago, and almost a
quarter of European LPs say the same.
Proportion of LPs more likely to choose domestic GPs for their Chinese PE exposure than they were three 3 years ago
(Figure 20)
0%
20%
40%
60%
43%
38%
% re
spon
dent
s
23%
North American LPs European LPs Asia-Pacific LPs
European LPs show real hunger for alternatives
The proportion of European LPs planning to
increase their target allocation to alternative
assets over the next 12 months is far higher than
that of North American LPs.
Three-fi fths of European LPs plan to increase their
allocation to infrastructure, and around half will
increase it for private equity and real estate.
Changes in Western LPs’ planned target allocations to alternative assets over the next 12 months
(Figure 2 1)
59%31%
2%7%
48%26%
2%5%
61%35%
3%4%
48%15%
6%6%
44%32%
7%6%
Private equity
Alternative assets overall
Infrastructure
Hedge funds
Private debt/credit
Real estate
% respondents
North American LPs:
European LPs:
Decrease/Increase
Decrease/Increase
6%8%
39%23%
China to attract significant near-term PE commitments
Demand for additional Chinese private equity
exposure remains robust. Four out of fi ve
Asia-Pacifi c-based LPs are planning new
commitments to the country in the next three
years – as are over half of North American and
European LPs.
LP plans for new commitments to Chinese PE in the next 3 years
0%
20%
40%
60%
80%
100%
58%51%
% re
spon
dent
s
80%
North American LPs European LPs Asia-Pacific LPs
(Figure 1 9)

W I N T E R 2 0 1 7 - 1 810
A majority of LPs believe PE returns will reduce over 5-10 years
Three in fi ve private equity investors believe
returns from the asset class will reduce as the
market matures over the next 5-10 years. By
contrast, one third of investors think today’s
strong returns can be maintained, and an
optimistic 7% of LPs believe returns will increase
as we move into a new economic / market cycle.
LPs’ views on PE returns in 5-10 years’ time
(Figure 2 3)
Returns will stay at today’s level
33%
Returns will increase again as we move into
a new economic/market cycle
7%
Returns will decrease as the PE
market matures60%
PE is not a systemic risk to the financial system, LPs say
Despite occasional comments by regulators,
nine out of ten LPs believe that private equity
does not pose a systemic threat to the world’s
fi nancial system.
LP views on whether PE poses a systemic threat to the financial system
(Figure 2 4)
Yes11%
No89%
Four fifths of LPs expect to achieve annual net returns from PE of over 11%
82% of LPs expect to achieve annual net returns
of more than 11% across their private equity
portfolios over the next 3-5 years. 17% of LPs are
forecasting returns of over 16%.
In terms of individual strategies, 86% of LPs
expect to achieve annual net returns of over 11%
from North American buyouts, and 83% of LPs
expect the same from European buyouts.
LPs’ forecast annual net returns from PE in the next 3-5 years
(Figure 2 2)
Less than 5% 6-10% 11-15% 16-20% More than 20%
Across wholePE portfolio
North Americanbuyouts
North Americanventure
Europeanbuyouts
Europeanventure
Asia-Pacificbuyouts
Asia-Pacificventure
Funds-of-funds
Net annual returns (% respondents)
1% 17% 65% 15% 2%
1% 13% 56% 26% 4%
3% 19% 33% 32% 13%
1% 16% 58% 21% 4%
13% 25% 34% 20% 8%
1% 20% 56% 15% 8%
13% 24% 29% 20% 14%
10% 51% 37% 1%1%
W I N T E R 2 0 1 7 - 1 8 11
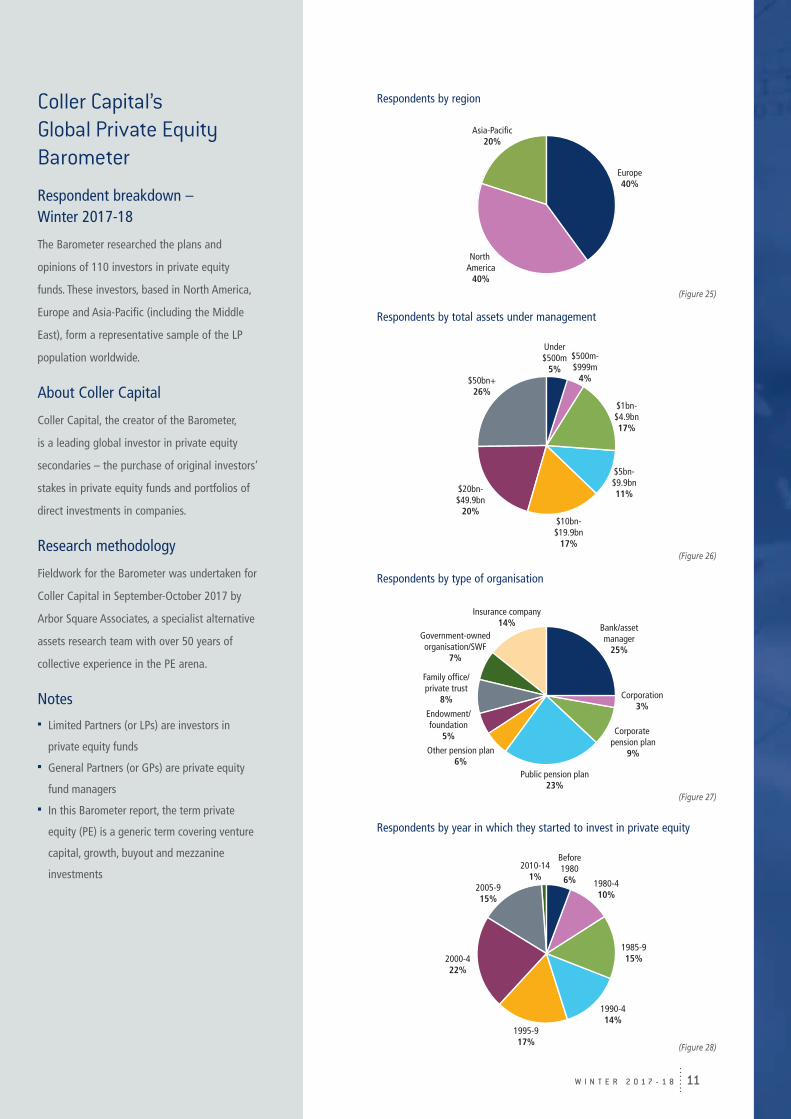
Coller Capital’s Global Private Equity Barometer
Respondent breakdown – Winter 2017-18
The Barometer researched the plans and
opinions of 110 investors in private equity
funds. These investors, based in North America,
Europe and Asia-Pacifi c (including the Middle
East), form a representative sample of the LP
population worldwide.
About Coller Capital
Coller Capital, the creator of the Barometer,
is a leading global investor in private equity
secondaries – the purchase of original investors’
stakes in private equity funds and portfolios of
direct investments in companies.
Research methodology
Fieldwork for the Barometer was undertaken for
Coller Capital in September-October 201 7 by
Arbor Square Associates, a specialist alternative
assets research team with over 50 years of
collective experience in the PE arena.
Notes Limited Partners (or LPs) are investors in
private equity funds
General Partners (or GPs) are private equity
fund managers
In this Barometer report, the term private
equity (PE) is a generic term covering venture
capital, growth, buyout and mezzanine
investments
Respondents by type of organisation
Respondents by year in which they started to invest in private equity
Respondents by region
Respondents by total assets under management
(Figure 2 5)
(Figure 2 6)
(Figure 2 7)
(Figure 2 8)
Asia-Pacific20%
North America
40%
Europe40%
$1bn-$4.9bn17%
$500m-$999m
4%
$5bn-$9.9bn11%
$10bn-$19.9bn
17%
$20bn-$49.9bn
20%
$50bn+26%
Under$500m
5%
Bank/assetmanager
25%
Corporation3%
Corporate pension plan
9%
Public pension plan23%
Other pension plan6%
Endowment/foundation
5%
Family office/private trust
8%
Government-ownedorganisation/SWF
7%
Insurance company14%
1980-410%
1985-915%
1990-414%
1995-917%
Before19806%
2010-141%
2000-422%
2005-915%

www.collercapital.com


