12
A UNIQUE PERSPECTIVE ON THE ISSUES AND OPPORTUNITIES FACING INVESTORS IN PRIVATE EQUITY WORLDWIDE Global Private Equity Barometer WINTER 2010-11

A UNIQUE PERSPECTIVE ON THE ISSUES AND OPPORTUNITIESFACING INVESTORS IN PRIVATE EQUITY WORLDWIDE
Global Private Equity BarometerWINTER 2010-11

W I N T E R 2 0 1 0 - 1 12
Coller Capital’s Global Private Equity Barometer
Coller Capital’s Global Private Equity Barometer is a
unique snapshot of worldwide trends in private equity –
a twice-yearly overview of the plans and opinions
of institutional investors in private equity (Limited Partners,
or LPs, as they are known) based in North America, Europe
and Asia-Pacific.
This 13th edition of the Global Private Equity Barometer
captured the views of 120 private equity investors from
all round the world. The Barometer’s findings are globally
representative of the LP population by:
Investor location
Type of investing organisation
Total assets under management
Length of experience of private equity investing
Contents
Key topics in this edition of the Barometer include:
LPs’ return expectations & appetite for PE
Attractive areas for GP investment
Distributions to LPs
The PE market cycle
PE funds-of-funds
Venture capital
Asia-Pacific PE market
Impact of ESG principles on LP investment decisions
W I N T E R 2 0 1 0 - 1 1 3
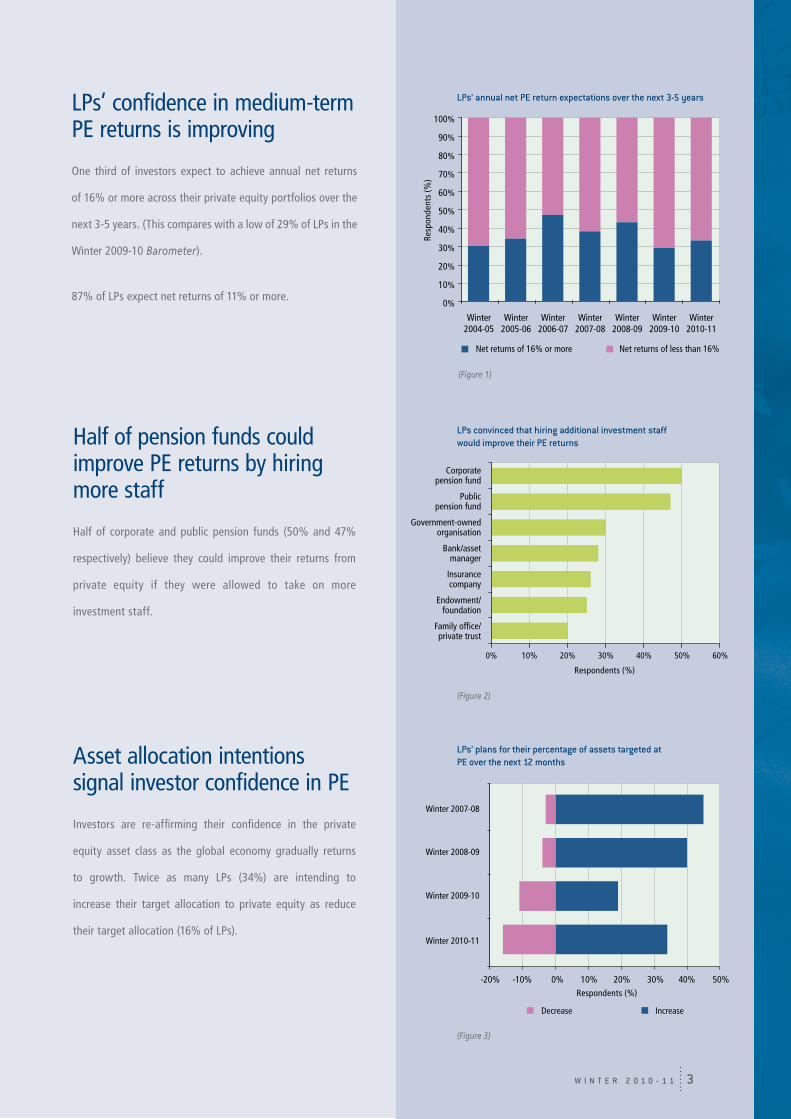
LPs’ confidence in medium-term PE returns is improving
One third of investors expect to achieve annual net returns
of 16% or more across their private equity portfolios over the
next 3-5 years. (This compares with a low of 29% of LPs in the
Winter 2009-10 Barometer).
87% of LPs expect net returns of 11% or more.
Half of pension funds could improve PE returns by hiring more staff
Half of corporate and public pension funds (50% and 47%
respectively) believe they could improve their returns from
private equity if they were allowed to take on more
investment staff.
Asset allocation intentions signal investor confidence in PE
Investors are re-affirming their confidence in the private
equity asset class as the global economy gradually returns
to growth. Twice as many LPs (34%) are intending to
increase their target allocation to private equity as reduce
their target allocation (16% of LPs).
LPs convinced that hiring additional investment staff would improve their PE returns
(Figure 2)
LPs’ plans for their percentage of assets targeted at PE over the next 12 months
(Figure 3)
LPs’ annual net PE return expectations over the next 3-5 years
(Figure 1)
0%
10%
20%
30%
40%
50%
60%
70%
80%
90%
100%
Winter2004-05
Winter2005-06
Winter2006-07
Winter2007-08
Winter2008-09
Winter2009-10
Winter2010-11
Net returns of 16% or more Net returns of less than 16%
Resp
onde
nts
(%)
Corporatepension fund
Publicpension fund
Government-owned organisation
Bank/assetmanager
Insurancecompany
Endowment/foundation
Family office/private trust
0% 10% 20% 30% 40% 50% 60%
Respondents (%)
Winter 2010-11
Winter 2008-09
Winter 2007-08
Winter 2009-10
Increase
-20% -10% 0% 10% 20% 30% 40% 50%
Decrease
Respondents (%)
W I N T E R 2 0 1 0 - 1 14
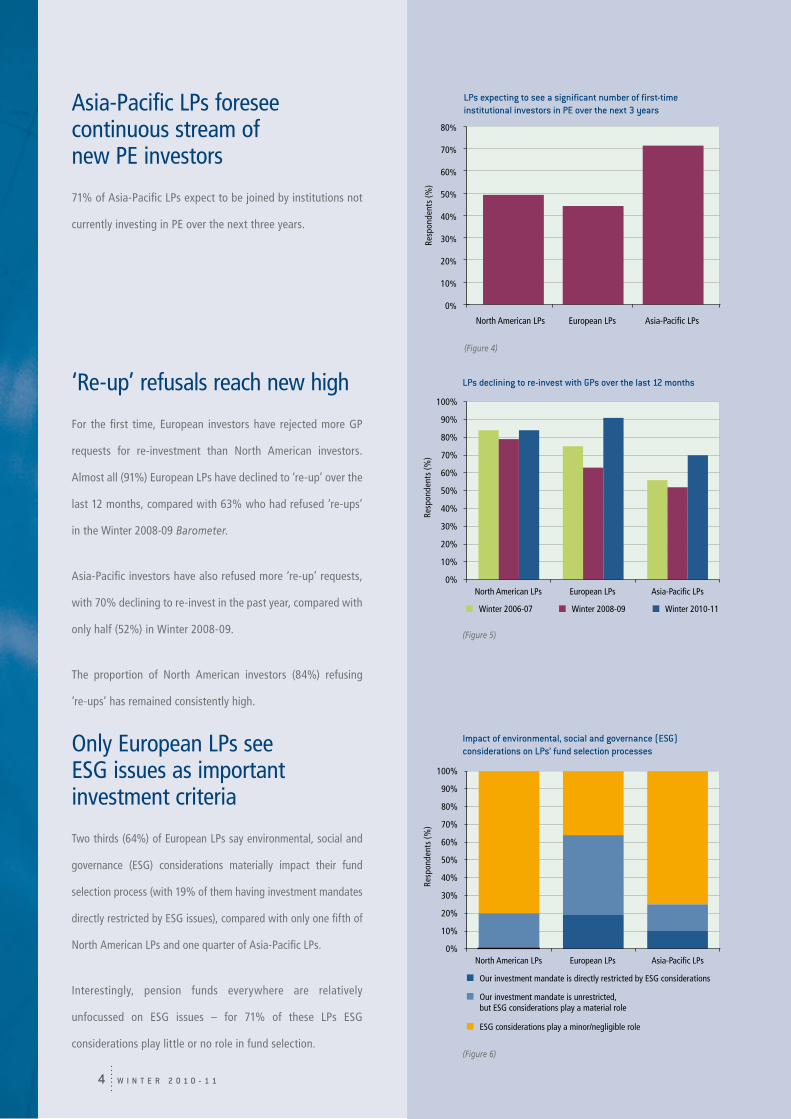
Asia-Pacific LPs foresee continuous stream of new PE investors
71% of Asia-Pacific LPs expect to be joined by institutions not
currently investing in PE over the next three years.
‘Re-up’ refusals reach new high
For the first time, European investors have rejected more GP
requests for re-investment than North American investors.
Almost all (91%) European LPs have declined to ‘re-up’ over the
last 12 months, compared with 63% who had refused ‘re-ups’
in the Winter 2008-09 Barometer.
Asia-Pacific investors have also refused more ‘re-up’ requests,
with 70% declining to re-invest in the past year, compared with
only half (52%) in Winter 2008-09.
The proportion of North American investors (84%) refusing
‘re-ups’ has remained consistently high.
Only European LPs see ESG issues as important investment criteria
Two thirds (64%) of European LPs say environmental, social and
governance (ESG) considerations materially impact their fund
selection process (with 19% of them having investment mandates
directly restricted by ESG issues), compared with only one fifth of
North American LPs and one quarter of Asia-Pacific LPs.
Interestingly, pension funds everywhere are relatively
unfocussed on ESG issues – for 71% of these LPs ESG
considerations play little or no role in fund selection.
LPs declining to re-invest with GPs over the last 12 months
Impact of environmental, social and governance (ESG) considerations on LPs’ fund selection processes
(Figure 5)
LPs expecting to see a significant number of first-time institutional investors in PE over the next 3 years
North American LPs European LPs Asia-Pacific LPs
0%
10%
20%
30%
40%
50%
60%
70%
80%
Resp
onde
nts
(%)
(Figure 4)
North American LPs European LPs Asia-Pacific LPs
Winter 2010-11Winter 2008-09Winter 2006-07
0%
10%
20%
30%
40%
50%
60%
70%
80%
90%
100%
Resp
onde
nts
(%)
Our investment mandate is directly restricted by ESG considerations
Our investment mandate is unrestricted,but ESG considerations play a material role
ESG considerations play a minor/negligible role
North American LPs European LPs Asia-Pacific LPs0%
10%
20%
30%
40%
50%
60%
70%
80%
90%
100%
Resp
onde
nts
(%)
(Figure 6)
W I N T E R 2 0 1 0 - 1 1 5
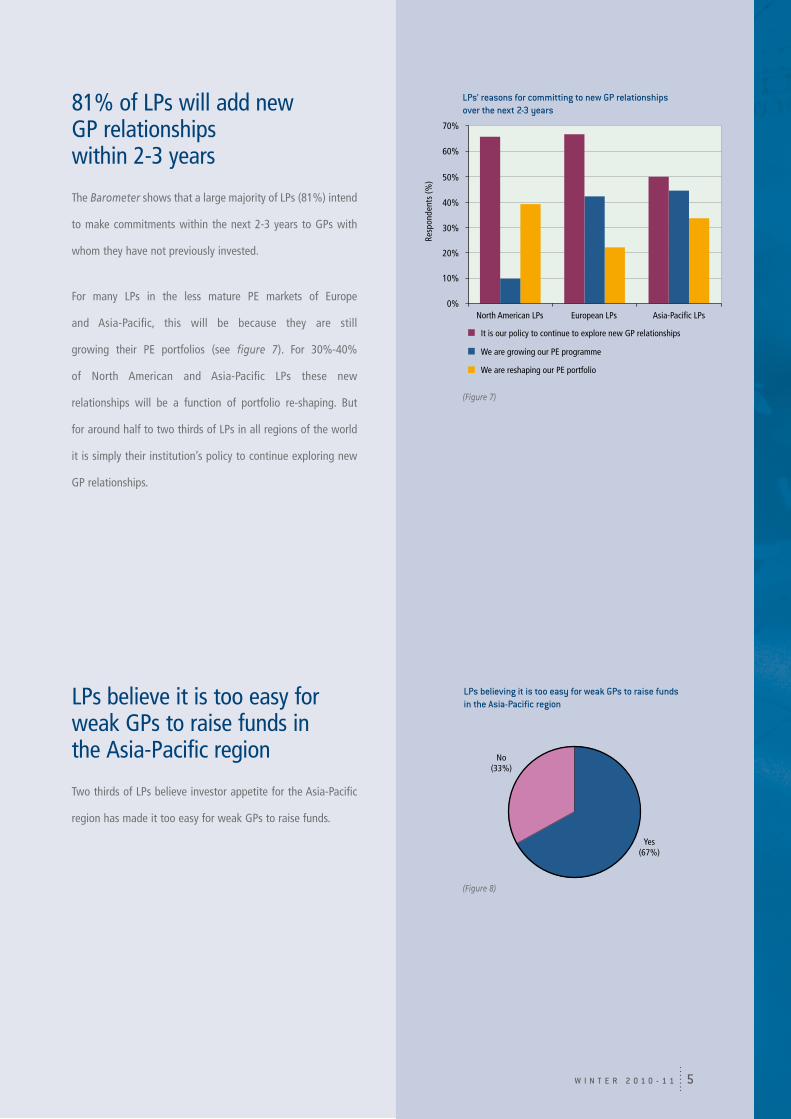
81% of LPs will add new GP relationships within 2-3 years
The Barometer shows that a large majority of LPs (81%) intend
to make commitments within the next 2-3 years to GPs with
whom they have not previously invested.
For many LPs in the less mature PE markets of Europe
and Asia-Pacific, this will be because they are still
growing their PE portfolios (see figure 7). For 30%-40%
of North American and Asia-Pacific LPs these new
relationships will be a function of portfolio re-shaping. But
for around half to two thirds of LPs in all regions of the world
it is simply their institution’s policy to continue exploring new
GP relationships.
LPs believe it is too easy for weak GPs to raise funds in the Asia-Pacific region
Two thirds of LPs believe investor appetite for the Asia-Pacific
region has made it too easy for weak GPs to raise funds.
LPs’ reasons for committing to new GP relationships over the next 2-3 years
(Figure 7)
LPs believing it is too easy for weak GPs to raise funds in the Asia-Pacific region
(Figure 8)
It is our policy to continue to explore new GP relationships
We are growing our PE programme
We are reshaping our PE portfolio
North American LPs European LPs Asia-Pacific LPs0%
10%
20%
30%
40%
50%
70%
60%
Resp
onde
nts
(%)
No(33%)
Yes(67%)
W I N T E R 2 0 1 0 - 1 16
(Figure 10)
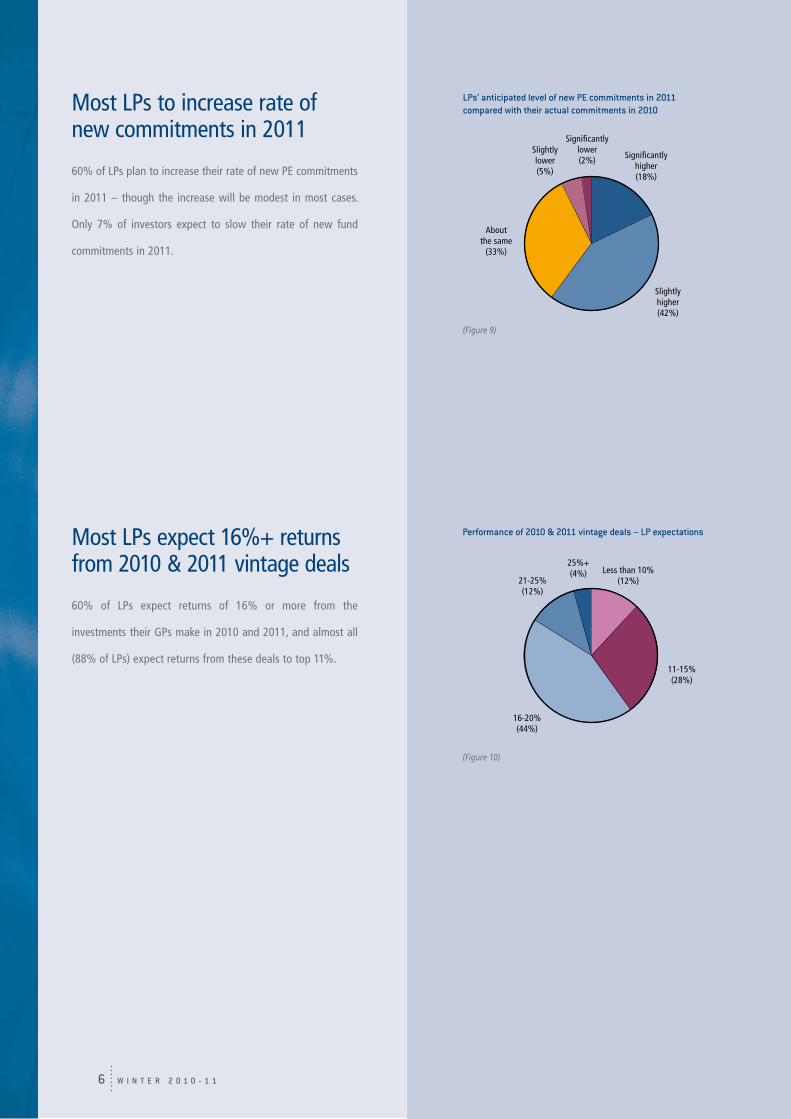
LPs’ anticipated level of new PE commitments in 2011 compared with their actual commitments in 2010Most LPs to increase rate of
new commitments in 2011
60% of LPs plan to increase their rate of new PE commitments
in 2011 – though the increase will be modest in most cases.
Only 7% of investors expect to slow their rate of new fund
commitments in 2011.
Most LPs expect 16%+ returns from 2010 & 2011 vintage deals
60% of LPs expect returns of 16% or more from the
investments their GPs make in 2010 and 2011, and almost all
(88% of LPs) expect returns from these deals to top 11%.
Significantly lower(2%)
Slightlylower(5%)
Aboutthe same
(33%)
Slightlyhigher(42%)
Significantlyhigher(18%)
(Figure 9)
Less than 10%(12%)
11-15%(28%)
16-20%(44%)
21-25%(12%)
25%+(4%)
Performance of 2010 & 2011 vintage deals – LP expectations
W I N T E R 2 0 1 0 - 1 1 7
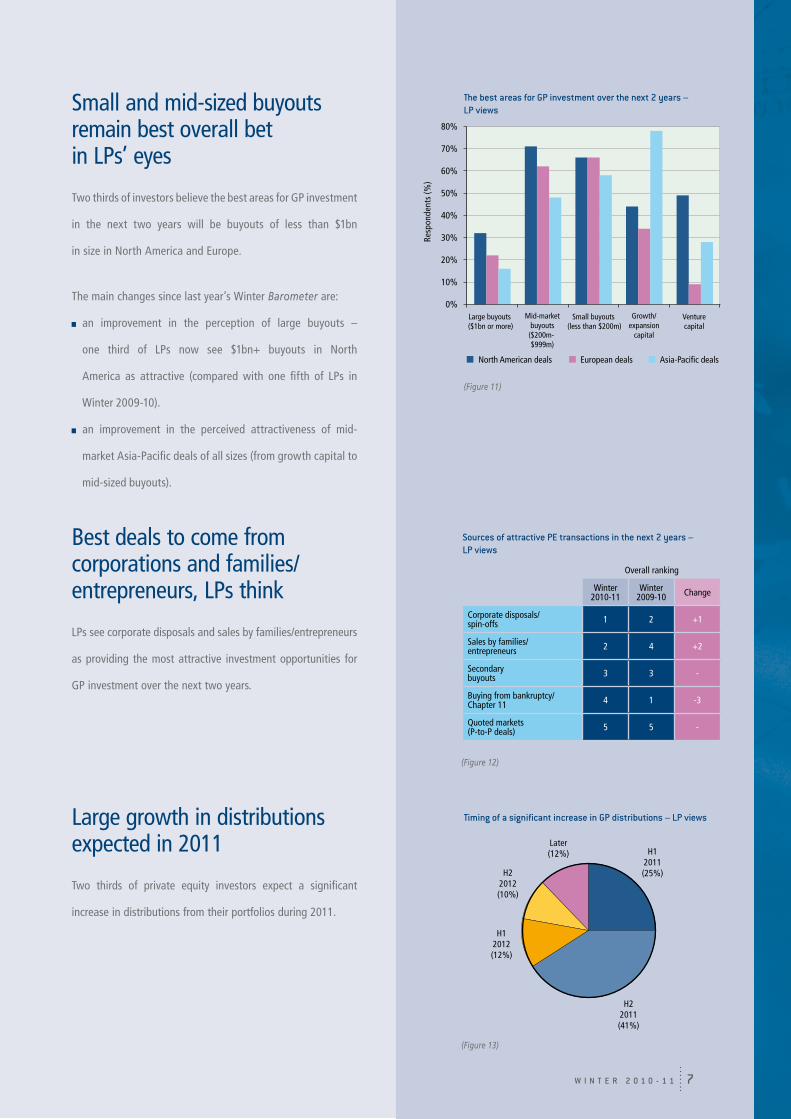
Small and mid-sized buyouts remain best overall bet in LPs’ eyes
Two thirds of investors believe the best areas for GP investment
in the next two years will be buyouts of less than $1bn
in size in North America and Europe.
The main changes since last year’s Winter Barometer are:
an improvement in the perception of large buyouts –
one third of LPs now see $1bn+ buyouts in North
America as attractive (compared with one fifth of LPs in
Winter 2009-10).
an improvement in the perceived attractiveness of mid-
market Asia-Pacific deals of all sizes (from growth capital to
mid-sized buyouts).
Best deals to come from corporations and families/entrepreneurs, LPs think
LPs see corporate disposals and sales by families/entrepreneurs
as providing the most attractive investment opportunities for
GP investment over the next two years.
Large growth in distributions expected in 2011
Two thirds of private equity investors expect a significant
increase in distributions from their portfolios during 2011.
The best areas for GP investment over the next 2 years – LP views
(Figure 11)
(Figure 12)
Sources of attractive PE transactions in the next 2 years – LP views
Timing of a significant increase in GP distributions – LP views
Large buyouts ($1bn or more)
Small buyouts (less than $200m)
Venturecapital
North American deals European deals Asia-Pacific deals
0%
10%
20%
30%
40%
50%
60%
70%
80%
Mid-market buyouts
($200m-$999m)
Growth/expansion
capital
Resp
onde
nts
(%)
Overall ranking
Winter 2010-11
Winter 2009-10 Change
Corporate disposals/spin-offs 1 2 +1
Sales by families/entrepreneurs 2 4 +2
Secondary buyouts 3 3 -
Buying from bankruptcy/Chapter 11 4 1 -3
Quoted markets (P-to-P deals) 5 5 -
H12011(25%)
H22011(41%)
H12012(12%)
H22012(10%)
Later(12%)
(Figure 13)
W I N T E R 2 0 1 0 - 1 18
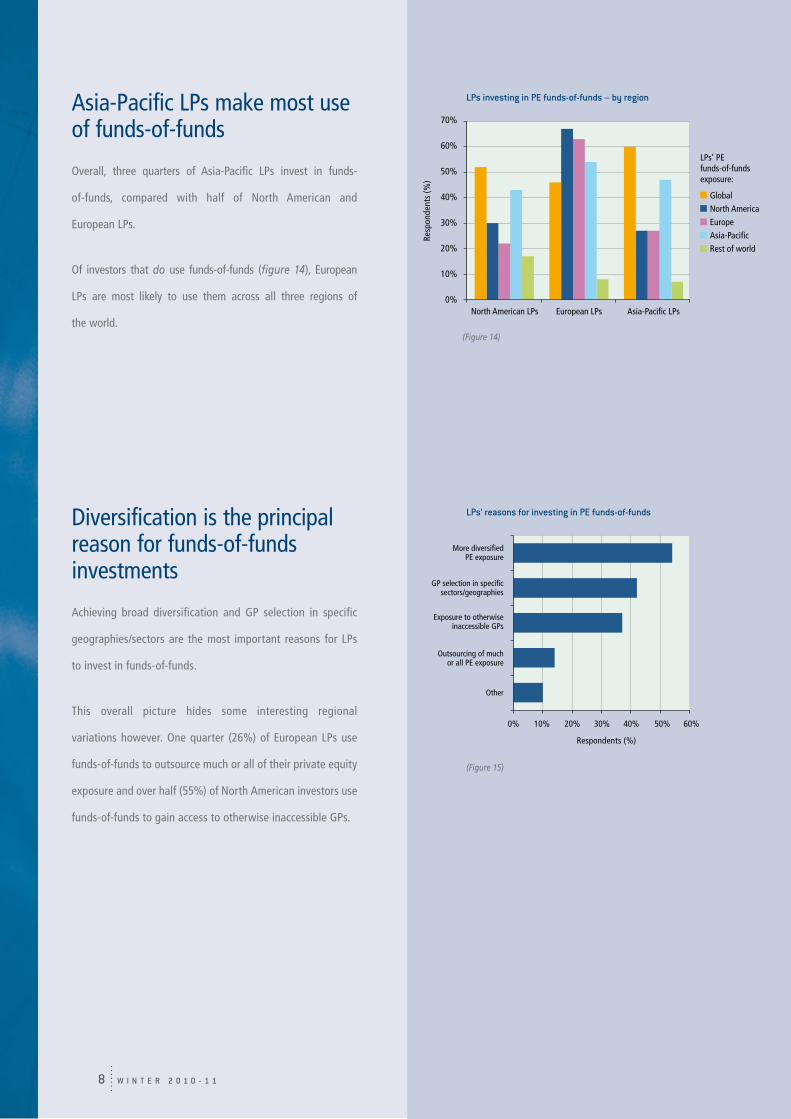
Asia-Pacific LPs make most use of funds-of-funds
Overall, three quarters of Asia-Pacific LPs invest in funds-
of-funds, compared with half of North American and
European LPs.
Of investors that do use funds-of-funds (figure 14), European
LPs are most likely to use them across all three regions of
the world.
Diversification is the principal reason for funds-of-funds investments
Achieving broad diversification and GP selection in specific
geographies/sectors are the most important reasons for LPs
to invest in funds-of-funds.
This overall picture hides some interesting regional
variations however. One quarter (26%) of European LPs use
funds-of-funds to outsource much or all of their private equity
exposure and over half (55%) of North American investors use
funds-of-funds to gain access to otherwise inaccessible GPs.
(Figure 14)
LPs investing in PE funds-of-funds – by region
LPs’ reasons for investing in PE funds-of-funds
(Figure 15)
North American LPs European LPs Asia-Pacific LPs
Global North America Europe Asia-Pacific Rest of world
0%
10%
20%
30%
40%
50%
60%
70%
LPs’ PEfunds-of-fundsexposure:
Resp
onde
nts
(%)
0% 10% 20% 30% 40% 50% 60%
More diversifiedPE exposure
GP selection in specificsectors/geographies
Exposure to otherwise inaccessible GPs
Outsourcing of muchor all PE exposure
Other
Respondents (%)

W I N T E R 2 0 1 0 - 1 1 9
Timing of the next significant downturn in the PE market – LP views
(Figure 18)
Existing funds-of-funds investors plan net reduction in exposure
43% of North American, 35% of European and 27% of
Asia-Pacific funds-of-funds investors plan to reduce or end
their exposure to funds-of-funds within the next three years –
compared with only 13% of existing investors in each region
who plan to increase their exposure.
Cost is a major factor for investors planning reduced exposure to funds-of-funds
Half of investors reducing their funds-of-funds exposure
cite high costs as a reason. One third (36%) of investors cite
disappointing returns.
Three quarters of LPs expect another downturn within seven years
Three quarters (76%) of LPs expect another significant
downturn in the private equity market within seven years.
42% of LPs expect the next downturn within five years.
Funds-of-funds investors’ planned changes to their exposure over the next 3 years
(Figure 16)
(Figure 17)
LPs’ reasons for reducing their exposure to PE funds-of-funds
-50% -40% -30% -20% -10% 0% 10% 20%
Increase exposureDecrease or end exposure
Asia-PacificLPs
North AmericanLPs
EuropeanLPs
Respondents (%)
0% 10% 20% 30% 40% 50% 60%
Developing ability to select/monitor GPs directly
Costs are too high
Returns have been disappointing
Reducing exposure to PE
Funds-of-funds won't achieve our target returns
Respondents (%)
Within5 years(42%)
Within7 years(34%)
Within 10years(20%)
In 10+years(4%)

W I N T E R 2 0 1 0 - 1 110
Few VC firms will deliver consistently strong returns over next decade, LPs think
Two thirds (64%) of LPs believe that only a small number of
VC firms worldwide will generate consistently strong returns
over the next decade.
One fifth (22%) of LPs believe that no venture capital firms will
be able to deliver consistently strong returns.
Only North American investors positive on VC environment
Around half of investors believe the environment for venture
capital in their own region is changing significantly.
Of these LPs, North American investors are on balance
positive, and European and Asia-Pacific investors negative
(figure 20).
Majority of European and Asia-Pacific investors see early-stage VC funding shortfall in their region
57% of European LPs and 63% of Asia-Pacific LPs perceive
such a shortfall. North American LPs are more optimistic,
with just 37% seeing a shortfall in their region.
LPs’ views of the environment for VC investment in their own regions
Ability of VC firms to generate consistently strong returns over the next decade – LP views
0% 10% 20% 30% 40% 50% 60% 70%
No VC firmswill do so
North AmericanGPs will do so
Asia-PacificGPs will do so
A small numberof GPs worldwide
will do so
EuropeanGPs will do so
Respondents (%)
Asia-Pacific LPs
North American LPs
European LPs
VC climate deteriorating VC climate improving
-40% -30% -20% -10% 0% 10% 20% 30% 40%
Respondents (%)
Asia-Pacific LPsNorth American LPs European LPs
Resp
onde
nts
(%)
0%
10%
20%
30%
40%
50%
60%
70%
(Figure 19)
(Figure 20)
(Figure 21)
LPs who perceive an early-stage VC funding shortfall in their region
W I N T E R 2 0 1 0 - 1 1 11
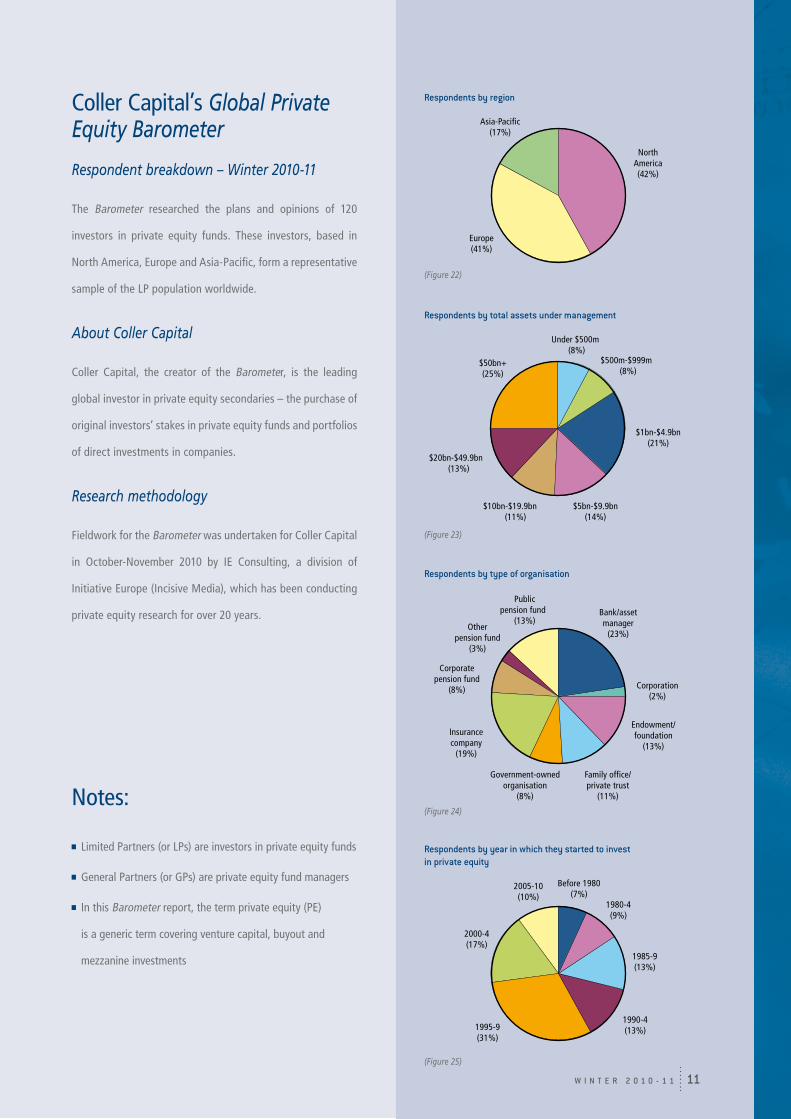
Coller Capital’s Global Private Equity Barometer
Respondent breakdown – Winter 2010-11
The Barometer researched the plans and opinions of 120
investors in private equity funds. These investors, based in
North America, Europe and Asia-Pacific, form a representative
sample of the LP population worldwide.
About Coller Capital
Coller Capital, the creator of the Barometer, is the leading
global investor in private equity secondaries – the purchase of
original investors’ stakes in private equity funds and portfolios
of direct investments in companies.
Research methodology
Fieldwork for the Barometer was undertaken for Coller Capital
in October-November 2010 by IE Consulting, a division of
Initiative Europe (Incisive Media), which has been conducting
private equity research for over 20 years.
Notes:
Limited Partners (or LPs) are investors in private equity funds
General Partners (or GPs) are private equity fund managers
In this Barometer report, the term private equity (PE)
is a generic term covering venture capital, buyout and
mezzanine investments
Respondents by region
(Figure 22)
Respondents by year in which they started to invest in private equity
Asia-Pacific(17%)
NorthAmerica(42%)
Europe(41%)
$50bn+(25%)
Under $500m (8%)
$500m-$999m (8%)
$1bn-$4.9bn(21%)
$5bn-$9.9bn(14%)
$10bn-$19.9bn (11%)
$20bn-$49.9bn (13%)
Bank/assetmanager
(23%)
Corporation(2%)
Endowment/foundation
(13%)
Family office/private trust
(11%)
Government-owned organisation
(8%)
Insurancecompany
(19%)
Corporatepension fund
(8%)
Otherpension fund
(3%)
Publicpension fund
(13%)
Before 1980(7%)
1980-4(9%)
1985-9(13%)
1990-4(13%)1995-9
(31%)
2000-4(17%)
2005-10(10%)
Respondents by total assets under management
(Figure 23)
(Figure 25)
Respondents by type of organisation
(Figure 24)

www.collercapital.com


