12
Global Programme on Evidence for Health Policy Mapping Poverty: Predicting Income using the LandScan Database Workshop on Gridding Population Data CIESIN, New York 2-3 May 2000
| Date post: | 13-Dec-2015 |
| Category: |
Documents |
| Upload: | herbert-burns |
| View: | 213 times |
| Download: | 0 times |
Global Programme on Evidence for Health Policy
Mapping Poverty:Predicting Income using the
LandScan Database
Workshop on Gridding Population Data
CIESIN, New York
2-3 May 2000
Global Programme on Evidence for Health Policy
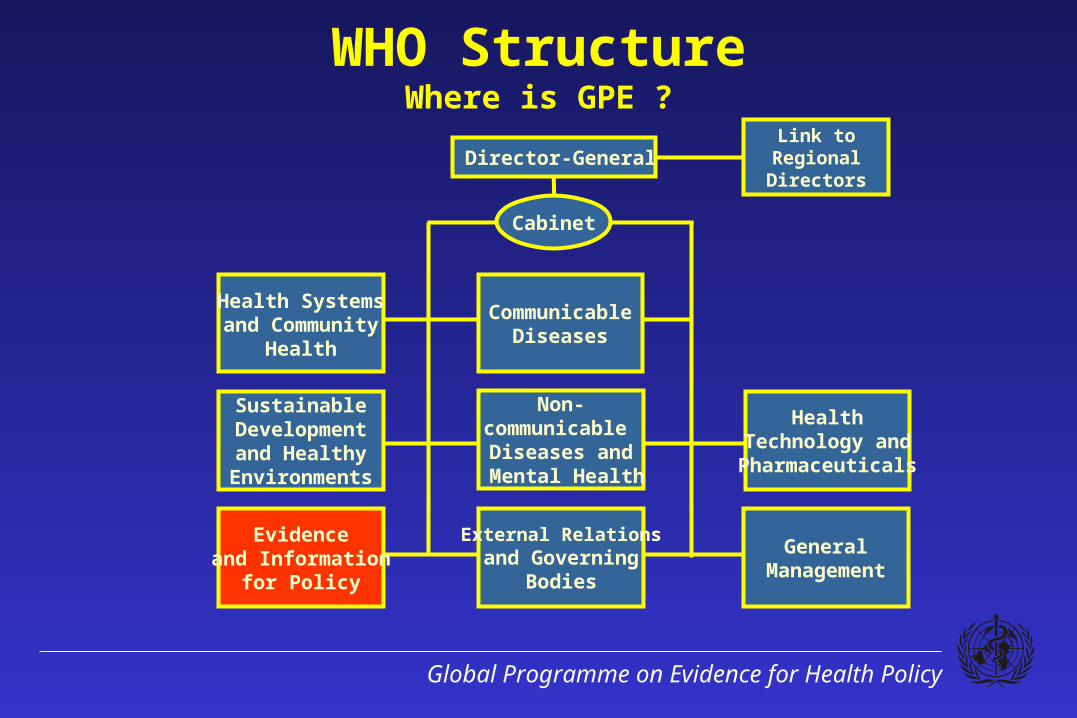
WHO StructureWhere is GPE ?
Health Systemsand Community
Health
CommunicableDiseases
SustainableDevelopmentand Healthy
Environments
HealthTechnology andPharmaceuticals
Non-communicable Diseases and
Mental Health
Evidenceand Information
for Policy
External Relationsand Governing
Bodies
GeneralManagement
Cabinet
Director-GeneralLink to
Regional Directors
Global Programme on Evidence for Health Policy
Mission of GPE
Strengthen the scientific and ethical foundations for evidence-based
policy formulation
Global Programme on Evidence for Health Policy
• Thematic mapping
GIS in GPEObjectives
• Risk mapping
Global Programme on Evidence for Health Policy
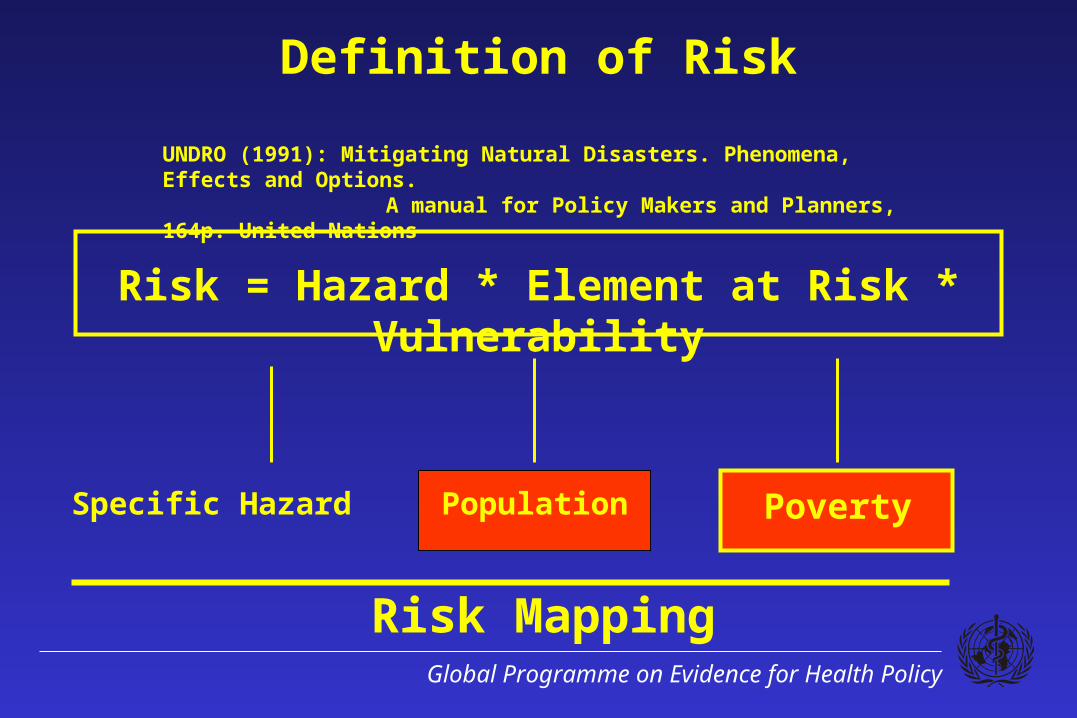
Definition of Risk
UNDRO (1991): Mitigating Natural Disasters. Phenomena, Effects and Options. A manual for Policy Makers and Planners, 164p. United Nations
Risk = Hazard * Element at Risk * Vulnerability
Specific Hazard Population Poverty
Risk Mapping
Global Programme on Evidence for Health Policy
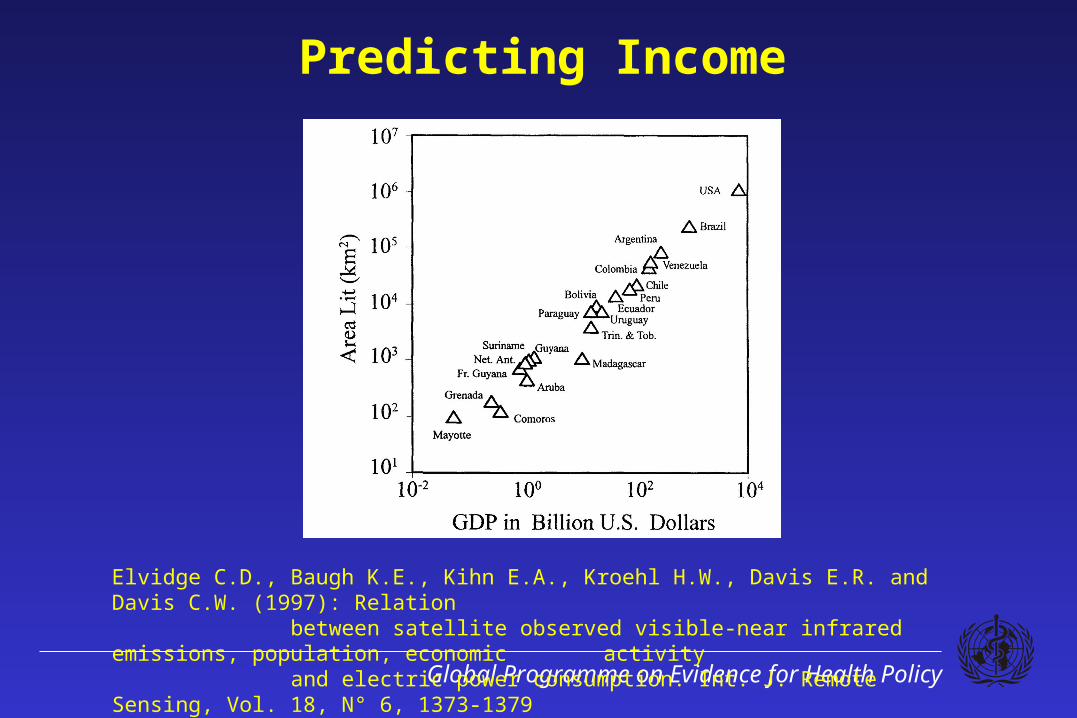
Predicting Income
Elvidge C.D., Baugh K.E., Kihn E.A., Kroehl H.W., Davis E.R. and Davis C.W. (1997): Relation between satellite observed visible-near infrared emissions, population, economic activity and electric power consumption. Int. J. Remote Sensing, Vol. 18, N° 6, 1373-1379
Global Programme on Evidence for Health Policy
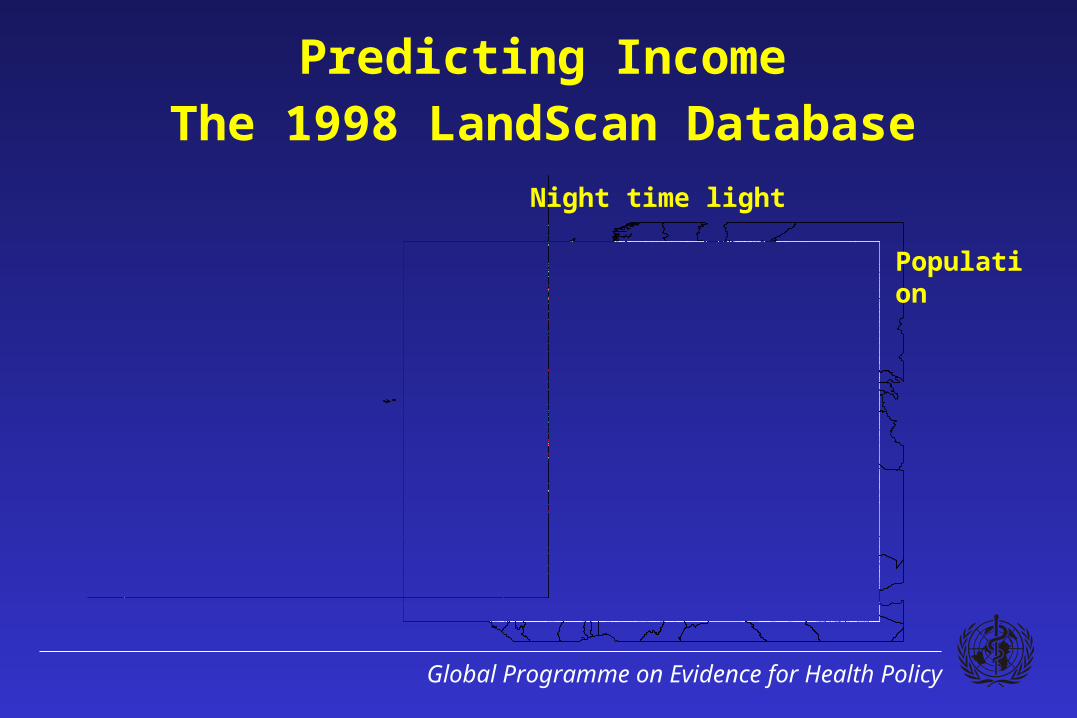
Night time light
Population
Predicting Income
The 1998 LandScan Database
Global Programme on Evidence for Health Policy
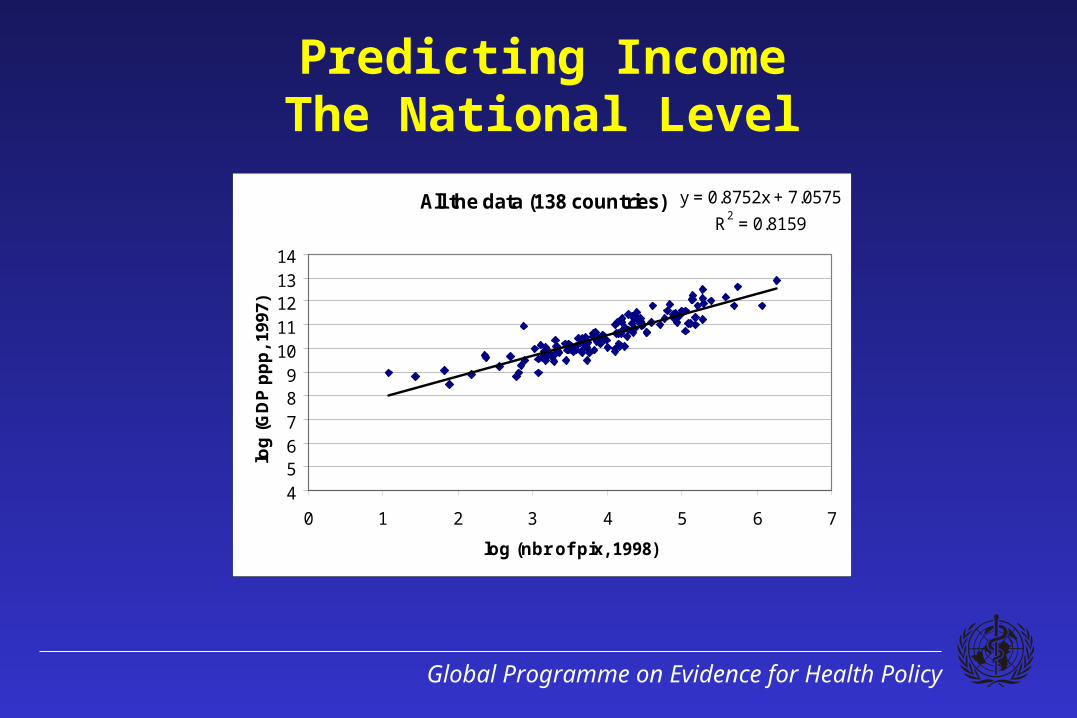
Predicting IncomeThe National Level
All the data (138 countries) y = 0.8752x + 7.0575
R2 = 0.8159
456789
1011121314
0 1 2 3 4 5 6 7
log (nbr of pix, 1998)
log
(G
DP
pp
p, 1
997)
Global Programme on Evidence for Health Policy
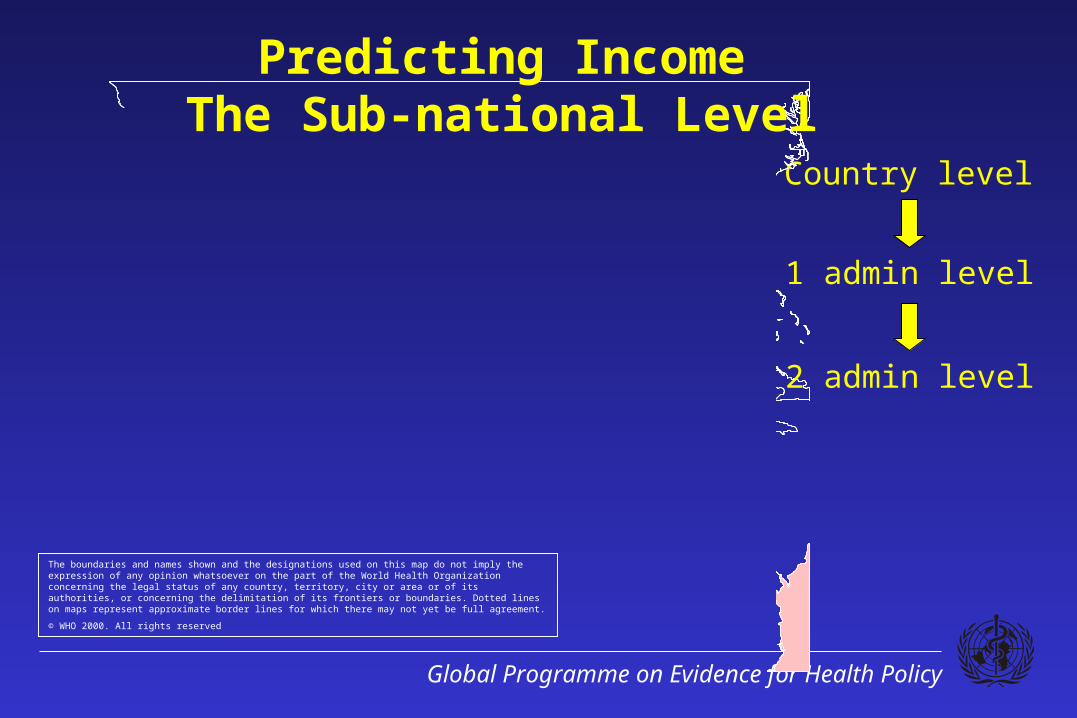
Country level
1 admin level
2 admin level
Predicting IncomeThe Sub-national Level
The boundaries and names shown and the designations used on this map do not imply the expression of any opinion whatsoever on the part of the World Health Organization concerning the legal status of any country, territory, city or area or of its authorities, or concerning the delimitation of its frontiers or boundaries. Dotted lines on maps represent approximate border lines for which there may not yet be full agreement.
© WHO 2000. All rights reserved
Global Programme on Evidence for Health Policy
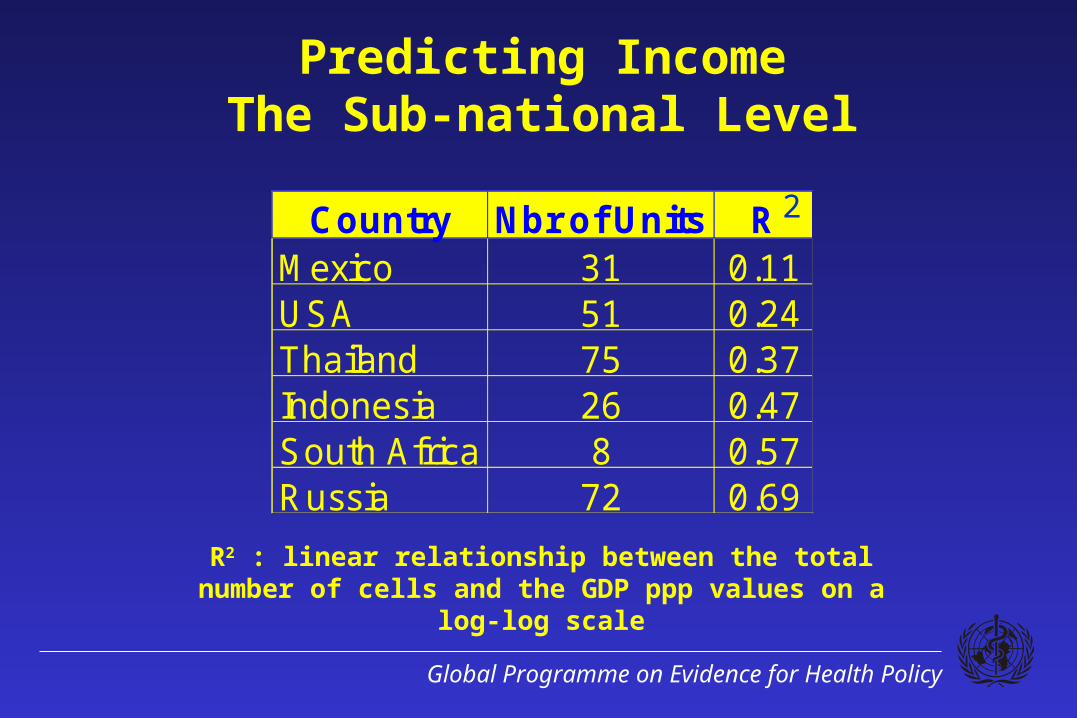
Predicting IncomeThe Sub-national Level
Country Nbr of Units RMexico 31 0.11USA 51 0.24Thailand 75 0.37Indonesia 26 0.47South Africa 8 0.57Russia 72 0.69
2
R2 : linear relationship between the total number of cells and the GDP ppp values on a log-log scale
Global Programme on Evidence for Health Policy
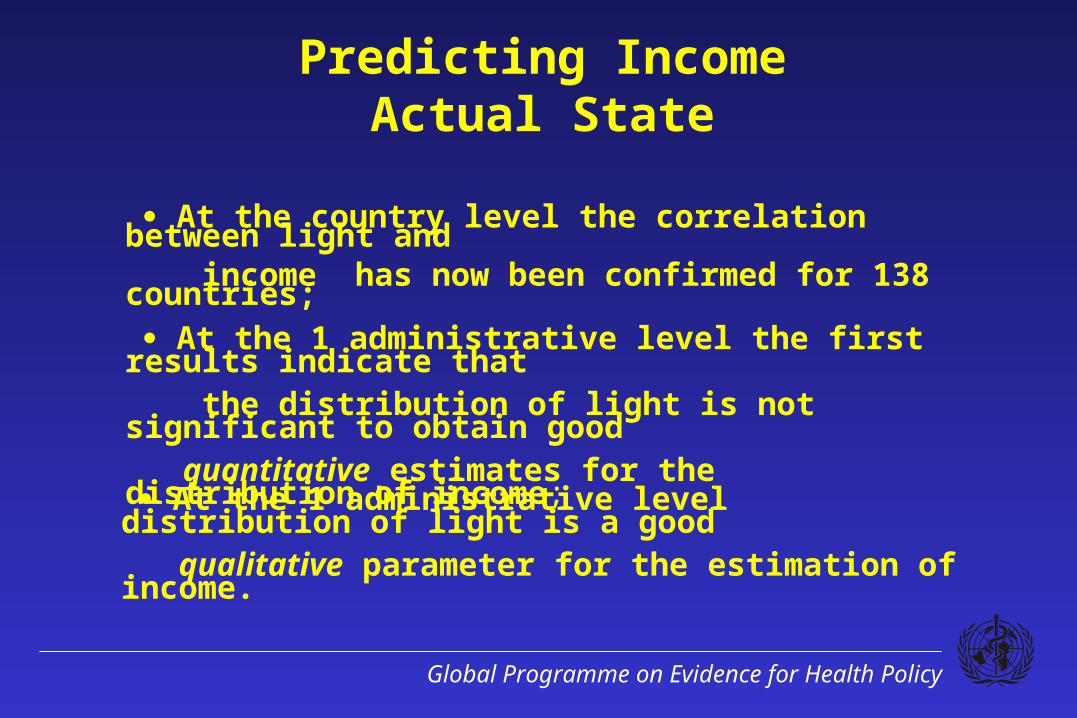
Predicting IncomeActual State
At the country level the correlation between light and income has now been confirmed for 138 countries;
At the 1 administrative level the first results indicate that the distribution of light is not significant to obtain good quantitative estimates for the distribution of income;
At the 1 administrative level distribution of light is a good qualitative parameter for the estimation of income.
Global Programme on Evidence for Health Policy
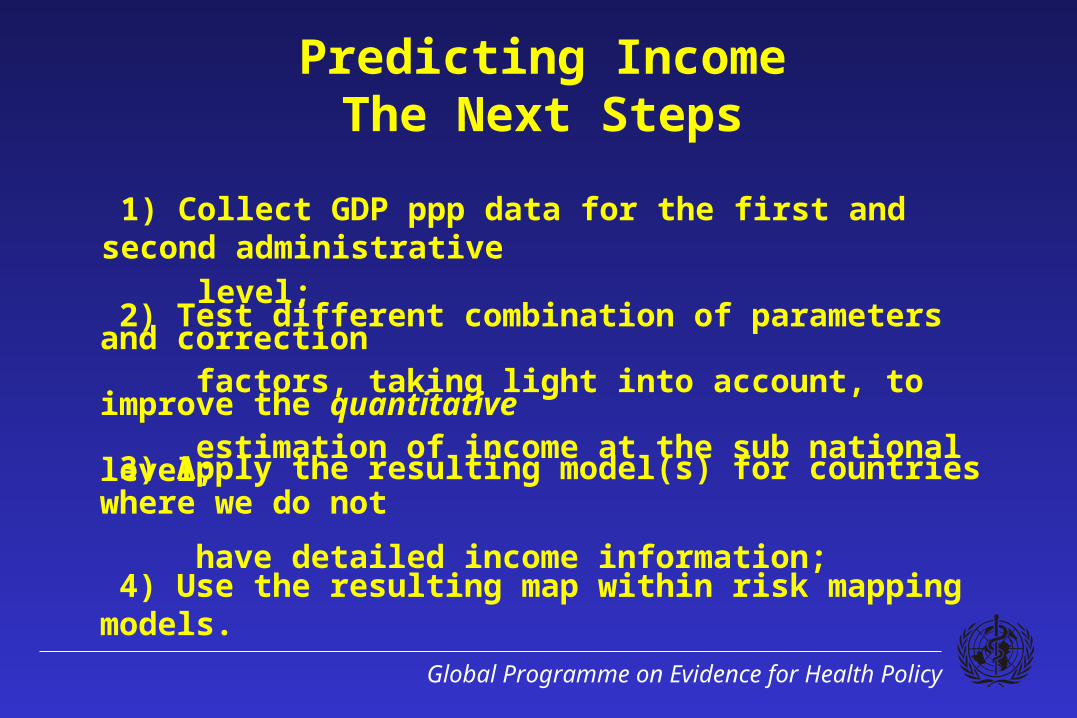
Predicting IncomeThe Next Steps
1) Collect GDP ppp data for the first and second administrative
level;
2) Test different combination of parameters and correction factors, taking light into account, to improve the quantitative estimation of income at the sub national level;
3) Apply the resulting model(s) for countries where we do not
have detailed income information;
4) Use the resulting map within risk mapping models.


