26
Global Reporting Initiative The GRI Reporting Framework June 3, 2008 - BI Centre for Corporate Responsibility
| Date post: | 21-Dec-2015 |
| Category: |
Documents |
| View: | 214 times |
| Download: | 0 times |

Global Reporting InitiativeThe GRI Reporting Framework
June 3, 2008 - BI Centre for Corporate Responsibility
June 3, 2008
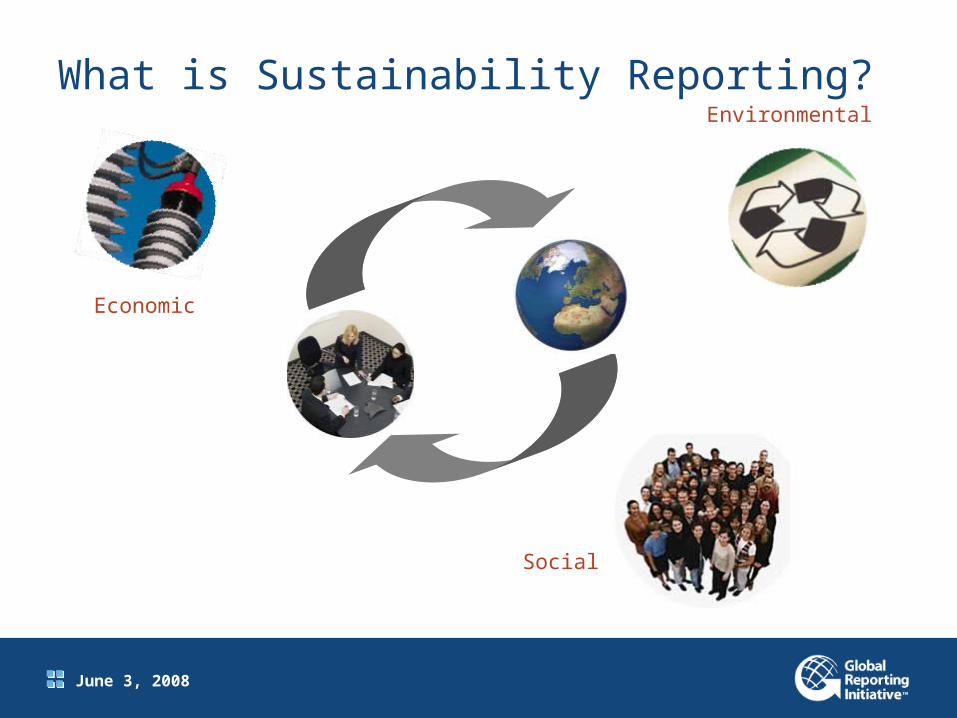
What is Sustainability Reporting?
Economic
Environmental
Social
June 3, 2008
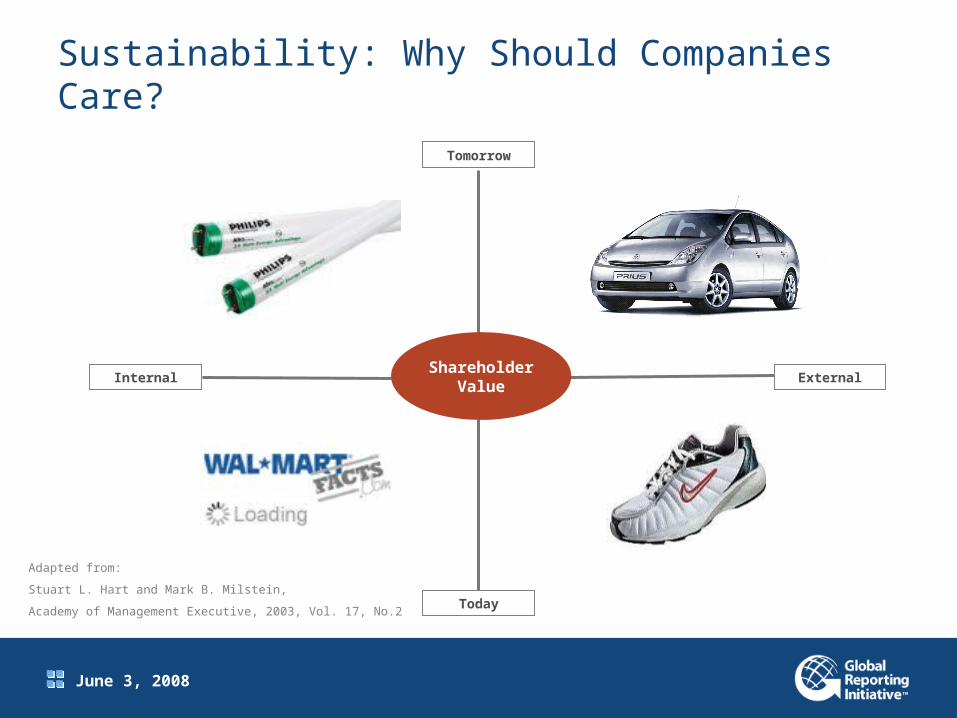
Sustainability: Why Should Companies Care?
Adapted from:
Stuart L. Hart and Mark B. Milstein,
Academy of Management Executive, 2003, Vol. 17, No.2
Tomorrow
Today
Internal ExternalShareholde
r Value
June 3, 2008
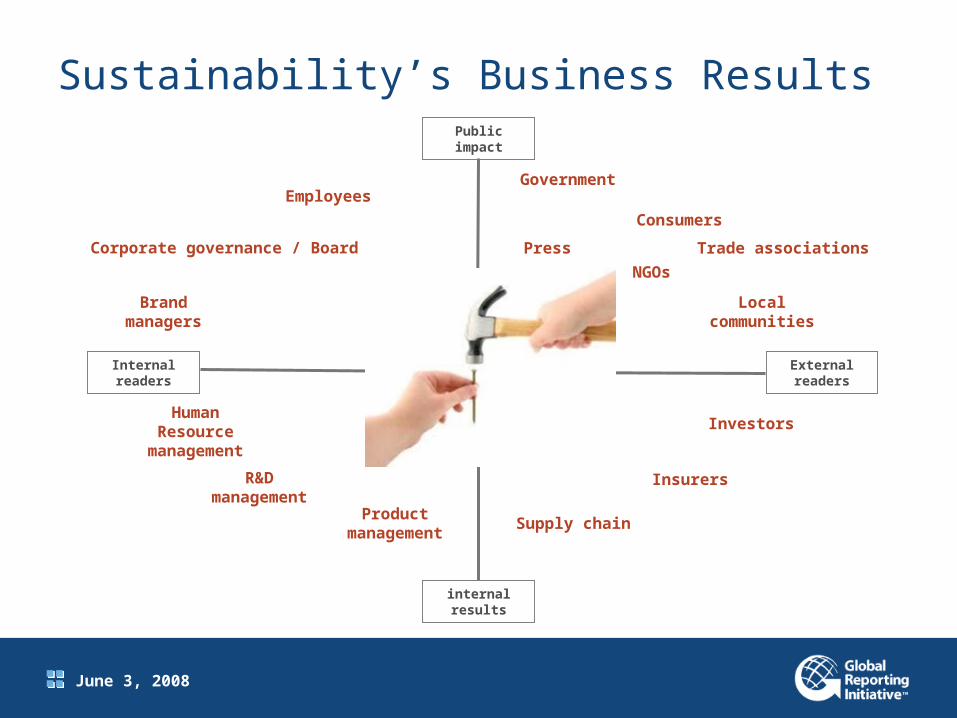
Sustainability’s Business Results
Press
Public impact
internal results
Internal readers
External readers
Investors
Corporate governance / Board
Government
Trade associations
Employees
Insurers
Supply chain
NGOs
Consumers
Human Resource
management
R&D management
Product management
Brand managers
Local communities
About GRI

June 3, 2008
GRI: Network Organization

June 3, 2008
Evolving Guidelines
2003
2004
2005
2006
Structured
feedbackprocesson 2002
guidelines
Collaborative
workinggroups
International
sneak peeks
G3 Guidelines
released
Futuredevelopme
nt

June 3, 2008
GRI: Trusted, Credible Framework

A Foundation for Good Reporting: the G3

June 3, 2008
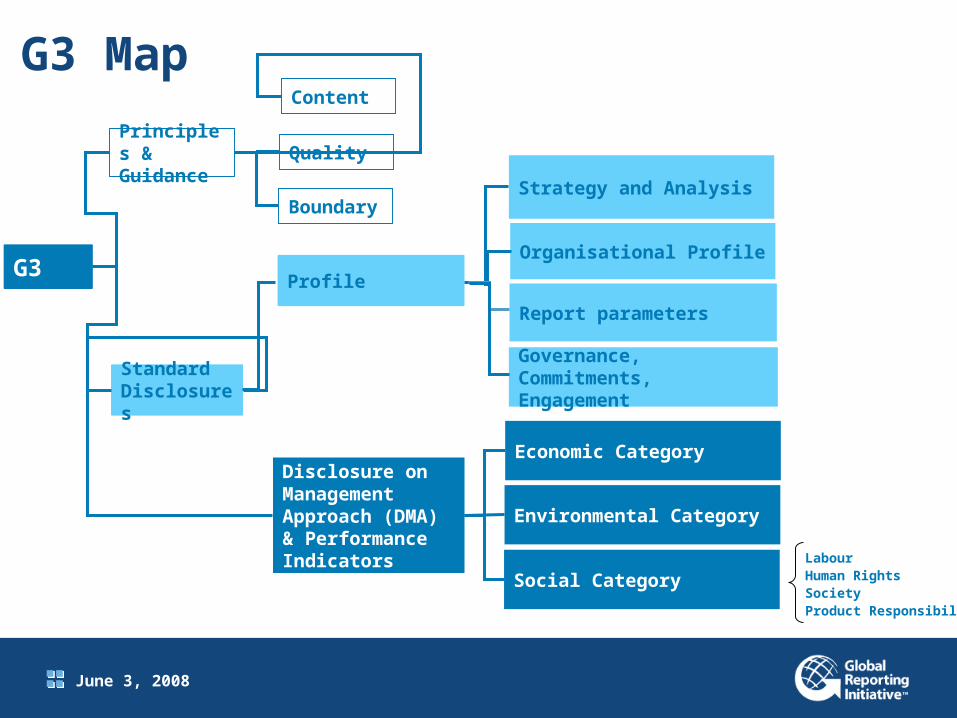
G3 Map
G3
Principles & Guidance
Standard Disclosures
Content
Quality
Boundary
Profile
Strategy and Analysis
Organisational Profile
Report parameters
Governance, Commitments, Engagement
Disclosure on Management Approach (DMA) & Performance Indicators
Economic Category
Environmental Category
Social CategoryLabourHuman RightsSocietyProduct Responsibility

June 3, 2008
Introduction to the Guidelines
INPUTContentQualityBoundary
Options for Reporting
Focused Sustainability Report
A B C
Pri
nci
ple
s and
Guid
ance
Sta
ndard
D
iscl
osu
res
June 3, 2008
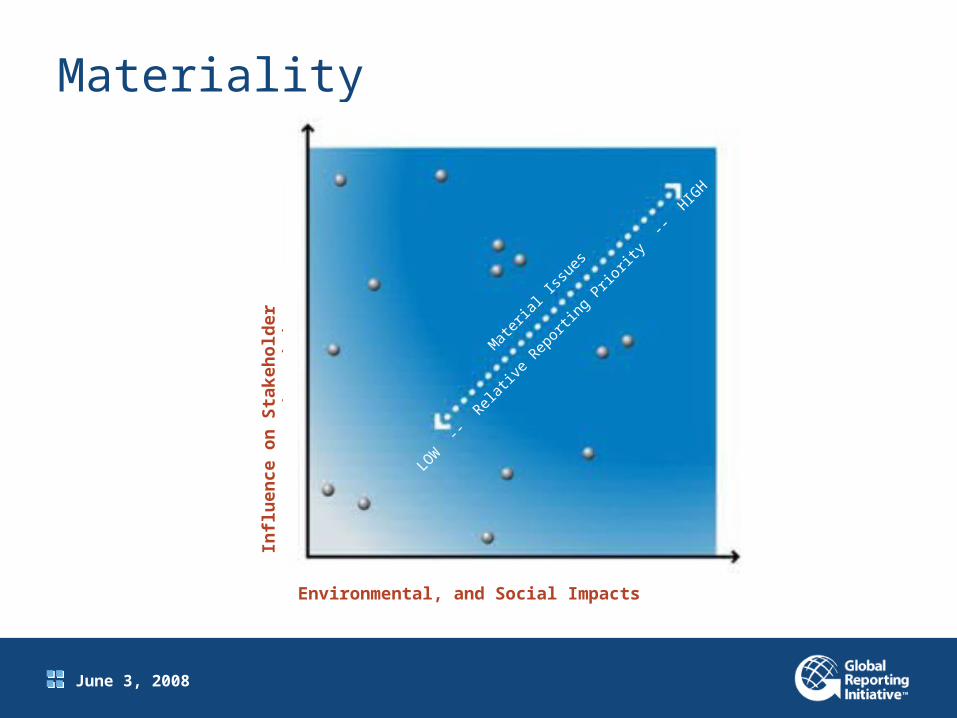
Materiality
Significance of Economic, Environmental, and Social Impacts
Infl
uen
ce o
n S
take
ho
lder
A
sses
smen
ts a
nd
Dec
isio
ns
Non-Material Issues
Mat
eria
l Iss
ues
LOW
--
Relat
ive
Repor
ting
Prio
rity
-- H
IGH

June 3, 2008
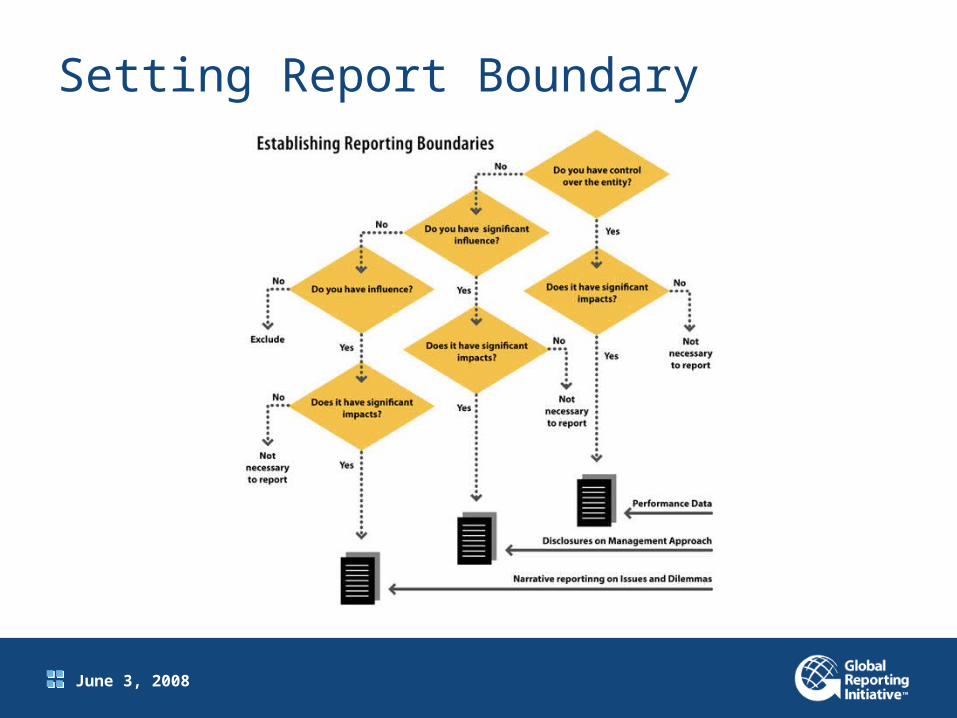
Setting Report Boundary
June 3, 2008
Setting Report Boundary
June 3, 2008
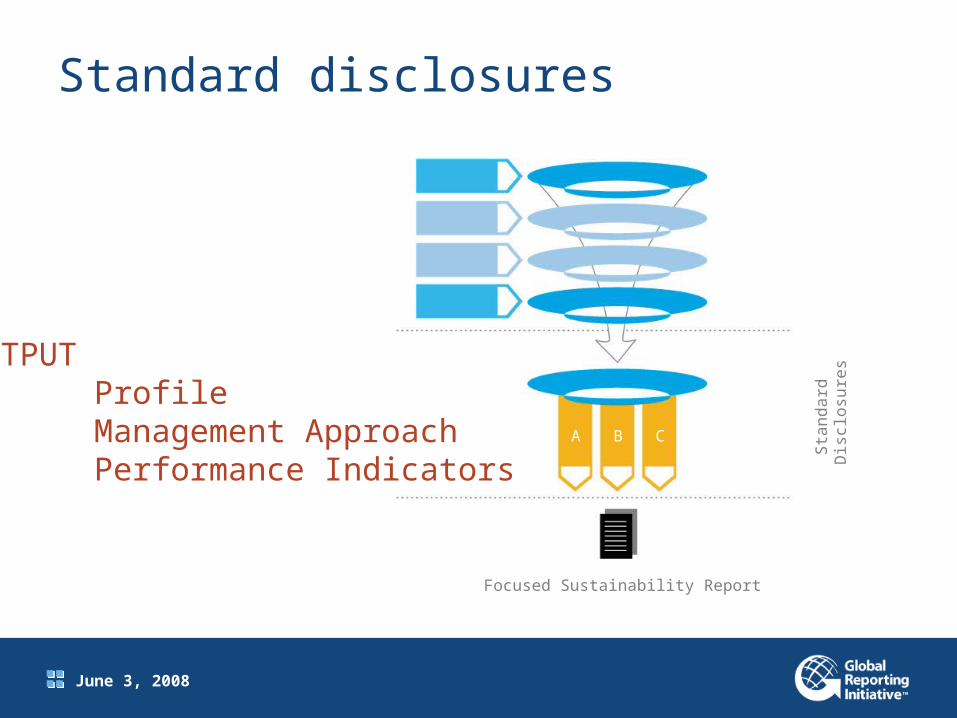
Standard disclosures
Focused Sustainability Report
A B C
Sta
ndard
D
iscl
osu
res
OUTPUTA.ProfileB.Management ApproachC.Performance Indicators

June 3, 2008
Strategy and AnalysisStrategy and AnalysisStrategy and AnalysisStrategy and Analysis
Profile Disclosures
CEO StatementCEO StatementCEO StatementCEO Statement
Description of key impacts, opportunities, risksDescription of key impacts, opportunities, risksDescription of key impacts, opportunities, risksDescription of key impacts, opportunities, risks
Strategy & Analysis
Organization ProfileOrganization ProfileOrganization ProfileOrganization Profile Report ParametersReport ParametersReport ParametersReport Parameters
GovernanceGovernanceGovernanceGovernance

June 3, 2008
Disclosure on Management approach
June 3, 2008
Performance Indicators
June 3, 2008
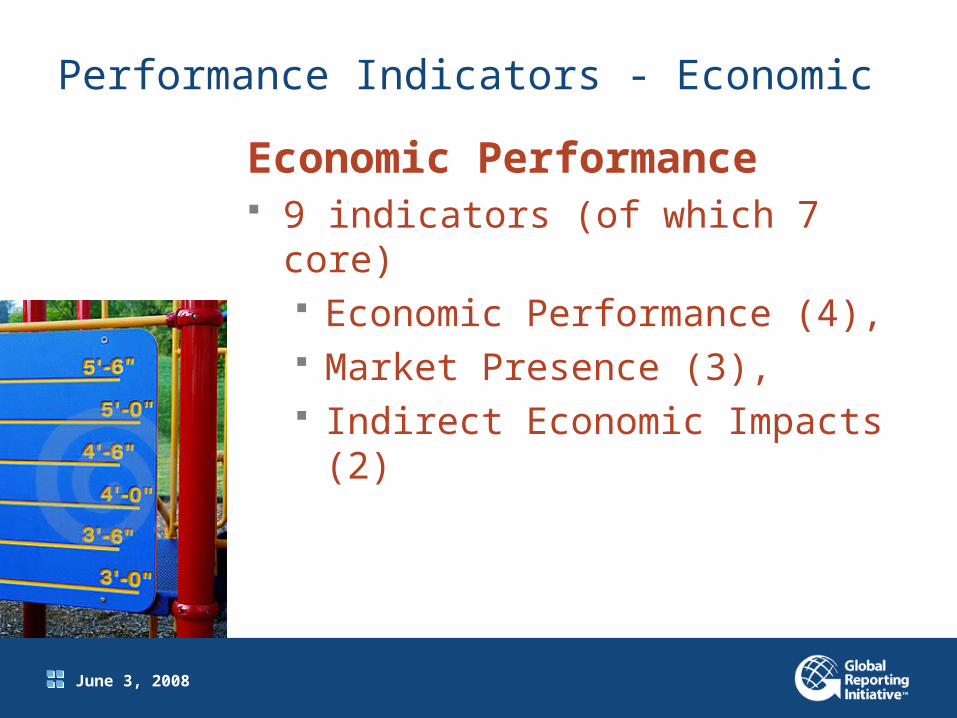
Performance Indicators - Economic
Economic Performance 9 indicators (of which 7 core)
Economic Performance (4), Market Presence (3), Indirect Economic Impacts (2)

June 3, 2008
Performance Indicators -Environmental
Environmental Performance 30 indicators (of which 15 core)
Materials (2), Energy (5), Water (3),
Biodiversity (5), Emissions, Effluents, and Waste
(10), Products and Services (2), (non-)Compliance (1), Transport (1), Overall (1)
June 3, 2008
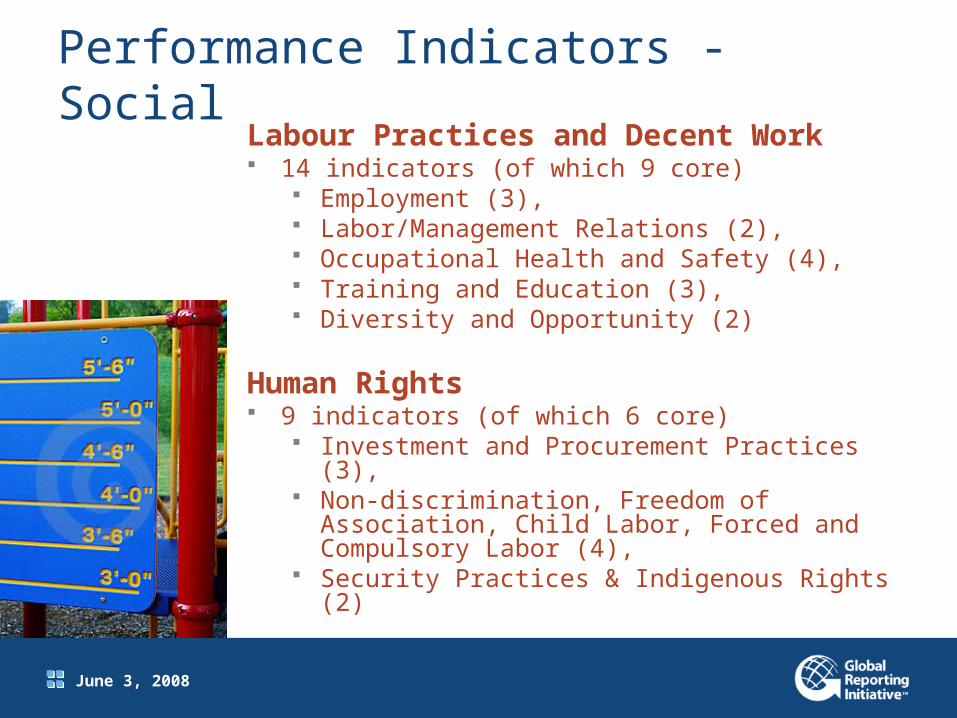
Performance Indicators - SocialLabour Practices and Decent Work 14 indicators (of which 9 core)
Employment (3), Labor/Management Relations (2), Occupational Health and Safety (4), Training and Education (3), Diversity and Opportunity (2)
Human Rights 9 indicators (of which 6 core)
Investment and Procurement Practices (3), Non-discrimination, Freedom of Association,
Child Labor, Forced and Compulsory Labor (4), Security Practices & Indigenous Rights (2)
June 3, 2008
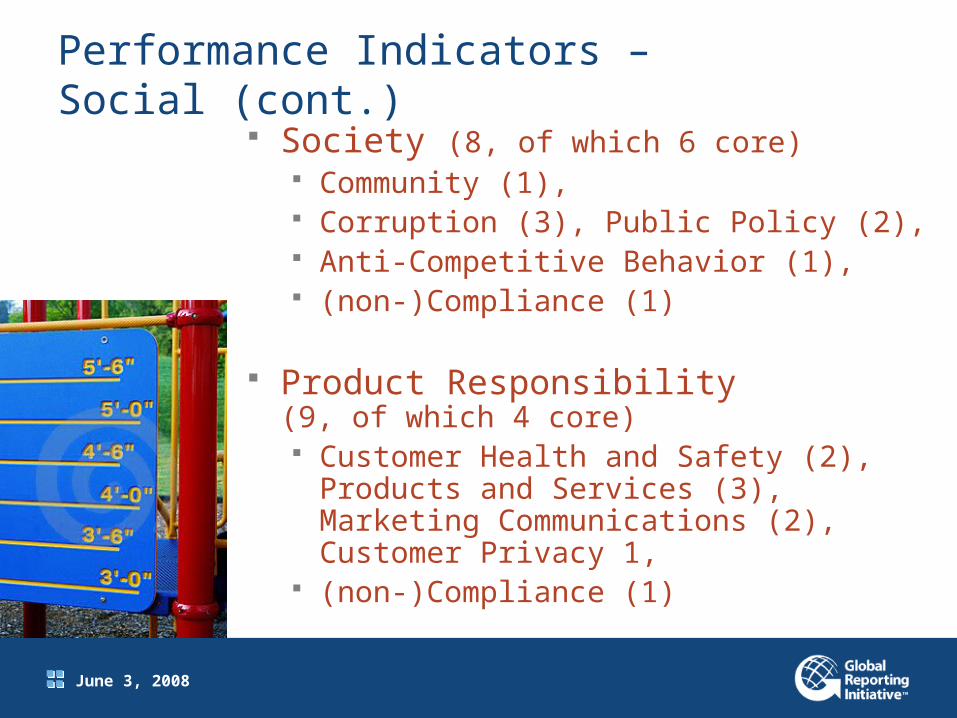
Performance Indicators – Social (cont.)
Society (8, of which 6 core) Community (1), Corruption (3), Public Policy (2), Anti-Competitive Behavior (1), (non-)Compliance (1)
Product Responsibility(9, of which 4 core) Customer Health and Safety (2), Products
and Services (3), Marketing Communications (2), Customer Privacy 1,
(non-)Compliance (1)
June 3, 2008
Indicator Protocols
June 3, 2008
G3 Map
G3
Principles & Guidance
Standard Disclosures
Content
Quality
Boundary
Profile
Strategy and Analysis
Organisational Profile
Report parameters
Governance, Commitments, Engagement
Disclosure on Management Approach (DMA) & Performance Indicators
Economic Category
Environmental Category
Social CategoryLabourHuman RightsSocietyProduct Responsibility
June 3, 2008
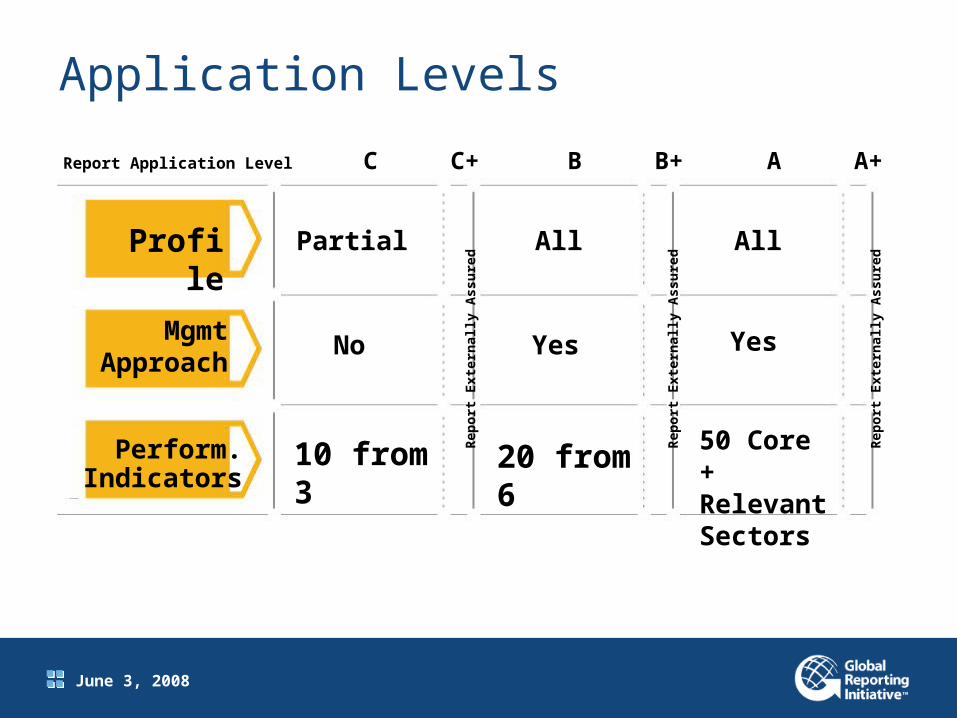
Application Levels
Profile
MgmtApproach
Perform.Indicators
Report Application Level C C+ B B+ A A+
Partial
No
10 from 3R
epo
rt E
xter
nal
ly A
ssu
red
Rep
ort
Ext
ern
ally
Ass
ure
d
Rep
ort
Ext
ern
ally
Ass
ure
d
All
Yes
20 from 6
All
Yes
50 Core + Relevant Sectors
June 3, 2008
You can take this further
Visit us online at www.globalreporting.org
Use the Guidelines. Let us know. Become an OS member Sign up to our newsletter


